
2
STUDY ON LOCAL ACTIONS IN ASIA CONTRIBUTING TO CLIMATE
CHANGE MITIGATION AND ALTERNATIVE FINANCIAL MECHANISM
COUNTRY : INDONESIA
Authors:
Dr. Rizaldi Boer
Dr. Retno G. Dewi
Yuyun Y. Ismawati
Syahrina D. Anggraini
Contributors:
Yudhi Ardiansyah
Essy Admawaty
Irmaida
Ari Suharto
Bogor, December 2008
3
EXECUTIVE SUMMARY
Energy policy measures are mainly directed to the improvement of energy sector. They
are not intended to the reduction of GHG emissions or climate change mitigation. The
resulted reduction of GHG emissions or climate change mitigation that could be
achieved from those policies measures are the by-product instead of the objective.
However, prior to and after the COP 13 in Bali, Government of Indonesia has now put
serious attention how to integrate climate change issues into national development
programs. Local governments are encouraged to utilize financial mechanisms under
Kyoto and Non-Kyoto. Government of Indonesia also plans to create Climate Change
(Local) Trust Fund to support local governments to implement climate change
programs.
CO2 is dominant GHG being emitted from energy sector. In 1990, rate of CO2 emission
from this sector was about 114 million ton (Mt) and in 2004 it increased to 288 Mt. The
annual growth rate of CO2 emission is about 7%. The highest growth rate was observed
in electricity generation sector, i.e. 9% per annum. The share of liquid fuels to the
emissions is the largest compare to other fuels and the transportation sector is the major
contributor. Therefore, the mitigation efforts are focussed in this sector.
To reduce the dependency on oil products, Government of Indonesia has issued
Presidential Regulation 5/2005 on the changes of energy mix policies (energy
diversification) and other policies related to energy conservation. Implementation of
these changing policies will result in emission reduction of about 17% from the BAU
(CO2 emission in 2025 under BAU will be 1200 million ton CO2e).
Waste sector is also one of the sources of GHG emission in Indonesia. Methane
emissions from this sector was predicted about 400 million m3 methane per year
(Morton, 2005). Emission of GHGs from industrial waste water may also be significant.
However, due to limited data availability, the emission from this source can not be
estimated.
In responding to climate change, after COP13 Government of Indonesia has launched a
Yellow Book called National Development Planning: Indonesia Responses to Climate
Change (Bappenas, 2008). The document was an initial input to prepare Medium Term
National Development Planning (RPJM) 2010 – 2014. It has been identified about 54
climate change projects (26 adaptation, 18 mitigation and 8 integrated adaptation and
mitigation projects) that will be implemented in the next five years. These programs
required about 897 million USD.
In term of implementation of mitigation projects, Indonesia has a number of
experiences. As per 19 December 2008, Indonesian DNA has approved 70 CDM
projects. Of 70 projects, there are 17 projects have been registered. In addition there are
also a number of non-CDM mitigation projects funded by public fund, grant, or CSR
(corporate social responsibility) fund. As there is no approval process required for
energy carbon voluntary project, it is hard to track information on voluntary carbon
projects that has been or being developed. Other mitigation projects funded by public
funds but not defined as carbon project also exist. Most of the projects are in the area of
power generation or waste management such as Rural Electricity (Listrik Pedesaan)
Program and Energy Self-Sufficient Village (Desa Mandiri Energi) Program.

4
Most of CDM mitigation projects are implemented by big companies and funded by
profit-oriented fund, while the non-CDM ones are mostly funded by non-profit fund.
Some of these funds include government/public funds, technical assistance/grant from
foreign donors, soft loan as part of DNS program, and CSR fund. Government of
Indonesia also planned to develop Climate Change (Local) Trust Fund to support the
implementation of climate change program. The existence of these funds are very
important for encouraging communities and small companies to implement climate
change mitigation projects as the main barriers for these group is lack of investment.
In implementation of mitigation project at the community level, the role of NGOs is
very important not only as facilitator but also as implementer especially those who has
technical competency. It has been identified that there are about 18 NGOs are working
in the area of climate change mitigation project that focussing on energy and waste
sectors. Most of the NGOs are working in Java island while outside Java is very little.
To increase communities involvement in mitigating climate change, support from local
governments is very crucial not only as facilitator but also as finance providers. Local
Government in developing countries can create umbrella program for communities
througout the country to implement small scale mitigation project activities, such as
Programmatic CDM. Local government in developed countries may mobilize resources
from private companies or other public fundings in their countries to support the
implementation of community-based-mitigation projects in developing countries.

5
CONTENTS
Executive Summary .................................................................................................... 3
List of Figures .............................................................................................................. 7
List of Tables ................................................................................................................ 8
Abbreviations ............................................................................................................... 9
1. Introduction ......................................................................................................... 10
2. Energy and Waste Sector’s GHG Emission ...................................................... 11
3. National Policies for Reducing GHG Emissions ............................................... 13
3.1 Energy Sector .............................................................................................. 13
3.2 Waste Sector ................................................................................................ 18
3.3 National Development Planning: Indonesia Responses to
Climate Change .......................................................................................... 18
4. Implementation of Mitigation Projects in Indonesia ....................................... 19
4.1 CDM projects .............................................................................................. 19
4.2 Non-CDM project ....................................................................................... 21
a. Bali Biogas Program ............................................................................... 21
b. Mobuya Mini Hydro Power Plant .......................................................... 21
c. Gianyar Waste Recovery ....................................................................... 21
4.3. Other Project Activities ............................................................................. 21
5 Financial Mechanisms for the Mitigation Projects .......................................... 22
5.1. Cost for Mitigation Project ....................................................................... 22
5.2. Revenue for Mitigation Project ................................................................ 23
5.3 Funding for Mitigation project ................................................................ 23
a. Profit Oriented Fund ............................................................................... 23
i. Commercial Loan From banks and Other Financial Institution .... 23
ii. Carbon Trading Scheme ................................................................ 23
b. Non-profit Fund ...................................................................................... 23
i. Government/public Scheme .......................................................... 23
ii. Technical Assistence/grant from Foreign Donors ......................... 23
iii. Soft Loan ....................................................................................... 24
iv. Local Trust Fund ........................................................................... 24
6
v. CSR ................................................................................................ 24
c. Mixed for-profit and non-profit fund ........................................................ 24
5.4. Supporting scheme for mitigation-related activities ............................... 25
5. Barriers on Implementation of Mitigation Project ......................................... 26
5.4. Energy Sector ............................................................................................. 26
6.2 Waste Sector .............................................................................................. 27
7. Role of NGOs and Local Governments in Supporting
the Implementation of Mitigation Activities ..................................................... 28
7.1. NGOs ........................................................................................................ 28
7.2. Local Government in Developing Countries ......................................... 30
7.2.1. Energy Sector ............................................................................... 30
7.2.2. Waste Sector ................................................................................. 31
7.3. Local Government in Developed Countries .......................................... 32
APPENDICES
Appendix 1. Survey Implementation ....................................................................... 34
Appendix 2. General Form of Questionnare Used ................................................. 35
Appendix 3. List of Institution Contacted for Survey and
Questionnaires ...................................................................................... 42
Appendix 4. Summary of Projects Information Obtained from Survey
Activity ................................................................................................... 47
Appendix 5. List of Carbon Credit Program in Municipal
Waste Management Sector .................................................................. 59
Appendix 6. List of Indonesian DNA Approved CDM Project as per 19
December 2008 ..................................................................................... 61
Appendix 7. Examples of Renewable Energy Utilization
to Electrify Rural Area........................................................................ 68
Appendix 8. List of Mitigation-related Activities on UNDP Global
Environment Facility Small Grants Programme .............................. 70
Appendix 9. List of NGOs Working on Mitigation Issues ..................................... 71
REFFERENCES ................................................................................................... 72

7
LIST OF FIGURES
Figure 1. Financial mechanisms for the implementation of climate change
programs in Indonesia (Bappenas, 2008) ................................................... 11
Figure 2. Trend of CO2 emission from various activity in energy sector
(MEMR, 2007) ........................................................................................... 12
Figure 3. Trend of CO2 emissions (Mt) from various types of fuel
in energy sector .......................................................................................... 12
Figure 4. Final energy consumption by sector, 2007
(in MMBOE) .............................................................................................. 13
Figure 5. Energy Mix policy under BAU
and PERPRES 5/2005 (Source : PEN, 2007) ............................................ .14
Figure 6. Projection of primary energy consumption with and without energy
diversification and conservation (Blueprint PEN, 2007)........................... 16
Figure 7. The projection of GHG emissions by type of Fuel ..................................... 17
Figure 8. CO2 emission reduction resulted from implementing energy
diversification and conservation policies (MoE, 2007) ............................. 17
Figure 9. Number of climate change adaptation and mitigation projects
prioritized in the Yellow Book of Bappenas (2008).................................. 19
Figure 10. Distribution of DNA approved CDM projects by its Sectoral Scope ........ 20
Figure 11. Distribution of DNA approved CDM projects by its size ......................... 20
Figure 12. Number of NGOs working in the area of climate change mitigation
activities on energy and waste sector ........................................................ 29
Figure 13. Biodigester used in the Bali Biogas Program ........................................... 48
Figure 14. One of illegal dumpsite in Gianyar ............................................................ 55
Figure 15. New composting facility designed for capacity to
handle waste about 100 ton/day ............................................................. 55
Figure 16. Composting process using forced aeration technique ................................ 55

8
LIST OF TABLES
Table 1. Indonesia Renewable Energy Potency ......................................................... 22
Table 2. Examples of Donor Supported Programs in Improving Local Capacity ...... 25
Table 3. Company/institution Information ................................................................. 35
Table 4. CDM Project Questionnare .......................................................................... 36
Table 5. Voluntary Project Questionnaire ................................................................. 38
Table 6. Non Market Project Questionnaire ............................................................... 40
Table 7. List of Institution Contacted for Survey and Questionnaires ....................... 42
Table 8. Costs and funding in developing PLTMH Garung unit ............................... 57
Table 9. List of Carbon Credit Program in Municipal Waste Management Sector ... 59
Table 10.List of Indonesian DNA Approved CDM Project
as per 19 December 2008 ............................................................................ 61
Table 11. Examples of Renewable Energy Utilization to Electrify Rural Area .......... 68
Table 12. List of Mitigation-related Activities on UNDP Global Environment
Facility Small Grants Programme .............................................................. 70
Table 13. Examples of NGOs Working on Mitigation Issues .................................... 71
9
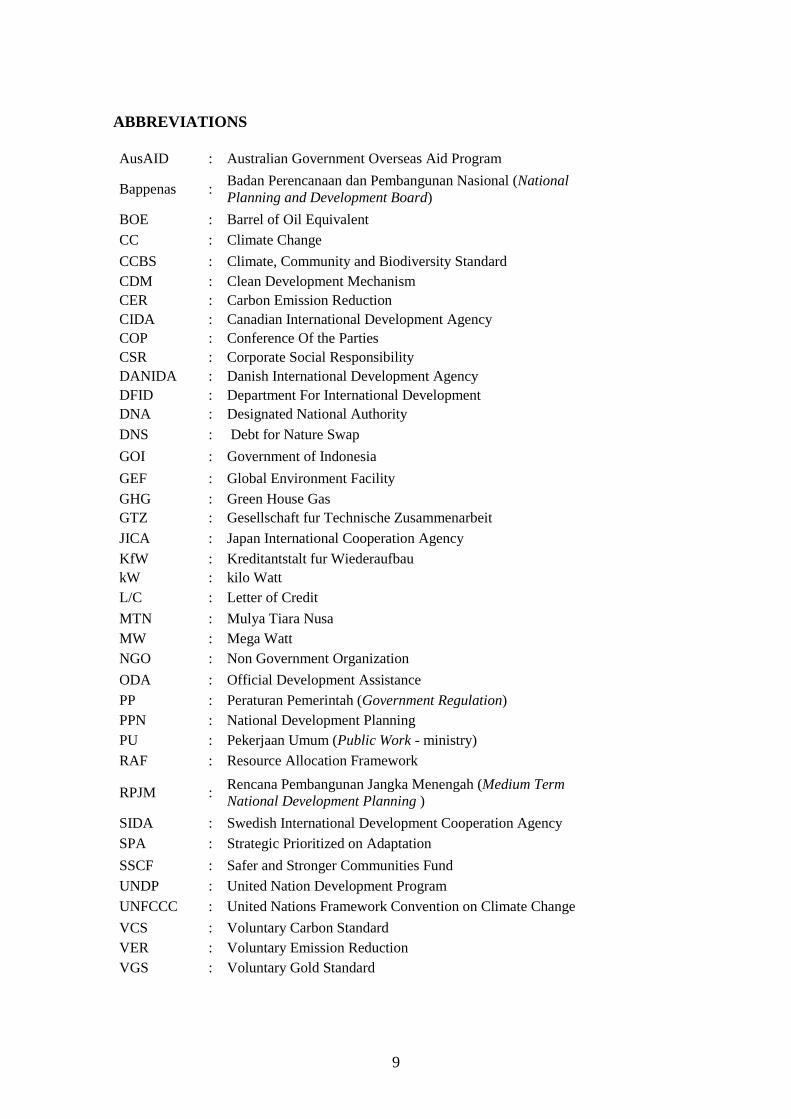
ABBREVIATIONS
AusAID : Australian Government Overseas Aid Program
Bappenas : Badan Perencanaan dan Pembangunan Nasional (National
Planning and Development Board)
BOE : Barrel of Oil Equivalent
CC : Climate Change
CCBS : Climate, Community and Biodiversity Standard
CDM : Clean Development Mechanism
CER : Carbon Emission Reduction
CIDA : Canadian International Development Agency
COP : Conference Of the Parties
CSR : Corporate Social Responsibility
DANIDA : Danish International Development Agency
DFID : Department For International Development
DNA : Designated National Authority
DNS : Debt for Nature Swap
GOI : Government of Indonesia
GEF : Global Environment Facility
GHG : Green House Gas
GTZ : Gesellschaft fur Technische Zusammenarbeit
JICA : Japan International Cooperation Agency
KfW : Kreditantstalt fur Wiederaufbau
kW : kilo Watt
L/C : Letter of Credit
MTN : Mulya Tiara Nusa
MW : Mega Watt
NGO : Non Government Organization
ODA : Official Development Assistance
PP : Peraturan Pemerintah (Government Regulation)
PPN : National Development Planning
PU : Pekerjaan Umum (Public Work - ministry)
RAF : Resource Allocation Framework
RPJM : Rencana Pembangunan Jangka Menengah (Medium Term
National Development Planning )
SIDA : Swedish International Development Cooperation Agency
SPA : Strategic Prioritized on Adaptation
SSCF : Safer and Stronger Communities Fund
UNDP : United Nation Development Program
UNFCCC : United Nations Framework Convention on Climate Change
VCS : Voluntary Carbon Standard
VER : Voluntary Emission Reduction
VGS : Voluntary Gold Standard
10
1. Introduction
For combating global warming, all nations needs to work together to reduce their
greenhouse gases (GHGs) emission. There are three options that can be done to have
low carbon growth namely improving energy efficiency through technological and
behavioral changes, producing less-emission-technologies especially for new power
plants, and reducing carbon dioxide emission from non-energy sectors. However, not
all these measures are done by developing countries in effective ways due to a number
of constraints particularly financial and institutional constraints. In addition, the status
of non-Annex 1 countries also put the emission reduction efforts as second priority.
In Indonesia, the energy policy measures cited in the initial national communication,
such as (i) gradual subsidy removal, (ii) promotion the use and development of
renewable energy, (iii) encouragement of public adoption of energy efficiency, (iv) the
use of clean and efficient energy for industry and commercial sectors, and (v)
restructure the price for various energy sources, are all directed to the improvement of
energy sector and are not intended to the reduction of GHG emissions or climate change
mitigation. The resulted reduction of GHG emissions or climate change mitigation that
could be achieved from those policies measures are the by-product instead of the
objective.
However, prior to and after the COP 13 in Bali, Government of Indonesia has now put
serious attention how to set up climate change issues into national development
programs. Efforts to reduce the GHG emissions will be done through various initiatives.
Local governments are encouraged to utilize financial mechanisms under Kyoto and
Non-Kyoto. Indonesia government also plans to create Climate Change (Local) Trust
Fund to support local governments to implement climate change program such as
mitigation (Figure 1).
This report highlighted the barriers encountered to implement mitigation projects,
focusing on energy and waste sectors. The aspects being covered are focused to
financial and institutional issues. Financial issue includes alternative financial
mechanisms to promote mitigation projects including conditions that limit or promote
the mechanisms to work. Institutional issue includes roles of local governments both
developed and developing countries in supporting the implementation of mitigation
projects. Several case studies were used to illustrate how the two above issues are being
addressed.
The report is divided into six sections. Section 1 describes briefly GHG emission from
energy and waste sector. Section 2 presents Indonesia GHG emission in energy and
waste sector. Section 3 highlights national policy on climate change. Section 4 discusses
mitigation measures being implemented through CDM and other local initiatives.
Section 5 discusses barriers and financial mechanisms for the implementation of the
mitigation activities. Section 6 discusses role of local governments and NGOs in
supporting the implementation of mitigation.
11
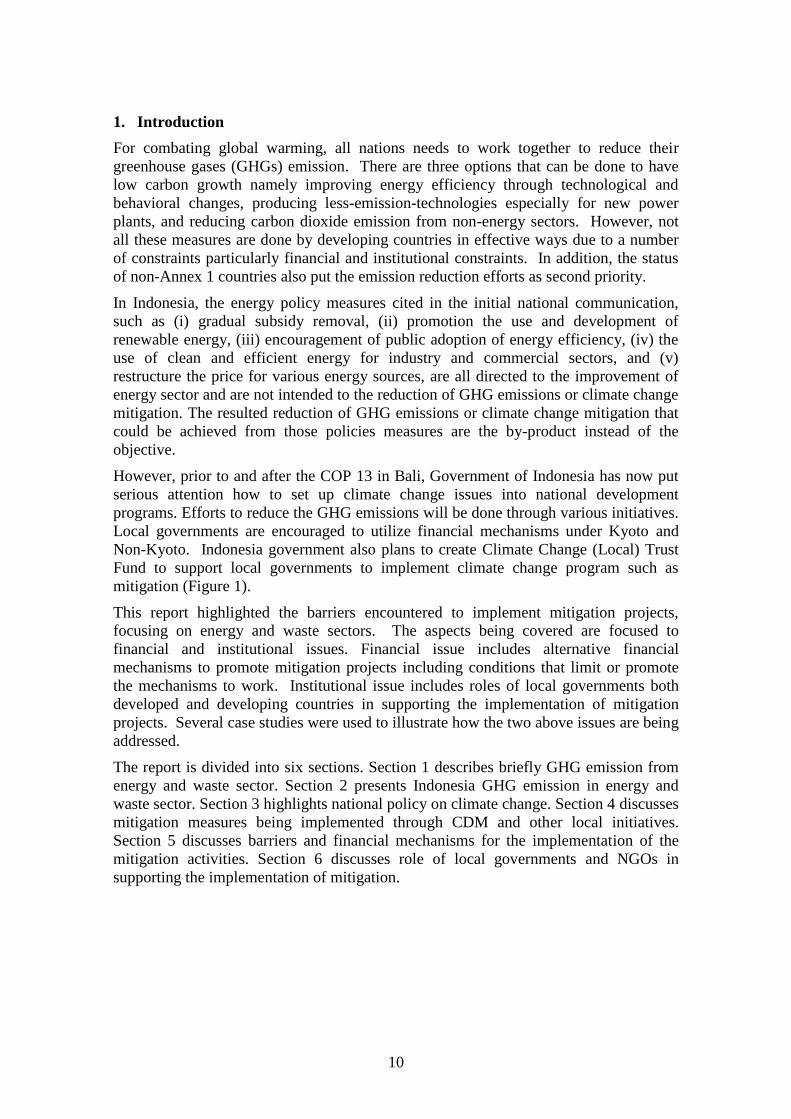
Note:
+ODA expected to come from additional existing ODA committment from Monetary concensus,
++Comply with Government Regulation No. 2/2006,
+++: Climate Change Program Loan
Figure 1. Financial mechanisms FOR the implementation of climate change programs
in Indonesia (Bappenas, 2008)
A survey study was conducted within period of October to mid of December 2008 to
obtain data regarding cases of mitigation activities in Indonesia. Data from nine
activities was obtained although it was not in detail. Most respondents were unable to
provide detail data and information especially on financial matters. Information on the
survey methodology and list of institutions contacted is attached in Appendix 1and 2.
2. Energy and Waste Sector’s GHG Emissions
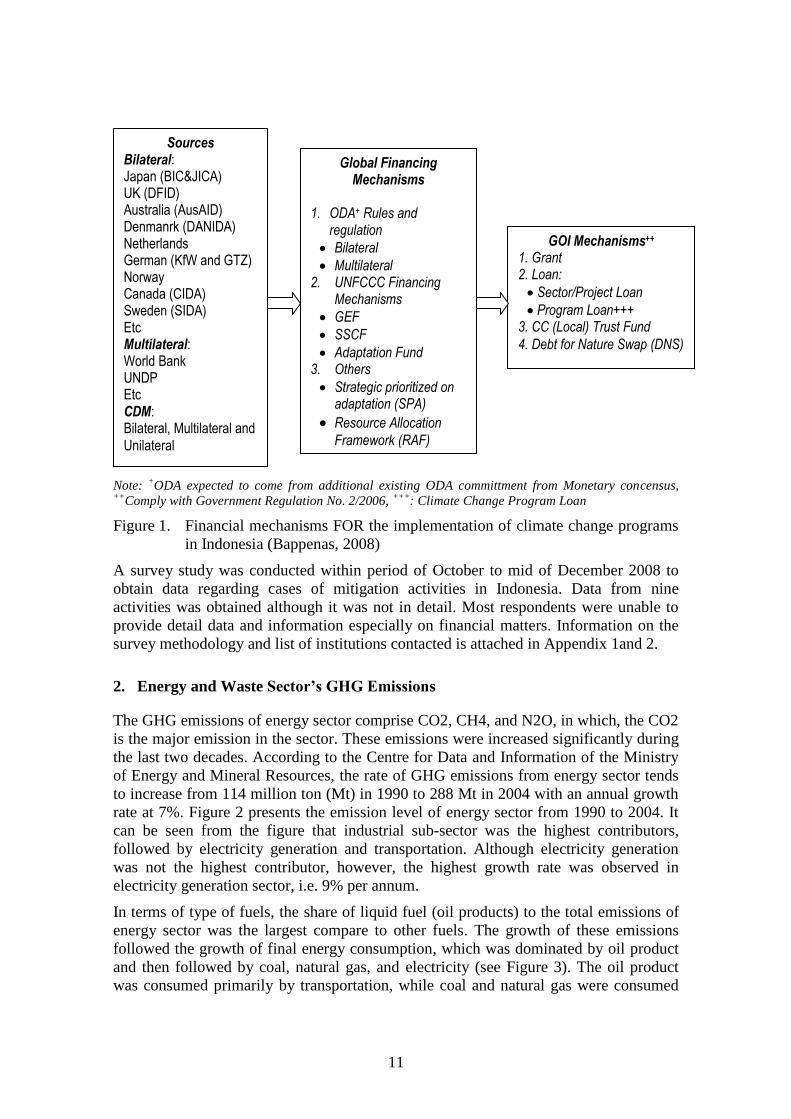
The GHG emissions of energy sector comprise CO2, CH4, and N2O, in which, the CO2
is the major emission in the sector. These emissions were increased significantly during
the last two decades. According to the Centre for Data and Information of the Ministry
of Energy and Mineral Resources, the rate of GHG emissions from energy sector tends
to increase from 114 million ton (Mt) in 1990 to 288 Mt in 2004 with an annual growth
rate at 7%. Figure 2 presents the emission level of energy sector from 1990 to 2004. It
can be seen from the figure that industrial sub-sector was the highest contributors,
followed by electricity generation and transportation. Although electricity generation
was not the highest contributor, however, the highest growth rate was observed in
electricity generation sector, i.e. 9% per annum.
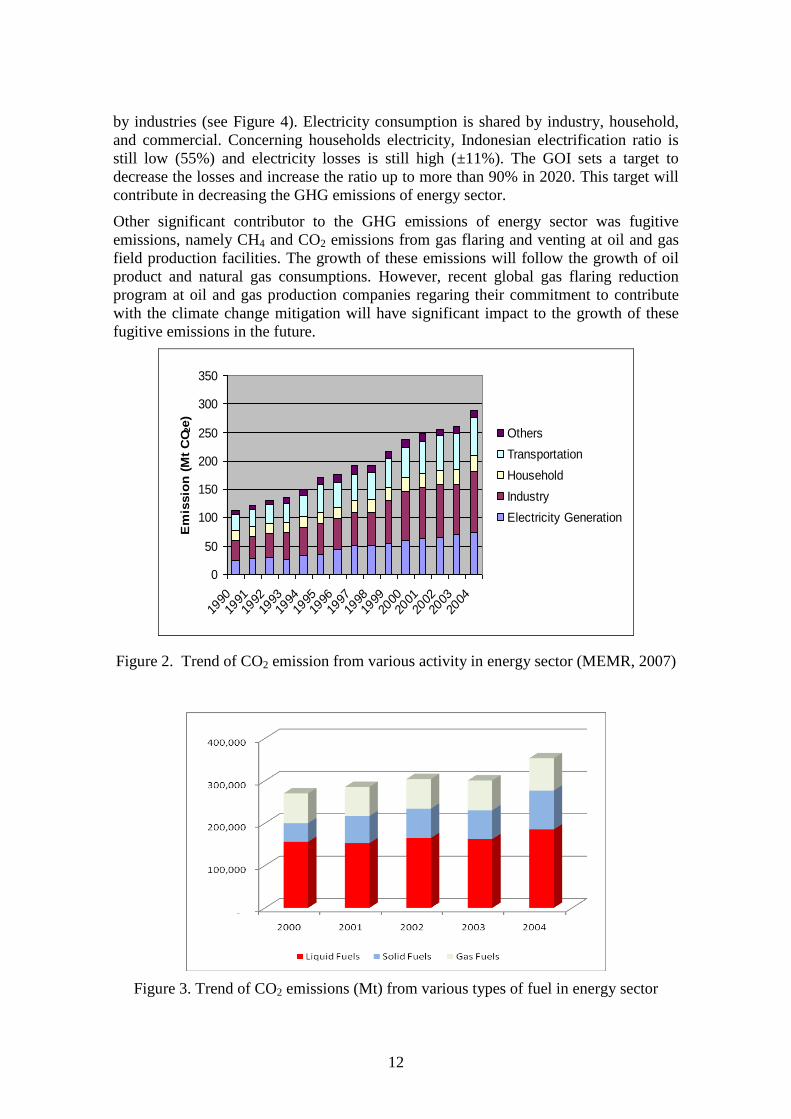
In terms of type of fuels, the share of liquid fuel (oil products) to the total emissions of
energy sector was the largest compare to other fuels. The growth of these emissions
followed the growth of final energy consumption, which was dominated by oil product
and then followed by coal, natural gas, and electricity (see Figure 3). The oil product
was consumed primarily by transportation, while coal and natural gas were consumed
Sources Bilateral: Japan (BIC&JICA) UK (DFID) Australia (AusAID) Denmanrk (DANIDA) Netherlands German (KfW and GTZ) Norway Canada (CIDA) Sweden (SIDA) Etc Multilateral: World Bank UNDP Etc CDM: Bilateral, Multilateral and
Unilateral
Global Financing Mechanisms
1. ODA+ Rules and
regulation
Bilateral
Multilateral 2. UNFCCC Financing
Mechanisms
GEF
SSCF
Adaptation Fund 3. Others
Strategic prioritized on adaptation (SPA)
Resource Allocation
Framework (RAF)
GOI Mechanisms++
1. Grant 2. Loan:
Sector/Project Loan
Program Loan+++ 3. CC (Local) Trust Fund
4. Debt for Nature Swap (DNS)
12
by industries (see Figure 4). Electricity consumption is shared by industry, household,
and commercial. Concerning households electricity, Indonesian electrification ratio is
still low (55%) and electricity losses is still high (±11%). The GOI sets a target to
decrease the losses and increase the ratio up to more than 90% in 2020. This target will
contribute in decreasing the GHG emissions of energy sector.
Other significant contributor to the GHG emissions of energy sector was fugitive
emissions, namely CH4 and CO2 emissions from gas flaring and venting at oil and gas
field production facilities. The growth of these emissions will follow the growth of oil
product and natural gas consumptions. However, recent global gas flaring reduction
program at oil and gas production companies regaring their commitment to contribute
with the climate change mitigation will have significant impact to the growth of these
fugitive emissions in the future.
0
50
100
150
200
250
300
350
1990
1991
1992
1993
1994
1995
1996
1997
1998
1999
2000
2001
2002
2003
2004
Em
issio
n (
Mt
CO
2e)
Others
Transportation
Household
Industry
Electricity Generation
Figure 2. Trend of CO2 emission from various activity in energy sector (MEMR, 2007)
Figure 3. Trend of CO2 emissions (Mt) from various types of fuel in energy sector
13
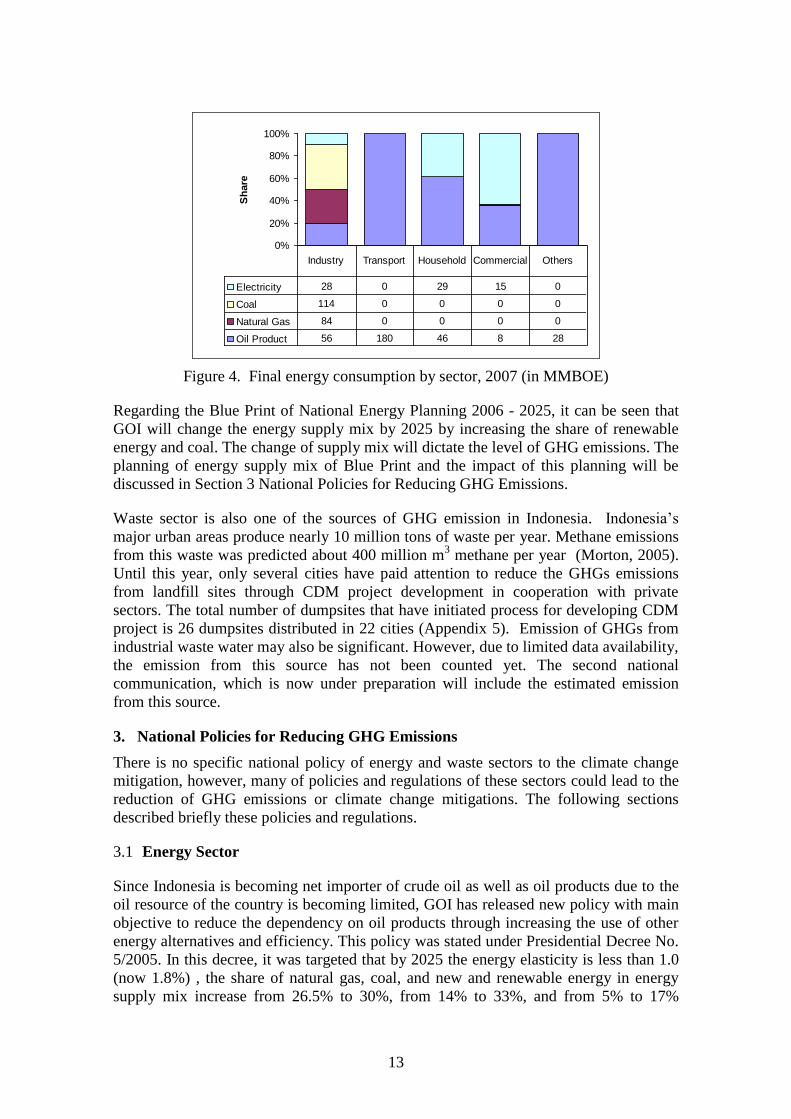
0%
20%
40%
60%
80%
100%
Sh
are
Electricity 28 0 29 15 0
Coal 114 0 0 0 0
Natural Gas 84 0 0 0 0
Oil Product 56 180 46 8 28
Industry Transport Household Commercial Others
Figure 4. Final energy consumption by sector, 2007 (in MMBOE)
Regarding the Blue Print of National Energy Planning 2006 - 2025, it can be seen that
GOI will change the energy supply mix by 2025 by increasing the share of renewable
energy and coal. The change of supply mix will dictate the level of GHG emissions. The
planning of energy supply mix of Blue Print and the impact of this planning will be
discussed in Section 3 National Policies for Reducing GHG Emissions.
Waste sector is also one of the sources of GHG emission in Indonesia. Indonesia‟s
major urban areas produce nearly 10 million tons of waste per year. Methane emissions
from this waste was predicted about 400 million m3 methane per year (Morton, 2005).
Until this year, only several cities have paid attention to reduce the GHGs emissions
from landfill sites through CDM project development in cooperation with private
sectors. The total number of dumpsites that have initiated process for developing CDM
project is 26 dumpsites distributed in 22 cities (Appendix 5). Emission of GHGs from
industrial waste water may also be significant. However, due to limited data availability,
the emission from this source has not been counted yet. The second national
communication, which is now under preparation will include the estimated emission
from this source.
3. National Policies for Reducing GHG Emissions
There is no specific national policy of energy and waste sectors to the climate change
mitigation, however, many of policies and regulations of these sectors could lead to the
reduction of GHG emissions or climate change mitigations. The following sections
described briefly these policies and regulations.
3.1 Energy Sector
Since Indonesia is becoming net importer of crude oil as well as oil products due to the
oil resource of the country is becoming limited, GOI has released new policy with main
objective to reduce the dependency on oil products through increasing the use of other
energy alternatives and efficiency. This policy was stated under Presidential Decree No.
5/2005. In this decree, it was targeted that by 2025 the energy elasticity is less than 1.0
(now 1.8%) , the share of natural gas, coal, and new and renewable energy in energy
supply mix increase from 26.5% to 30%, from 14% to 33%, and from 5% to 17%

14
respectively with total energy supply is estimated around 2800 MMBOE in 2025 (see
Figure 5). Although the share of new and renewable energy is increased, however, the
share of fossil fuels is still dominant. From this figure, it can be seen that significant
reduction of GHG emissions through the national energy policy is dificult to be
achieved without introducing cleaner production technology.
Figure 5. Energy mix policy under BAU and PERPRES 5/2005 (Source: PEN, 2007)
Before the GOI released Presidential Decree, ministerial policy (MEMR Decree No.
02/2004 concerning Green Energy development) was released to increase efficiency of
energy utilization and to maximize the use of renewable energy and other clean energy
technologies (clean coal technology, fuel cell, etc). This policy is called Green Energy
Policy. To boost the development of renewable energy, GOI has launched several
regulations, namely:
(i) biofuels:
- President Instruction No. 1/2006 concerning supplying and utilization of biofuels
- President Instruction No.10/2006 concerning the establishment of national team for
biofuels development for poverty alleviation and unemployment reduction
(ii) renewable-based power plant:
MEMR Decree No. 1122/2002 concerning PLN (National electricity enterprise)
obligation to purchase electricity that is generated from small scale distributed
renewable power plant (below 1 MW), in which the power purchase agreement is
governed by this regulation;
MEMR Decree No. 02/2006 concerning PLN obligation to purchase electricity that
is generated from medium scale renewable power plant (1 MW to 10 MW) or excess
power of captive power plants .
Government Regulation No. 26/2006 (revision of Government Regulation No.
10/1989) concerning supply and utilization of electricity with some new provisions,
such as introducing direct purchase without bidding for electricity that is generated
from renewable energy, excess power, or under emergency situation. For non-
renewable, the electricity purchase is based on competition through bidding process.
Procedure for power purchase agreement and transmission fee is covered under the
Ministerial Decree No. 001/2006.
54.4
20
26.5
30
14.1
33
5.0017
0%
10%
20%
30%
40%
50%
60%
70%
80%
90%
100%
2003 PERPRES 5/2005
Energ
y M
ix
New and renewable energy (geothermal, biofuel, Hydropower etc)
Coal
Natural Gas
Fossil Fuel
15
Investing in renewable energy in Indonesia is attractive business opportunity since
Indonesia is very rich in renewable energy sources, and could benefit from increasing
the share of renewable in the energy supply mix and benefit for carbon reduction
projects. However, Indonesia is still less favorable investment climate compared with
other countries since there are limited access to project financing, lack of government
budget, limited knowledge and capacity, and less of government policy and regulation
in energy sector that directly lead to the increasing of the investment of renewable
energy development in the context of climate change. Concerning policy and regulation
related to renewable energy development, government regulations on renewable based
power plant, particularly new power purchase agreement can boost the development of
rewable energy in Indonesia.
There are also a number of policies/laws related to energy efficiency (EE). However,
current policy (national energy policy 2006) does not explicitly state or mention the
target of EE achievement, affected market players of EE, and main features of EE.
There are also no policies or regulation related to EE that are governed incentives or
penalties to support the EE activities. The latest national energy policy (Presidential
Regulation No 5/2006) mentions the need to pursue energy conservation in all sectors
so that the energy elasticity is reached less than 1 by 2025. This policy is supported by
Indonesia‟s Energy Law. As stated in the Energy Law, the utilization of energy has to
consider energy resources potential and availability and has to follow energy
conservation directives/policy. The implementation of EE program in Indonesia was
regulated by (i) Presidential Decree No. 43/1991 that leads to the formulation of
National Master Plan of Energy Conservation (RIKEN), (ii) Presidential Instruction No.
10/2005 to the government sector to perform EE measures in government building and
transport facilities, (iii) Ministerial Regulation No. 031/2005 concerning procedures/
guidelines of energy conservation implementation.
The government is also to apply energy pricing policy whereby energy prices are to be
adjusted gradually to reflect the economic value of energy. Staging and adjustment of
energy prices are to be designed in such a way so that it could promote and optimize
energy diversification. With regard to incentives, GOI is to provide incentives to efforts
leading to the energy conservation implementation and alternative energy development.
In transportation activity, there are relevant policy to the energy use and climate change
mitigation, namely:
Policy to reduce traffic jam in Jakarta through the reduction of private vehicles
utilization, such as three in one‟ regulation, transport demand management (TDM),
electronic road pricing and the application of intelligent transport system (ITS).
This policy will improve 20% of road network without construction of new roads
and reduce significantly the traffic accident, total time travel, and CO2 emissions
Policy to more efficient of fossil fuel utilization through the improvement of the
quality of transportation facilities in some big cities in Indonesia by the development
of MRT, for example Bus Rapid Transit (BRT), Trans Jakarta (2004), Trans Pakuan
Bogor (2006), Trans Jogya (2007), and BPP Batam (2006). Other programs are the
planning of local government to construct special bus lines in 6 city toll roads,
namely Rawa Buaya-Sunter, Sunter Pulo Gebang, Duri Pulo-Kampung Melayu,
Ulujami-Tanah Abang, Kemayoran-Kampung Melayu, Pasar Minggu-Casablanca.

16
Policy to increase the utilization of gas fuel (CNG and LPG) for vehicles. In 2007, a
total of 1755 conversion kits have been installed for Taxi in Jakarta and most of
BRT in Jakarta also the use of CNG. The program of gas fuel in transport sector
(CNG/LPG) will be continued to other big cities in Indonesia.
Policy to increase the diversification of fuel use by encouraging the use of biodiesel
and bioethanol. The utilization target of biodeiesl and bioethanol is boosted by
mandatory policy (MEMR Regulation No. 32 /2008) that targeted the utilization of
biodiesel and biethanol for transportation are 1% and 5% respectively. Other energy
alternatives, such as fuel cell, electric cars, and others are under studied since the
infrastructure of these energy types has not available yet.
Policy to implement quality standard for liquid fuel, namely EURO 2 in 2007,
EURO 4 in 2012, and EURO 5 in 2015 in order to reduce the CO2 emissions from
vehicles (ACEA & EU Commission), CO2 Emission Index for Euro II (gasoline 186
gr/km, diesel 175 gr/km), CO2 Emission Index for Euro IV (gasoline 160 gr/km,
diesel 136 gr/km).
Except the application of Euro 2 and Euro 4 policy in the transportation activity, most
policies of energy sector are not directly intended for the reduction of GHG emissions.
However, the aplication these policies could lead to the reduction of GHG emissions.
The reduction is more as by prodcut of those policies measures instead of the objectives.
Figure 6 shows the projection of energy primary consumption with and without energy
diversification and conservation policies.
0
1000
2000
3000
4000
5000
6000
En
erg
y C
on
su
mp
tio
n (
MB
OE
)
Other bioenergy
Geothermal
Hydro power
Coal
Gas
Fossil fuel
Other bioenergy 0 27 95 172 300 0 0 0 0 0
Geothermal 24 24 49 105 157 10 12 13 24 30
Hydro power 36 42 57 61 66 26 39 39 43 57
Coal 160 210 320 690 1082 153 259 472 733 969
Gas 213 386 389 509 794 276 337 364 520 577
Fossil fuel 524 551 585 594 623 515 764 1145 1902 3470
2005 2010 2015 2020 2025 2005 2010 2015 2020 2025
With Diversification &
Conservation
Without Diversification &
Conservation
Figure 6. Projection of primary energy consumption with and without energy
diversification and conservation (Blueprint PEN, 2007)

17
The implementation of energy diversification (increasing share of renewable energy to
17%) and conservation policies will result in reduction of GHG emissions. Figure 6
shows primary energy consumption projection with and without energy diversification
and conservation while Figure 7 and 8 presents projection of estimated CO2 emissions
and the result of changing policies to the CO2 emissions level. It can be seen that
changing the policies will lead to decreasing of total energy consumption and reducing
fossil fuels utilization. These policies could lead the reduction of GHG emissions by
17% from BAU and could reach the emission level at 1,200 million tons CO2e in 2025.
In the National Action Plan Addressing Climate Change (MoE, 2007), it was stated (see
Figure 8) that nuclear electric power plant (exceed the Presidential Instructions target of
2%) can reduce the CO2 emission up to 20%. It was further stated that by optimization
of geothermal electric power plant to 8.4% of the national energy mix, the CO2 emission
could be reduced further 23% and by implementing Carbon Capture and Storage (CCS)
technologies, the CO2 emission could reduce further to 40%.
0
200
400
600
800
1000
2006 2007 2008 2009 2010 2011 2012 2013 2014 2015 2020 2025
Million Ton
Coal Emission Oil Emission Natural Gas Emission
Figure 7. The projection of GHG emissions by type of Fuel
Figure 8. CO2 emission reduction resulted from implementing energy diversification
and conservation policies (MoE, 2007)
Emission reduction under BAU in 2025
18
3.2 Waste Sector
In waste sector, this year Government of Indonesia launched National Law on Solid
Waste Management. The Law No.18/2008 article 22 about waste management, stated
that the waste management activity at the landfill site should emphasized on
environmentally friendly treatment and reuse of send the residues back to the
environment in safe way1. The Law also encourage cities to establish regional landfills
utilizing sanitary landfill technology. The state-of-the art of Sanitary Landfill
technology include the methane capture and landfill gas flaring.
At the Ministry of Public Works, a ministry regulation was released in 2006, Permen
PU No.21/2006, about National Policy and Strategy on Waste Management System
(Kebijakan dan Strategi Nasional Pengembangan Sistem Pengelolaan Persampahan/
KSNP-SPP) addressed the strategy for 2006 - 2010 which among others support the
improvement of waste management at the landfill sites into Sanitary Landfill especially
for metropolitan and big cities, Controlled Landfill for medium and small cities and
close all the open dumping landfill practices in cooperation with other parties.
Policy that encourages cities and municipalities to establish regional dumpsite will
increase the opportunity of the cities and municipalities to implement CDM project.
This is because the minimum waste quantities for a landfill to be feasible for a landfill
gas CDM project are in the range of 400 to 500 tons/day with minimum size of 8 ha.
Thus it is not possible for smaller municipal dumpsites, which has smaller amount of
waste, can get benefit from CDM.
In addition, by uniting a number of small dumpsite into a regional dumpsite, the cost
efficiency will increase. Thus, the reasonably sized landfills will use lesser disposal
costs and be more adapted to the requirements for CDM projects. At present, in term of
size of most of landfills of metro and big cities are suitable for LFG project as the size is
mostly more than 8 ha (minimum TPA size suitable for LFG project), while for medium
and small cities on average the size of the landfills is about 7 ha. However about 17 of
77 landfills in medium and small cities have landfill area of more than 8 Ha.
3.3 National Development Planning: Indonesia Responses to Climate Change
After COP13 in Bali, Government of Indonesia has issued a Yellow Book called
National Development Planning: Indonesia Responses to Climate Change (Bappenas,
2008). The document was an initial input to prepare Medium Term National
Development Planning (RPJM) 2010-2014.
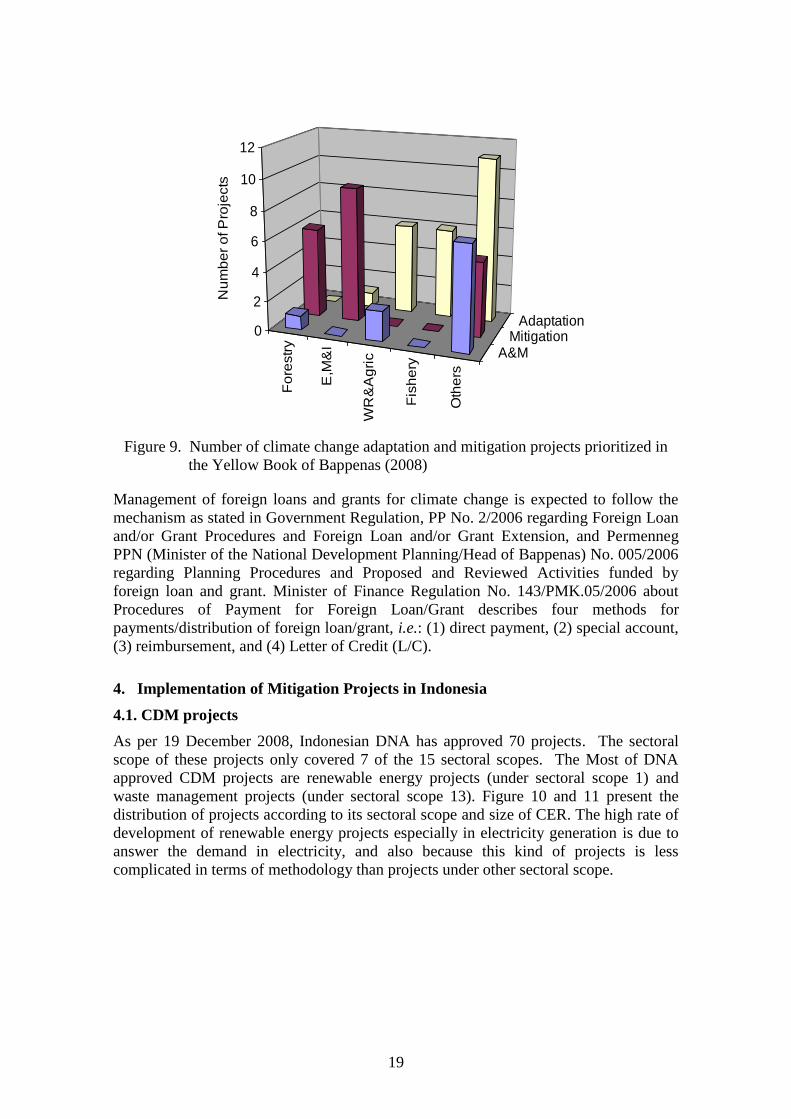
In this document, Bappenas along with sectoral ministries has identified a number of
climate change adaptation and mitigation programs. There are about 54 climate change
projects (26 adaptation, 18 mitigation and 8 integrated adaptation and mitigation
projects) being proposed for implementation in the next five years (Figure 10). The
programs required about 897 million USD. Funding for implementing the climate
change programs is expected come from various sources as shown in Figure 9.
1 (1) Kegiatan penanganan sampah sebagaimana dimaksud dalam Pasal 19 huruf b meliputi:
e. pemrosesan akhir sampah dalam bentuk pengembalian sampah dan/atau residu hasil pengolahan sebelumnya ke
media lingkungan secara aman.
19
Fo
restr
y
E,M
&I
WR
&A
gri
c
Fis
he
ry
Oth
ers
A&MMitigation
Adaptation0
2
4
6
8
10
12
Nu
mb
er
of P
roje
cts
Figure 9. Number of climate change adaptation and mitigation projects prioritized in
the Yellow Book of Bappenas (2008)
Management of foreign loans and grants for climate change is expected to follow the
mechanism as stated in Government Regulation, PP No. 2/2006 regarding Foreign Loan
and/or Grant Procedures and Foreign Loan and/or Grant Extension, and Permenneg
PPN (Minister of the National Development Planning/Head of Bappenas) No. 005/2006
regarding Planning Procedures and Proposed and Reviewed Activities funded by
foreign loan and grant. Minister of Finance Regulation No. 143/PMK.05/2006 about
Procedures of Payment for Foreign Loan/Grant describes four methods for
payments/distribution of foreign loan/grant, i.e.: (1) direct payment, (2) special account,
(3) reimbursement, and (4) Letter of Credit (L/C).
4. Implementation of Mitigation Projects in Indonesia
4.1. CDM projects
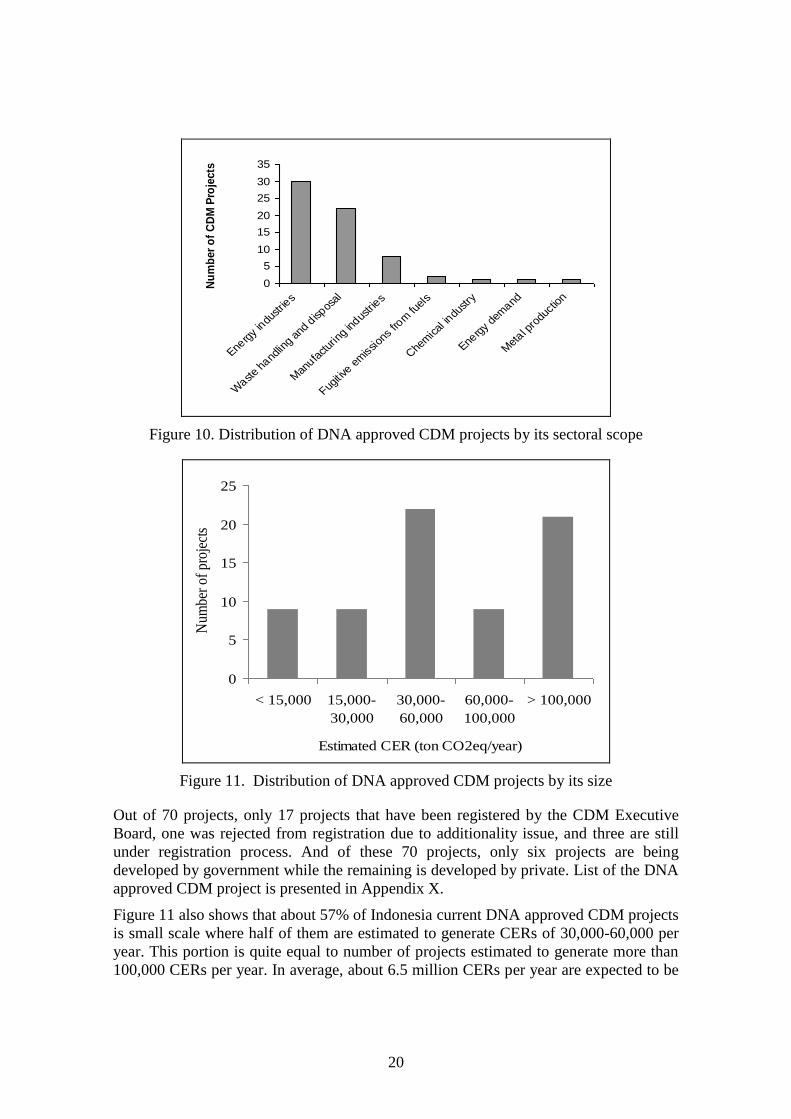
As per 19 December 2008, Indonesian DNA has approved 70 projects. The sectoral
scope of these projects only covered 7 of the 15 sectoral scopes. The Most of DNA
approved CDM projects are renewable energy projects (under sectoral scope 1) and
waste management projects (under sectoral scope 13). Figure 10 and 11 present the
distribution of projects according to its sectoral scope and size of CER. The high rate of
development of renewable energy projects especially in electricity generation is due to
answer the demand in electricity, and also because this kind of projects is less
complicated in terms of methodology than projects under other sectoral scope.
20
0
5
10
15
20
25
30
35
Energ
y in
dustrie
s
Wast
e ha
ndlin
g an
d disp
osal
Man
ufactur
ing
indus
tries
Fugit ive
em
ission
s fro
m fu
els
Che
mical
indu
stry
Energ
y de
mand
Met
al pro
duct
ion
Nu
mb
er
of
CD
M P
roje
cts
Figure 10. Distribution of DNA approved CDM projects by its sectoral scope
0
5
10
15
20
25
< 15,000 15,000-
30,000
30,000-
60,000
60,000-
100,000
> 100,000
Estimated CER (ton CO2eq/year)
Num
ber
of p
roje
cts
Figure 11. Distribution of DNA approved CDM projects by its size
Out of 70 projects, only 17 projects that have been registered by the CDM Executive
Board, one was rejected from registration due to additionality issue, and three are still
under registration process. And of these 70 projects, only six projects are being
developed by government while the remaining is developed by private. List of the DNA
approved CDM project is presented in Appendix X.
Figure 11 also shows that about 57% of Indonesia current DNA approved CDM projects
is small scale where half of them are estimated to generate CERs of 30,000-60,000 per
year. This portion is quite equal to number of projects estimated to generate more than
100,000 CERs per year. In average, about 6.5 million CERs per year are expected to be

21
generated from DNA approved CDM projects, but only around 80,000 CERs have been
issued as per November 2008.
4.2. Non-CDM projects
There are a number of carbon projects in Indonesia, which are not proposed as CDM
projects. Some of the projects are under voluntary market and some others are non-
market based projects such as local initiatives funded through public, grant, or CSR
(corporate social responsibility) funds. As there is no approval process required for
energy carbon voluntary project, it is hard to track information on voluntary carbon
projects that has been or being developed. From survey and interview process, it has
been found that currently at least 3 voluntary projects are being developed in Indonesia.
These include:
a. Bali Biogas Program
Project activity is installation of about 3,000 units of household scale biodigester in
Bali. It aims to manage waste manure from cows and pigs as well as provide
additional income from selling of sludge as fertilizer. Participants of the project is
PT. Mulya Tiara Nusa, a private company also act as biodigester provider, and the
farmers who implementing biodigester. Funding assistance for the project is
partially provided by the fund from Ministry of Environment through Bank Syariah
Mandiri and PT. Mulya Tiara Nusa (MTN). The program is expected to generate
about 10,000 VER per year.
b. Mobuya Mini Hydro Power Plant
Project activity is installation of 3x1000 kW hydro power plants in North Sulawesi.
The project is now under validation process and expected to generate about 12,250
of VERs per year.
c. Gianyar Waste Recovery Project
Project activities is to turn about 50-100 ton of waste/day into compost using forced
aeration process. Rotary Club Bali Ubud and GUS Foundation is the project
developer and operator. The project expected to generate about 7,000 CER per year
for 10 years crediting period. Developed through Volontary Gold Standard, the
buyer of the project is Kuoni, a Europe-based travel agent. More information about
the project is described on Appendix 4.
4.3.Other Project Activities
Other mitigation projects funded by public funds but not defined as carbon project also
exist. These are usually part of government initiatives in meeting energy demand or in
order to improve environmental quality. Most of the projects are in the area of power
generation or waste management. Examples of the program are Rural Electricity (Listrik
Pedesaan) and Energy Self-Sufficient Village (Desa Mandiri Energi) programs. The
Rural Electricity Program aims to provide electricity to community in remote areas,
while Energy Self-Sufficient Village Program aims to utilize local resources in
generating power to meet their own needs. Most energy sources under these programs
are renewables such as micro-hydro, solar energy, hybrid and biomass based energy.
Some of the renewable energy projects that have been implemented to electrify or to
meet energy demand of community living in the remote areas is given in Appendix 7.
22
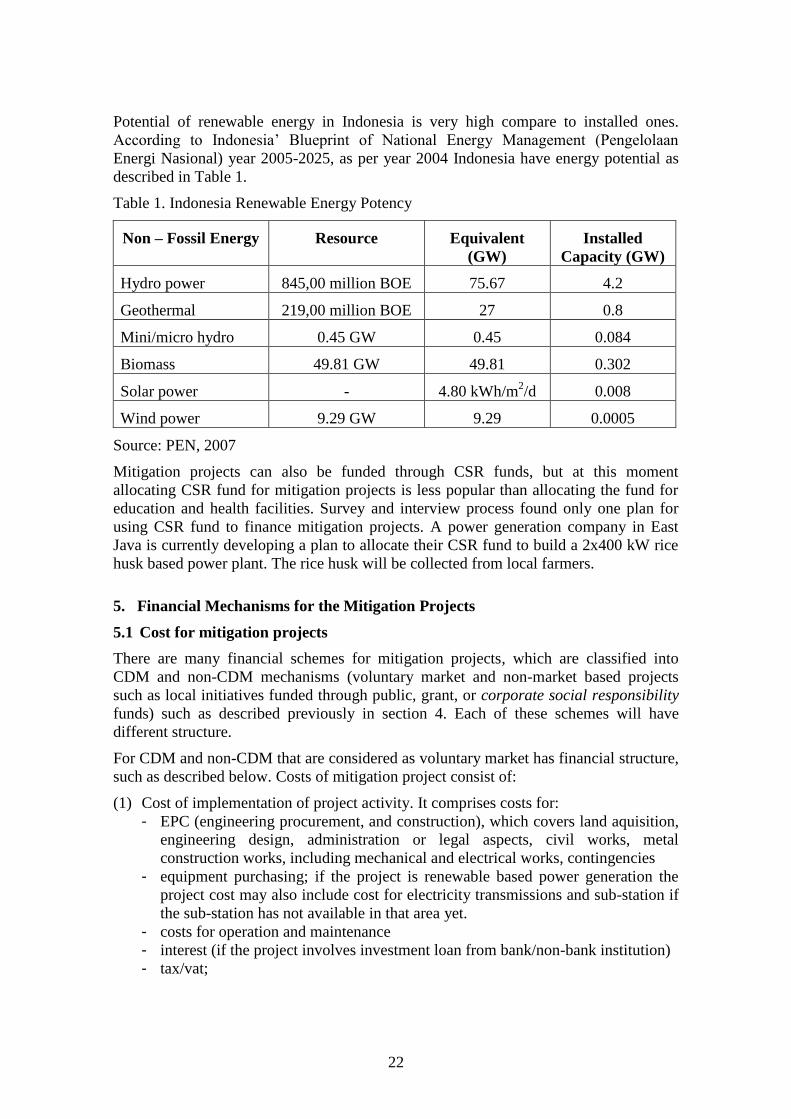
Potential of renewable energy in Indonesia is very high compare to installed ones.
According to Indonesia‟ Blueprint of National Energy Management (Pengelolaan
Energi Nasional) year 2005-2025, as per year 2004 Indonesia have energy potential as
described in Table 1.
Table 1. Indonesia Renewable Energy Potency
Non – Fossil Energy Resource Equivalent
(GW)
Installed
Capacity (GW)
Hydro power 845,00 million BOE 75.67 4.2
Geothermal 219,00 million BOE 27 0.8
Mini/micro hydro 0.45 GW 0.45 0.084
Biomass 49.81 GW 49.81 0.302
Solar power - 4.80 kWh/m2/d 0.008
Wind power 9.29 GW 9.29 0.0005
Source: PEN, 2007
Mitigation projects can also be funded through CSR funds, but at this moment
allocating CSR fund for mitigation projects is less popular than allocating the fund for
education and health facilities. Survey and interview process found only one plan for
using CSR fund to finance mitigation projects. A power generation company in East
Java is currently developing a plan to allocate their CSR fund to build a 2x400 kW rice
husk based power plant. The rice husk will be collected from local farmers.
5. Financial Mechanisms for the Mitigation Projects
5.1 Cost for mitigation projects
There are many financial schemes for mitigation projects, which are classified into
CDM and non-CDM mechanisms (voluntary market and non-market based projects
such as local initiatives funded through public, grant, or corporate social responsibility
funds) such as described previously in section 4. Each of these schemes will have
different structure.
For CDM and non-CDM that are considered as voluntary market has financial structure,
such as described below. Costs of mitigation project consist of:
(1) Cost of implementation of project activity. It comprises costs for:
- EPC (engineering procurement, and construction), which covers land aquisition,
engineering design, administration or legal aspects, civil works, metal
construction works, including mechanical and electrical works, contingencies
- equipment purchasing; if the project is renewable based power generation the
project cost may also include cost for electricity transmissions and sub-station if
the sub-station has not available in that area yet.
- costs for operation and maintenance
- interest (if the project involves investment loan from bank/non-bank institution)
- tax/vat;

23
(2) Cost of transaction for carbon credit scheme. This cost usually comprise of costs for
pre-operational phase design and operational phase.
costs of pre-operational phase cover costs for (i) consultant in developing design
project (PDD), (ii) validation, (iii) consultation and project appraisal, (iv) legal
and contractual arrangement;
costs of operational phase cover costs for (i) verification, (ii) administration fee
for registration by Executive Board of UNFCCC, (iii) risks mitigation, and (iv)
sales of CER (certified emission reduction)
The transaction cost is sometimes covered by carbon credit buyers. This mostly
happen if the carbon credit purchase agreement is concluded in early project stages.
In the case of mitigation projects are under non-CDM mechanisms that are non-market
based projects, the structure of mitigation project cost comprises the cost for project
implementation of project activity.
5.2. Revenue from mitigation projects.
The revenue from carbon credit will depend on price of the credit. In Indonesia, the
price being offered depends on the risk sharing between the project developer and the
buyer and also party covering the cost of transactions. This arrangement is normally
defined in the ERPA. The price being offered is ranged from 4-10 Euros per ton of CO2.
5.3. Funding for mitigation projects
There are several existing mechanism in financing mitigation activities which can be
classified into two major purposes, ie. profit-oriented fund and non-profit fund.
a. Profit oriented fund
Funds fall into this category are the following:
1. Commercial loan from banks and other financial institutions. In Indonesia,
involvement of commercial banks on CDM projects is still limited. Currently,
there are some bank can provide loan for supporting renewable energy projects
with lower interest than the commercial loan.
2. Carbon trading scheme. Payments can be the form of upfront or upon delivery of
carbon credit. An upfront payment can assist in financing the initial investment
while payments upon delivery of carbon credit can be used for operational &
maintenance costs. Therefore, most financing on carbon credit scheme requires
strong project prospect, such as high profile of the developer and low
implementation risks i.e.: secured feedstock supply, no social conflict, etc.
Most of CDM projects in Indonesia used profit oriented fund. Costs for
implementing the projects are financed by the company‟s equity and/or loan from
banks or financial institutions. While the transactions costs are mostly financed by
CERs buyers and/or brokers. One example of project financed by carbon developer is
a 145 MW New Built CCGT (Combined Cycle Gas Turbine) by PT ASTA
Keramasan Energi whose both project implementation and its CDM transaction
costs, were partially financed by Climate Change Capital Carbon Fund.
b. Non-profit fund
24
(i) Government/public funds. Supporting small scale carbon project, government
also provides grant or soft loan for communities. One of the financial schemes is
DNS program which is managed by the Ministry of Environment. Most of the
funding is normally to cover cost for initial investment. An example of this
scheme is Bali Biogas Program (see section 4.2).
(ii) Soft loan
Several institutions have schemed to provide loan with low interest rate to
activities with high environmental preservation aspects, including mitigation
projects. Ministry of Environment have a DNS (Debt for Nature Swap) scheme
that can also facilitate soft loan provision through providing guarantee to banks
giving soft loan to mitigation projects. This is however, not an open process.
Projects facilitated have to be recommended and approved by Ministry of
Environment.
(iii) Local Trust Fund. Government of Indonesia is now in the process of developing
climate change (local) trust fund to support any activities related to climate
change mitigation and adaptation (Bappenas, 2008). Source of the funding is
expected coming from various international sources (bilateral or multilateral
donor).
(iv) CSR. Although the concept is less popular recently, CSR funds can be allocated
to finance mitigation projects especially those that will improve community‟s
living such as local renewable energy resources‟ based power plant and small
scale waste management system. CSR in Indonesia is regulated through chapter
74 Law No. 1 year 2007 regarding Limited Company. It is stated that Company
is obligate to implement CSR. Ministry of State Owned Company‟ Decree No.
Kep. 236/MBU/2003 stated that CSR can be seen as Partnership Program with
small enterprises and Environmental Development Program. CSR fund can be
allocated from company‟s net profit (1-3% of net profit).
There are also financing potentials provided through CSR and through National
Phylantrophy Institution especially to support the small-medium enterprises
mainly to support the underlying investment.
c. Mixed for-profit and non-profit fund
Mixed scheme are also practice in Indonesia, especially projects involving both
government and non-government. Most of municipal waste management projects in
Indonesia are partially funded by local government, while remaining funds may
come from technology provider, soft loan from foreign financial institutions, etc.
One example is CDM project entitled “Pontianak – GHG Emission Reduction
through Improved MSW Management – LFG Capture, Flaring, and Electricity
Generation” conducted in Batu Layang Dumpsite - Pontianak City, West
Kalimantan. Project owner is the municipal government of Pontianak City while
funding for investment was partially provided by IBRD (International Bank for
Reconstruction and Development) and PT. Gikoko Kogyo. PT. Gikoko Kogyo also
act as the technology provider.

25
5.4 Supporting scheme for mitigation-related activities
Beside the abovementioned funding schemes, there were several mitigation related
activities implemented through technical assistance programs from foreign donors.
Several institutions such as ADB and World Bank have provided funds for various
programs aimed to improve local awareness and capacity in developing mitigation
activities. For example, in 2005-2007, an ADB supported project on Institutionalizing
CDM, produced 2 important documents related to CDM from Waste Sector. The first
book is a Strategy Paper on CDM from Waste Sector, described and recommended
establishment of regional landfills, promote landfill gas flaring and composting as the
low-hanging-fruits options for CDM. The first book also describe necessary institutional
aspects need to be prepared by project developers or participants. The second book,
CDM Manual for Waste Sector, provided guidelines and detail information related to
CDM project development.
UNDP, through its GEF Small Grant Program has given soft loan to projects which
contributes to rural society development. Some of the projects assisted were mitigation
activities such as micro hydro and small scale composting. List of the activities is
attached in Appendix 8. Table 2 provides examples of program related to mitigation
capacity building supported by donors.
Table 2. Examples of Donor Supported Programs in Improving Local Capacity
Institution Program(s)
Asian
Development
Bank
- Instutionalizing the Clean Development Mechanism (2005-2007)
- Carbon Sequestration through the Clean Development Mechanism
(2004-2006)
- Gas Generation from Waste (2005-2006)
- Renewable Energy Development Sector Project (2002-2008)
- Strengthening of Urban Waste Management Policies and
Strategies (1997-1999)
World Bank - Carbon Finance Development for Flare Reduction Projects (2005-
2006)
IGES - Integrated Capacity Strengthening for Clean Development
Mechanism (2003-2007)
- IGES CDM Capacity Building (2008-present)
UNDP - ACEH Tsunami Recovery Waste Management Program (2005-
2010),
- Support to Second National Communication on Climate Change
(2007-2009)
- Microturbine Cogeneration Technology Application Program
(2008-2013)
- Support to Indonesia‟s Implementation of the Montreal Protocol
(2003-2009)
- Integrated Micro-Hydro Development and Application Program
(2007-2010)

26
- Global Environment Facility Small Grants Program (1992-2010)
European
Commission
(EC)
- EU-SPF Regional University Building in Capacity Building in
Regional Energy Sector Development through ITB (Indonesia)
and CIRPS (Italy) 2005 - 2006.
CIDA - Capacity building in Analysis of Creditability of CDM Projects in
Indonesia” through Pembina institute (Canada), TERI (India), ITB
(Indonesia) 2000 – 2002
EU/British
Chamber
- Capacity building for Clean Technologies in Industry and
Transport (CTIT)
6. Barriers on Implementation of Mitigation Projects
6.1 Energy Sector
One of the weaknesses of the policy measures in reducing the GHG emissions or
climate change mitigation, as previously discussed in this report, are the least cost
considerations. The current government programs/plans address only type of energy
sources in energy supply mix with the main objective is to achieve energy supply
security; there are no programs or plans related to type of technology in the energy
supply side with the aim to combat the GHG emissions. Other weaknesses are
technology availability, human resources capability in providing or operating such
technology, government budget availability, and activities/programs vailability.
In terms of type of energy sources, the GOI is to increase the share of renewable and
new energy in national energy supply mix. According to the decree, although the
government is planned to increase the share of renewable in the national energy supply
mix, however the share of coal is also to be increased to fulfill high domestic demand of
energy. Therefore, in overall it is not guaranteed that total GHG emissions from the
supply side will decrease in the future. Prioritizing of the increasing share of the
renewable energy, for example, increasing of the share of biofuel utilization in energy
sector through Biofuel Mandatory in the Ministry of Energy and Mineral Resources
Decree (September 2008) will be considered as a challenges for the reducing of the
GHG emissions or climate change mitigation.
Basically, investing in renewable energy in Indonesia is attractive business opportunity.
Indonesia is very rich in renewable energy sources, and could benefit from increasing
the share of renewable in the energy supply mix while fossil energy source is became
limited. It also could benefit for carbon reduction projects although Indonesia is non-
annex I country that does not compulsory target for GHG emission reduction. However,
Indonesia is still less favorable investment climate compared with other countries since
there are some barriers, namely limited access to project financing, lack of government
budget, limited knowledge and capacity in carrying carbon emission reduction projects,
and less of government policy and regulation in energy sector that directly lead to the
increasing of the investment of renewable energy development in the context of climate
change. Concerning policy and regulation related to renewable energy development,
government regulations on renewable based power plant, particularly „power purchase
agreement‟, can boost the development of renewable energy in Indonesia. Lack of

27
access to obtain funding for underlying investment will become bottleneck for
renewable and clean technology energy projects.
While for power generation activities, barriers faced are:
a. The difficult process in engaging a PPA (Power Purchase Agreement) for electricity
selling with PLN and biofuel with Pertamina. Any entity who wants to sell electricity
to PLN has to prepare proposal describing technical and economic feasibility of the
project. The proposal is to be submitted to PLN regional office. The regional office
will then review the proposal and conduct inspection of the site, PLN and the entity
will then negotiate the price;
b. Low power selling price. The selling price of electricity has been stated as follows:
(a) 0.8 x PLN Local Production, applicable for medium voltage plant; (b) 0.6 x PLN
Local Production, applicable for low voltage plant.
Some barriers identified by the Ministry of Energy and Mineral Resources (Lestari,
2007) in developing renewable energy are:
Law awareness and knowledge on the utilization and operation of renewable energy
technologies including law capacity of industry manifacture in using these types of
technologies.
High cost due to high reliance to import technologies so that the selling price of
renewable energy becomes higher than the conventional energy such as fuel oil and
electricity.
Therefore to optimize the use of renewable energy, it is required good incentive and
financial support from the governments or public-private partnership model to fund
mitigation projects as well as awareness rising and capacity development in utilizing
and operating the renewable technologies.
5.3. Waste Sector
As energy supply become limited, more source of energy alternatives are being
promote. One of it is from waste. But the awareness about the proper waste-to-energy
concept is not yet being widely discussed and defined.Indonesia wastes characteristic is
70% organic and 30% anorganic. The average calorific value of Indonesian wastes is
about 2500-4000 KJ/cal. With that rage of calorific value, thermal treatment, such as
incinerator, gasification, pyrolisis and plasma arc, will not be appropriate. Thus the idea
of waste-to-energy plant will not be suitable for Indonesia. Composting and landfill gas
flaring technology are the most recommended technology for waste treatment especially
at the landfill sites. To some extend, power generation can be done from landfill gas
flaring activities but it will need additional investment.
Barriers for the implementation of mitigation projects through CDM in waste sector
include:
a. Waste quantity.
For CDM suitablility, minimum amount of wastes, about 400-500 ton/day, must be
send to the landfill. This amount of wastes can only be generated from a big or

28
metropolitan cities, or bundled from several medium size cities which also means
generated from one big landfill site or a regional landfill sites.
b. Lack of emission standard, guidance and policy umbrella as well as readiness at the
local level
Indonesia has no specific emissions standards yet especially for dioxins and mercury
emission from thermal treatment. Yet the laboratory to test the dioxins emissions
does not exist yet. The emission standards are now being disscussed in compliance
with Indonesia National Implementation Plan of the Stockholm Convention.
Local governments are frequently approached by CDM investors without knowing
what the proposal about. Umbrella policy especially from technical department did
not socialized or trickled down to the local level.
c. Modalities for under lying investment/infrastructure:
o Some projects, especially those utilizing World Bank Carbon Fund, borrow the
fund for infrastructures improvement and underlying investment from the Bank.
Other projects, financed by the investors.
o In one project, limited capacity of investor halted the project realization.
o Lack of knowledge on the low-hanging-fruit options from investors as well as
government sides.
d. Lack of institutional set up
Local institution set up need to be fostered and supported to creat a more favorable
platform to communicate with CDM investors. In one of the CDM project, local
government set up a special body to bridge the communication between local
governments and CDM investors or related parties.
7. Role of NGOs and Local Governments in Supporting the Implementation of
Mitigation Activities
7.1 NGOs
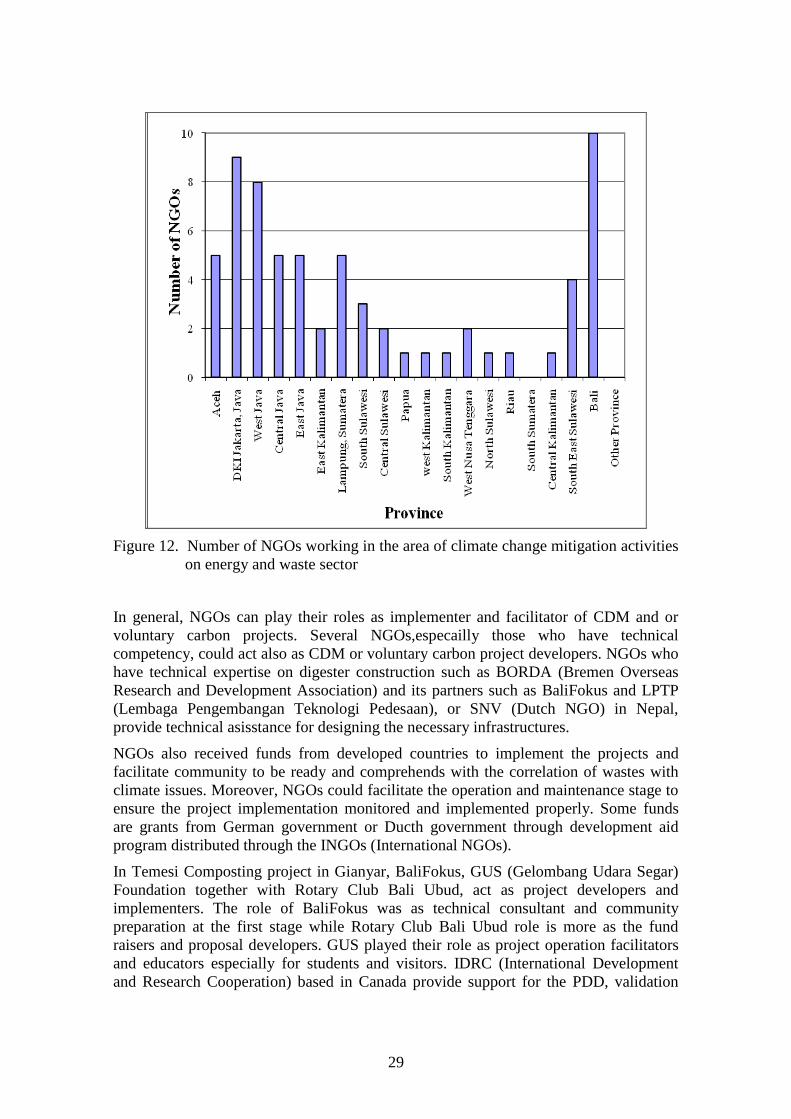
There are a number of NGOs working in the area mitigation projects. From SGP-GEF
UNDP program and authors experiences, it has been identified about 18 NGOs are
working in the area of climate change mitigation project that focussing on energy and
waste sectors (Figure 12). Most of the NGOs are working in Java island while outside
Java is very little. The types of mitigation activities and name of NGOs is given in
Appendix 9.
29
Figure 12. Number of NGOs working in the area of climate change mitigation activities
on energy and waste sector
In general, NGOs can play their roles as implementer and facilitator of CDM and or
voluntary carbon projects. Several NGOs,especailly those who have technical
competency, could act also as CDM or voluntary carbon project developers. NGOs who
have technical expertise on digester construction such as BORDA (Bremen Overseas
Research and Development Association) and its partners such as BaliFokus and LPTP
(Lembaga Pengembangan Teknologi Pedesaan), or SNV (Dutch NGO) in Nepal,
provide technical asisstance for designing the necessary infrastructures.
NGOs also received funds from developed countries to implement the projects and
facilitate community to be ready and comprehends with the correlation of wastes with
climate issues. Moreover, NGOs could facilitate the operation and maintenance stage to
ensure the project implementation monitored and implemented properly. Some funds
are grants from German government or Ducth government through development aid
program distributed through the INGOs (International NGOs).
In Temesi Composting project in Gianyar, BaliFokus, GUS (Gelombang Udara Segar)
Foundation together with Rotary Club Bali Ubud, act as project developers and
implementers. The role of BaliFokus was as technical consultant and community
preparation at the first stage while Rotary Club Bali Ubud role is more as the fund
raisers and proposal developers. GUS played their role as project operation facilitators
and educators especially for students and visitors. IDRC (International Development
and Research Cooperation) based in Canada provide support for the PDD, validation
30
and verification process. Local government of Gianyar provide support in terms of land
use and permit provision. While local community of Temesi Village actively involve in
project implementation, operation and maintenance, serves as manager, workers and
beneficiaries of the project.
7.2 Local Government in Developing Countries
7.2.1 Energy Sector
In energy sector, role of the BP Migas is as a facilitator in developing of Global Gas
Flaring Reduction program that will lead significant impact in reducing of the CO2 and
CH4 emissions from flaring/venting activities at oil and gas production field facilities.
In developing of Desa Mandiri Energy (DME), most local Governments of Indonesia
are trying to start with renewable energy development for DME program. In this case,
Local Government acts as initiator and supporter fund to the Program. In addition to the
renewable energy, many local Governments also start with biodiesel and bioethanol
development in order to meet the biofuel mandatory (MEMR decree No. 32/2008).
Some of Local Governments of Indonesia are trying to have roles as project proponents
in CDM projects as shown by:
- Provincial Government of Riau for the CDM project in a biomass (empty fruit bunch
of Plam Oil Plants) based power plant at Siak Hulu Cluster and the Province
Government of Gorontalo for the CDM poject in biofuel based liquid fuels (the
development of Jatropha).
- Provincial Government of Jakarta for CDM project in MRT development (mono
rail),
In addition, a role of Local Governments of Indonesia is to provide better environment
that could support the increasing the quality of transportation facilities, for example:
- the reduction of private vehicles utilization program through several programs, such
as „three in one‟, transport demand management (TDM), electronic road pricing, and
application of intelligent transport system (ITS). These programs will improve 20%
of road network without construction of new roads and will reduce significantly the
traffic accident, total time travel, and CO2 emissions.
- the improvement of the quality of transportation facilities by the development of
MRT, such as Bus Rapid Transit (BRT), Trans Jakarta (2004), Trans Pakuan Jakarta
- Bogor (2006), and planning of local government to construct special bus lines in 6
city toll roads, namely Rawa Buaya-Sunter, Sunter Pulo Gebang, Duri Pulo-
Kampung Melayu, Ulujami-Tanah Abang, Kemayoran-Kampung Melayu, Pasar
Minggu-Casablanca.
- Increasing the utilization of alternative energy that has less GHG emissions through
the utilization of gas fuel (CNG and LPG) for vehicles. In 2007, a total of 1755
conversion kits have been installed for Taxi in Jakarta and most of BRT in Jakarta
also the use of CNG. The program of gas fuel in transport sector (CNG/LPG) will be
continued to other big cities in Indonesia by local government.
Increasing the diversification of fuel use by encouraging the use of biodiesel and
bioethanol in transportation activity. The utilization target of biodeisel and

31
bioethanol by local government is boosted by mandatory policy (MEMR Regulation
No. 32 /2008) that targeted the utilization of biodiesel and biethanol for
transportation are 1% and 5% respectively.
Implementation of standard for liquid fuel, namely EURO 2 in 2007, EURO 4 in
2012, and EURO 5 in 2015 in order to reduce the CO2 emissions from vehicles
(ACEA & EU Commission), CO2 Emission Index for Euro II (gasoline 186 gr/km,
diesel 175 gr/km), CO2 Emission Index for Euro IV (gasoline 160 gr/km, diesel 136
gr/km). Inthis implementation, the role of local Government is to give directives to
local office of Pertamina who will manage the fuels supply.
7.2.2 Waste Sector
In solid waste management area, Local Governments in developing countries can play
their roles as facilitators of CDM projects as shown by Sarbagita (Denpasar, Gianyar,
Badung, Tabanan) local governments. Sarbagita governments facilitate the CDM
project through the establishment of Regional Waste Management Body (Badan
Pengelola Kebersihan Sarbagita). The body received mandates to annouce the call for
investment, select proper and qualified investor, negotiate and monitor project
implementation.
Bekasi and Pontianak authorities through the designated agency (Dinas Kebersihan dan
Pertamanan) act as implementer of CDM project. LGs allocated partial budget for
Feasibility Study, EIA (Environmental Impact Assessment) and underlying investment
or infrastructures through local fiscal budget. Partial supports also provided by central
government in form of technical asisstance study and infrastructures provision.
In waste manure management, Ministry of Agriculture, Ministry of Environment, and
Ministry of Energy and Mineral Resources are promoting the application of biodigester
to manage waste manure and convert it into biogas, which also serve as alternative
energy. Annually, they allocated certain fund for dissemination of bio-digesters and
providing loan for purchasing bio-digester.
Some LGs could facilitate and promote the project implementation through
Programmatic of Action and provision of multi-years funds from local budget (APBD
II) and partially from provincial fund (APBD I). Pro-active provincial government such
as Gorontalo who has successfully launched an Agropolitan Province with Maize as
their special agriculture products) could be approached for PoA ideas. The same
approach could be introduce to other regency or city such as Sragen Regency who has
successfuly launched and implement the “Go Organic Agriculture” program since 1999.
The PoA also could be supported by private companies or banks. Danamon group has
shown their supports in development of market composting projects in several cities.
The actvities can be expanded or developed into a PoA.
To support realization of national strategy and policy, central government also should
provide Fast Track program of mitigation to support conversion of open dumping
landfill to sanitary landfill. Ministry of Public Works through their investment division
could also financed the modalities of CDM for some pilots as incentives for cities.
32
7.3 Local Government in Developed Countries
Technical assistance and coordination of financial assistance also provided by LGs from
developed countries. One of the example is Kitakyushu Techno-Cooperation Assistance
(KITA) conducted in several cities in Indonesia, among others in Surabaya City. KITA
provided technical asisstance in form of provision of experts in composting. KITA
implemented the project in cooperation with university-based NGO, Pusdakota, and the
relevant government agency (Dinas Kebersihan dan Pertamanan). The LG of Surabaya
then replicate the Takakura composting techniques city wide to handle households and
market organic wastes. Takakura composting techniques is a semi-aerobic composting
technique which emitted very low amount of methane during the process. Takakura
composting technique considered as one of the low-cost option of composting.

33
APPENDICES

34
Appendix 1. Survey Implementation
Survey was implemented within period of early October up to mid December 2008, and
consists of several activities as follows:
1. End of September - early October 2008: Listed all potential target institutions and
person that to be surveyed and interviewed. This list was developed through
contacting Indonesian DNA, CDM consultants and Indonesian NGOs who are
working on climate change mitigation activities or programs.
2. Mid October 2008: Developing questionnaires. The questionnaire was developed
based on the example provided by IGES, incorporated with the nature of targeted
respondents. For example, questionnaire sent to local governments are made in
Bahasa Indonesia. Meanwhile, questionnaires sent to DNA approved CDM projects
were filled with short information extracted from their PDDs. General Form of the
questionnaire sent is attached in Appendix 2.
3. Mid – end of October 2008: Sending the questionnaires to all potential
institutions/organization listed in Appendix 3, and conducting direct interview with
few developers located nearby.
Questionnaires were sent to 80 institutions while direct interview was conducted
with 7 institutions.
4. Early November 2008: Analyzing the results of the questionnaires. A shortlist of
target activities for in-depth analysis was made afterward.
5. Mid November 2008 – Mid December 2008: Conducting in depth interview with
the shortlist institutions/organization (project developers) through phone or e-mail.
Since only four activities shortlisted by the submission of Interim Report, more
interviews conducted whether by phone or face to face meeting.
Throughout the survey period, data and information gathering through survey on
literatures was also conducted.
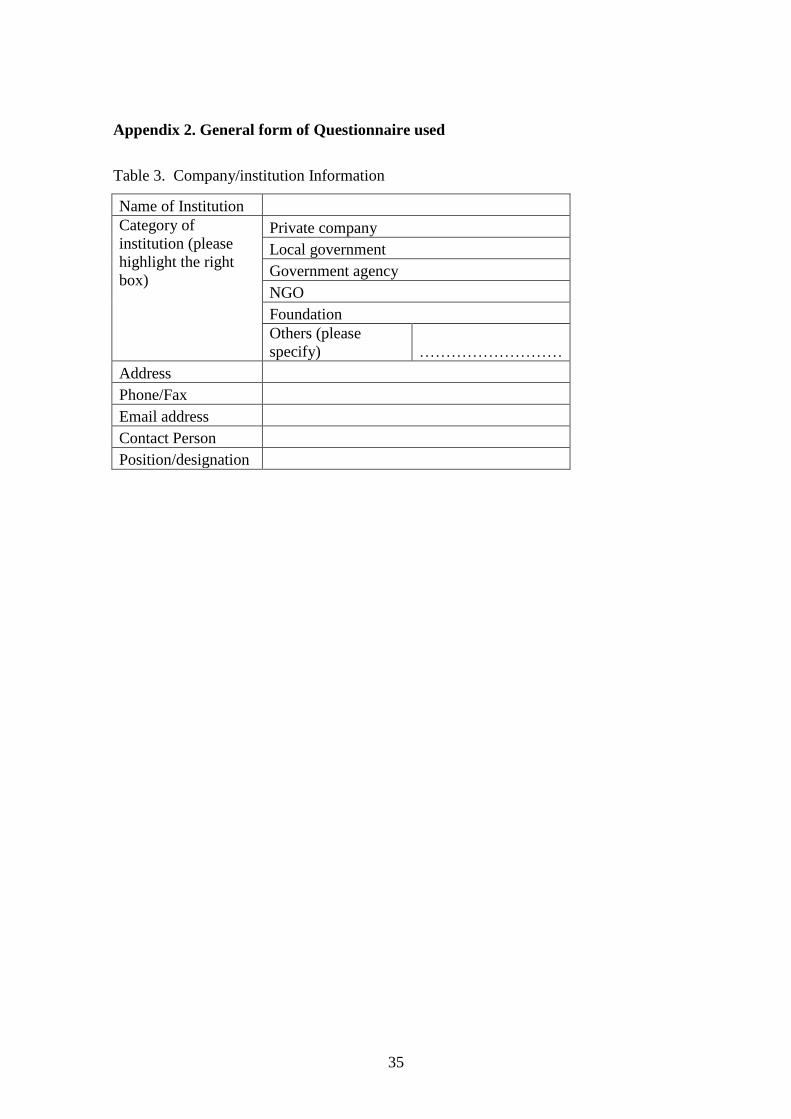
35
Appendix 2. General form of Questionnaire used
Table 3. Company/institution Information
Name of Institution
Category of
institution (please
highlight the right
box)
Private company
Local government
Government agency
NGO
Foundation
Others (please
specify) ………………………
Address
Phone/Fax
Email address
Contact Person
Position/designation
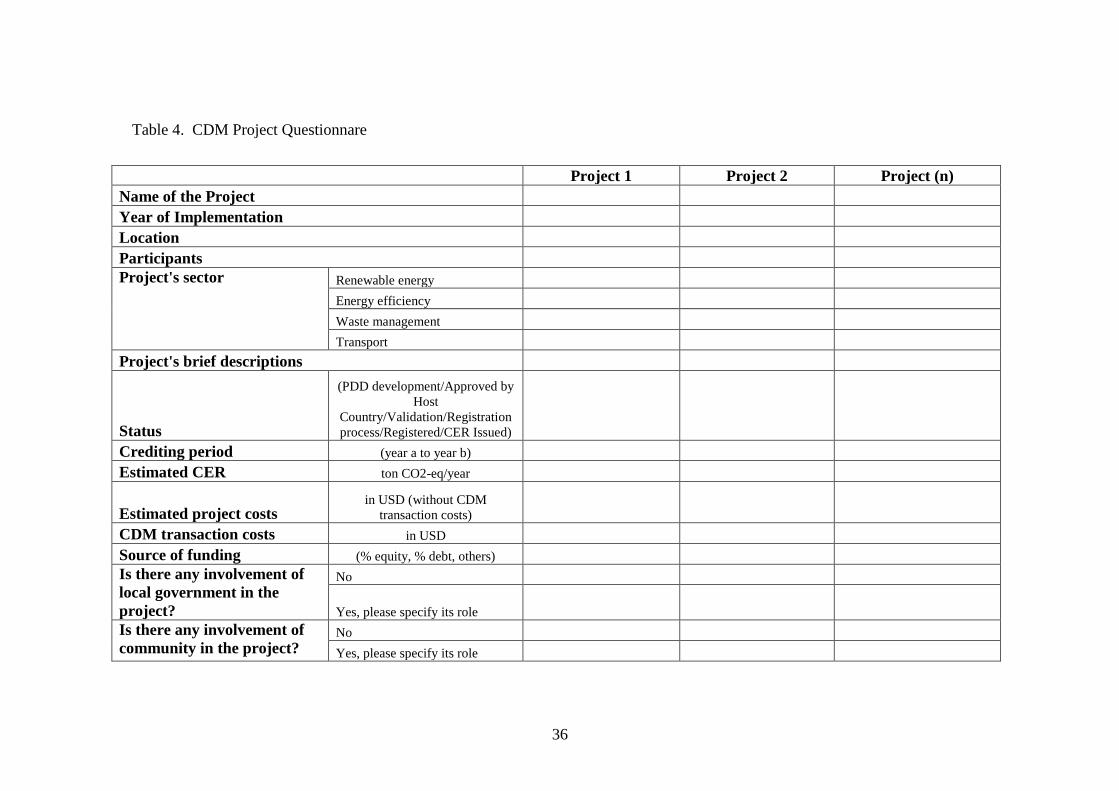
36
Table 4. CDM Project Questionnare
Project 1 Project 2 Project (n)
Name of the Project
Year of Implementation
Location
Participants
Project's sector Renewable energy
Energy efficiency
Waste management
Transport
Project's brief descriptions
Status
(PDD development/Approved by
Host
Country/Validation/Registration
process/Registered/CER Issued)
Crediting period (year a to year b)
Estimated CER ton CO2-eq/year
Estimated project costs in USD (without CDM
transaction costs)
CDM transaction costs in USD
Source of funding (% equity, % debt, others)
Is there any involvement of
local government in the
project?
No
Yes, please specify its role
Is there any involvement of
community in the project? No
Yes, please specify its role
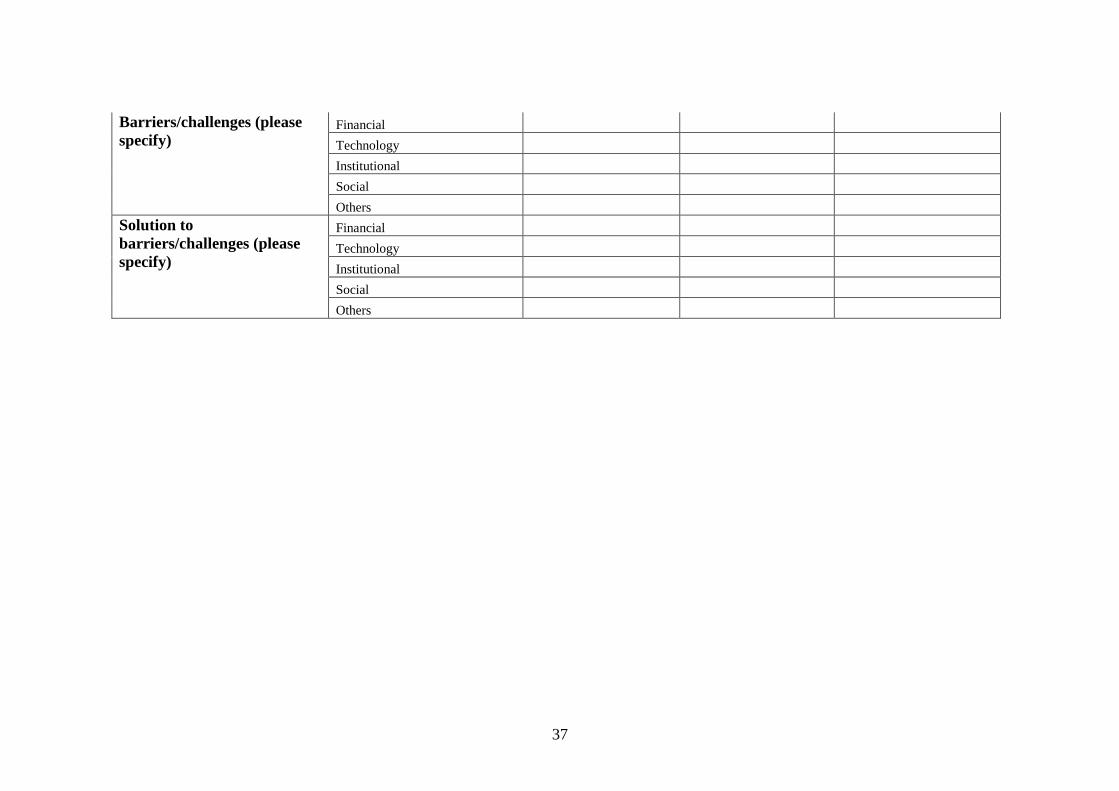
37
Barriers/challenges (please
specify) Financial
Technology
Institutional
Social
Others
Solution to
barriers/challenges (please
specify)
Financial
Technology
Institutional
Social
Others
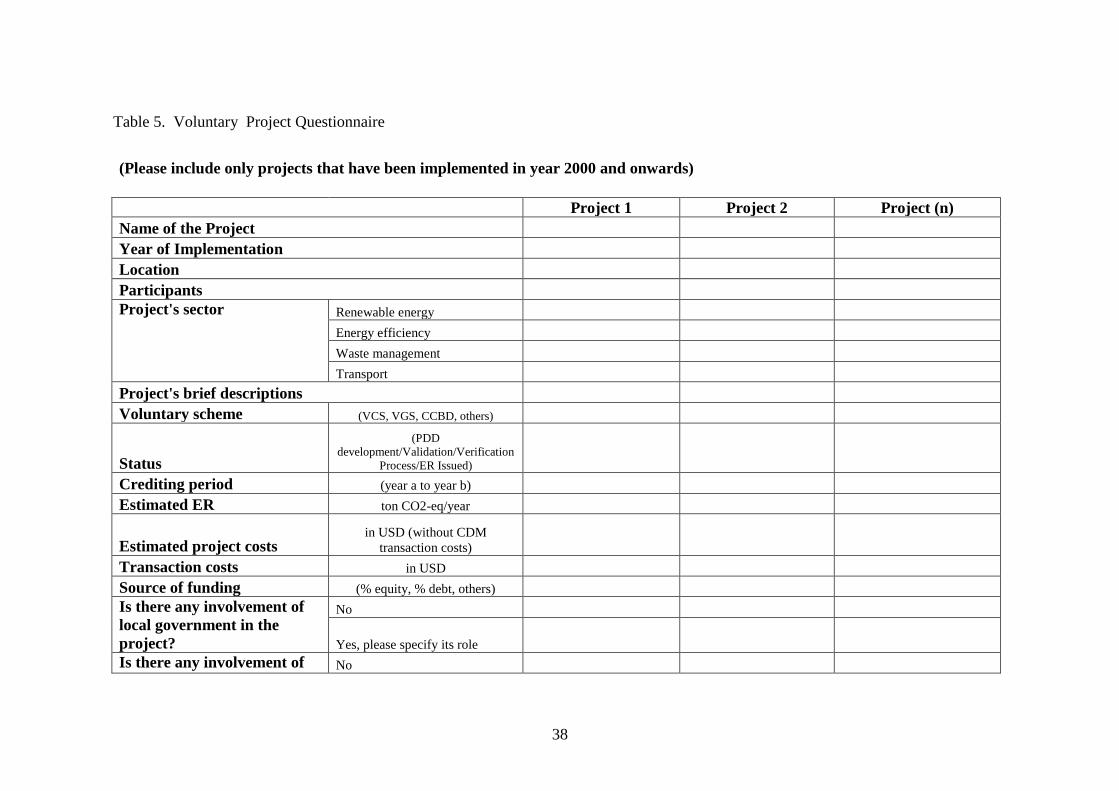
38
Table 5. Voluntary Project Questionnaire
(Please include only projects that have been implemented in year 2000 and onwards)
Project 1 Project 2 Project (n)
Name of the Project
Year of Implementation
Location
Participants
Project's sector Renewable energy
Energy efficiency
Waste management
Transport
Project's brief descriptions
Voluntary scheme (VCS, VGS, CCBD, others)
Status
(PDD
development/Validation/Verification
Process/ER Issued)
Crediting period (year a to year b)
Estimated ER ton CO2-eq/year
Estimated project costs in USD (without CDM
transaction costs)
Transaction costs in USD
Source of funding (% equity, % debt, others)
Is there any involvement of
local government in the
project?
No
Yes, please specify its role
Is there any involvement of No
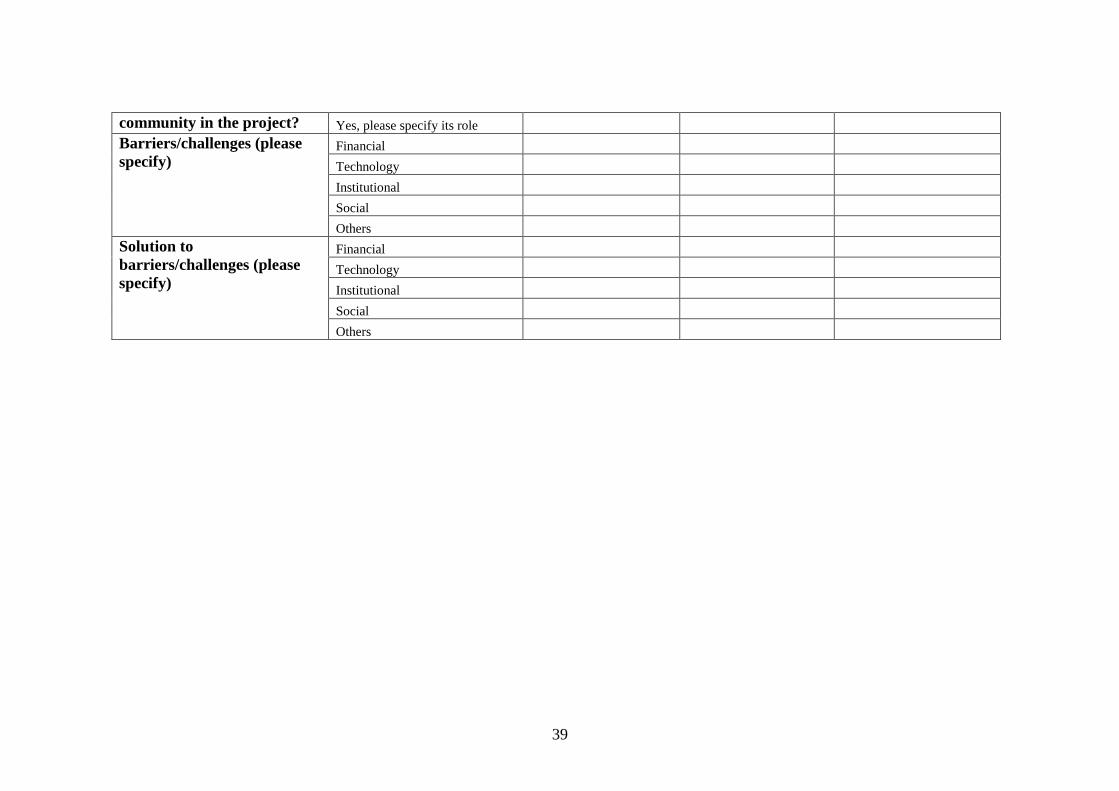
39
community in the project? Yes, please specify its role
Barriers/challenges (please
specify) Financial
Technology
Institutional
Social
Others
Solution to
barriers/challenges (please
specify)
Financial
Technology
Institutional
Social
Others
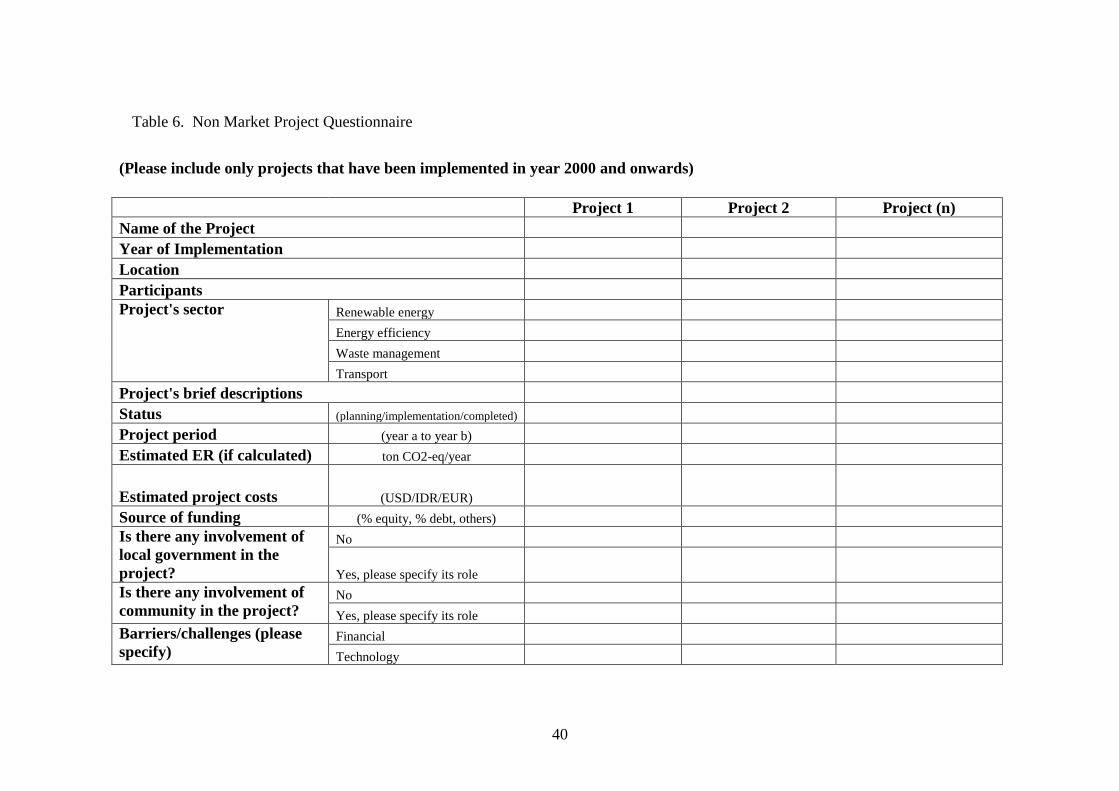
40
Table 6. Non Market Project Questionnaire
(Please include only projects that have been implemented in year 2000 and onwards)
Project 1 Project 2 Project (n)
Name of the Project
Year of Implementation
Location
Participants
Project's sector Renewable energy
Energy efficiency
Waste management
Transport
Project's brief descriptions
Status (planning/implementation/completed)
Project period (year a to year b)
Estimated ER (if calculated) ton CO2-eq/year
Estimated project costs (USD/IDR/EUR)
Source of funding (% equity, % debt, others)
Is there any involvement of
local government in the
project?
No
Yes, please specify its role
Is there any involvement of
community in the project? No
Yes, please specify its role
Barriers/challenges (please
specify) Financial
Technology

41
Institutional
Social
Others
Solution to
barriers/challenges (please
specify)
Financial
Technology
Institutional
Social
Others
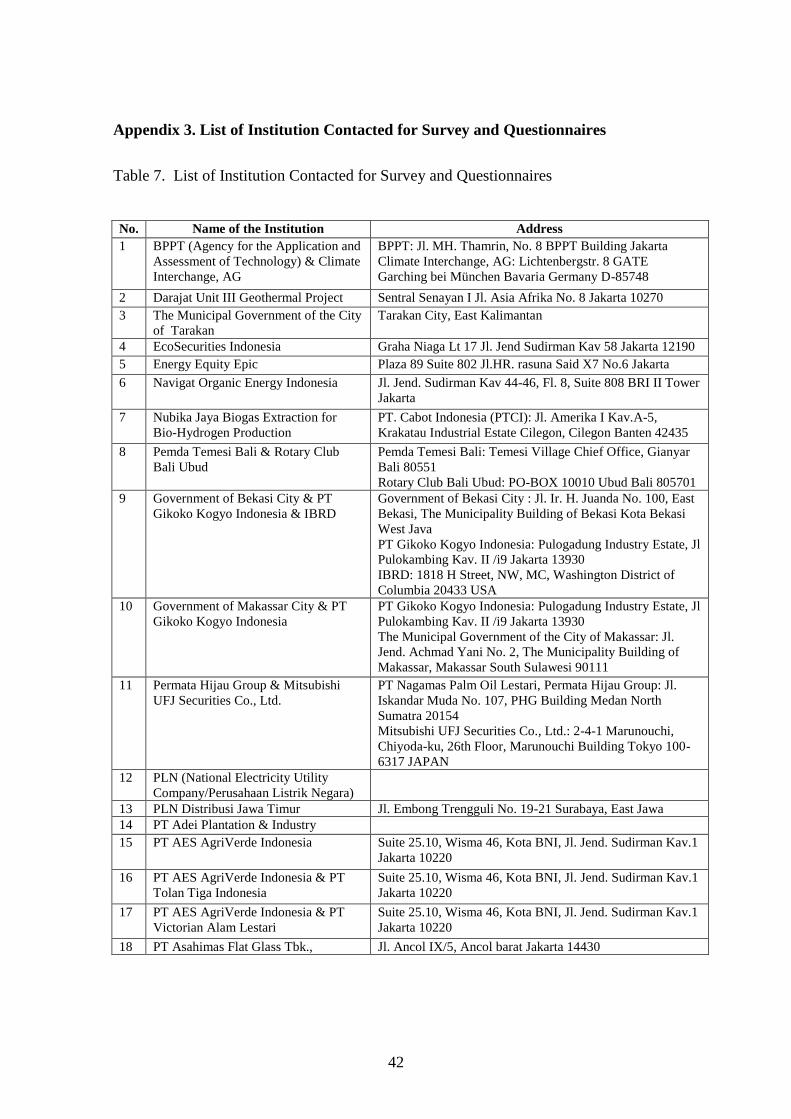
42
Appendix 3. List of Institution Contacted for Survey and Questionnaires
Table 7. List of Institution Contacted for Survey and Questionnaires
No. Name of the Institution Address
1 BPPT (Agency for the Application and
Assessment of Technology) & Climate
Interchange, AG
BPPT: Jl. MH. Thamrin, No. 8 BPPT Building Jakarta
Climate Interchange, AG: Lichtenbergstr. 8 GATE
Garching bei München Bavaria Germany D-85748
2 Darajat Unit III Geothermal Project Sentral Senayan I Jl. Asia Afrika No. 8 Jakarta 10270
3 The Municipal Government of the City
of Tarakan
Tarakan City, East Kalimantan
4 EcoSecurities Indonesia Graha Niaga Lt 17 Jl. Jend Sudirman Kav 58 Jakarta 12190
5 Energy Equity Epic Plaza 89 Suite 802 Jl.HR. rasuna Said X7 No.6 Jakarta
6 Navigat Organic Energy Indonesia Jl. Jend. Sudirman Kav 44-46, Fl. 8, Suite 808 BRI II Tower
Jakarta
7 Nubika Jaya Biogas Extraction for
Bio-Hydrogen Production
PT. Cabot Indonesia (PTCI): Jl. Amerika I Kav.A-5,
Krakatau Industrial Estate Cilegon, Cilegon Banten 42435
8 Pemda Temesi Bali & Rotary Club
Bali Ubud
Pemda Temesi Bali: Temesi Village Chief Office, Gianyar
Bali 80551
Rotary Club Bali Ubud: PO-BOX 10010 Ubud Bali 805701
9 Government of Bekasi City & PT
Gikoko Kogyo Indonesia & IBRD
Government of Bekasi City : Jl. Ir. H. Juanda No. 100, East
Bekasi, The Municipality Building of Bekasi Kota Bekasi
West Java
PT Gikoko Kogyo Indonesia: Pulogadung Industry Estate, Jl
Pulokambing Kav. II /i9 Jakarta 13930
IBRD: 1818 H Street, NW, MC, Washington District of
Columbia 20433 USA
10 Government of Makassar City & PT
Gikoko Kogyo Indonesia
PT Gikoko Kogyo Indonesia: Pulogadung Industry Estate, Jl
Pulokambing Kav. II /i9 Jakarta 13930
The Municipal Government of the City of Makassar: Jl.
Jend. Achmad Yani No. 2, The Municipality Building of
Makassar, Makassar South Sulawesi 90111
11 Permata Hijau Group & Mitsubishi
UFJ Securities Co., Ltd.
PT Nagamas Palm Oil Lestari, Permata Hijau Group: Jl.
Iskandar Muda No. 107, PHG Building Medan North
Sumatra 20154
Mitsubishi UFJ Securities Co., Ltd.: 2-4-1 Marunouchi,
Chiyoda-ku, 26th Floor, Marunouchi Building Tokyo 100-
6317 JAPAN
12 PLN (National Electricity Utility
Company/Perusahaan Listrik Negara)
13 PLN Distribusi Jawa Timur Jl. Embong Trengguli No. 19-21 Surabaya, East Jawa
14 PT Adei Plantation & Industry
15 PT AES AgriVerde Indonesia Suite 25.10, Wisma 46, Kota BNI, Jl. Jend. Sudirman Kav.1
Jakarta 10220
16 PT AES AgriVerde Indonesia & PT
Tolan Tiga Indonesia
Suite 25.10, Wisma 46, Kota BNI, Jl. Jend. Sudirman Kav.1
Jakarta 10220
17 PT AES AgriVerde Indonesia & PT
Victorian Alam Lestari
Suite 25.10, Wisma 46, Kota BNI, Jl. Jend. Sudirman Kav.1
Jakarta 10220
18 PT Asahimas Flat Glass Tbk., Jl. Ancol IX/5, Ancol barat Jakarta 14430

43
19 PT Asta Keramasan Energi, Climate
Change Capital Carbon Fund 2 SARL,
Climate Change Capital Carbon
Managed Account SARL
PT Asta Keramasan Energi: JL Jend Sudirman Kav 54-55
Plaza Bapindo, Mandiri Tower 20th Floor Jakarta 12190
Climate Change Capital Carbon Fund 2 SARL, Climate
Change Capital Carbon Managed Account SARL: 3 More
London Riverside London SE1 2AQ United Kingdom
20 PT Bahari Dwikencana Lestari &
EcoSecurities Group Plc.
PT Bahari Dwikencana Lestari: Jalan Dagan No. 6C Medan
North Sumatera 20113
EcoSecurities Group Plc.: 40 Dawson Street Dublin 02
Ireland
21 PT BUDI ACID JAYA (BAJ) &
SUMITOMO
PT. BUDI ACID JAYA: Jl. H.R. Rasuna Said Kav, C-6
Wisma Budi 8th, 9th floor Jakarta 12940
Sumitomo Corporation: 1-8-11, Harumi Chuo-ku Tokyo
Japan
22 PT Bukit Kapur Reksa (BKR) Jl. Belitung no. 1 Kawasan Industri Dumai (KID) Pelintung
Dumai
23 PT Cahaya Kalbar Tbk (CK) Jl. Raya Pluit Selatan Blok S No. 6. Jakarta
24 PT Cargill Indonesia & Ecosecurities PT. Cargill Indonesia: Plaza Bapindo Tower Citibank Lt. 23
Jl. Jend. Sudirman Kav. 54-55 Jakarta 12190
EcoSecurities Group Plc.: 40 Dawson Street Dublin 02
Ireland
25 PT Fajar Futura Luwu Energi Luwu,
Centre for Application and Assessment
of Energy Resources Technology,
Agency for the Application and
Assessment of Technology (BPPT),
The Chugoku Electric Power Co., Inc.
& Kajima Corporation
PT Fajar Futura Luwu Energi Luwu: Jl Tanjung Duren Raya
No. 12 Jakarta
BPPT: Jl. M.H. Thamrin no.8 BPPT building 2nd, 22nd flr.
Jakarta
The Chugoku Electric Power Co., Inc.: 4-33, Komachi,
Naka-ku, Hiroshima, Hiroshima Prefecture 730-8701 Japan
Kajima Corporation: 3-7-1 Nishi Shinjuku Shinjuku-ku,
Shinjuku Park Tower 29F, Tokyo 163-1029 Japan
26 PT Fetty Mina Jaya Jalan Rajawali No.45, Sukajadi Pekanbaru Riau Province
27 PT Gandaerah Hendana, PT Enviro
Mitra Abadi & EcoSecurities Group
Plc.
PT Gandaerah Hendana: Jl. Jend. Sudirman kav.1 Gedung
Wisma 46 Kota BNI – Unit 16.09 Jakarta 14440
PT Enviro Mitra Abadi: Jl. Raya Pluit Selatan Blok S no.8 /
Unit 9 -10 Jakarta 14440
EcoSecurities Group Plc.: 40 Dawson Street Dublin 02
Ireland
28 PT Gikoko Kogyo Indonesia Pulogadung Industry Estate, Jl Pulokambing Kav. II /i9
Jakarta 13930
29 PT Gikoko Kogyo Indonesia, The
Municipal Government of the City of
Pontianak, West Kalimantan,
Indonesia & IBRD (Netherlands)
PT Gikoko Kogyo Indonesia: Pulogadung Industry Estate, Jl
Pulokambing Kav. II /i9 Jakarta 13930
The Municipal Government of the City of Pontianak: Jalan
Rahadi Usman No. 2, Kantor Walikota Pontianak, Province
of West Kalimantan
IBRD: 1818 H Street, NW, MC, Washington District of
Columbia 20433 USA
30 PT Great Giant Pineapple (GGP) Terbanggi Besar Km 77 Terbanggi Besar Lampung Tengah
31 PT Harapan Sawit Lestari, Cargill
International SA & EcoSecurities
Group Plc.
PT Harapan Sawit Lestari: Manis Mata Kantor Pusat
Kabupaten Ketapang Propinsi Kalimantan Barat
Cargill International SA: 14 chemin de Normandie Geneva
1206 Switzerland
EcoSecurities Group Plc.: 40 Dawson Street Dublin 02
Ireland
32 PT Holcim Indonesia Tbk & Holcim
Group Support Ltd
PT Holcim Indonesia Tbk: Jl Jenderal Gatot Subroto No. 38,
Menara Jamsostek, North Tower, 15th floor Jakarta 12930
Holcim Group Support Ltd: Hagenholzstrasse 85 Zürich
8050 Switzerland

44
33 PT Indo Matra Power & Sindicatum
Carbon Capital
PT Indo Matra Power: Jl. Darmawangsa VI – 37 Kebayoran
Baru Jakarta 12160
Sindicatum Carbon Capital: Hanover Square, 18, London
W1S 1HX UK
34 PT Indocement Tunggal Prakarsa Jl. Jenderal Sudirman Kav. 70-71 Wisma Indocement
Jakarta 12910
35 PT Indonesia Power & Agency for the
Assessment and Application of
Technology (BPPT) & The Chugoku
Electric Power Co., Inc.
PT. Indonesia Power: Jl. Jend. Gatot Subroto Kav. 18
Jakarta
The Chugoku Electric Power Co., Inc.: 4-33, Komachi,
Naka-ku, Hiroshima Prefecture 730-8701 Japan
BPPT: Jl. M.H. Thamrin BPPT building 2nd, 22nd Fl.
Jakarta
36 PT Indotirta Suaka Jalan Culindo Lestari Blok B 3/4 Komplek Tiban Kencana
Batam 29421
37 PT Intibenua Perkasatama Jalan KL Yos Sudarso, Spring Tower 02-21 Tanjun Mulia-
Medan, North Sumatera 20241
38 PT Karya Makmur Bahagia &
EcoSecurities
PT Karya Makmur Bahagia: Jalan Sungai Sambas IV no.
24A Jakarta
EcoSecurities Group Plc.: 40 Dawson Street Dublin 02
Ireland
39 PT Listrindo Kencana, PT Sawindo
Kencana & Misubishi UFJ Securities
PT Listrindo Kencana: Jl. Raya Perjuangan No. 88GK,
Graha Kencana Building Jakarta 11530
PT Sawindo Kencana: Jl. Raya Perjuangan No. 88GK,
Graha Kencana Building Jakarta 11530
Misubishi UFJ Securities: 2-4-1 Marunouchi, Chiyoda-ku,
Level 26th Marunouchi Building Tokyo Japan
40 PT Manunggal Energi Nusantara Jl. Gatot Subroto Kav. 22, 2ndFloor Wisma Argo
Manunggal Jakarta 12930
41 PT Manunggal Energi Nusantara &
Mitsubishi UFJ Securities Co. Ltd
PT Manunggal Energi Nusantara: Jl. Gatot Subroto Kav. 22,
2nd Floor Wisma Argo Manunggal Jakarta 12930
Mitsubishi UFJ Securities Co. Ltd: 2-5-2 Marunouchi,
Chiyoda-ku, 2F, Mitsubishi Building Tokyo 100-0005 Japan
42 PT Medco Energi Oil & Gas PT Medco Energi Internasional Tbk: Jl. Jend. Sudirman
Kav.58 Graha Niaga Office Tower 16th floor Jakarta
Selatan 12190
PT Medco LPG Kaji: Jl. T. B. Simatupang Plaza 3 Pondok
Indah Blok B2-2 Jakarta Selatan 12310
PT Medco E&P Indonesia: Jl. Gatot Subroto Kav. 71-73
Bidakara Office Building Jakarta 12870
43 PT Mega Power Mandiri Jl. Amil Raya No. 7, Buncit Raya Jakarta 12741
44 PT Multi Nitrotama Kimia &
Sindicatum Carbon Capital Ltd
PT Multi Nitrotama Kimia: Menara Kebon Sirih 20th Floor
JL Kebon Sirih N0 17-19 Jakarta 10340
Sindicatum Carbon Capital Ltd.: 18 Hanover Square
London W1S 1HX UK
45 PT Multimas Nabati Asahan Jalan Imam Bonjol No. 7, Gedung Bank Mandiri Lantai V
Medan North Sumatera 2011
46 PT Murini Samsam (MSS) Jalan Imam Bonjol No. 7 Gedung Bank Mandiri Lantai V
Medan North Sumatera 20112
47 PT Musim Mas Jalan KL Yos Sudarso Km 7,8, Kelurahan Tanjung Mulia
Kecamatan Medan Deli Medan North Sumatra
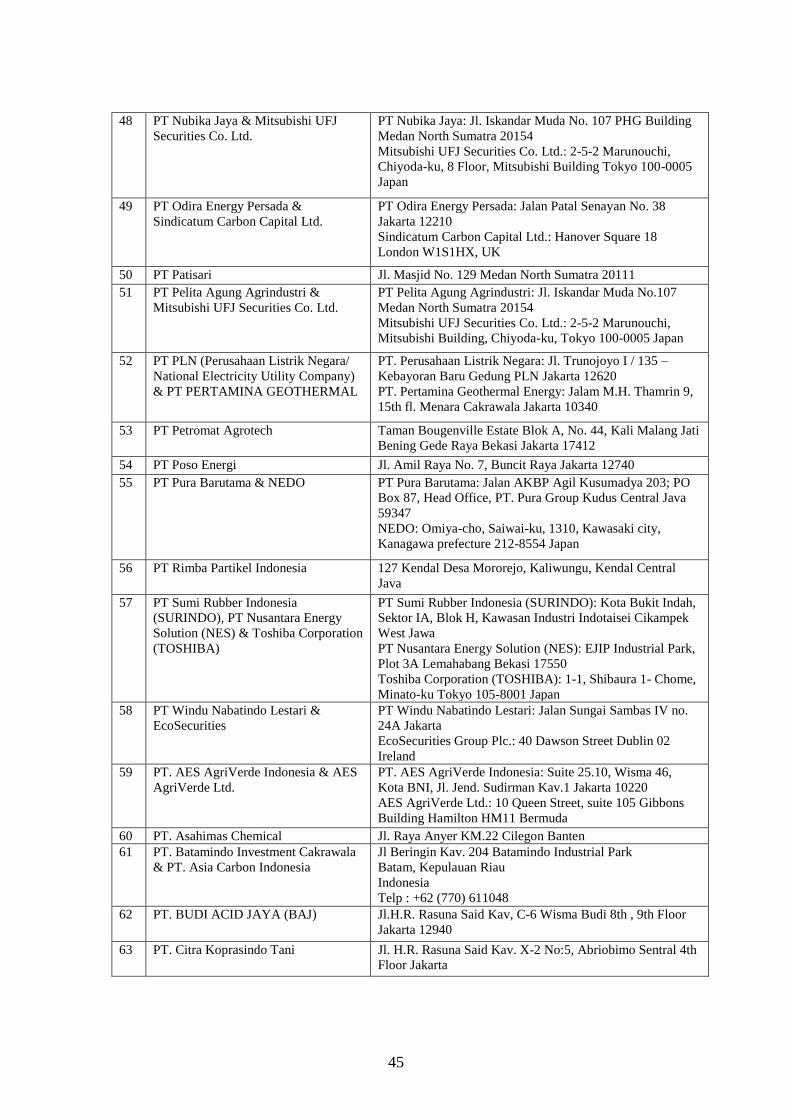
45
48 PT Nubika Jaya & Mitsubishi UFJ
Securities Co. Ltd.
PT Nubika Jaya: Jl. Iskandar Muda No. 107 PHG Building
Medan North Sumatra 20154
Mitsubishi UFJ Securities Co. Ltd.: 2-5-2 Marunouchi,
Chiyoda-ku, 8 Floor, Mitsubishi Building Tokyo 100-0005
Japan
49 PT Odira Energy Persada &
Sindicatum Carbon Capital Ltd.
PT Odira Energy Persada: Jalan Patal Senayan No. 38
Jakarta 12210
Sindicatum Carbon Capital Ltd.: Hanover Square 18
London W1S1HX, UK
50 PT Patisari Jl. Masjid No. 129 Medan North Sumatra 20111
51 PT Pelita Agung Agrindustri &
Mitsubishi UFJ Securities Co. Ltd.
PT Pelita Agung Agrindustri: Jl. Iskandar Muda No.107
Medan North Sumatra 20154
Mitsubishi UFJ Securities Co. Ltd.: 2-5-2 Marunouchi,
Mitsubishi Building, Chiyoda-ku, Tokyo 100-0005 Japan
52 PT PLN (Perusahaan Listrik Negara/
National Electricity Utility Company)
& PT PERTAMINA GEOTHERMAL
PT. Perusahaan Listrik Negara: Jl. Trunojoyo I / 135 –
Kebayoran Baru Gedung PLN Jakarta 12620
PT. Pertamina Geothermal Energy: Jalam M.H. Thamrin 9,
15th fl. Menara Cakrawala Jakarta 10340
53 PT Petromat Agrotech Taman Bougenville Estate Blok A, No. 44, Kali Malang Jati
Bening Gede Raya Bekasi Jakarta 17412
54 PT Poso Energi Jl. Amil Raya No. 7, Buncit Raya Jakarta 12740
55 PT Pura Barutama & NEDO PT Pura Barutama: Jalan AKBP Agil Kusumadya 203; PO
Box 87, Head Office, PT. Pura Group Kudus Central Java
59347
NEDO: Omiya-cho, Saiwai-ku, 1310, Kawasaki city,
Kanagawa prefecture 212-8554 Japan
56 PT Rimba Partikel Indonesia 127 Kendal Desa Mororejo, Kaliwungu, Kendal Central
Java
57 PT Sumi Rubber Indonesia
(SURINDO), PT Nusantara Energy
Solution (NES) & Toshiba Corporation
(TOSHIBA)
PT Sumi Rubber Indonesia (SURINDO): Kota Bukit Indah,
Sektor IA, Blok H, Kawasan Industri Indotaisei Cikampek
West Jawa
PT Nusantara Energy Solution (NES): EJIP Industrial Park,
Plot 3A Lemahabang Bekasi 17550
Toshiba Corporation (TOSHIBA): 1-1, Shibaura 1- Chome,
Minato-ku Tokyo 105-8001 Japan
58 PT Windu Nabatindo Lestari &
EcoSecurities
PT Windu Nabatindo Lestari: Jalan Sungai Sambas IV no.
24A Jakarta
EcoSecurities Group Plc.: 40 Dawson Street Dublin 02
Ireland
59 PT. AES AgriVerde Indonesia & AES
AgriVerde Ltd.
PT. AES AgriVerde Indonesia: Suite 25.10, Wisma 46,
Kota BNI, Jl. Jend. Sudirman Kav.1 Jakarta 10220
AES AgriVerde Ltd.: 10 Queen Street, suite 105 Gibbons
Building Hamilton HM11 Bermuda
60 PT. Asahimas Chemical Jl. Raya Anyer KM.22 Cilegon Banten
61 PT. Batamindo Investment Cakrawala
& PT. Asia Carbon Indonesia
Jl Beringin Kav. 204 Batamindo Industrial Park
Batam, Kepulauan Riau
Indonesia
Telp : +62 (770) 611048
62 PT. BUDI ACID JAYA (BAJ) Jl.H.R. Rasuna Said Kav, C-6 Wisma Budi 8th , 9th Floor
Jakarta 12940
63 PT. Citra Koprasindo Tani Jl. H.R. Rasuna Said Kav. X-2 No:5, Abriobimo Sentral 4th
Floor Jakarta

46
64 PT. Indah Kiat Pulp and Paper, Tbk WIK Serpong Jl. Raya Serpong KM.8 Tangerang, Banten
65 PT. Indo Bharat Rayon Jl. Raya Curug KM 10 Desa Cilangkap Kec. Babakan Cikao
Purwakarta West Java
66 PT. Indo Karya Kimia Desa Dawuan Kec.Cikampek, Kab Karawang, Propinsi
West Java
67 PT. Indonesia Asahan Aluminium &
South Pole Carbon Asset Management
Ltd & PT. Carbon and Environmental
Research
PT. Inalum: PO BOX 1 Kuala Tanjung North Sumatera
South Pole Carbon Asset Management Ltd.:
Technoparkstrasse 1 Zurich 8005 Switzerland
68 PT. Krakatau Steel Jl. Industri No.5, PO.BOX 14 Cilegon 42435 Banten
69 PT. Molindo Raya Sumber Waras 255 Lawang Malang East Java
70 PT. Pembangkit Jawa Bali Jl. Ketintang Baru No.11 Surabaya 60231 East Java
71 PT. Prakarsa Tani Sejati & Aretae
Limited
PT. Prakarsa Tani Sejati: Jl. Pembangunan I, No. 3 Jakarta
10130
Aretae Limited: 9 Castle Street, Elizabeth House, St. Helier
JE4 2QP, Jersey
72 PT. Riau Andalan Pulp and Paper Jl. Teluk Betung No.31 Jakarta
73 PT. Rimba Partikel Indonesia Desa Mororejo Kaliwungu Kendal PO BOX 127 Central
Java
74 PT. Rohul Sawit Industri &
EcoSecurities
PT. Rohul Sawit Industri: Jalan Sungai Sambas IV no. 24A
Jakarta
EcoSecurities Group Plc.: 40 Dawson Street Dublin 02
Ireland
75 PT. Semen Bosowa Desa Baruga Kecamatan Bantimurung Maros
76 PT. Semen Gresik Jl. Veteran, Gresik 61122 East Java
77 PT. Semen Tonasa Jl. Tonasa II Pangkep
78 PT. Sulawesi Mini Hydro Power Jl. Raya Dermaga Duren Sawit, Ruko Duren Sawit Center
No. 9E, Jakarta 13440
79 PT.Pindo Deli Pulp and Paper Mills Prof.Dr.Ir.H. Sopetami 88 Karawang,West Java
80 PT.YTL Jawa Timur Jl. Raya Surabaya Situbondo KM.141 Paiton 67291
Probolinggo
47
Appendix 4. Summary of Projects Information Obtained from Survey Activity
1. Bali Biogas Program
Name of the Project : Bali Biogas Program
Project participants : PT. Mulya Tiara Nusa, technology provider
Location : Bangli, Tabanan, and Badung Regencies, Bali
Project Costs and
Source
: Total Investment : IDR 15,000,000,000
80% in the form of loan from Bank Syariah Mandiri
20% from PT. Mulya Tiara Nusa
Summary :
Project activity is installation of 3000 units of biodigesters which capture and utilise
methane from cattles and pigs manure in three regencies in Bali Province. The project
aims at reducing methane emissions released by livestock waste by converting it into
biogas and utilized it for household activities. The biogas produced will replace the
use of woods and kerosene for cooking activities.
Currently, cattles and pigs manure from small scale farms are discharged to an open
space without any treatment. Through this project activity, cattles and pigs manure
will be captured and hold in biodigester unit. The manure will be kept for 5 days to
produce methane gas and slurry under anaerobic process. Captured methane will be
used for cooking in order to reduce greenhouse gas emissions.
The Bali Biogas Programme is the first mass biogas project in Indonesia that started
on November 2007. Funding assistance for the project is partially provided by the
fund from Ministry of Environment through Bank Syariah Mandiri and PT. Mulya
Tiara Nusa (MTN).
Installation of biodigesters is being conducted in several stages. Total of 1200 units
are targeted to be installed in 2008 while the remaining 1800 units are planned to be
installed in 2009.
Carbon credit aspect of the project is being developed under Voluntary Gold
Standard. The project developer has also engaged in a VER purchase agreement with
a UK institution.

48
Figure 13. Biodigester used in the Bali Biogas Program
2. Bandung Hotels Energy Efficiency
Name of the Project : Bandung Hotels Energy Efficiency
Project participants : Bandung Hotel Association
Location : Several hotels in Bandung including : Grand Hotel
Preanger, Homann Hotel, Pasundan Tower Hotel,
Horizon Hotel, and Papandayan Hotel
Project Costs and
Source
: No data Available
100% funded by each hotels
Summary :
In order to overcome fuel crisis, Bandung Hotel Association has an idea to promote
energy efficiency activity. Activity suggested were replacement of old air
conditioners with more energy efficient version, displacement of diesel to fuel water
heater system with gas.
Several Hotels were took the initiatives and proved that implementation of energy
efficiency contributed significantly to saving of operational costs, in this case up to 14
million rupiahs per month.
The main barrier of this project is on financial issue since replacements of new air
conditioning need a high investment. Other barrier is hotel policies which discourage
energy efficiency measures. For example, management of several hotels refused to
switch the ordinary lamp into more efficient lamp because they were afraid the hotel
guests will become uncomfortable with this change.

49
3. Biomass Power Plant at PT. Rimba Partikel Indonesia
Name of the Project : Biomass Power Plant PT. Rimba partikel Indonesia
Project participants : PT. Rimba partikel Indonesia
Sumitomo Forestry Co. Ltd.
Location : Monorejo Village, Kaliwungu Subdistrict, Kendal
Regency, Central Java Province
Project Costs and
Source
: USD 6.4 million without CDM transaction cost, while
the CDM transaction cost itself is about USD 1.1 million
(not the exact number, they only willing to give an
estimation)
45% equity, 55% debt (source of debt is confidential)
Summary :
PT. Rimba Partikel Indonesia (RPI) is a manufacturing company located in Kendal -
Central Java that produces particleboard.
The proposed project activity is the construction and operation of new heat (steam
boiler) and power generation system (± 4 MW) using biomass waste to replace the
existing diesel based power generation. The steam generated from the boiler system
will be used for wood chips processing and electricity production (steam power
plant). Estimated emission reduction from the activity is 14,858 ton CO2eq per year.
Barriers identified is (i) financial barriers due to high investment cost of more than
USD 7 million. To overcome this issue, RPI has obtained a loan from a financing
institution; (ii) technological barriers with regard to energy stability on combustion in
application of wood biomass alone (rather than mix coal and biomass). To handle the
problem, RPI devised a system for fuel introduction, furnace capacity, combustion
method and removal of combustion ash in order to stabilize combustion energy.
4. Bogor City Trans Pakuan
Name of the Project : Bogor City Trans Pakuan
Project participants : Bogor City Government
Location : Bogor City, West Java
Project Costs and Source : About 10 billion rupiahs (equivalent to about
USD 1,000,000) funded through Bogor City
budget
Summary :
There are several environmental issues in Bogor City. Some of these issues are traffic
congestion and air pollution. These problems‟ solution is supported by the City
Management Priorities 2004-2009, which stated transportation issue as the first issue
to be solved. Corporate emission from transportation is 67.63% while community
emission from transportation is 23.61%. One of Local Government effort in reducing
GHG and increasing city transportation service is initiating mass transportation mode
50
by developing Bus Rapid Transit (BRT) for replacing small public vehicle gradually.
Objectives of mass rapid transit program are (i) changing Small Public Vehicle - SPV
(1.000-1.500 cc minibus) with larger capacity vehicle to meet the street spaces
efficiency, (ii) improving the mass rapid transit‟ quality service, and (iii) improving
the occupational mobility and discipline culture. This program aims to develop an
efficient and qualified mass rapid transit system, which creates a good, safe, and
comfortable traffic. The bus can only stop in the shelter, with height of shelter is 70
cm. Type of the bus is Airconbus with 18 seats and 17 stands.
The benefits of implementing BRT are efficiency of fuel consumption and reduce
CO2 emission up to 52.3 %. Per unit of BRT (4.500 cc diesel engine) will replace 3
units of SPV (1.000-1.500 cc gasoline engine). The project was initiated by Bogor
City Government with 10 buses in year 2007 and another 20 buses in year 2008. It is
managed by Bogor City government through PD. Jasa Transportasi as local company.
Trans Pakuan is one of business unit on PD Jasa Transportasi‟s transport service. PD
Jasa Transportasi is planning to replace 1.376 SPV served selected route (from total
of 10.401 SPV) which equal to 459 buses in 2015.
30 units of SPV which consumed 47.500 liter gasoline per year emit about 1.246 tons
CO2 emission, while 10 units BRT which consumed 219.000 liter diesel fuel per year
emit 594.21 tons CO2 emission. It means that through replacement of 30 units SPV
and operating 10 units BRT, CO2 emission would decrease about 651.79 tons CO2 or
52.3%. Trans Pakuan operated based on PERDA (local government regulation) Kota
Bogor No. 5 year 2007, in which the 10 billion rupiahs capital of PD Jasa
Transportation is from Bogor City Government budget. 60% of the basic capital has
been deposited when PD Jasa Transportation is built, and the remaining will be paid
by Local Government within five years by observing the balance report. About 55%
of the net profit after tax is shared to local government. However, this arrangement
will taking effect only if the basic capital has been paid in full.
Operational activity of the project is monitored by Board of Controller (Badan
Pengawas). Its authority is to assess and give approval or rejection to both activity
plan and budget as well as finance report. All of the monitoring report is delivered to
Mayor of Bogor City. The Board of Controller is consisting of local government
element and elite figure/professional personal, such as DLAJ (Traffic, Land
Transportation, and Road Agency), Kepolisian (Police), dan Organda (public land
transportation association).
Initially the buses used diesel oil as fuel, but after PD Jasa Transportasi develop a
cooperation with PT Bumi Engeri Equatorial (PT BEE), who supplies biodiesel oil,
all of buses fueled by mix fuel of diesel fuel and biodiesel with comparison of 1 liter
BDF: 4 liters diesel.
Before local government decided to launch the Trans Pakuan buses, they made a
feasibility study, conducted by an independent institution. During the initial stage of
the project implementation, there was a problem with other public transportations‟
drivers who felt that the project implementation would reduce their income. By that
time, Bogor City government transferred public transportation that has same route
with Trans Pakuan buses to area that there does not having any public transportation
yet.
During the period of April 2007 up to September 2008, PD Jasa Transportasi is

51
experiencing loss. Total loss up to September 2008 is equal to Rp 816.129.374. Based
on calculation for cost of goods sold, ideal ticket price for Trans Pakuan was Rp
6.964,48, while ticket sold only equal to Rp 3.000. PD Jasa Transportation gives
subsidy equal to Rp 3.964,48. Income from sale of ticket up to September 2008 is Rp.
1.558.329.500. It is estimated that by the end of December 2008 income comes from
ticket selling will be about Rp 2.077.772.664. Other income sources are from Giro
account and etc., given total income of Rp 2.108.314.788 at end of December 2008.
Operational expenses‟ of Trans Pakuan up to December 2008 is 48.46% of budget.
Other expenses are sourced from bank administration, tax, etc. So total current cost
equal to Rp 3.196.487.281. There is no other source of capital, except from Bogor
City Budget. Other cost besides operational cost is cost for auditing or feasibility
study.
Other technical support came from Ministry of Transportation who donated buses. In
year 2007, Ministry of Transportation donated 10 buses type ¾ to be tested as public
transportation in Bogor. This 10 unit buses is included as deposited basic capital from
local government. Later during project implementation, Ministry of Transportation
donated another 20 buses which will be operated in December 2008.
This project did not involve any local NGOs.
5. Bus Rapid Transit : Trans Jakarta
Name of the Project : Bus Rapid Transit : Trans Jakarta
Project participants : Jakarta City Government, private investors
Location : Jakarta
Project Costs and
Source
: 858 billion rupiah for adding three more corridors in
2008. average cost for constructing each corridor : 286
billion rupiahs
Operational cost, 15 billion rupiahs per year
Source of fund : APBD Jakarta
Summary :
As many major cities, Jakarta is plagued with complex transportation problems. In
last few years the problems getting worse and can be foreseen to become a major
problem in the future. Without fundamental changes to transportation policies, it is
estimated that Jakarta will be stuck in a gridlock by 2014. In response to this, the
government has been searching for the best solution to be implemented. Finally in
2003 the Jakarta Master Plan was compiled.
The Trans Jakarta system was started operating in Jakarta at the beginning of 2004
and are being gradually expanded. The implementation of Trans Jakarta is regulated
through Local Regulation (PERDA) No.12 year 2003. By early 2007, Jakarta operates
7 corridors of Trans Jakarta, and by 2008 is expected to operate 10 corridors.
Currently, Trans Jakarta operational activity is managed by a Badan Layanan Umum
(Public Service Unit) as a technical unit under Jakarta City Government. This unit has
a direct coordination with Jakarta City‟s Transportation Agency (Dinas Perhubungan)

52
Jakarta.
Annual Trans Jakarta operational cost is about 15 billion rupiahs. When the project
started, all cost (15 billion rupiahs) was covered by Jakarta City Government, in
which 6 billion rupiahs of it was provided as soft loan. This loan is given periodically.
Per month, the Trans Jakarta operator will pay the loan return from their income to
the Jakarta City‟s Local Finance Office.
Initially, the bus provisioning was held by Municipal Government of Jakarta, but then
it was thought to be conducted in cooperation with private investors. These private
investors are public transport companies such as PPD, Mayasaribakti, and Bianglala
company.
For the example for financial case, we can use the calculation made by the consultant
According to Ernst & Young calculation (Ernst & Young is an independent financial
consultant hired by Jakarta Government). Total operational cost of Trans Jakarta for
Corridor I (Blok M-Kota) is 6,500 IDR/km, and the BEP will be reached when
passengers total is 37,565 person/day.
Based on the data assumption, Ernst & Young also calculated total income of Trans
Jakarta since February 1st up to July 11
th 2004 (160 operational days) as follows :
Income = 37,565 person/ day x 160 days x ticket price
= 37,565 person/day x 160 days x Rp 2,500
= Rp 15,026,000,000
Meanwhile, according to the data from Trans Jakarta‟ operational agency, the actual
income of Trans Jakarta in 160 operational days, with total of 7,405 million
passengers is : 7. 405.827 passengers x Rp 2,500
= Rp 18,514,567,500
Based on that calculation, Trans Jakarta Operational Agency total profit, in 160
operational days since February 1st till July 11
th 2004 : Rp 18.514.567.500 - Rp
15.026.000.000 = Rp 3.488.567.500
Total operational costs are consisting of: Trans Jakarta Operational Agency cost,
ticket operator cost, shelter operational cost and depreciation cost.
Social aspects became the main challenge, since the new transportation system (Trans
Jakarta) will change public‟s transportation behavior. Peoples who were previously
use private cars for example, was encouraged to use the Trans Jakarta. Another issue
was raised by public buses operators who felt that the operation of Trans Jakarta will
reduce their income. To overcome these issues, Jakarta City Government conducted
socialization events and talk show to public through media such as television and
newspapers.
Up to November 2008, Trans Jakarta has operated 295 units, with detail as follows:
Corridor 1 : operating 91 units with all units using diesel fuel

53
Corridor 2 : operating 55 units with all units using natural gas fuel
Corridor 3 : operating 71 units with all units using natural gas fuel
Corridor 4 : operating 30 units with all units using natural gas fuel
Corridor 5 : operating 17 units with all units using natural gas fuel
Corridor 6 : operating 31 units with all units using natural gas fuel
Corridor 7 : operating 51 units with all units using natural gas fuel
6. Gianyar Waste Recovery Project
Name of the Project : Gianyar Waste Recovery Project
Project participants : Local Government of Gianyar and Rotary
Club Bali Ubud
Location : Temesi Village, Gianyar Regency, Bali
Project Costs and
Source
: USD 300,000
Multi-donors (SDC, USAID, IDRC), Local
Government of Gianyar, and Rotary Clubs
Summary :
Gianyar Regency is one of the wealth regencies in Bali Province. The regency is well
known as artisans‟ regency, wooden sculpture, silver and gold smiths, agriculture,
handicrafts and tourism are the main economic activities of Gianyar. Located
approximately 70 km to the east of Denpasar, the populations of Gianyar is about
416,728 inhabitants. About 200 ton wastes per day generated but only 50% of it is
brought to the landfill, the rest are ended up at the illegal dumping sites in several
places.
The Temesi landfill operates in conventional open dumping system, create foul smell
and pollute the rice fields. To avoid methane release generated from the landfill, the
project treat about 50% of waste bring to the landfill which are mostly organic wastes
and turn it into compost to be used as soil conditioners. Run by the local community,
supervise by GUS Foundation and the Rotary Club (RC) Ubud, the project is
implemented in coordination with the local government of Gianyar Regency.
Started in February 2004, a 400 m2 Material Recovery Facility (MRF) was built in
Temesi landfill with the support of USAID/OTI, SDC, Rotary Club Hamburg, Rotary
Club Atlanta, Rotary Club Ubud, and BALIFOKUS BORDA, for technical assistant.
The facility, which designed to manage 80 m3/day or equal to 20 trucks/day of wastes,
was inaugurated in June 2004 and run by the Village Waste Management Council with
the supervision from RC Ubud and BALIFOKUS. Starting of 2006, BALIFOKUS role
replaced by GUS Foundation. During that period the RC Ubud approached IDRC
Canada to get the support for carbon credit potential assessment. IDRC provide
supports for voluntary carbon credit through Gold Standard. IDRC also support the
development of Environmental Theme Park at the landfill site.
The activities implemented were:
54
- detail engineering design (DED) development
- construction of the facility
- waste segregation
- composting using force aerobic technique
- training for workers
- environmental education for children, students and public in general
Main outcomes
Create employments for 60 workers
Compost production approximately 50 ton/month sold at the price of Rp.1000/kg.
Potential revenues from composts are approximately Rp. 50 millions
Annual operation and maintenance cost is approximately Rp. 120 millions.
Apply approved methodology IIIF Avoidance of methane production from biomass
decay through composting (Version 03, 23 December 2006)
Total carbon emissions reduction 70,000 ton e-CO2 for 10 years or about in
average about 7,696 ton e-CO2/year
Total investment cost of project‟s infrastructure was about US$ 150,0002 received
from several donors (Swiss Development Cooperation/SDC, USAID, Rotary Club
Hamburg, Rotary Club Atlanta, JICA, Bali hoteliers, etc.). Another US$ 120,000
still needed to improve and expand the facility operations.
No information about Gold Standard transaction costs. But IDRC Canada was
provide funding support about approximately US$ 126,500 (CAD 180,800) to
develop the PDD and other carbon credit related modalities.
Credit period is 10 years
Carbon buyer is KUONI, Swiss-based travel agent. No information available about
the carbon price agreed in the transaction.
About 10% of the ERs goes to LG of Gianyar
The Temesi villagers enjoy the benefits of 7% from the ERs
Barriers identified:
Financial barriers : Infrastructure investment was quite high
Tecnonology Barriers : Need to explore different composting methods
Institutional barrier : Institutional set up is still heavily coordinated
Social Barrier : Temesi villagers and NGO need more capacity building to be able
to manage and monitor the project in the future in a proper way

55
Figure 14. One of the illegal dumpsite in Gianyar
Figure 15. New composting facility designed for capacity to handle waste about 100
ton/day
Figure 16. Composting process using forced aeration technique
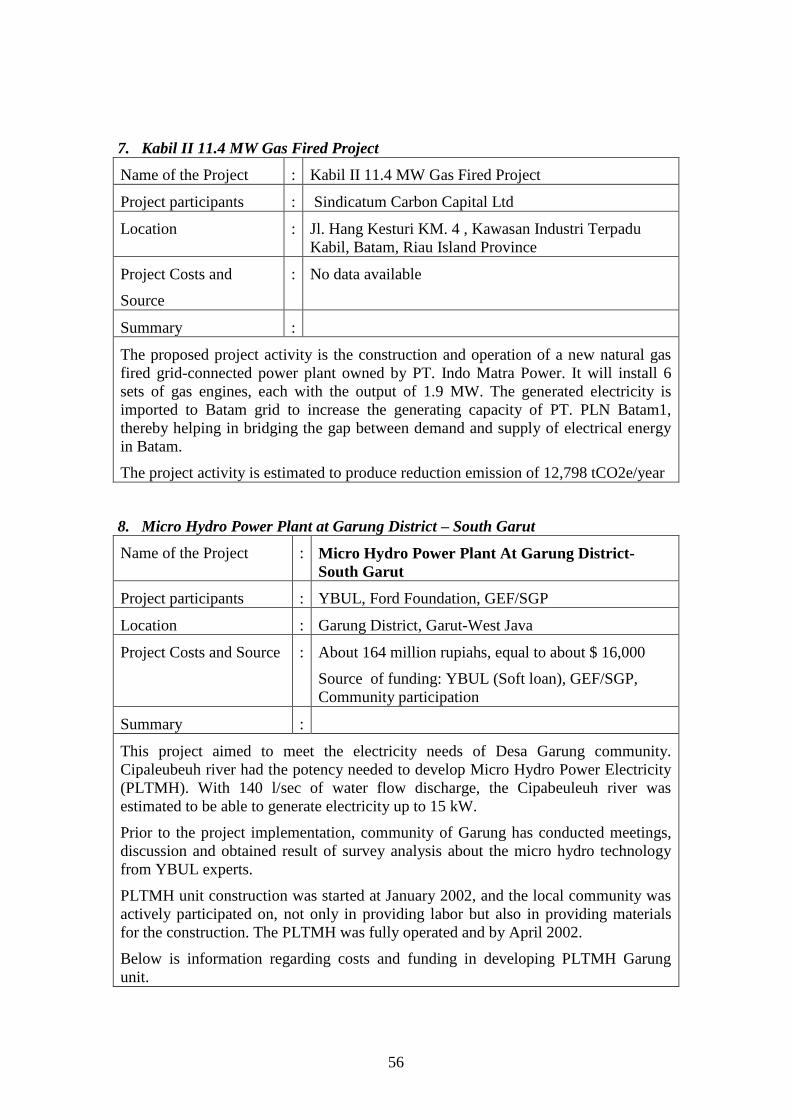
56
7. Kabil II 11.4 MW Gas Fired Project
Name of the Project : Kabil II 11.4 MW Gas Fired Project
Project participants : Sindicatum Carbon Capital Ltd
Location : Jl. Hang Kesturi KM. 4 , Kawasan Industri Terpadu
Kabil, Batam, Riau Island Province
Project Costs and
Source
: No data available
Summary :
The proposed project activity is the construction and operation of a new natural gas
fired grid-connected power plant owned by PT. Indo Matra Power. It will install 6
sets of gas engines, each with the output of 1.9 MW. The generated electricity is
imported to Batam grid to increase the generating capacity of PT. PLN Batam1,
thereby helping in bridging the gap between demand and supply of electrical energy
in Batam.
The project activity is estimated to produce reduction emission of 12,798 tCO2e/year
8. Micro Hydro Power Plant at Garung District – South Garut
Name of the Project : Micro Hydro Power Plant At Garung District-
South Garut
Project participants : YBUL, Ford Foundation, GEF/SGP
Location : Garung District, Garut-West Java
Project Costs and Source : About 164 million rupiahs, equal to about $ 16,000
Source of funding: YBUL (Soft loan), GEF/SGP,
Community participation
Summary :
This project aimed to meet the electricity needs of Desa Garung community.
Cipaleubeuh river had the potency needed to develop Micro Hydro Power Electricity
(PLTMH). With 140 l/sec of water flow discharge, the Cipabeuleuh river was
estimated to be able to generate electricity up to 15 kW.
Prior to the project implementation, community of Garung has conducted meetings,
discussion and obtained result of survey analysis about the micro hydro technology
from YBUL experts.
PLTMH unit construction was started at January 2002, and the local community was
actively participated on, not only in providing labor but also in providing materials
for the construction. The PLTMH was fully operated and by April 2002.
Below is information regarding costs and funding in developing PLTMH Garung
unit.

57
Table 8. Costs and funding in developing PLTMH Garung unit
Amount Application Remark
IDR 32.500.000 Capacity building and
institutionalizing the community
Grant from GEF/SPG
IDR 117.000.000 Engineering, supply and
electricity generator construction
Soft loan from YBUL
IDR 13.678.000 Cost for construction of the
generator and electricity
transmission unit
Community
participation
IDR 350.000 Connection installation to the
house
Paid by customer
upon installation of
the electricity
connection
IDR 7.200.000 Operational and maintenance
expenses of the electricity
generator unit
Annual expenses
IDR 15.000 Customer contribution Paid by customer
every month
PLMTH supply electricity of 220 volt to each house. Initially there were 35 houses
participating as the consumer, but by December 2004 it was increased to be 87 house
Beside for domestic lighting, the electricity is useful for economic development such
as hulling flour, lighting for home industry and also to operate satellite phone
communication, and to access information through television.
To manage the electricity at Garung area, the local community established a
Community Financial Management Organization (Lembaga Pengelolaan Keuangan
Masyarakat - LPKM), its activity ranges from collecting payment from houses up to
PLTMH‟ maintenance. The LPKM consist of several people chosen by the
community to manage PLTMH. Beside the LPKM, there is also a monitoring board
which consists of Mosque Management Comitee (DKM) and local house group
comitee.
The LKPM were given PLTMH operator training to increase their capacity building
in operating and maintaining PLTMH unit. The LPKM‟ management is responsible
for give periodic report to the community meeting.
With training, PLTMH operator is expected to be able to solve technical problem
when performing maintenance. PLTMH operator has knowledge about electricity
generation component and is able to do minor repair.
58
9. Surabaya Household Waste Management
Name of the Project : Management of Households Organic Waste
Project participants : Kalirungkut Village, Surabaya
Location : Citizens, Pusdakota and Surabaya City Government
Project Costs and
Source
: No data Available
Summary :
The activity is part of Kitakyushu Techno-Cooperation Assistance (KITA). KITA
provides assistance in terms of provisioning expert. On implementation of the
activity, KITA cooperated with NGO and local government.
Since year 2000, citizens of Kalirungkut Village have segregated its wastes into
organic and non-organic. The organic waste are then manage in Graha Kompos
Pusdakota using open windrow, bio filter and basket stack method.
When this project started, the community of Kalirungkut used their own cost. But in
the mean time, government of Surabaya and also donating some support to this
program
This project has a number of barriers. Among other is social barriers in terms of
difficulty faced in inviting citizen to participate, many of them were not optimist with
this program. To overcome this barrier, PUSDAKOTA made a pilot project and
socialization to the community through community meeting
Another barrier is technology barriers as follows: (i) Technology applied is Takakura
composting method which is previously less familiar and need to be adjusted with
Indonesian environmental condition. (ii) Lack of knowledge of the citizens on how to
segregate the wastes. The barriers were solved by conducting research activity to find
ways to adjust the technology, and by providing guidance to the local community in
segregating the wastes.
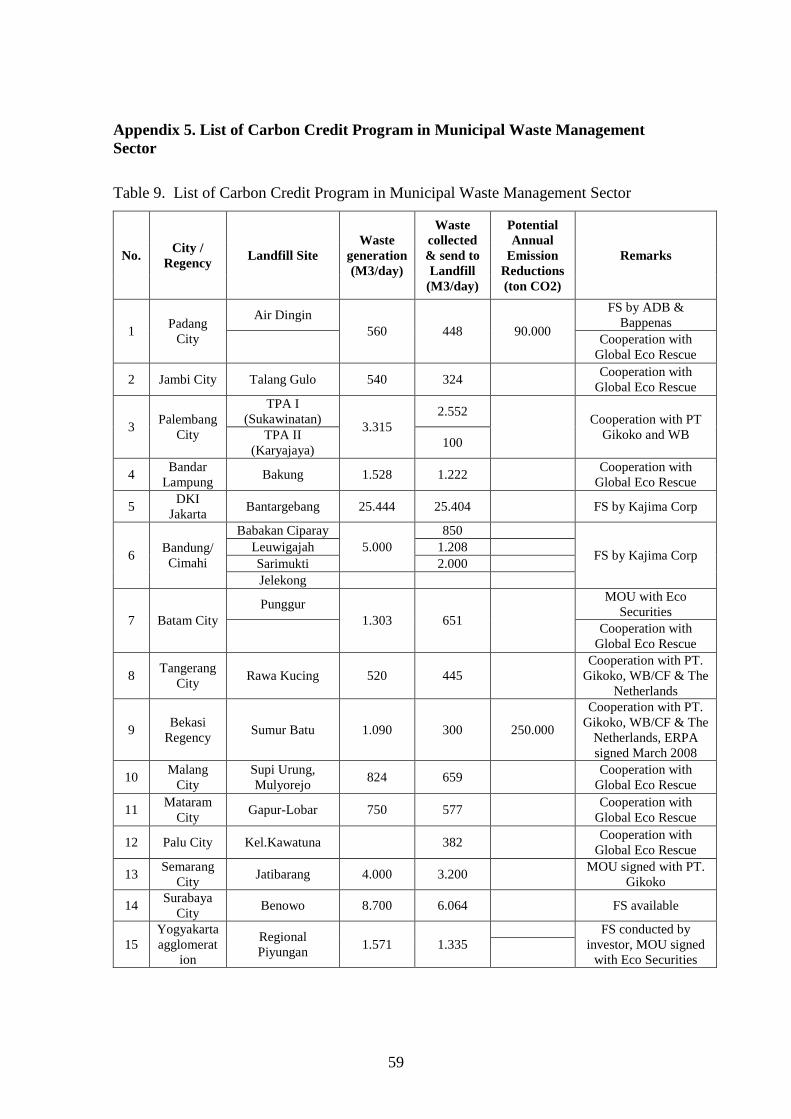
59
Appendix 5. List of Carbon Credit Program in Municipal Waste Management
Sector
Table 9. List of Carbon Credit Program in Municipal Waste Management Sector
No. City /
Regency Landfill Site
Waste
generation
(M3/day)
Waste
collected
& send to
Landfill
(M3/day)
Potential
Annual
Emission
Reductions
(ton CO2)
Remarks
1 Padang
City
Air Dingin
560 448 90.000
FS by ADB &
Bappenas
Cooperation with
Global Eco Rescue
2 Jambi City Talang Gulo 540 324 Cooperation with
Global Eco Rescue
3 Palembang
City
TPA I
(Sukawinatan) 3.315
2.552
Cooperation with PT
Gikoko and WB TPA II
(Karyajaya) 100
4 Bandar
Lampung Bakung 1.528 1.222
Cooperation with
Global Eco Rescue
5 DKI
Jakarta Bantargebang 25.444 25.404 FS by Kajima Corp
6 Bandung/
Cimahi
Babakan Ciparay
5.000
850
FS by Kajima Corp Leuwigajah 1.208
Sarimukti 2.000
Jelekong
7 Batam City
Punggur
1.303 651
MOU with Eco
Securities
Cooperation with
Global Eco Rescue
8 Tangerang
City Rawa Kucing 520 445
Cooperation with PT.
Gikoko, WB/CF & The
Netherlands
9 Bekasi
Regency Sumur Batu 1.090 300 250.000
Cooperation with PT.
Gikoko, WB/CF & The
Netherlands, ERPA
signed March 2008
10 Malang
City
Supi Urung,
Mulyorejo 824 659
Cooperation with
Global Eco Rescue
11 Mataram
City Gapur-Lobar 750 577
Cooperation with
Global Eco Rescue
12 Palu City Kel.Kawatuna 382 Cooperation with
Global Eco Rescue
13 Semarang
City Jatibarang 4.000 3.200
MOU signed with PT.
Gikoko
14 Surabaya
City Benowo 8.700 6.064 FS available
15
Yogyakarta
agglomerat
ion
Regional
Piyungan 1.571 1.335
FS conducted by
investor, MOU signed
with Eco Securities

60
16
Pontianak
City Batu Layang 1.400 980 120.000
Cooperation with PT.
Gikoko, WB/CF & The
Netherlands, ERPA
signed 14 June 2007
17 Banjarmasi
n City Basirih 947 615 MOU with PT. Gikoko
18 Samarinda
City Bukit Pinang 1.503 1.428
Cooperation with
Global Eco Rescue
19 Balikpapan
City Manggar 1.128 1.076
Cooperation with
Global Eco Rescue
20
Denpasar/
Badung
(SARBAG
ITA)
Suwung 2.909 2.327 100.000
Cooperation with
PT.NOEI & UK,
ERPA signed Dec 2007
21 Makassar
City Tamangappa 953 810
Cooperation with PT.
Gikoko, WB/CF & The
Netherlands
22 Gianyar
Regency Temesi 500 150 7.000
Voluntary, Gold
Standard, Rotary Club
Ubud, buyer KUONI
travel
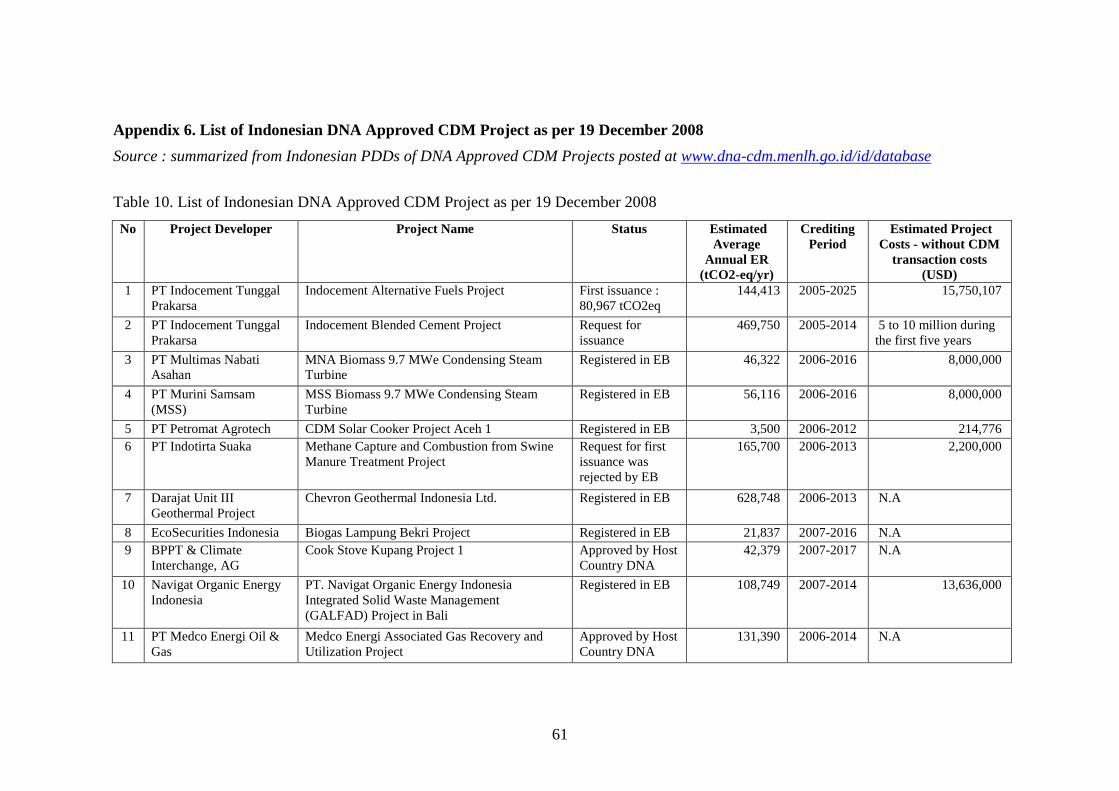
61
Appendix 6. List of Indonesian DNA Approved CDM Project as per 19 December 2008
Source : summarized from Indonesian PDDs of DNA Approved CDM Projects posted at www.dna-cdm.menlh.go.id/id/database
Table 10. List of Indonesian DNA Approved CDM Project as per 19 December 2008
No Project Developer Project Name Status Estimated
Average
Annual ER
(tCO2-eq/yr)
Crediting
Period
Estimated Project
Costs - without CDM
transaction costs
(USD)
1 PT Indocement Tunggal
Prakarsa
Indocement Alternative Fuels Project First issuance :
80,967 tCO2eq
144,413 2005-2025 15,750,107
2 PT Indocement Tunggal
Prakarsa
Indocement Blended Cement Project Request for
issuance
469,750 2005-2014 5 to 10 million during
the first five years
3 PT Multimas Nabati
Asahan
MNA Biomass 9.7 MWe Condensing Steam
Turbine
Registered in EB 46,322 2006-2016 8,000,000
4 PT Murini Samsam
(MSS)
MSS Biomass 9.7 MWe Condensing Steam
Turbine
Registered in EB 56,116 2006-2016 8,000,000
5 PT Petromat Agrotech CDM Solar Cooker Project Aceh 1 Registered in EB 3,500 2006-2012 214,776
6 PT Indotirta Suaka Methane Capture and Combustion from Swine
Manure Treatment Project
Request for first
issuance was
rejected by EB
165,700 2006-2013 2,200,000
7 Darajat Unit III
Geothermal Project
Chevron Geothermal Indonesia Ltd. Registered in EB 628,748 2006-2013 N.A
8 EcoSecurities Indonesia Biogas Lampung Bekri Project Registered in EB 21,837 2007-2016 N.A
9 BPPT & Climate
Interchange, AG
Cook Stove Kupang Project 1 Approved by Host
Country DNA
42,379 2007-2017 N.A
10 Navigat Organic Energy
Indonesia
PT. Navigat Organic Energy Indonesia
Integrated Solid Waste Management
(GALFAD) Project in Bali
Registered in EB 108,749 2007-2014 13,636,000
11 PT Medco Energi Oil &
Gas
Medco Energi Associated Gas Recovery and
Utilization Project
Approved by Host
Country DNA
131,390 2006-2014 N.A
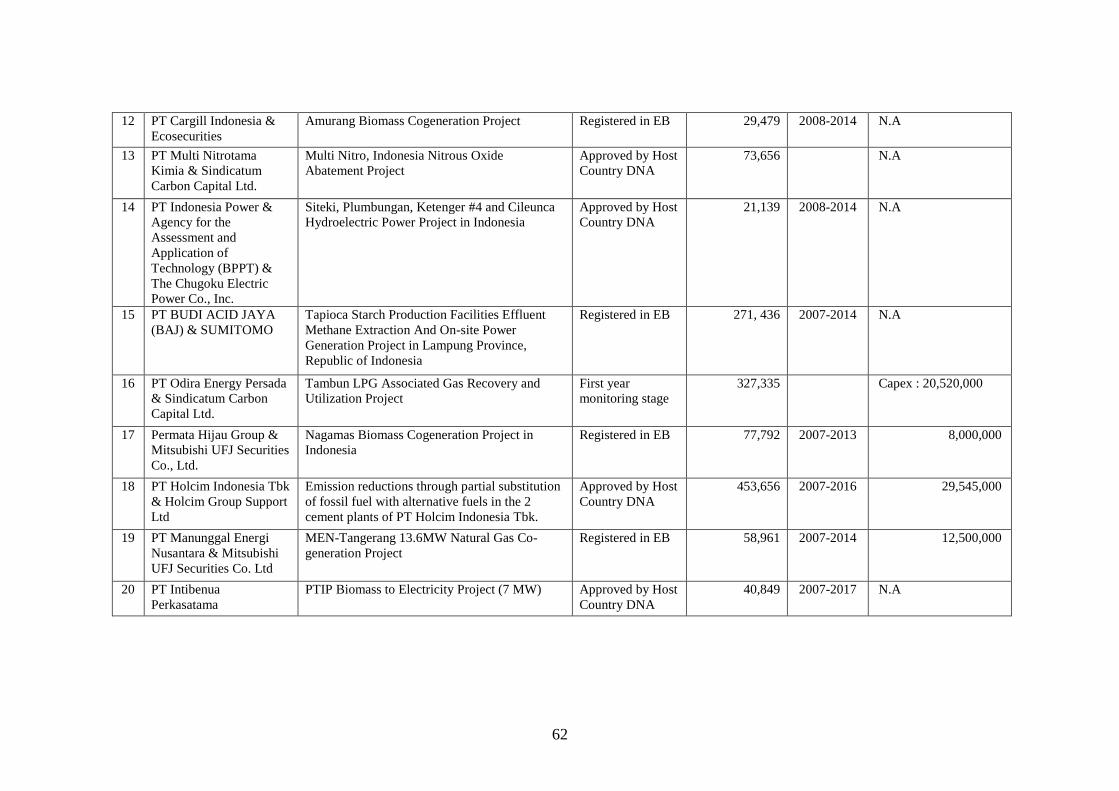
62
12 PT Cargill Indonesia &
Ecosecurities
Amurang Biomass Cogeneration Project Registered in EB 29,479 2008-2014 N.A
13 PT Multi Nitrotama
Kimia & Sindicatum
Carbon Capital Ltd.
Multi Nitro, Indonesia Nitrous Oxide
Abatement Project
Approved by Host
Country DNA
73,656 N.A
14 PT Indonesia Power &
Agency for the
Assessment and
Application of
Technology (BPPT) &
The Chugoku Electric
Power Co., Inc.
Siteki, Plumbungan, Ketenger #4 and Cileunca
Hydroelectric Power Project in Indonesia
Approved by Host
Country DNA
21,139 2008-2014 N.A
15 PT BUDI ACID JAYA
(BAJ) & SUMITOMO
Tapioca Starch Production Facilities Effluent
Methane Extraction And On-site Power
Generation Project in Lampung Province,
Republic of Indonesia
Registered in EB 271, 436 2007-2014 N.A
16 PT Odira Energy Persada
& Sindicatum Carbon
Capital Ltd.
Tambun LPG Associated Gas Recovery and
Utilization Project
First year
monitoring stage
327,335
Capex : 20,520,000
17 Permata Hijau Group &
Mitsubishi UFJ Securities
Co., Ltd.
Nagamas Biomass Cogeneration Project in
Indonesia
Registered in EB 77,792 2007-2013 8,000,000
18 PT Holcim Indonesia Tbk
& Holcim Group Support
Ltd
Emission reductions through partial substitution
of fossil fuel with alternative fuels in the 2
cement plants of PT Holcim Indonesia Tbk.
Approved by Host
Country DNA
453,656 2007-2016 29,545,000
19 PT Manunggal Energi
Nusantara & Mitsubishi
UFJ Securities Co. Ltd
MEN-Tangerang 13.6MW Natural Gas Co-
generation Project
Registered in EB 58,961 2007-2014 12,500,000
20 PT Intibenua
Perkasatama
PTIP Biomass to Electricity Project (7 MW) Approved by Host
Country DNA
40,849 2007-2017 N.A

63
21 PT Sumi Rubber
Indonesia (SURINDO),
PT Nusantara Energy
Solution (NES) &
Toshiba Corporation
(TOSHIBA)
Gas turbine co-generation project in Indonesia Registered in EB 28,222 2008-2018 N.A
22 PT Fajar Futura Luwu
Energi Luwu, Centre for
Application and
Assessment of Energy
Resources Technology,
Agency for the
Application and
Assessment of
Technology (BPPT), The
Chugoku Electric Power
Co., Inc. & Kajima
Corporation
Ranteballa Hydroelectric Power Project in
Indonesia
Approved by Host
Country DNA
9,748 2008-20014 N.A
23 PT Musim Mas PTMM Biomass to Electricity Project 26.4
MW(e)
Approved by Host
Country DNA
114,210 2007-2017 14,500,000
24 PT Gikoko Kogyo
Indonesia, The Municipal
Government of the City
of Pontianak, Kalimantan
Barat, Indonesia & IBRD
(Netherlands)
Pontianak-GHG emission recuction through
improved MSW management-LFG Capture,
Flaring, and Electricity Generation
Registered in EB 91,814 2007-2027 1,369,608
25 PT Listrindo Kencana,
PT Sawindo Kencana &
Misubishi UFJ Securities
Listrindo Kencana Biomass Power Plant Request for
Registration
76,104 2007-2014 8,400,000
26 PT Bahari Dwikencana
Lestari & EcoSecurities
Group Plc.
Bahari Co-Composting Project Approved by Host
Country DNA
58,458 2007-2017 Capex : 1,218,014
27 PLN (Perusahaan Listrik
Negara)
Lahendong II-20 MW Geothermal Project Approved by Host
Country DNA
N.A N.A N.A

64
28 PT Rimba Partikel
Indonesia
4 MW Biomass Power Plants, Using Waste
Wood Chips & Saw Dust
Registered in EB 14,858 7,100,000
29 PT Poso Energi Pamona 2 Hydroelectric Power Plant Project Approved by Host
Country DNA
345,880 2008-2015 141,353,339
30 PT Mega Power Mandiri Parlilitan 1 Hydro Power Plant Approved by Host
Country DNA
27,673 2008-2015 10,040,000
31 PT Patisari Patisari Co-composting Project Approved by Host
Country DNA
54,204 2008-2018 1,581,661
32 PT AES AgriVerde
Indonesia
Methane Recovery in Wastewater Treatment Request for
Registration
31,895 2008-2015 > 1,000,000
33 PT Asahimas Flat Glass
Tbk.,
Fuel switching at Asahimas Ancol a flat glass
manufacturing facility
Approved by Host
Country DNA
50,474 2008-2014 N.A
34 PT Asahimas Flat Glass
Tbk.,
Fuel switching at Asahimas Sidoarjo a flat glass
manufacturing facility
Approved by Host
Country DNA
40,892 2008-2014 N.A
35 PT Gikoko Kogyo
Indonesia
Gikoko Palembang-LFG Flaring Project Approved by Host
Country DNA
105,483 2008-2028 2,371,320
36 PT Fetty Mina Jaya Fetty Mina Co-composting Project Approved by Host
Country DNA
46,744 2008-2017 756,263 (capital cost)
+ 245,450 (operational
cost/year)
37 PT AES AgriVerde
Indonesia & PT Victorian
Alam Lestari
Methane Recovery in wasterwater treatment,
Project AIN07-W-04
Approved by Host
Country DNA
42,283 2008-2015 > 1,000,000
38 PT Great Giant Pineapple
(GGP)
GGP-UJA Biogas Project Approved by Host
Country DNA
114,551 2008-2028 N.A
39 PT AES AgriVerde
Indonesia & PT Tolan
Tiga Indonesia
Methane Recovery in Wastewater Treatment,
Project AIN07-W-05
Approved by Host
Country DNA
31,737 2008-2015 > 1,000,000
40 Pemda Temesi Bali &
Rotary Club Bali Ubud
Gianyar Waste Recovery Project Request for
Registration
7,696 2008-2017 N.A
41 PT. Rohul Sawit Industri
& EcoSecurities
Rohul sawit industri co-composting project Approved by Host
Country DNA
43,081 2008-2014 1,173,297
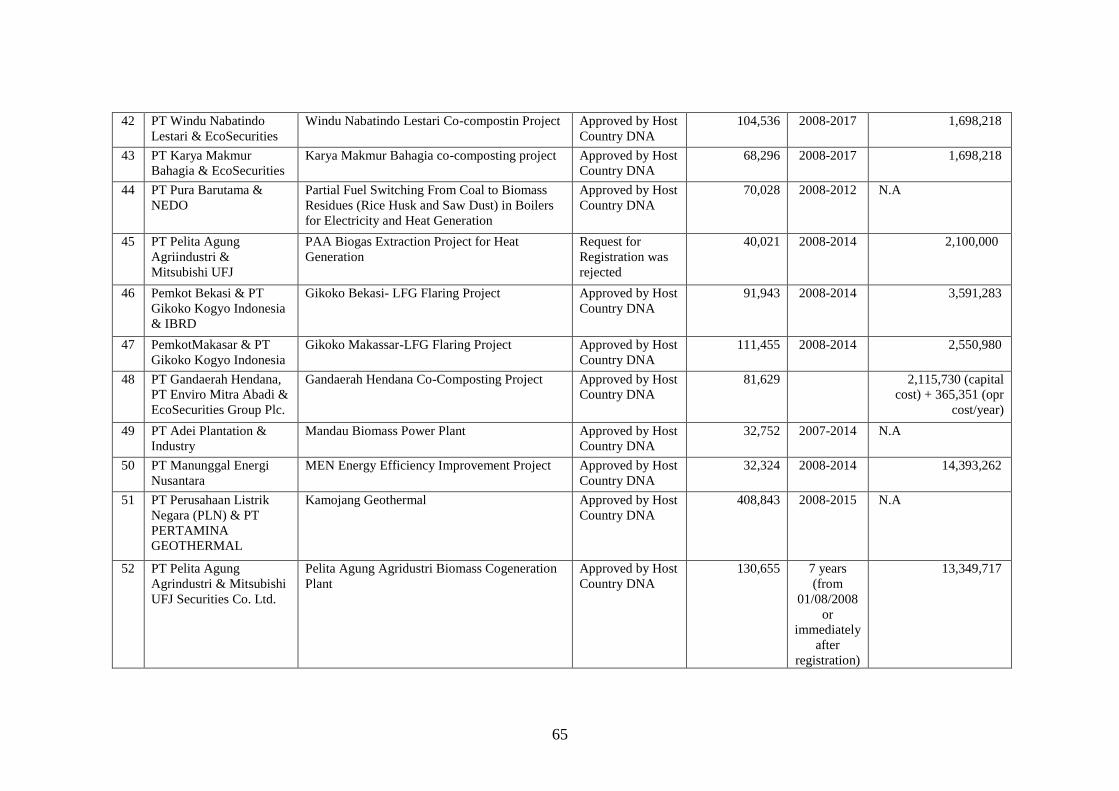
65
42 PT Windu Nabatindo
Lestari & EcoSecurities
Windu Nabatindo Lestari Co-compostin Project Approved by Host
Country DNA
104,536 2008-2017 1,698,218
43 PT Karya Makmur
Bahagia & EcoSecurities
Karya Makmur Bahagia co-composting project Approved by Host
Country DNA
68,296 2008-2017 1,698,218
44 PT Pura Barutama &
NEDO
Partial Fuel Switching From Coal to Biomass
Residues (Rice Husk and Saw Dust) in Boilers
for Electricity and Heat Generation
Approved by Host
Country DNA
70,028 2008-2012 N.A
45 PT Pelita Agung
Agriindustri &
Mitsubishi UFJ
PAA Biogas Extraction Project for Heat
Generation
Request for
Registration was
rejected
40,021 2008-2014 2,100,000
46 Pemkot Bekasi & PT
Gikoko Kogyo Indonesia
& IBRD
Gikoko Bekasi- LFG Flaring Project Approved by Host
Country DNA
91,943 2008-2014 3,591,283
47 PemkotMakasar & PT
Gikoko Kogyo Indonesia
Gikoko Makassar-LFG Flaring Project Approved by Host
Country DNA
111,455 2008-2014 2,550,980
48 PT Gandaerah Hendana,
PT Enviro Mitra Abadi &
EcoSecurities Group Plc.
Gandaerah Hendana Co-Composting Project Approved by Host
Country DNA
81,629 2,115,730 (capital
cost) + 365,351 (opr
cost/year)
49 PT Adei Plantation &
Industry
Mandau Biomass Power Plant Approved by Host
Country DNA
32,752 2007-2014 N.A
50 PT Manunggal Energi
Nusantara
MEN Energy Efficiency Improvement Project Approved by Host
Country DNA
32,324 2008-2014 14,393,262
51 PT Perusahaan Listrik
Negara (PLN) & PT
PERTAMINA
GEOTHERMAL
Kamojang Geothermal Approved by Host
Country DNA
408,843 2008-2015 N.A
52 PT Pelita Agung
Agrindustri & Mitsubishi
UFJ Securities Co. Ltd.
Pelita Agung Agridustri Biomass Cogeneration
Plant
Approved by Host
Country DNA
130,655 7 years
(from
01/08/2008
or
immediately
after
registration)
13,349,717

66
53 PT. Indo Karya Kimia Utilization of waste heat from Sulphur Recovery
Unit to generate electricity
Approved by Host
Country DNA
3,750 2008-2017 N.A
54 PT. Indo Bharat Rayon Energy efficiency improvement by installation
of Circulating Fluidized Bed Combustion
(CFBC) Boiler and Back Pressure Turbine at
PT. Indo Bharat Rayon, Indonesia
Approved by Host
Country DNA
21,599 2009-2015 N.A
55 PT. Batamindo
Investment Cakrawala &
PT. Asia Carbon
Indonesia
Fuel Switch for Power Generation form Heavy
Fuel Oil (HFO) Based Engines to Natural Gas
(NG) Based Engines at Batamindo Industrial
Park (BIP), Batam, Indonesia
Approved by Host
Country DNA
44,957 2008-2017 N.A
56 PT. Sulawesi Mini Hydro
Power
10 MW Manipi Hydro Electric Power Plant Approved by Host
Country DNA
26,424 2010-2016 N.A
57 PT. AES AgriVerde
Indonesia & AES
AgriVerde Ltd.
AIN08-W-07, Methane Recovery in Wastewater
Treatment, Sumatera Utara, Indonesia
Approved by Host
Country DNA
10,495 2008-2015 N.A
58 PT. AES AgriVerde
Indonesia & AES
AgriVerde Ltd.
AIN08-W-06. Methane Recovery in Wastewater
Treatment, Sumatera Utara, Indonesia
Approved by Host
Country DNA
17,575 2008-2015 N.A
59 PT. Indonesia Asahan
Aluminium & South Pole
Carbon Asset
Management Ltd & PT.
Carbon and
Environmental Research
PCF Emission Reductions at PT. Indonesia
Asahan Aluminium (PT. INALUM) Kuala
Tanjung
Approved by Host
Country DNA
58,117 2008-2017 About 5-6 million
60 PT. Citra Koprasindo
Tani
Operating Waste Composting at CKT Palm Oil
Mill, Indonesia
Approved by Host
Country DNA
217,609 2008-2014 4.9 million total
61 PT. Prakarsa Tani Sejati
& Aretae Limited
Operating Waste Composting at PTS Palm Oil
Mill, Indonesia
Approved by Host
Country DNA
101,026 2008-2018 4.9 million total
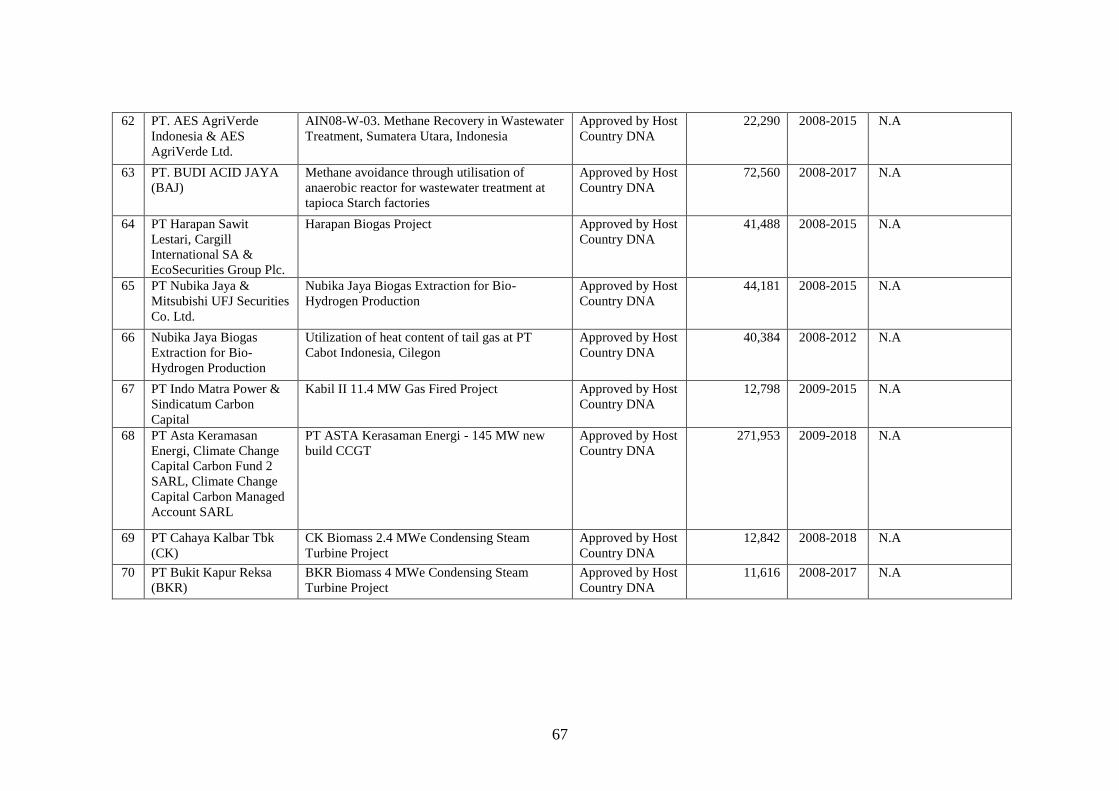
67
62 PT. AES AgriVerde
Indonesia & AES
AgriVerde Ltd.
AIN08-W-03. Methane Recovery in Wastewater
Treatment, Sumatera Utara, Indonesia
Approved by Host
Country DNA
22,290 2008-2015 N.A
63 PT. BUDI ACID JAYA
(BAJ)
Methane avoidance through utilisation of
anaerobic reactor for wastewater treatment at
tapioca Starch factories
Approved by Host
Country DNA
72,560 2008-2017 N.A
64 PT Harapan Sawit
Lestari, Cargill
International SA &
EcoSecurities Group Plc.
Harapan Biogas Project Approved by Host
Country DNA
41,488 2008-2015 N.A
65 PT Nubika Jaya &
Mitsubishi UFJ Securities
Co. Ltd.
Nubika Jaya Biogas Extraction for Bio-
Hydrogen Production
Approved by Host
Country DNA
44,181 2008-2015 N.A
66 Nubika Jaya Biogas
Extraction for Bio-
Hydrogen Production
Utilization of heat content of tail gas at PT
Cabot Indonesia, Cilegon
Approved by Host
Country DNA
40,384 2008-2012 N.A
67 PT Indo Matra Power &
Sindicatum Carbon
Capital
Kabil II 11.4 MW Gas Fired Project Approved by Host
Country DNA
12,798 2009-2015 N.A
68 PT Asta Keramasan
Energi, Climate Change
Capital Carbon Fund 2
SARL, Climate Change
Capital Carbon Managed
Account SARL
PT ASTA Kerasaman Energi - 145 MW new
build CCGT
Approved by Host
Country DNA
271,953 2009-2018 N.A
69 PT Cahaya Kalbar Tbk
(CK)
CK Biomass 2.4 MWe Condensing Steam
Turbine Project
Approved by Host
Country DNA
12,842 2008-2018 N.A
70 PT Bukit Kapur Reksa
(BKR)
BKR Biomass 4 MWe Condensing Steam
Turbine Project
Approved by Host
Country DNA
11,616 2008-2017 N.A

68
Appendix 7. Examples of Renewable Energy Utilization to Electrify Rural Area
Table 11. Examples of Renewable Energy Utilization to Electrify Rural Area
No. Activity Capacity Utilization Location Operator
Hydro Pwer Plant
1. PLTMH Leuwi Kiara 1 unit @ 12 kW Electricity Nagrog Village, West
Java
2. PLTMH Tou 1 unit @ 50kW Electricity Tou Village, Jambi Village Electricity Manager of
Tou Village
3. PLTMH Rengah Sungai
Besar
1 unit @ 50 kW Electricity Rengah Sungai Besar
Village
Village Electricity Manager of
Rengah Sungai Besar Village
4. PLTMH Talang
Tembago
1 unit @ 50 kW Electricity Desa TalangTembago,
Jambi
Village Electricity Manager of
Talang Tembago Village
Village
Solar Cell Power Plant
5 PLTS Cikawung 100 unit @ 50 wp Electricity Cikawung Village, West
Java
Village Electricity Manager of
Cikawung Village
6 PLTS Ciseureuh 200 unit @ 50 wp Electricity Ciseureuh Village,
Central Java
Village Electricity Manager of
Ciseureuh Village
7 PLTS Pakisan 150 unit @ 50 wp Electricity Pakisan Village, East
Java
Village Electricity Manager of
Pakisan Village
8 PLTS Sumberejo 150 unit @ 50 wp Electricity Sumberejo Village Village Electricity Manager of
Sumberejo Village
9 PLTS Sebira 160 unit @ 10 kW Electricity Sebira Island, Jakarta
10 Pompa Air Tenaga Surya
(PATS) Sikijang
2 unit @ 64m3/day Water pump Sikijang Village
11 Pengering Surya (Solar
Dryer) Kali Jaya
1 unit cylinder type Dryer Kali Jaya Village, West
Java
Harapan Jaya Farmer Group

69
12 Pengering Surya (Solar
Dryer) Ciherang Pondok
1 unit Dryer Ciherang Pondok Village,
West Java
Mr. Dullah
Hybrid (Combining more than one energy source)
13. Hibrida PLTS-Diesel
Santian
1 unit diesel generator
@ 15 KVA and 1 unit
PLTS @ 7 kWp
Electricity Santian Village, East
Nusa Tenggara
Villagers
14. Hibrida PLTS-PLTAngin-
Diesel Oeledo
1 unit diesel generator
@ 20, 1 unit PLTS @
22 kWp and 1 unit PLT
Anging @ 10 kW KVA
and 1 unit PLTS @ 7
kWp
Electricity Oeledo Village, East Nusa
Tenggara
Village Electricity Manager of
Oledo Village
Biomass
15. Biogas Cikandang 1 unit Cooking Cikandang Village, West
Java
Cattle Farmers (cow) of Renteng
Village
16. Biogas Dalemen 1 unit Vermicelli
industry
Daleman Village, Central
Java
Vermicelli producer in Daleman
Village
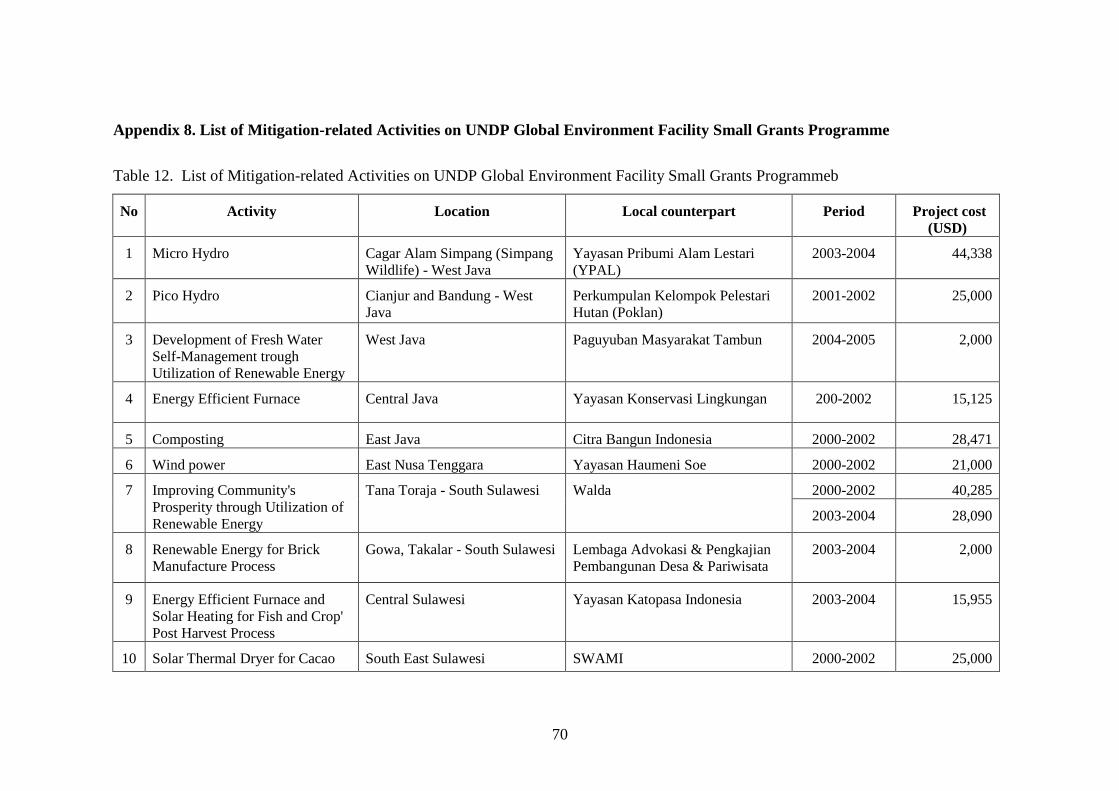
70
Appendix 8. List of Mitigation-related Activities on UNDP Global Environment Facility Small Grants Programme
Table 12. List of Mitigation-related Activities on UNDP Global Environment Facility Small Grants Programmeb
No Activity Location Local counterpart Period Project cost
(USD)
1 Micro Hydro Cagar Alam Simpang (Simpang
Wildlife) - West Java
Yayasan Pribumi Alam Lestari
(YPAL)
2003-2004 44,338
2 Pico Hydro Cianjur and Bandung - West
Java
Perkumpulan Kelompok Pelestari
Hutan (Poklan)
2001-2002 25,000
3 Development of Fresh Water
Self-Management trough
Utilization of Renewable Energy
West Java Paguyuban Masyarakat Tambun 2004-2005 2,000
4 Energy Efficient Furnace Central Java Yayasan Konservasi Lingkungan 200-2002 15,125
5 Composting East Java Citra Bangun Indonesia 2000-2002 28,471
6 Wind power East Nusa Tenggara Yayasan Haumeni Soe 2000-2002 21,000
7 Improving Community's
Prosperity through Utilization of
Renewable Energy
Tana Toraja - South Sulawesi Walda 2000-2002 40,285
2003-2004 28,090
8 Renewable Energy for Brick
Manufacture Process
Gowa, Takalar - South Sulawesi Lembaga Advokasi & Pengkajian
Pembangunan Desa & Pariwisata
2003-2004 2,000
9 Energy Efficient Furnace and
Solar Heating for Fish and Crop'
Post Harvest Process
Central Sulawesi Yayasan Katopasa Indonesia 2003-2004 15,955
10 Solar Thermal Dryer for Cacao South East Sulawesi SWAMI 2000-2002 25,000

71
Appendix 9. Examples of NGOs Working on Mitigation Issues
Table 13. Examples of NGOs Working on Mitigation Issues
Location Number of
NGO
NGO's name
Aceh, Sumatera
4
Forum Study Kependudukan dan Lingkungan Hidup
Lembaga Pembelaan Lingkungan Hidup Aceh
Lembaga Pengambangan sosial Ekonomi dan
Lingkungan Hidup
Community for Farmers and Environment
Development
Bali 8
GUS (Gelombang Udara Segar) Foundation
BaliFokus
LPTP (Lembaga Pengembangan Teknologi
Pedesaan)
Rotary Club Bali Ubud
Pusat Pendidikan Lingkungan Hidup Bali
Sekretariat Kerja Penyelamat dan Pelestarian
Lingkungan Hidup
WALHI Bali
Yayasan WWF Indonesia Program Wallacea
Banten, Java 0 -
Bengkulu, Sumatera 0 -
DKI Jakarta, Java 5
YKEL
YBUL
Yayasan Pelangi
WALHI
Yayasan Kajian Agama Humanisme dan
Lingkungan
Gorontalo, Sulawesi 0
Jambi, Sumatera 0
West Java 5
Yayasan Pribumi Alam Lestari
Poklan
Ibeka
YMD
Paguyuban Masyarakat Tambun Membangun
Central Java 2 Yayasan Konservasi Lingkungan
Geni
East Java 5
YCBI
KSM Peduli seloliman
Konsorsium Seloliman
Citra Bangun Indonesia
Pusat Pendidikan Lingkungan Hidup
Jogjakarta, Java 0 -
West Kalimantan 0 -

72
South Kalimantan 1 WALHI South Kalimantan
East Kalimantan
2
Yayasan Padi Indonesia
Lembaga Pengembangan Lingkungan dan Sumber
Daya Manusia
Central Kalimantan 1 Lembaga Rakyat Penyelamat Lingkungan
Lampung, Sumatera 2 Mina Jaya
WALHI Lampung
Maluku 0 -
West Nusa Tenggara
1
Yayasan Sumberdaya Lingkungan untuk Pelestarian
Pembangunan
East Nusa Tenggara 0 -
Papua 0 -
South Sulawesi 2 LP3M
Environmental Partner Institute
Central Sulawesi
2
Yayasan Kotapasa Indonesia
WALHI Central Sulawesi
Southeast Sulawesi
2
Social and Environmental Concern Institution
Coorperation and Action for Rural and Environment
Foundation
North Sulawesi 0 -
South Sumatera 0 -
North Sumatera 0 -
Riau 1 Lembaga Kajian Ilmiah Lingkungan Hidup
73
REFFERENCES
Medrilzam. 2007. Pendanaan untuk Perubahan Iklim (Funding for Climate Change).
Jakarta:Kementerian Negara Perencanaan Pembangunan Nasional (BAPPENAS)
Anonim. 2008. Background and Policy Issue Note on Climate change Program Loan
(Cool Earth Program Loan) to the Republic Indonesia. Jakarta:JICA
Tedjakusuma, Eddy Effendi, et al. 2008. National Development Planning:Indonesia
Responses to Climate Change. Jakarta:Kementerian Negara Perencanaan
Pembangunan Nasional (BAPPENAS)
Departemen Energi dan Sumber Daya Mineral.2007. Statistik Ketenaga listrikan dan
Energi Tahun 2006. Jakarta: Dirjen Listrik dan Pemanfaatan Energi
Anonim. 2007. Community‟s Contribution to Develop Sustanable Future, Experiences
In Managing Small Grants For The Environment. Jakarta : Global Facility Small
Grant Programme Indonesia
Lestari, Gita. 2007. Paper on LEAD Association Training
United Nation Development Program. 2008. http://www.undp.or.id/factsheets/#env
(23 December 2008)
Bisinis. Com. 2008. http://web.bisnis.com/artikel/2id422.html (23 December 2008)
Government of East Java Province. 2008.
http://www.jatimprov.go.id/index2.php?option=com_content&do_pdf=1&id=1030
(23 December 2008)
Institute for Global Environmental Strategies. 2008.
http://www.iges.or.jp/en/cdm/indonesia.html (23 December 2008)
Asian development Bank. 2008. http://www.adb.org/Projects/reports-
country.asp?ctry=INO (23 December 2008)

74
Ministry of Environment Indonesia. 2008 www.dna-cdm.menlh.go.id/id/database
(23 December 2008)


