
Study of the transport
mechanism of the
melibiose permease from
Escherichia coli
Li-Ying Wang


Study of the transport
mechanism of the
melibiose permease from
Escherichia coli
Memòria presentada per na Li-Ying Wang
Per optar al grau de Doctor.
Els treballs presentats han estat dirigits pels
Drs. Esteve Padrós i Morell i Josep Bartomeu Cladera Cerdà,
i realitzats en la Unitat de Biofísica
del Departament de Bioquímica i de Biologia
Molecular i el Centre d’Estudis en Biofísica (CEB)
de la Universitat Autònoma de Barcelona
Vist i plau dels directors de la tesi:
Dr. Esteve Padrós i Morell Dr. Josep Bartomeu Cladera Cerdà


Universitat Autònoma de Barcelona Table of Contents
Table of contents
1 INTRODUCTION ...................................................................................................... 1
1.1 Membrane proteins are important for life ......................................................... 1
1.2 The cell membrane ............................................................................................ 1
1.3 Membrane transport proteins ............................................................................ 3
1.4 Major facilitator superfamily ............................................................................ 4
1.5 Melibiose permease .......................................................................................... 7
1.5.1 Topological Models of MelBEC ............................................................... 9
1.5.2 2D and 3D structure of melibiose permease ......................................... 10
1.6 Transport mechanism ...................................................................................... 11
1.6.1 General mechanisms of sugar transport ................................................ 13
1.6.2 Hypothesis for the transport mechanisms of melibiose permease ........ 16
1.7 Crystallization and structure determination .................................................... 18
1.8 Biophysical studies of MelB ........................................................................... 20
1.8.1 Förster Resonance Energy Transfer (FRET) ......................................... 21
1.8.2 Fourier Transform Infrared (FTIR) spectroscopy ................................. 22
1.9 Molecular dynamics simulations .................................................................... 25
2 OBJECTIVES ........................................................................................................... 35
3 MATERIALS AND METHODS .............................................................................. 37
3.1 Materials ......................................................................................................... 37
3.1.1 Reagents ................................................................................................ 37
3.1.2 Kits ........................................................................................................ 38
3.1.3 Instruments ............................................................................................ 38
3.1.4 Buffers ................................................................................................... 39
3.2 Methods........................................................................................................... 42
3.2.1 Obtaining the mutant proteins and the Cless protein ............................ 42
3.2.2 Preparation of vesicles .......................................................................... 52

Table of Contents Universitat Autònoma de Barcelona
3.2.3 Fourier transform infrared spectroscopy (FTIR) .................................. 54
3.2.4 Förster resonance energy transfer spectroscopy (FRET) ...................... 65
3.2.5 X-ray crystallography ........................................................................... 67
3.2.6 Molecular dynamics simulation ............................................................ 68
4 RESULTS AND DISCUSSION ................................................................................ 75
4.1 Analysis of the conserved residues in loop 7-8/end of helix VII .................... 75
4.2 Cysteine-scanning mutagenesis of loop 7-8/end of helix VII ......................... 76
4.3 Fluorescence results ........................................................................................ 78
4.3.1 FRET in proteoliposomes ..................................................................... 78
4.3.2 FRET of Inside Out (ISO) vesicles ....................................................... 83
4.3.3 Conclusions from the fluorescence results ........................................... 86
4.4 The infrared difference spectra ....................................................................... 87
4.4.1 General features of the infrared difference spectra ............................... 87
4.4.2 Conserved amino acids in loop 7-8 ....................................................... 88
4.4.3 Charged amino acids in loop 7-8:D264C and D266C .......................... 94
4.4.4 The unconserved aromatic amino acid in loop 7-8: F268C .................. 99
4.5 Molecular dynamics ...................................................................................... 105
4.5.1 Minimization and Equilibration .......................................................... 105
4.5.2 Molecular Dynamics of wild type MelBEC ......................................... 106
4.5.3 Molecular Dynamics of MelB mutated at conserved amino acids in
loop 7-8/end of helix VII ............................................................................. 110
4.5.4 Conclusions from the molecular dynamics results ............................. 112
4.6 Crystallization studies of MelB R149C mutant ............................................ 114
5 GENERAL DISCUSSION ..................................................................................... 117
APPENDIX ................................................................................................................ 129

Universitat Autònoma de Barcelona BBREVIATIONS
ABBREVIATIONS
Amino Acids
General abbreviations
λem emission wavelength
λex excitation wavelength
ABC ATP-binding cassette superfamily
Abs absorbance
AdiC L-arginine/agmatine antiporter from E. coli
AEBSF 4-(2-Aminoethyl) benzenesulfonyl fluoride hydrochloride
APS ammonium persulfate
ATR-FTIR attenuated total reflection-Fourier transform infrared
BSA bovine serum albumin
C12E8 dodecyl octaethylene glycol ether
C12E9 dodecyl nonaethylene glycol ether
CMC The critical micelle concentration
Cymal-5 5-cyclohexyl-1-pentyl-β-D-maltoside

ABBREVIATIONS Universitat Autònoma de Barcelona
Cymal-6 6-cyclohexyl-1-hexyl-β-D-maltoside
Cless the mutant protein without cysteines
DDM n-Dodecyl β-D-maltoside
DM Decyl β-D-maltopyranoside
DMSO dimethyl sulfoxide
D2G dns2-S-Gal,2’-(N-dansyl)-aminoethyl-1-thio-D-galactopyranoside
DTT 1, 4-dithio-threitol
EDTA ethylenediaminetetraacetic acid
FRET Förster resonance energy transfer
GPCRs G protein coupled receptors
GPH glycoside-pentoside-hexuronide:cationsymporter family
M mg/mL
IMV inverted membrane vesicles
IRdiff Infrared difference
ISO Inside-out
KPi potassium phosphate buffer
lactose 4-O-β-galactopyranosyl-D-glucose
LacY lactose permease of Escherichia coli
LAPAO (3-lauryl-starch)-N, N'-(dimethylamino) propylamine oxide
LB Luria Broth
Mel melibiose; 6-O-α-D-galactopyranosyl-D-glucose
MelB melibiose permease from Escherichia coli
MelBEC melibiose permease from Escherichia coli
MelBKP melibiose permease from Klebsiella pneumoniae
MelBSY melibiose permease from Salmonella typhimurium
MDS Molecular dynamics simulation
MFS major facilitator superfamily
MW molecular weight
NEM N-ethylmaleimide
OG n-octyl-β-D-glucoside
PCR polymerase chain reaction
PDB Protein Data Bank
PEG polyethylene glycol

Universitat Autònoma de Barcelona BBREVIATIONS
PL Proteoliposomes
R2 the correlation coefficient
SDS-PAGE sodium dodecyl sulfate polyacrylamide gel electrophoresis
TCDB transporter classification database
TM transmembrane
UDM Undecyl-β-d-maltoside
α-NPG p-nitrophenyl α-D-galactopiranoside

ABBREVIATIONS Universitat Autònoma de Barcelona
Universitat Autònoma de Barcelona INTRODUCTION
1
1 INTRODUCTION
1.1 Membrane proteins are important for life
About 60% of approved drug targets are membrane proteins, down to ~40%
when experimental targets are added.1 As an example, we can focus on diabetes. As
we all know, diabetes is a group of metabolic diseases causing high levels of blood
sugar. Based on the information from the international diabetes federation, we know
that the number of people with diabetes may increase to 592 million by 2035.
Diabetes caused 4.9 million deaths in 2014, and that means every 7 seconds a person
with diabetes dies.2 From the WHO web site we know that it was one of the 10
leading causes of death in the world in 2012, and it occupied 2.7 % of all deaths in the
world in that year. [http://www.who.int/mediacentre/factsheets/fs310/en/] So it is very
important to find out the mechanism by which the sugar passes the cell membranes
and then explore the drug target.
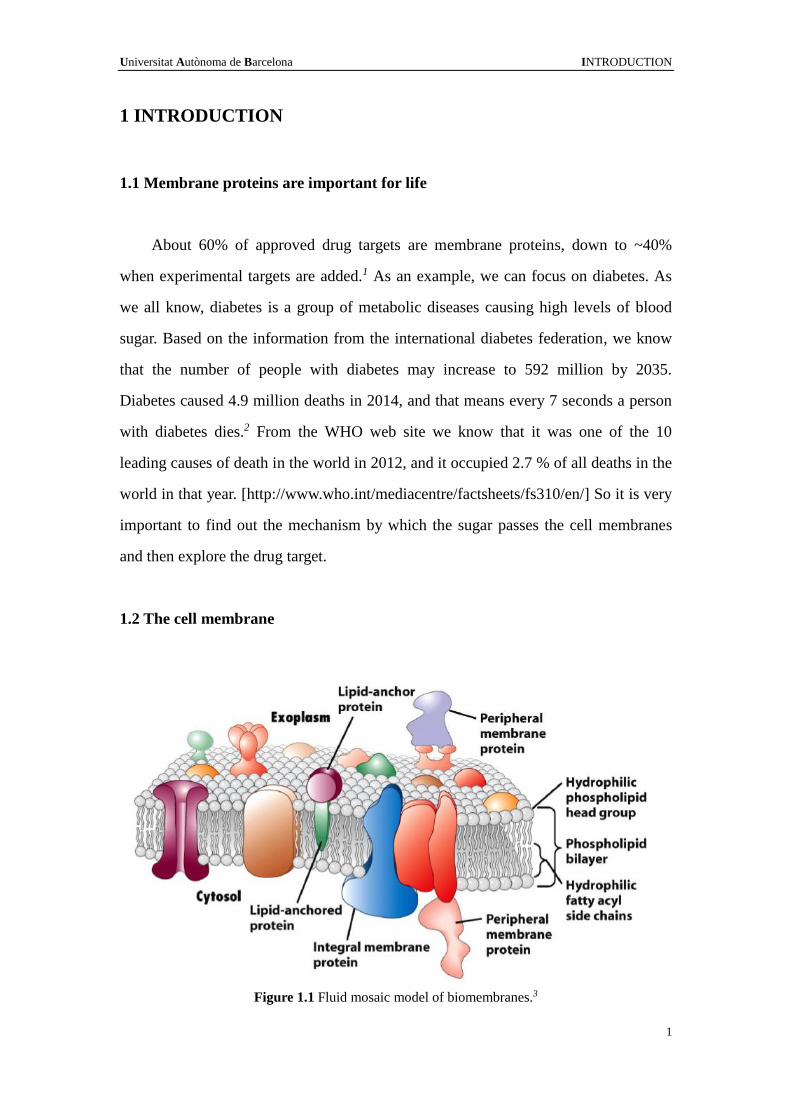
1.2 The cell membrane
Figure 1.1 Fluid mosaic model of biomembranes.3

INTRODUCTION Universitat Autònoma de Barcelona
2
The membrane of the cell is very important for keeping the cell structure and
function. The basic architecture of the biomembrane is a phospholipid bilayer which
contains several proteins. From the model of the biomembrane in Figure 1.1, we can
infer that most of the functions of the membrane are based on the membrane proteins.
In all cells, the membrane forms a permeability barrier that separates the
cytoplasm from the exterior environment. Since every living cell must acquire raw
materials for biosynthesis and for energy production from its surroundings, and must
release the byproducts of metabolism to its environment, the compounds need to cross
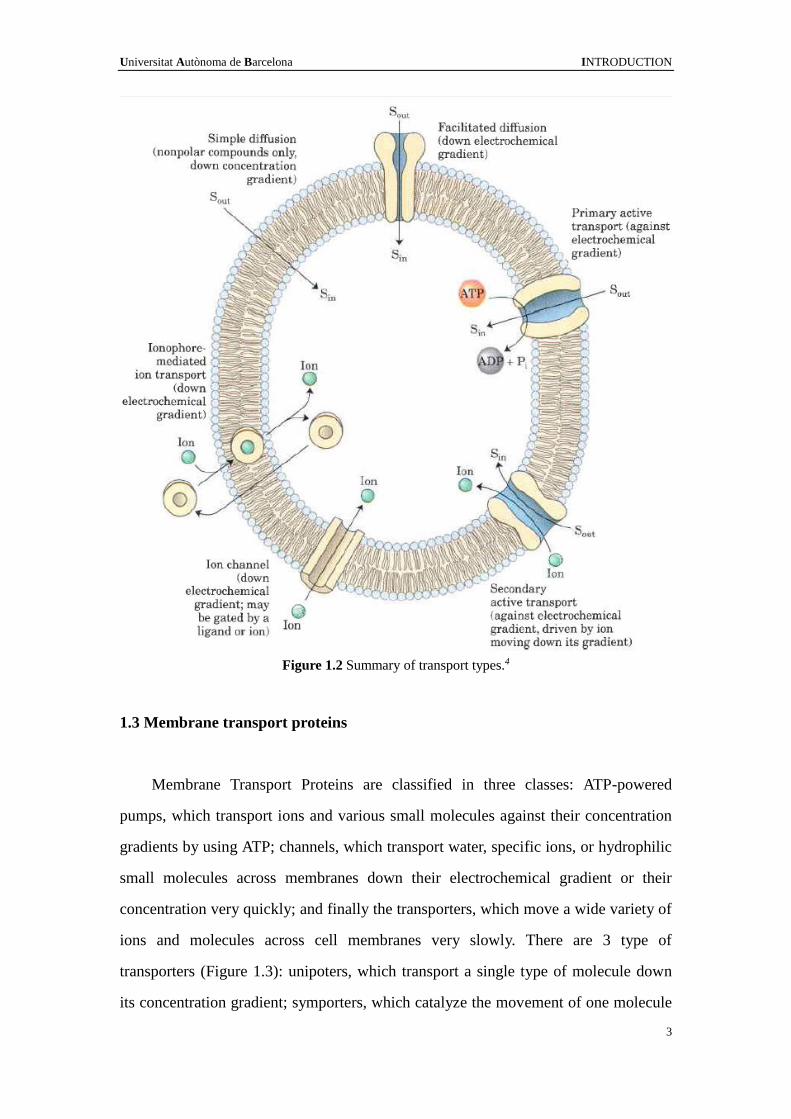
the membrane.4 There are several ways (or mechanisms) for the transport of
substances between the periplasmic side and cytoplasmic side of the membrane
(Figure 1.2): simple diffusion through the bilayer or channels driven by a
concentration gradient; facilitated diffusion which move the substrates from high to
low concentration through a binding process with membrane protein carriers (i.e.
membrane protein transporters); active transport by means of a protein transporter
with a specific binding site that undergoes a change in affinity driven by energy
released by an exergonic process, such as ATP hydrolysis (primary active transport),
ions moving down its concentration gradient (secondary active transport), usually
against concentration gradient.5 The study of the genome-wide sequence data from
eubacterial, archaean, and eukaryotic organisms shows that 20~30% of the genes
encode membrane proteins.6 Since biological membranes are in general highly
impermeable to molecules, for a compound such a sugar to enter the cell, it needs the
help of the membrane protein. Integral membrane proteins, lipid-anchored membrane
proteins and peripheral membrane proteins are the three categories of membrane
proteins. 7
Universitat Autònoma de Barcelona INTRODUCTION
3
Figure 1.2 Summary of transport types.4
1.3 Membrane transport proteins
Membrane Transport Proteins are classified in three classes: ATP-powered
pumps, which transport ions and various small molecules against their concentration
gradients by using ATP; channels, which transport water, specific ions, or hydrophilic
small molecules across membranes down their electrochemical gradient or their
concentration very quickly; and finally the transporters, which move a wide variety of
ions and molecules across cell membranes very slowly. There are 3 type of
transporters (Figure 1.3): unipoters, which transport a single type of molecule down
its concentration gradient; symporters, which catalyze the movement of one molecule

INTRODUCTION Universitat Autònoma de Barcelona
4
against its concentration, driven by the movement of one or more ions down an
electrochemical gradient in the same directions; and antiporters, which catalyze the
movement of one molecule against its concentration, driven by the movement of one
or more ions down an electrochemical gradient in the opposite directions.7
Figure 1.3 Membrane transport proteins. Gradients are indicated by triangles with the tip pointing
toward lower concentration, electrical potential, or both. (1-3) The three major types of transport
proteins. Red circles represent specific ions (or water); black circles represent specific small
molecules or ions driven by movement of one or more ions down an electrochemical gradient (red
circles). According to 7
1.4 Major facilitator superfamily
The transporter classification database8 includes all 56 superfamilies of different
membrane protein transporters. The major facilitator superfamily is the largest know
superfamily of secondary carriers. In 2012, this superfamily had 74 subfamilies of

Universitat Autònoma de Barcelona INTRODUCTION
5
diverse characteristics. The table below shows the main sub family of the MFS
family.9
Table 1.1 The members of the MFS family (http://www.tcdb.org/superfamily.php)
TC N. MFS family
2.A.1 The Major Facilitator Superfamily (MFS)
2.A.2 The Glycoside-Pentoside-Hexuronide (GPH):Cation Symporter Family
2.A.12 The ATP:ADP Antiporter (AAA) Family
2.A.17 The Proton-dependent Oligopeptide Transporter (POT/PTR) Family
2.A.48 The Reduced Folate Carrier (RFC) Family
2.A.60 The Organo Anion Transporter (OAT) Family
2.A.71 The Folate-Biopterin Transporter (FBT) Family
9.B.111 The 6TMS Lysyl tRNA synthetase (LysS) Family
The most frequent topological type of these MFS permeases is that almost all
proteins share an architecture of 12 transmembrane segments. They arose from a
single 3-transmembrane segment structure that duplicated to give a 6-TMS unit that in
its turn duplicated to a 12-TMS protein (Figure 1.4).10-12
Figure 1.4 A canonical MFS fold. The 12-TM structure in an MFS fold contains two
discretely folded domains, the N and C domains, which are related by an approximate 180o
rotation around axis c (defined at the bottom of the panel). Each domain consists of two inverted
INTRODUCTION Universitat Autònoma de Barcelona
6
3-TM repeats. The corresponding helices in each of these units have the same color.12
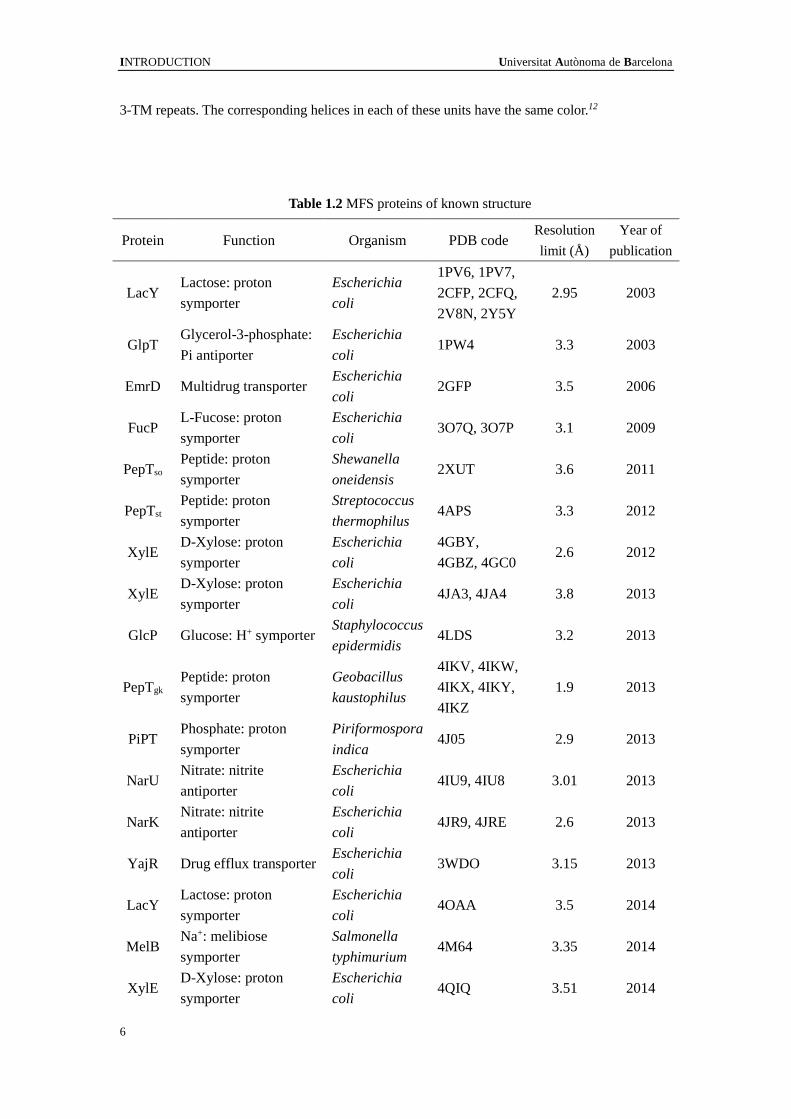
Table 1.2 MFS proteins of known structure
Protein Function Organism PDB code Resolution
limit (Å)
Year of
publication
LacY Lactose: proton
symporter
Escherichia
coli
1PV6, 1PV7,
2CFP, 2CFQ,
2V8N, 2Y5Y
2.95 2003
GlpT Glycerol-3-phosphate:
Pi antiporter
Escherichia
coli 1PW4 3.3 2003
EmrD Multidrug transporter Escherichia
coli 2GFP 3.5 2006
FucP L-Fucose: proton
symporter
Escherichia
coli 3O7Q, 3O7P 3.1 2009
PepTso Peptide: proton
symporter
Shewanella
oneidensis 2XUT 3.6 2011
PepTst Peptide: proton
symporter
Streptococcus
thermophilus 4APS 3.3 2012
XylE D-Xylose: proton
symporter
Escherichia
coli
4GBY,
4GBZ, 4GC0 2.6 2012
XylE D-Xylose: proton
symporter
Escherichia
coli 4JA3, 4JA4 3.8 2013
GlcP Glucose: H+ symporter Staphylococcus
epidermidis 4LDS 3.2 2013
PepTgk Peptide: proton
symporter
Geobacillus
kaustophilus
4IKV, 4IKW,
4IKX, 4IKY,
4IKZ
1.9 2013
PiPT Phosphate: proton
symporter
Piriformospora
indica 4J05 2.9 2013
NarU Nitrate: nitrite
antiporter
Escherichia
coli 4IU9, 4IU8 3.01 2013
NarK Nitrate: nitrite
antiporter
Escherichia
coli 4JR9, 4JRE 2.6 2013
YajR Drug efflux transporter Escherichia
coli 3WDO 3.15 2013
LacY Lactose: proton
symporter
Escherichia
coli 4OAA 3.5 2014
MelB Na+: melibiose
symporter
Salmonella
typhimurium 4M64 3.35 2014
XylE D-Xylose: proton
symporter
Escherichia
coli 4QIQ 3.51 2014

Universitat Autònoma de Barcelona INTRODUCTION
7
PepTso Peptide: proton
symporter
Shewanella
oneidensis
4TPH, 4TPG,
4TPJ 3.15 2014
YbgH Peptide: proton
symporter
Escherichia
coli 4Q65 3.4 2014
NRT1.1 Nitrate: proton
symporter
Arabidopsis
thaliana
4CL4(5A2N),
4CL5 3.7 2014
NRT1.1 Nitrate: proton
symporter
Arabidopsis
thaliana 4OH3 3.25 2014
GLUT1 glucose transporter Homo sapiens 4PYP 3.17 2014
PepTso Peptide: proton
symporter
Shewanella
oneidensis 4UVM 3 2015
PepTso Peptide: proton
symporter
Shewanella
oneidensis 4XNJ, 4XNI 2.3 2015
NarK Nitrate: nitrite
antiporter
Escherichia
coli
4U4V, 4U4T,
4U4W 2.35 2015
1.5 Melibiose permease
Melibiose permease is one of the GPH family members
(http://www.tcdb.org/search/result.php?tc=2.A.2.7) in the TCDB list whose 3D
structure has been described13.
The generalized transport reaction catalyzed by the GPH: cation symporter
family is:
Sugar (out) + [H+ or Na+] (out) → Sugar (in) + [H+ or Na+] (in).
Table 1.3 Cation selectivity of members of the GPH family14
Substrate α-galactosides
melibiose
β-galactosides Monosaccharides
D-galactose α/β-glucuronides
TMG lactose
MelBEC H+, Na+, Li+ Na+, Li+, (H+) Na+, Li+ H+, Na+, (Li+) ND
MelBSY Na+, Li+ Na+, Li+ ND ND ND
MelBKP H+ H+, Li+ Li+ ND ND
LacSST H+ H+ H+ H+ ND
GusBEC NT NT NT NT H+
MelB, 6-O-α-galactopyranosyl-D-glucose; TMG, methyl-β-D-thiogalactopyranoside; lactose, 4-O-β-galactopyranosyl-D-glucose; ND, not
determined; NT, not transported. Cations between brackets mean that the activation by them is very poor. MelBEC, melibiose permease
Escherichia coli; MelBSY, melibiose permease of Salmonella typhimurium; MelBKP, melibiose permease from Klebsiella pneumoniae;
LacSST, lactose permease of Streptococcus thermophilus; GusBEC, glucuronide transporter of Escherichia coli.

INTRODUCTION Universitat Autònoma de Barcelona
8
The GPH protein couples the uphill transport of the sugar towards the cell
interior with the downhill electrochemical ion gradient of Na+, Li+ or H+. The cation
selectivity of the members of GPH family is listed in Table 1.3.
Table 1.4 Cation specificity for sugar substrates of MelBEC16

Universitat Autònoma de Barcelona INTRODUCTION
9
The MelBEC transporter can use H+, Na+ (Table 1.4) or Li+ to transport, while
other transporters show different cation specificity for sugar uptake. 15, 16
1.5.1 Topological Models of MelBEC
Figure 1.5 Some topological structure models of the melibiose permease. A in 199020; B in
199221; C in 1996-722, 23; D in 199924; E in 200925.
The melibiose carrier was first found out in Escherichia coli.17 Later on, it was
INTRODUCTION Universitat Autònoma de Barcelona
10
found in Salmonella typhimurium cells.18 This MelBST was able to accumulate methyl
1-thio-β-D-galactopyranoside (TMG) against a concentration gradient.19 In the
following years, people were trying to find out the structure of the MelB protein. The
first MelB topology model was established in 1990.20 Two years later, Botfield
developed a topology model of the melibiose carrier from both hydropathy analysis
and alkaline phosphatase fusion data.21 Pourcher et al and Gwizdek et al revised this
model with assumptions based again on alkaline phosphatase activity and protease
digestion respectively.22, 23 After two more years the old topology model was
adapted24 and following the development of computer science, a 3D structure model
was built in 2009.25
1.5.2 2D and 3D structure of melibiose permease
Before the resolution of the crystal structure using X-rays, electron
crystallography was used to examine the structure26. Despite the relatively low
resolution (8 Å), the MelB monomer had a size of ~49Å×37Å and could host the 12
predicted transmembrane α-helices in the projection map from 2D crystals (Figure
1.6A). After three years, a three-dimensional structure of MelB at 10Å resolution in
the membrane plane with cryo-electron microscopy from two-dimensional crystals
showed a heart-shaped molecule composed of two domains with a large central
cavity between them (Figure 1.6B).27 A breakthrough was finally achieved in 2014,
with the first crystal structure of MelB of Salmonella typhimurium at a resolution
of 3.35 Å.13 The four molecules in each asymmetric unit exhibit two conformations,
the outward partially occluded state conformation and the outward inactive state
conformation (Figure 1.6C). Remarkably, residues at positions
Asp-55/Asp-59/Asp-124 and Tyr-120/Thr-121/Thr-373 form a trigonal bipyramid
geometry, as a potential cation binding site. Notably, replacing any of the residues at
position 55, 59, 124, or 121 with cysteine led to altered cation selectivity13, 28, 29,
backing the concept of the geometry described above as a cation binding site13, 29.

Universitat Autònoma de Barcelona INTRODUCTION
11
The structures of MelBST provide a way for understanding the coupling and
alternating-access mechanism of the MelBEC ion symporter.
Figure 1.6 A) 2D projection map of MelBEC;26 B) 3D cryo-EM images of MelBEC;27 C) The
2Fo-Fc maps of four molecules of MelBST.13
1.6 Transport mechanism
In the alternating access mechanism, protein-mediated substrate transport across
membranes requires that access to the solute-binding site alternates between the
periplasmic side and cytoplasmic side of the membrane. This alternating access
mechanism was proposed more than half a century ago30, long before the first
structure of a membrane protein was solved31. Four models for transport have been
suggested - the rocker-switch mechanism, the gated-pore mechanism, the elevator
mechanism and the toppling mechanism (Figure 1.7 a-d).32, 33 The basic principles of
these four models are briefly discussed below:
In the rocker-switch mechanism (Figure 1.7a), the substrate binds to a site in the
protein that is located close to the midway of the membrane. A swiveling movement

INTRODUCTION Universitat Autònoma de Barcelona
12
around a hinge region at the substrate-binding site (light grey arrows) alternates
access between the periplasmic side and cytoplasmic sides of the membrane, allowing
substrates to release.33
In the gated-pore mechanism (Figure 1.7b), the substrate-binding site is located
in the center of the membrane and alternating access is implemented by using two
gates. An occluded intermediate state exists when both gates are closed. 33
In the elevator mechanism (Figure 1.7c), two gates control access to the binding
site, and the protein region that has bound the substrate undertakes a translational
movement in the membrane when it is in an occluded state. An elevator domain is
needed to facilitate the lift-type movement of the transport domain.33
Figure 1.7 Models for alternating-access mechanisms of transport. a) Rocker-switch mechanism.
b) Gated-pore mechanism. c) Elevator mechanism. d) Toppling mechanism.33
The toppling mechanism (Figure 1.7d) would be similar to the elevator
mechanism, except that it is proposed to orient instead of lift the S component so that

Universitat Autònoma de Barcelona INTRODUCTION
13
its substrate-binding site faces the extracellular environment. In the example, the
hydrolysis of ATP and release of inorganic phosphate (Pi) and ADP lead to toppling of
the S component and the substrate-binding site becomes oriented towards the
cytoplasmic side.33
Based on recent structural data from several secondary transport proteins,
theoretical energy profiles were described for a series of different conformational
states during coupled transport (Figure 1.8). 34 This explains why the number of
well-resolved 3D structures of membrane transporters is still rather limited. At the
same time provides some concepts for understanding the transport mechanism.
Figure 1.8 A series of different conformational states during coupled transport. (A) Substrates (S,
star and red circle) bind to an externally open carrier conformation (Ce), forming a transient
substrate-bound state CSe, which transforms to an occluded substrate-bound state still facing the
external side of the membrane (CSec). Switching from CSec to an inward-facing, occluded
substrate-bound state CSic passes through a fully occluded, probably transient, substrate-bound
intermediate state, CSc. Substrates are then released from a transient substrate-bound
inward-facing open conformation (CSi) and the carrier can switch back from inward open (Ci) to
outward open (Ce) state via a fully occluded, intermediate state Cc in the case of symport (see text
for details). (B) Theoretical energy profile (black) of different carrier states during catalysis,
indicating minima at the gated substrate-bound states, and a putative rate-limiting barrier for the
re-conversion of the empty carrier. Note that the barriers and minima will vary for different
transporters: alternate situations are represented by additional profiles in gray.34
1.6.1 General mechanisms of sugar transport
LacY (lactose permease of Escherichia coli), a lactose/ H+ symporter, is a

INTRODUCTION Universitat Autònoma de Barcelona
14
paradigm for the major facilitator superfamily (MFS) of membrane transport
proteins.35 Its transport mechanism is well studied as shown in Figure 1.9.36 The key
characteristics of the ordered mechanism are summarized by Madej et al 36as follows:
(1) Lactose/H+ symport in the uphill or downhill energetic modes is just the same
reaction. The difference is in the downhill symport process: deprotonation is the
rate-limiting step in the downhill process, but it is no longer limiting in the uphill
process: and either dissociation of sugar or a conformational change that leads to
deprotonation becomes limiting. (2) Sugar-binding and dissociation, are the driving
force for alternating access, but not ∆ H+. (3) LacY has to be protonated to bind sugar.
(4) Galactoside binds by an induced-fitting mechanism, which powers transition to an
occluded state. (5) Sugar dissociates first. (6) Upon sugar dissociation, there is a
conformational change leading to deprotonation of LacY.
Figure 1.9 Transport cycle of MFS symporter. (A) Overview of the postulated steps in the
transport model. Inward-facing (green) and outward-facing (blue) conformations are separated by
the apo-intermediate conformations (orange) or by the occluded-intermediate conformations
(gray). Steps are numbered consecutively: 1: Opening of the H+ site; 2: Deprotonation to inside
and reorientation to the apo-intermediate with a central cavity closed to either side of the
membrane; 3: Opening of the outward-facing cavity and reprotonation from the outside; 4:
Formation of outward-open, substrate-free conformation; 5 and 6: Substrate binding and induced
fitting to the occluded conformation; 7: Opening of the inward-facing cavity and release of the
sugar; 8: Formation of the protonated, substrate-free conformation. (B) Hypothetical energy
profile for the transport cycle. The colors of the lines correspond to parts of the transport reaction

Universitat Autònoma de Barcelona INTRODUCTION
15
equivalent to A.36
Four different Na+ cotransporter crystal structures have been solved in different
conformations (see Figure 1.10). These cotransporters have been solved in the
outward open (C2), outward occluded (C3), and inward facing (C5) conformations for
the nucleobase cotransporter Mhp1 37; an outward occluded (C3) conformation for the
leucine cotransporter LeuT38; an intermediate conformation between C3 and C4 for
BetP39; an inward occluded and inward open conformations (C4, C5) for vSGLT140, 41.
As yet, there are no structures of these proteins in the C1 or C6 conformations. From
those crystal structures, Wright et al proposed a six state model for the SGLTs Na+
cotransporter (Figure 1.10 ).42
Figure 1.10 A 6-state model of SGLTs to integrate the kinetic and structural data. Na+ binds first
to the outside to open the outside gate (C2) permitting outside sugar to bind and be trapped in the
binding site (C3). This is followed by a conformational change from an outward occluded (C3) to
an inward occluded (C4) state. Upon opening the inward gate (C5), the Na+ and sugar are released
into the cell interior. There is a paucity of experiments adressing the order of the ligand
dissociation at the cytosolic surface. The transport cycle is completed by the change in
conformation from the inward facing ligand-free (C6) to the outward facing ligand free (C1) states.
Structures corresponding to C2 and C3 have been obtained for Mhp1, C3 for LeuT, and C4 for

INTRODUCTION Universitat Autònoma de Barcelona
16
vSGLT.42
1.6.2 Hypothesis for the transport mechanisms of melibiose permease
The melibiose permease faces the same situation as other sugar cotransporters in
the sense that it doesn’t have crystal structures in all the conformations. So hypothesis
for the transport mechanisms of the melibiose permease need to be based not only on
the known crystal structure from the MFS family, but also on the biochemistry and
biophysics studies.
Two kinetic models were proposed by León et al and Yousef et al in 2009
(Figure 1.11). They suggested that sugar translocation occurs via the alternating
access mechanism. In this mechanism, the empty MelB presents a conformational
dynamic behavior between inward-facing and outward-facing orientations (CO, Ci and
step 6). The subsequent binding of cation (CONa and step 1) and sugar (CONamel and
step 2) will induce the conformational changes from outward-facing to inward-facing
(CONamel, C*Namel, CiNamel and step 3), then the substrates binding sites are faced
to cytoplasmic medium. Sugar (CiNa and step 4) and cation (Ci and step 5) will
subsequently leave MelB, and then the empty MelB returns to the initial state (CO, Ci
and step 6).25, 43
Figure 1.11 Left: Kinetic model of Na+-sugar cotransport by MelB in physiological orientation.
The CO, C* and Ci indicate MelB states with an outward-facing, occluded or inward-facing

Universitat Autònoma de Barcelona INTRODUCTION
17
conformation, respectively. Starting from CO (empty carrier), binding of Na+ and then melibiose
successively drives the outward-facing transporter into the CONa and CONamel states (5). The
outward-facing to inward-facing carrier reorientation towards the cytoplasm (CONamel↔CiNamel)
is proposed to include an intermediate occluded state (C*Namel). After sequential release of
melibiose (CiNamel↔CiNa) and Na+ (CiNa↔Ci) into the inner compartment (3), MelB cycling
ends by a return of the empty carrier towards the outer membrane surface (Ci↔CO).43 Right: A
kinetic scheme of the efflux mode of galactoside/Na+ symport for MelB. A cross section of the
membrane is shown as a gray rectangle.25
In 2014, Ethayathulla et al published the first crystal structure of MelB with two
different conformations: partially outward occluded state conformation and the
outward inactive state conformation (4M64-A13 and 4M64-B13). They propose a
mechanism after combining the information from their study with the solved cystal
structure of full inward open conformation for PepT (2XUT44), LacY (2V8N45,
1PV746) and GlpT (1PW447); inward partial open conformation for NarU (4IU8-B48)
and XylE (4JA449); inward partially occluded conformation for XylE (4JA349) and
NarU (4IU8-A48); inward occluded conformation for NarK (4JR950, 4JRE50) and PiPT
(4J0551); intermediate conformation between inward and outward for EmrD (2GFP52);
outward occluded conformation for XylE (4GBY53); and full outward conformation
for FucP (3O7Q54). The simplified scheme for MelB transport mechanism is shown in
Figure 1.12. The melibiose efflux includes eight states following the black arrow's
direction: [1] Inward Na+-bound state. Binding of a Na+ to the cation-binding site
induces an increase in sugar affinity. [2] Inward Na+-bound and melibiose-bound state.
[3] Occluded Na+-bound and melibiose-bound state. [4] Outward Na+-bound and
melibiose-bound state. [5] Outward melibiose-released state. [6] Outward
Na+-released state. [7] Occluded-empty state. Formation of the unloaded intermediate
state occluded on both sides. [8] Inward-empty state. When the cavity is open to the
cytoplasmic side, the next transport cycle begins.13
INTRODUCTION Universitat Autònoma de Barcelona
18
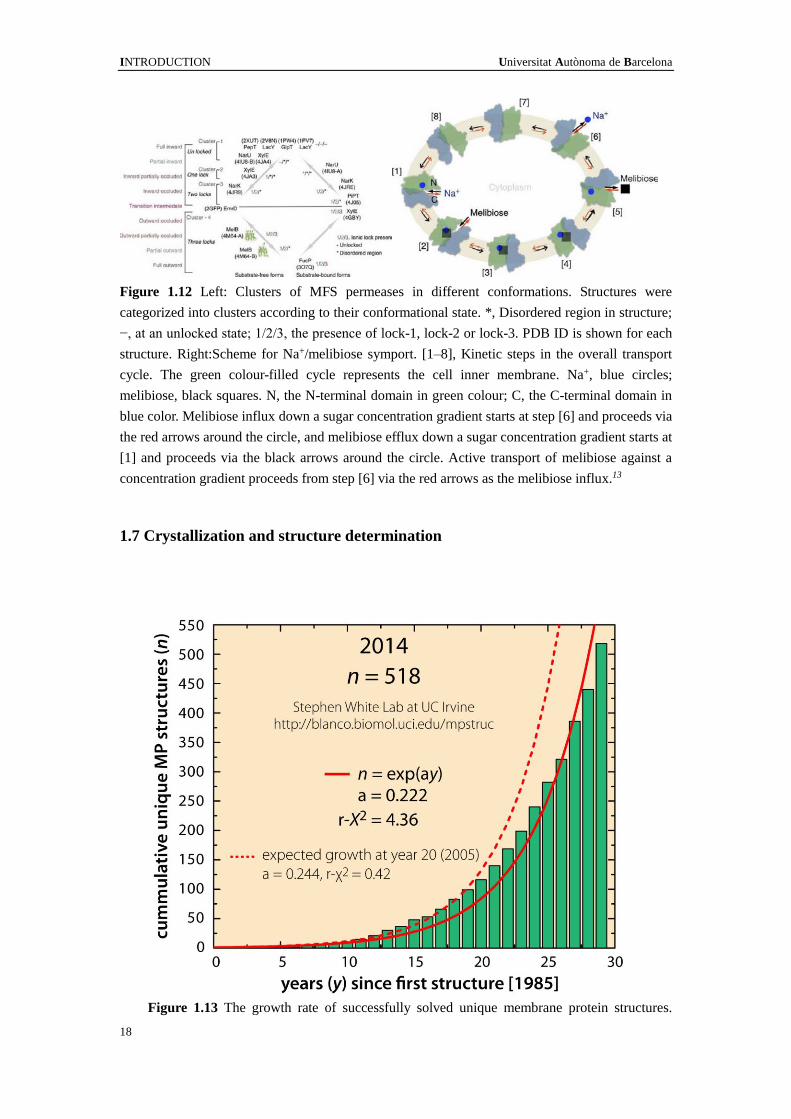
Figure 1.12 Left: Clusters of MFS permeases in different conformations. Structures were
categorized into clusters according to their conformational state. *, Disordered region in structure;
−, at an unlocked state; 1/2/3, the presence of lock-1, lock-2 or lock-3. PDB ID is shown for each
structure. Right:Scheme for Na+/melibiose symport. [1–8], Kinetic steps in the overall transport
cycle. The green colour-filled cycle represents the cell inner membrane. Na+, blue circles;
melibiose, black squares. N, the N-terminal domain in green colour; C, the C-terminal domain in
blue color. Melibiose influx down a sugar concentration gradient starts at step [6] and proceeds via
the red arrows around the circle, and melibiose efflux down a sugar concentration gradient starts at
[1] and proceeds via the black arrows around the circle. Active transport of melibiose against a
concentration gradient proceeds from step [6] via the red arrows as the melibiose influx.13
1.7 Crystallization and structure determination
Figure 1.13 The growth rate of successfully solved unique membrane protein structures.

Universitat Autònoma de Barcelona INTRODUCTION
19
(Membrane Proteins of Known Structure; http://blanco.biomol.uci.edu/mpstruc/)
When the first membrane protein crystal structure was determined,
crystallization of a membrane protein was widely perceived as extremely arduous.
Now, that perception has changed drastically, and the process is nearly regarded as
routine.55 The progress of the membrane protein structural biology has been tracked
on Stephen White’s website (http://blanco.biomol.uci.edu/mpstruc/). The growth rate
of successfully solved unique membrane protein structures is presented in Figure 1.13.
A statistics of crystallization methods used for new structure reported from 2012 to
mid-2014 in different types of membrane proteins is shown in table 1.5. It means the
majority of structures currently being determined utilize direct crystallization of
protein–detergent complexes, suggesting that this approach should be tried first for
most new membrane-protein targets.55
Table 1.5 Crystallization methods used for new structure reports from 2012 to mid-2014.55
Protein class Crystalized
using bicelles
Crystalized
using lipidic
mesophase
Crystalized as
protein-detergent
complex
total No.
identified
monotopic 1 0 11 12
beta barrel 3 2 22 27
alpha (total) 8 39 145 192
There are three basic types of three-dimensional membrane protein crystals
(Figure 1.14): Type I crystals consist of ordered stacks of two-dimensional crystals,
which are present in a bilayer; In type II three-dimensional crystals, the hydrophobic
surface of membrane proteins is covered by a detergent micelle. Stable crystal
contacts are made between the hydrophilic surfaces of the protein; in a modification
of type II (type II b), tightly and specifically bound antibody fragments add a
hydrophilic domain to the complex. This surface expansion provides additional sites
for crystal contacts and space for the detergent micelle.56

INTRODUCTION Universitat Autònoma de Barcelona
20
Figure 1.14 Basic types of three-dimensional membrane protein crystals. Type I crystals consist of
ordered stacks of two-dimensional crystals, which are present in a bilayer. In the detergent
solubilized state the hydrophobic surface of membrane proteins is covered by a micelle. This
membrane protein-detergent complexes form so-called type II three-dimensional crystals. Stable
crystal contacts are made between the hydrophilic surfaces of the protein. In a modification of
type II (type II b), tightly and specifically bound antibody fragments add a hydrophilic domain to
the complex. This surface expansion provides additional sites for crystal contacts and space for the
detergent micelle.56
Membrane proteins crystallized in type I was used for structure determination by
electron microscopy. Several structures of membrane proteins at medium resolution
(~5 – 10 Å) have already been obtained. But higher resolution can be obtained by
X-ray crystallography using type II (or type II b) crystals. 56
1.8 Biophysical studies of MelB

Universitat Autònoma de Barcelona INTRODUCTION
21
1.8.1 Förster Resonance Energy Transfer (FRET)
The galactosyl analog 2’-(N-dansyl)-aminoethyl-1-thio-D-galactopyranoside
(D2G), which can bind to MelB, but cannot be transported, is an artificial ligand of the
melibiose permease.57, 58 This fluorescent probe was invented to test binding abilities
in the MelB transporter. It was used for vesicles as well as for proteoliposomes of the
MelB transporter. The emitted fluorescence of D2G can be recorded by exciting the
intrinsic tryptophans at 295 nm and examining the FRET. Like melibiose, the binding
affinity of D2G was increased when sodium was added. This result also supports the
idea that D2G and melibiose were using the same binding site. The fluorescence
emission maximum of the D2G bound to MelB is around 460 nm. The intensity of the
D2G fluorescence at 460 nm is relatively small in sodium-free medium (Figure 1.15).
The fluorescence signal was highly increased when sodium was added. The signal of
D2G bound to MelB recorded in sodium medium is blue shifted around 25 nm from
that recorded in the absence of NaCl, suggesting a hydrophobic environment
surrounding the fluorescent probe.58
A
Rela
tiv
e f
luo
rescen
ce i
nte
nsit
y
Figure 1.15 A: FRET of the melibiose permease wild type protein, a: only protein, b: MelB with
15 μM D2G, c: MelB with 15 μM D2G with 10 mM NaCl, d: MelB with 15 μM D2G, 10 mM NaCl
and 150 mM melibiose – competitive replacement of D2G. B: Effect of NaCl on the spectral
properties of D2G bound to MelB by illuminating at 295 nm. a: in the absence of NaCl; b: after the
addition of NaCl.
Wavelength (nm)

INTRODUCTION Universitat Autònoma de Barcelona
22
1.8.2 Fourier Transform Infrared (FTIR) spectroscopy
FTIR spectroscopy is a well-established biophysical technique for the
examination of protein secondary structure and structural changes59. Identification of
protein secondary structure components and their relative proportion in the overall
structure can be derived from an analysis of the protein absorption due to the vibration
in the amide I and II bands. 60
Moreover, the effect of substituting D for H atoms in the protein signal provides
an additional insight into the protein backbone to the aqueous solvent.61 Data from
FTIR spectroscopy revealed the secondary structure composition of the MelB
transporter. The protein consisted of α-helices, β-sheets, 310-helices and unordered
domains (Table 1.6). The fact that the secondary structure of MelB is constituted by
α-helices is in agreement with the 12 transmembrane helices.13 Sodium and melibiose
induced conformational changes in MelB can be detected by infrared spectroscopy in
the region of amide I and amide II.62
Table 1.6 Secondary structure composition and assignments of MelBEC
H2O D2O
Wavenumber* (cm-1) % area* Assignment Wavenumber* (cm-1) % area* Assignment
1683 17 Rev. turns
1683 16 Rev. turns
1676
1678
1669
1671
1665
1660 49 α, unordered
1660 42 α
1653
1653
1647 12 310, open loops, α
1646 13 unordered, α
1640
1638 29 β-sheets,310, open loops
1634 20 β-sheets
1629
1628
*The values were rounded off to the nearest integer

Universitat Autònoma de Barcelona INTRODUCTION
23
Attenuated total reflection Fourier transform infrared spectroscopy is one of the
most powerful methods. ATR difference spectroscopy permits the study of the
transport mechanism of substances with membrane proteins by the alternating
perfusion of a substrate-containing buffer and the reference buffer.29, 43, 63, 64 A stable
protein film on to the top of the germanium ATR crystal is required.65
The MelB mutant was constructed with Cless permease used as the molecular
background. León et al checked the similarity of the substrate-induced difference
spectra of the Cless and the WT permeases. The results showed that the main parts of
the difference spectra (Figure 1.16, 1.17, 1.18) are very similar, albeit not entirely
identical, and yield comparable information on fully active MelB permeases.43 Hence,
Cless has a limited impact on changes due to sodium binding or melibiose interaction
in the presence of sodium or proton. Spectra deconvolution by the maximum entropy
method 66 was applied to resolve overlapped bands of the difference spectra. It reveals
that the Cless’ peaks are similar to the wild-type transporter (Figure 1.16, 1.17, 1.18).
For the sodium-induced difference spectrum of Cless, the peaks in the 1660-1651
cm-1 interval (amide I) and around 1540 cm-1 (amide II) are assigned to α-helix
structures. The detected peaks at 1741/1726 cm-1 and 1403/1384 cm-1 are assigned to
the vibration of the protonated and deprotonated carboxylic acids, respectively.65
The melibiose-induced spectra in the presence of the proton or the sodium are
very different from the sodium-elicited IR difference spectra in shape and intensity.
Since the melibiose molecular is bigger than the sodium ion, this suggests that
melibiose induces greater conformational changes than binding of cation alone. Peaks
related to α-helix structures are detected at 1668, 1659 and 1653 cm-1. The β-structure
peaks are at 1688, 1680, 1672, 1643 and 1633 cm-1.67

INTRODUCTION Universitat Autònoma de Barcelona
24
Figure 1.16 Comparison of Na+-induced difference spectra of Cless and WT permeases.43 (A)
(solid line) difference spectrum of Cless in 20 mM MES, 100 mM KCl, 10 mM NaCl, pH 6,6
minus Cless in 20 mM MES, 110 mM KCl, pH 6,6; (shaded line) difference spectrum of WT
under the same conditions. (B) deconvoluted of the spectra shown in A.
Figure 1.17 Comparison of melibiose-induced difference spectra of Cless and WT permeases in
the presence of Na+. 43(A) (solid line) difference spectrum of Cless in 20 mM MES, 100 mM KCl,
10 mM NaCl, 10 mM melibiose, pH 6.6 minus Cless in 20 mM MES, 100 mM KCl, 10 mM NaCl,
pH 6.6; (shaded line) difference spectrum of WT under the same conditions. (B) deconvoluted of
the spectra shown in A.
Figure 1.18 Comparison of melibiose-induced difference spectra of Cless and WT permeases, in
the presence of H+.43 (A) (solid line) difference spectrum of Cless in 20 mM MES, 100 mM KCl,
50 mM melibiose, pH 6.6 minus Cless in 20 mM MES, 100 mM KCl, pH 6.6; (shaded line)
difference spectrum of WT under the same conditions. (B) deconvoluted of the spectra shown in
A.
Wavenumber (cm-1) Wavenumber (cm-1)
Wavenumber (cm-1) Wavenumber (cm-1)
Wavenumber (cm-1) Wavenumber (cm-1)

Universitat Autònoma de Barcelona INTRODUCTION
25
1.9 Molecular dynamics simulations
The lack of complete knowledge of the biochemical properties and the detailed
structure of membrane transporters makes it difficult to deeply understand the
transporter mechanism. In recent years, the availability of 2D and 3D structures
obtained by X-ray and EM crystallography13, 26, 27, as well as contributions from
computational and theoretical approaches29, has greatly enhanced our understanding
of melibiose permease. Despite these advancements, the resolved 3D structures13 of
MelB transporters are still not enough for a deeper understanding of the movement of
the substrates. Moreover, transport is not a static process, so the molecular dynamics
simulations may be able to provide the dynamic aspects of the transport process.
Molecular dynamics simulations are largely based on classical mechanics and
statistical mechanics theories.68 In a typical atomistic MD simulation, interactions are
calculated between atoms using a set of parameters that define a potential energy
function, representing a “force field”.69
Various force fields (AMBER70, CHARMM71, OPLS72 and so on.) are available
for biomolecular simulations, with minor differences in parameters of their potential
energy functions. A typical potential energy function for biomolecular simulations, E,
includes terms that describe bonded (bonds, bond angles, dihedral angles, etc.) and
nonbonded (van der Waals and electrostatic) interactions:
Ebonded = Ebond + Eangle + Edihedral
Enonbonded = EvdW + Eelec
Etotal = Ebonded + Enonbonded
Various software is also available, such as ACEMD, NAMD, GROMOS, ect.
Detailed information is in Materials and methods part.

INTRODUCTION Universitat Autònoma de Barcelona
26
Figure 1.19 Coarse-grained molecular dynamic simulation of MelBST according to Stansfeld et
al73. Asn-58 is in red color, Arg-52 is in yellow color.
For MelBST, there is a simulation result published, using Coarse-grained
molecular dynamics (CGMD) simulations. The CGMD simulations enable insertion
of membrane proteins into explicit models of lipid bilayers. Figure 1.19 shows the
MelBST inserted into the lipid bilayer with some highlighted residues.73
Moreover, in our group previous work29 showed an interesting result in the
molecular dynamics simulations of MelBEC (Figure 1.20). The Lys-377 was attracted
by Asp-59 and Asp-55 during the MD simulations in the absence of sodium, and kept
a stable distance with Tyr-120 and Asp-124. But when the Asp-59 was protonated, the
Lys-377 was interacting with Asp-55 and away from Tyr-120 instead of standstill
(Figure 1.21). When the sodium was positioned in the middle of Asp-55, Asp-59,
Tyr120, Asp124 and Lys-377, the Na+ binding site appeared (Figure 1.22).

Universitat Autònoma de Barcelona INTRODUCTION
27
Figure 1.20 Molecular dynamics of MelBEC. (A) The simulated system after equilibration for 200
ps. The expanded figure shows a snapshot of the proposed cation binding site environment, after
200 ns simulation. The protein is shown in cartoon representation (blue), with the cytoplasmic side
at the bottom. The POPE bilayer (light blue) and the waters (red) are drawn in lines. Na+ (blue)
and Cl- (red) are drawn in van der Waals representation. The MelBST-A crystal structure 4M64 (6)
was mutated in all amino acids corresponding to those of MelB, briefly minimized and included in
a bilayer of POPE with layers of water molecules and NaCl 0.3 M were finally added (see
Methods). The figure was generated with VMD software (25). (B) Drift from the initial structure
as measured by the RMSD of backbone Cα atoms. (C) Time course of the specified distances,
indicative of the location of the NZ atom of K377 interacting with the CG atom of D55 and D59
but distant from the OH atom of Y120 or the CG atom of D124.29

INTRODUCTION Universitat Autònoma de Barcelona
28
Figure 1.21 Simulation of MelB with D59 protonated. (A) Snapshot of the substrate’s binding
sites region of MelB with D59 protonated, after 220 ns simulation. (B) Time course of the
distances between the NZ atom of K377 and the CG atom of D55 or the OH atom of Y120.29
Figure 1.22 Organization of the Na+ binding site. (A) Snapshot of the proposed binding site
environment of MelB with a Na+ positioned initially in between D55 and D59, after 330 ns of
simulation. (B) Detail of the Na+ binding site showing the ligands from the protein.29

Universitat Autònoma de Barcelona INTRODUCTION
29
REFERENCES
1. Yildirim, M. A., Goh, K. I., Cusick, M. E., Barabasi, A. L., and Vidal, M. (2007) Drug-target
network, Nature biotechnology 25, 1119-1126.
2. Shi, Y., and Hu, F. B. (2014) The global implications of diabetes and cancer, Lancet 383,
1947-1948.
3. Lodish, Berk, Kaiser, Bretscher, Ploegh, Amon, and Scott (2008) Molecular cell biology,
Sixth ed.
4. Nelson, D. L. (2008) Lehninger Principles of Biochemistry, 5th ed., SARA TENNEY, New
York.
5. Karp, G. (2010) Cell and Molecular Biology-Concepts and Experiments.Gerald.Karp, 6th ed.,
wiley.
6. Wallin, E., and von Heijne, G. (1998) Genome-wide analysis of integral membrane proteins
from eubacterial, archaean, and eukaryotic organisms, Protein Science 7, 1029-1038.
7. Lodish, Berk, Kaiser, Bretscher, Ploegh, Amon, and Scott (2013) Molecular cell biology,
Seventh ed.
8. Saier, M. H., Jr., Reddy, V. S., Tamang, D. G., and Vastermark, A. (2014) The transporter
classification database, Nucleic acids research 42, D251-258.
9. Reddy, V. S., Shlykov, M. A., Castillo, R., Sun, E. I., and Saier, M. H., Jr. (2012) The major
facilitator superfamily (MFS) revisited, The FEBS journal 279, 2022-2035.
10. Yan, N. (2013) Structural advances for the major facilitator superfamily (MFS) transporters,
Trends in biochemical sciences 38, 151-159.
11. Shi, Y. (2013) Common folds and transport mechanisms of secondary active transporters,
Annual review of biophysics 42, 51-72.
12. Yan, N. (2015) Structural Biology of the Major Facilitator Superfamily Transporters, Annual
review of biophysics 44, 257-283.
13. Ethayathulla, A. S., Yousef, M. S., Amin, A., Leblanc, G., Kaback, H. R., and Guan, L. (2014)
Structure-based mechanism for Na(+)/melibiose symport by MelB, Nature communications 5,
3009.
14. Poolman, B., Knol, J., van der Does, C., Henderson, P. J., Liang, W. J., Leblanc, G., Pourcher,
T., and Mus-Veteau, I. (1996) Cation and sugar selectivity determinants in a novel family of
transport proteins, Molecular microbiology 19, 911-922.
15. Chaptal, V., Kwon, S., Sawaya, M. R., Guan, L., Kaback, H. R., and Abramson, J. (2011)
Crystal structure of lactose permease in complex with an affinity inactivator yields unique
insight into sugar recognition, Proceedings of the National Academy of Sciences of the United
States of America 108, 9361-9366.
16. Wilson, D. M., and Wilson, T. H. (1987) Cation specificity for sugar substrates of the
melibiose carrier in Escherichia coli, Biochimica et biophysica acta 904, 191-200.
17. Pardee, A. B. (1957) An inducible mechanism for accumulation of melibiose in Escherichia
coli, Journal of bacteriology 73, 376-385.
18. Stock, J., and Roseman, S. (1971) A sodium-dependent sugar co-transport system in bacteria,
Biochemical and biophysical research communications 44, 132-138.
19. Tokuda, H., and Kaback, H. R. (1977) Sodium-dependent methyl
1-thio-beta-D-galactopyranoside transport in membrane vesicles isolated from Salmonella
typhimurium, Biochemistry 16, 2130-2136.

INTRODUCTION Universitat Autònoma de Barcelona
30
20. Pourcher, T., Bassilana, M., Sarkar, H. K., Kaback, H. R., and Leblanc, G. (1990) The
melibiose/Na+ symporter of Escherichia coli: kinetic and molecular properties, Philosophical
transactions of the Royal Society of London. Series B, Biological sciences 326, 411-423.
21. Botfield, M. C., Naguchi, K., Tsuchiya, T., and Wilson, T. H. (1992) Membrane topology of
the melibiose carrier of Escherichia coli, The Journal of biological chemistry 267, 1818-1822.
22. Pourcher, T., Bibi, E., Kaback, H. R., and Leblanc, G. (1996) Membrane topology of the
melibiose permease of Escherichia coli studied by melB-phoA fusion analysis, Biochemistry
35, 4161-4168.
23. Gwizdek, C., Leblanc, G., and Bassilana, M. (1997) Proteolytic mapping and substrate
protection of the Escherichia coli melibiose permease, Biochemistry 36, 8522-8529.
24. Franco, P. J., and Wilson, T. H. (1999) Arg-52 in the melibiose carrier of Escherichia coli is
important for cation-coupled sugar transport and participates in an intrahelical salt bridge,
Journal of bacteriology 181, 6377-6386.
25. Yousef, M. S., and Guan, L. (2009) A 3D structure model of the melibiose permease of
Escherichia coli represents a distinctive fold for Na+ symporters, Proceedings of the National
Academy of Sciences of the United States of America 106, 15291-15296.
26. Hacksell, I., Rigaud, J. L., Purhonen, P., Pourcher, T., Hebert, H., and Leblanc, G. (2002)
Projection structure at 8 Å resolution of the melibiose permease, an Na-sugar co-transporter
from Escherichia coli, The EMBO journal 21, 3569-3574.
27. Purhonen, P., Lundback, A. K., Lemonnier, R., Leblanc, G., and Hebert, H. (2005)
Three-dimensional structure of the sugar symporter melibiose permease from cryo-electron
microscopy, Journal of structural biology 152, 76-83.
28. Granell, M., Leon, X., Leblanc, G., Padros, E., and Lorenz-Fonfria Victor, A. (2010) Structural
insights into the activation mechanism of melibiose permease by sodium binding, Proceedings
of the National Academy of Sciences of the United States of America 107, 22078-22083.
29. Fuerst, O., Lin, Y., Granell, M., Leblanc, G., Padros, E., Lorenz-Fonfria, V. A., and Cladera, J.
(2015) The Melibiose Transporter of Escherichia coli: CRITICAL CONTRIBUTION OF
LYS-377 TO THE STRUCTURAL ORGANIZATION OF THE INTERACTING
SUBSTRATE BINDING SITES, The Journal of biological chemistry 290, 16261-16271.
30. Mitchell, P. (1957) A general theory of membrane transport from studies of bacteria, Nature
180, 134-136.
31. Deisenhofer, J., Epp, O., Miki, K., Huber, R., and Michel, H. (1985) Structure of the Protein
Subunits in the Photosynthetic Reaction Center of Rhodopseudomonas-Viridis at 3a
Resolution, Nature 318, 618-624.
32. Forrest, L. R., and Rudnick, G. (2009) The rocking bundle: a mechanism for ion-coupled
solute flux by symmetrical transporters, Physiology 24, 377-386.
33. Slotboom, D. J. (2014) Structural and mechanistic insights into prokaryotic energy-coupling
factor transporters, Nat Rev Microbiol 12, 79-87.
34. Forrest, L. R., Kramer, R., and Ziegler, C. (2011) The structural basis of secondary active
transport mechanisms, Biochimica et biophysica acta 1807, 167-188.
35. Kaback, H. R., Smirnova, I., Kasho, V., Nie, Y., and Zhou, Y. (2011) The alternating access
transport mechanism in LacY, The Journal of membrane biology 239, 85-93.
36. Madej, M. G., Sun, L., Yan, N., and Kaback, H. R. (2014) Functional architecture of MFS
D-glucose transporters, Proceedings of the National Academy of Sciences of the United States

Universitat Autònoma de Barcelona INTRODUCTION
31
of America 111, E719-727.
37. Shimamura, T., Weyand, S., Beckstein, O., Rutherford, N. G., Hadden, J. M., Sharples, D.,
Sansom, M. S., Iwata, S., Henderson, P. J., and Cameron, A. D. (2010) Molecular basis of
alternating access membrane transport by the sodium-hydantoin transporter Mhp1, Science
328, 470-473.
38. Yamashita, A., Singh, S. K., Kawate, T., Jin, Y., and Gouaux, E. (2005) Crystal structure of a
bacterial homologue of Na+/Cl--dependent neurotransmitter transporters, Nature 437, 215-223.
39. Ressl, S., Terwisscha van Scheltinga, A. C., Vonrhein, C., Ott, V., and Ziegler, C. (2009)
Molecular basis of transport and regulation in the Na(+)/betaine symporter BetP, Nature 458,
47-52.
40. Faham, S., Watanabe, A., Besserer, G. M., Cascio, D., Specht, A., Hirayama, B. A., Wright, E.
M., and Abramson, J. (2008) The crystal structure of a sodium galactose transporter reveals
mechanistic insights into Na+/sugar symport, Science 321, 810-814.
41. Watanabe, A., Choe, S., Chaptal, V., Rosenberg, J. M., Wright, E. M., Grabe, M., and
Abramson, J. (2010) The mechanism of sodium and substrate release from the binding pocket
of vSGLT, Nature 468, 988-991.
42. Wright, E. M., Loo, D. D., and Hirayama, B. A. (2011) Biology of human sodium glucose
transporters, Physiological reviews 91, 733-794.
43. Leon, X., Leblanc, G., and Padros, E. (2009) Alteration of sugar-induced conformational
changes of the melibiose permease by mutating Arg141 in loop 4-5, Biophys. J. 96,
4877-4886.
44. Newstead, S., Drew, D., Cameron, A. D., Postis, V. L., Xia, X., Fowler, P. W., Ingram, J. C.,
Carpenter, E. P., Sansom, M. S., McPherson, M. J., Baldwin, S. A., and Iwata, S. (2011)
Crystal structure of a prokaryotic homologue of the mammalian oligopeptide-proton
symporters, PepT1 and PepT2, The EMBO journal 30, 417-426.
45. Guan, L., Mirza, O., Verner, G., Iwata, S., and Kaback, H. R. (2007) Structural determination
of wild-type lactose permease, Proceedings of the National Academy of Sciences of the United
States of America 104, 15294-15298.
46. Abramson, J., Smirnova, I., Kasho, V., Verner, G., Kaback, H. R., and Iwata, S. (2003)
Structure and mechanism of the lactose permease of Escherichia coli, Science 301, 610-615.
47. Huang, Y., Lemieux, M. J., Song, J., Auer, M., and Wang, D. N. (2003) Structure and
mechanism of the glycerol-3-phosphate transporter from Escherichia coli, Science 301,
616-620.
48. Yan, H., Huang, W., Yan, C., Gong, X., Jiang, S., Zhao, Y., Wang, J., and Shi, Y. (2013)
Structure and mechanism of a nitrate transporter, Cell reports 3, 716-723.
49. Quistgaard, E. M., Low, C., Moberg, P., Tresaugues, L., and Nordlund, P. (2013) Structural
basis for substrate transport in the GLUT-homology family of monosaccharide transporters,
Nature structural & molecular biology 20, 766-768.
50. Zheng, H., Wisedchaisri, G., and Gonen, T. (2013) Crystal structure of a nitrate/nitrite
exchanger, Nature 497, 647-651.
51. Pedersen, B. P., Kumar, H., Waight, A. B., Risenmay, A. J., Roe-Zurz, Z., Chau, B. H.,
Schlessinger, A., Bonomi, M., Harries, W., Sali, A., Johri, A. K., and Stroud, R. M. (2013)
Crystal structure of a eukaryotic phosphate transporter, Nature 496, 533-536.
52. Yin, Y., He, X., Szewczyk, P., Nguyen, T., and Chang, G. (2006) Structure of the multidrug

INTRODUCTION Universitat Autònoma de Barcelona
32
transporter EmrD from Escherichia coli, Science 312, 741-744.
53. Sun, L., Zeng, X., Yan, C., Sun, X., Gong, X., Rao, Y., and Yan, N. (2012) Crystal structure of
a bacterial homologue of glucose transporters GLUT1-4, Nature 490, 361-366.
54. Dang, S., Sun, L., Huang, Y., Lu, F., Liu, Y., Gong, H., Wang, J., and Yan, N. (2010) Structure
of a fucose transporter in an outward-open conformation, Nature 467, 734-738.
55. Loll, P. J. (2014) Membrane proteins, detergents and crystals: what is the state of the art?, Acta
crystallographica. Section F, Structural biology communications 70, 1576-1583.
56. Hunte, C., and Michel, H. (2003) 7 - Membrane Protein Crystallization, In Membrane Protein
Purification and Crystallization (Second Edition) (Hunte, C., Jagow, G. V., and Schägger, H.,
Eds.), pp 143-160, Academic Press, San Diego.
57. Cordat, E., Mus-Veteau, I., and Leblanc, G. (1998) Structural studies of the melibiose
permease of Escherichia coli by fluorescence resonance energy transfer. II. Identification of
the tryptophan residues acting as energy donors, The Journal of biological chemistry 273,
33198-33202.
58. Maehrel, C., Cordat, E., Mus-Veteau, I., and Leblanc, G. (1998) Structural studies of the
melibiose permease of Escherichia coli by fluorescence resonance energy transfer. I. Evidence
for ion-induced conformational change, The Journal of biological chemistry 273,
33192-33197.
59. Barth, A. (2007) Infrared spectroscopy of proteins, Bba-Bioenergetics 1767, 1073-1101.
60. Goormaghtigh, E., Raussens, V., and Ruysschaert, J. M. (1999) Attenuated total reflection
infrared spectroscopy of proteins and lipids in biological membranes, Bba-Rev Biomembranes
1422, 105-185.
61. Dave, N., Troullier, A., Mus-Veteau, I., Dunach, M., Leblanc, G., and Padros, E. (2000)
Secondary structure components and properties of the melibiose permease from Escherichia
coli: a fourier transform infrared spectroscopy analysis, Biophysical journal 79, 747-755.
62. Dave, N., Lorenz-Fonfria, V. A., Villaverde, J., Lemonnier, R., Leblanc, G., and Padros, E.
(2002) Study of amide-proton exchange of Escherichia coli melibiose permease by attenuated
total reflection-fourier transform infrared spectroscopy - Evidence of structure modulation by
substrate binding, Journal of Biological Chemistry 277, 3380-3387.
63. Lorenz-Fonfria, V. A., Leon, X., and Padros, E. (2012) Studying substrate binding to
reconstituted secondary transporters by attenuated total reflection infrared difference
spectroscopy, Methods in molecular biology 914, 107-126.
64. Lin, Y., Fuerst, O., Granell, M., Leblanc, G., Lorenz-Fonfria, V., and Padros, E. (2013) The
substitution of Arg149 with Cys fixes the melibiose transporter in an inward-open
conformation, Biochimica et biophysica acta 1828, 1690-1699.
65. Leon, X., Lorenz-Fonfria, V. A., Lemonnier, R., Leblanc, G., and Padros, E. (2005)
Substrate-induced conformational changes of melibiose permease from Escherichia coli
studied by infrared difference spectroscopy, Biochemistry 44, 3506-3514.
66. Lorenz-Fonfria, V. A., and Padros, E. (2005) Maximum entropy deconvolution of infrared
spectra: Use of a novel entropy expression without sign restriction, Applied Spectroscopy 59,
474-486.
67. León Madrenas, X. (2006) Estudi dels canvis estructurals de la permeasa de melibiosa
d'Escherichia coli induïts per la unió dels substrats, In Departament de Bioquímica i Biologia
Molecular, Universitat Autònoma de Barcelona.

Universitat Autònoma de Barcelona INTRODUCTION
33
68. Allen, M. P., and Tildesley, D. J. (1987) Computer simulation of liquids, Clarendon Press;
Oxford University Press, Oxford England New York.
69. Shaikh, S. A., Li, J., Enkavi, G., Wen, P. C., Huang, Z., and Tajkhorshid, E. (2013) Visualizing
functional motions of membrane transporters with molecular dynamics simulations,
Biochemistry 52, 569-587.
70. Case, D. A., Cheatham, T. E., 3rd, Darden, T., Gohlke, H., Luo, R., Merz, K. M., Jr., Onufriev,
A., Simmerling, C., Wang, B., and Woods, R. J. (2005) The Amber biomolecular simulation
programs, Journal of computational chemistry 26, 1668-1688.
71. MacKerell, A. D., Bashford, D., Bellott, M., Dunbrack, R. L., Evanseck, J. D., Field, M. J.,
Fischer, S., Gao, J., Guo, H., Ha, S., Joseph-McCarthy, D., Kuchnir, L., Kuczera, K., Lau, F. T.
K., Mattos, C., Michnick, S., Ngo, T., Nguyen, D. T., Prodhom, B., Reiher, W. E., Roux, B.,
Schlenkrich, M., Smith, J. C., Stote, R., Straub, J., Watanabe, M., Wiorkiewicz-Kuczera, J.,
Yin, D., and Karplus, M. (1998) All-atom empirical potential for molecular modeling and
dynamics studies of proteins, J Phys Chem B 102, 3586-3616.
72. Kaminski, G. A., Friesner, R. A., Tirado-Rives, J., and Jorgensen, W. L. (2001) Evaluation and
Reparametrization of the OPLS-AA Force Field for Proteins via Comparison with Accurate
Quantum Chemical Calculations on Peptides†, The Journal of Physical Chemistry B 105,
6474-6487.
73. Stansfeld, P. J., Goose, J. E., Caffrey, M., Carpenter, E. P., Parker, J. L., Newstead, S., and
Sansom, M. S. (2015) MemProtMD: Automated Insertion of Membrane Protein Structures
into Explicit Lipid Membranes, Structure 23, 1350-1361.

INTRODUCTION Universitat Autònoma de Barcelona
34

Universitat Autònoma de Barcelona OBJECTIVES
35
2 OBJECTIVES
The E. coli melibiose permease is a member of the GPH membrane protein
family, which can transport cations and sugars through biological membranes. This
transporter has a strong hydrophobic character and a hypothetical secondary structure,
which consists of 12 transmembrane helices. Although nowadays an important corpus
of information is being gathered on the molecular structure of the sugar and cation
binding sites and the molecular dynamics of the resiudes implicated during transport,
little is still known on the importance of other parts of the protein, such as the
inter-helical loops, for the transport mechanism. The main objective of the present
work was to study the importance of loop 7-8 and the end part of helix VII for the
function (sugar transport) of MelBEC. This general objective was planned to be
achieved through the following specific objectives:
1. Obtention of point mutants (Y256C, Y257C, F258C, S259A, S259C, Y260C,
V261C, G263C, D264C, A265C, D266C, L267C, F268C).
2. Purification of the mutants and reconstituion into model membranes.
3. Characterization of substrate binding using FTIR and fluorescenc spectroscopies.
4. Protein crystallization

OBJECTIVES Universitat Autònoma de Barcelona
36

Universitat Autònoma de Barcelona MATERIALS AND METHODS
37
3 MATERIALS AND METHODS
3.1 Materials
3.1.1 Reagents
Table 3.1 Reagents
No. Name CAS Company
R 1 Ammonium Chloride 12125-02-9 Merck
R 2 Melibiose 585-99-9 Sigma aldrich
R 3 Imidazole 288-32-4 Sigma aldrich
R 4 Potassium Phosphate 16788-57-1 Merck
R 5 Ampicillin Sodium Salt 69-52-3 Melford
R 6 n-Dodecyl-ß-D-maltoside 69227-93-6 Melford
R 7 2-Mercaptoethanol 60-24-2 Sigma aldrich
R 8 DNase I
Roche
R 9 RNase
Roche
R 10 HIS-Select® Nickel Affinity Gel
Sigma aldrich
R 11 Bio-Beads SM-2 Adsorbents
Bio-Rad
R 12 EDTA Disodium Salt 6381-92-6 Melford
R 13 Potassium chloride 7447-40-7 Melford
R 14 MES monohydrate 145224-94-8 Melford
R 15 Glycine 56-40-6 Melford
R 16 Sucrose 57-50-1 Melford
R 17 Sodium Chloride 7647-14-5 Melford
R 18 Potassium Phosphate, Monobasic 7778-77-0 Melford
R 19 TRIS, [Tris(hydroxymethyl) aminomethane] 77-86-1 Melford
R 20 Glycerol 56-81-5 Melford
R 21 Thiamine hydrochloride 67-03-8 Sigma aldrich
R 22 Calcium chloride 10035-04-8 Sigma aldrich

MATERIALS AND METHODS Universitat Autònoma de Barcelona
38
R 23 Magnesium sulfate heptahydrate 10034-99-8 Merck
R 24 Lysozyme from chicken egg white 12650-88-3 Sigma aldrich
R 25 Polyoxyethylenesorbitan, monolaurate [Tween 20] 9005-64-5 Melford
R 26 Tetracycline hydrochloride ≥95% 64-75-5 Sigma aldrich
R 27 E. coli Total Lipid Extract 1240502-50-4 Avanti Polar Lipids, Inc.
R 28 KOD Hot Start DNA Polymerase
Merck
R 29 DpnI R0176S New England Biolabs (UK) Ltd
All other materials were obtained from commercial sources.
3.1.2 Kits
Table 3.2 Kits
Kits Company
K 1 QIAprep Spin Miniprep Kit (250) QIAGEN
K 2 DC™ Protein Assay BIO-RAD
3.1.3 Instruments
Table 3.3 Instruments
Name Company
M1 MaxQ™ 4000 Benchtop Orbital Shakers Thermo Fisher Scientific Inc.
M2 Heraeus™ Multifuge™ X3 Centrifuge Series Thermo Fisher Scientific Inc.
M3 Incubador con agitación orbital WY-111, COMECTA® INSTRUMENTACION CIENTIFICA TECNICA
M4 IKA Magnetic stirrers IKA® -WERKE GMBH & CO.KG
M5 BACTERIOLOGICAL INCUBATORS JP SELECTA S.A.
M6 Multi-Purpose Floor-Standing Centrifuge 1236R LABOGENE, Inc.
M7 Microultracentrífuga Sorvall Discovery M150 SE Thermo Fisher Scientific Inc.
M8 Ultracentrifuge Sorvall Combi Plus Thermo Fisher Scientific Inc.
M9 Revco Ultra-low Temperature Freezer Thermo Fisher Scientific Inc.
M10 Test tube shakers Reax top Heidolph Instruments GmbH & Co.KG
M11 Denver Instrument MXX-123 Denver Instrument
M12 Precisa Series Balances model 1834-43 Precisa Gravimetrics AG
M13 Elix® Essential 10 Water Purification Systems Merck Millipore ( is a division of Merck KGaA)

Universitat Autònoma de Barcelona MATERIALS AND METHODS
39
M14 Scotsman AF80 Ice Flaker Hubbard systems
M15 Microfluidizer Model 1108 Microfluidics
M16 Tectron Bio-100 JP SELECTA S.A.
M17 Sartorius Basic plus BP3100P Sartorius Spain S.A.
M18 Medidor PH BASIC 20 CRISON INSTRUMENTS, S.A.
M19 Varian Cary 50 Bio UV/ Visible Spectrophotometer Varian, Inc
M20 Varian FTIR 700e Varian, Inc
M21 GRELCO G-1312 Grelco
M22 PCR Thermal Cyclers VWR International, LLC
3.1.4 Buffers
Table 3.4 buffers
Name Composition
Luria Bertani (LB) broth
12 M Tryptone
3 M Yest extract
3 M NaCl
LB Agar
12 M Tryptone
3 M Yest extract
3 M NaCl
9 M agar
MacConkey Agars
40 M MacConkey Agar Base power
30 mM melibiose
0.1 M Ampicillin
10 mM Tetracycline
Buffer for prepare competent cells
Buffer I 12 M RbCl
9.9 M MnCl2·4H2O
3 % (v/v) 1 M K-Acetate pH 7.5
1.5 M CaCl2·2H2O
0.15 M Glycerol
Buffer II 12 M RbCl
2 % (v/v) 0.5 M MOPS pH 6.8
1100 M CaCl2·2H2O
150 M Glycerol
M9 Medium
7.5 M Na2HPO4·2H2O
MATERIALS AND METHODS Universitat Autònoma de Barcelona
40
3 M KH2PO4
1 M NH4Cl
0.5 M NaCl
pH 7.5
54 mM Glycerol
1 mM MgSO4
0.1 mM CaCl2
0.34 M Thiamine - HCl
2 M Casamino acid
0.1 M Ampicilin
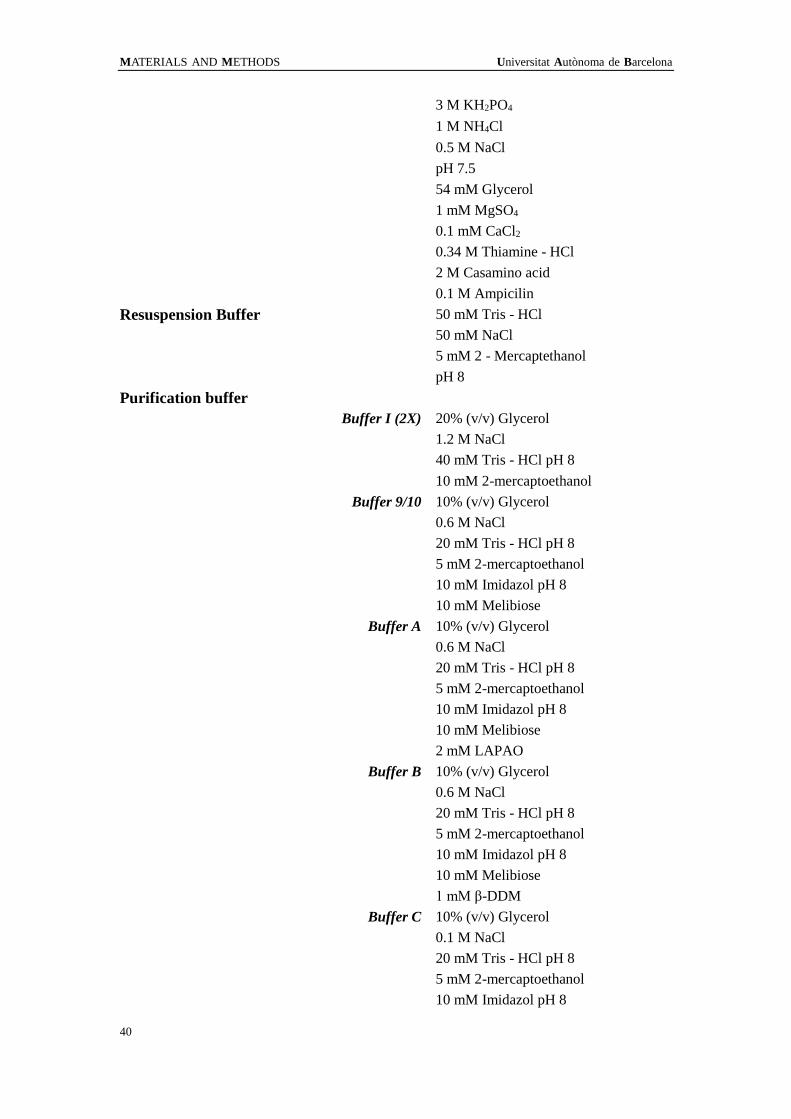
Resuspension Buffer 50 mM Tris - HCl
50 mM NaCl
5 mM 2 - Mercaptethanol
pH 8
Purification buffer
Buffer I (2X) 20% (v/v) Glycerol
1.2 M NaCl
40 mM Tris - HCl pH 8
10 mM 2-mercaptoethanol
Buffer 9/10 10% (v/v) Glycerol
0.6 M NaCl
20 mM Tris - HCl pH 8
5 mM 2-mercaptoethanol
10 mM Imidazol pH 8
10 mM Melibiose
Buffer A 10% (v/v) Glycerol
0.6 M NaCl
20 mM Tris - HCl pH 8
5 mM 2-mercaptoethanol
10 mM Imidazol pH 8
10 mM Melibiose
2 mM LAPAO
Buffer B 10% (v/v) Glycerol
0.6 M NaCl
20 mM Tris - HCl pH 8
5 mM 2-mercaptoethanol
10 mM Imidazol pH 8
10 mM Melibiose
1 mM β-DDM
Buffer C 10% (v/v) Glycerol
0.1 M NaCl
20 mM Tris - HCl pH 8
5 mM 2-mercaptoethanol
10 mM Imidazol pH 8

Universitat Autònoma de Barcelona MATERIALS AND METHODS
41
10 mM Melibiose
1 mM β-DDM
Buffer D 10% (v/v) Glycerol
0.1 M NaCl
20 mM Tris - HCl pH 8
5 mM 2-mercaptoethanol
10 mM Imidazol pH 8
10 mM Melibiose
1 mM β-DDM
Buffer of infrared spectroscopy experiments
Wash-buffer 20 mM MES
100 mM KCl
pH 6.6
Wash-buffer I 20 mM MES
110 mM KCl
pH 6.6
Wash-buffer II 20 mM MES
150 mM KCl
pH 6.6
10 mM Na+ buffer 20 mM MES
100 mM KCl
10 mM NaCl
pH 6.6
50 mM Na+ buffer 20 mM MES
100 mM KCl
50 mM NaCl
pH 6.6
50 mM Mel buffer 20 mM MES
100 mM KCl
50 mM Melibiose
pH 6.6
10 mM Mel, 10 mM Na+ buffer 20 mM MES
100 mM KCl
10 mM NaCl
10 mM Melibiose
pH 6.6
50 mM Mel, 10 mM Na+ buffer 20 mM MES
100 mM KCl
10 mM NaCl
50 mM Melibiose
pH 6.6
ISO buffer
Wash buffer 50 mM Tris-HCl
pH 8.0

MATERIALS AND METHODS Universitat Autònoma de Barcelona
42
Storage buffer 100 mM Kpi
10 mM EDTA
pH 7
Crystallization buffer
Wash buffer/ Dialysis buffer 0.17 mM β-DDM
20 mM Tris pH 7.5
50 mM Glycerol
2 mM DTT
100 mM NaCl
10 mM Melibiose
Elute buffer 0.17 mM β-DDM
20 mM Tris pH 7.5
50 mM Glycerol
2 mM DTT
100 mM NaCl
10 mM Melibiose
300 mM Imidazole
3.2 Methods
3.2.1 Obtaining the mutant proteins and the Cless protein
3.2.1.1 Bacterial strains and plasmids
The E. coli strain DW2-R (melA+ ΔmelB, ΔlacZY) was used in most of the
study 1. The strain was the recA-depleted version of the maternal DW2 strain, in
which the genes of the melibiose permease (MelB) and lactose permease (lacYZ)
have been depleted, and it has a tetracycline resistance gene. The recombinase A is
encoded by the recA gene, which can cause homologous recombination. Thus, its
depletion keeps plasmid integrity after insertion.
The plasmid pK95ΔAHB used in this study was derived from the pKK 223-3
plasmid. The vector pK95ΔAHB contains the melB gene with a genetically
engineered six successive His residues at the C-terminal, an ampicillin resistant gene,
and a part of the melA gene. The melB gene encodes for the melibiose permease and
the melA gene for the α-galactosidase from E. coli. The presence of part of the melA

Universitat Autònoma de Barcelona MATERIALS AND METHODS
43
gene resulted in an increased expression of the melibiose permease. The expression of
the melB gene and melA gene are controlled by a tac-promoter. The extra His-tag had
no effect upon the transport activity of the melibiose permease 2.
Another E. coli strain DH5α was also used in our study, but only to amplify the
pK95ΔAHB plasmid after the PCR reaction, because of its high transformation
efficiency.
3.2.1.2 Site-directed mutagenesis
The template melB gene used throughout our study was a Cless gene and the
expressed protein showed the same activity as the wild type. The Cless means absence
of cysteine in the melB gene, and the natural cysteine genes were replaced by valine
(Cys-235) or serines (Cys-110, Cys-310 and Cys-364) 3.
The primers were designed from the website (http://bioinformatics.org/primerx).
Table 5 shows the list of primers used in this study.
The parameters were set as: 1) melting temperature from 60 to 85 oC; 2) GC
content 40-60%; 3) length: 25 to 45 bp; 4) the mutation site in the center; 5)
termination in G or C is required for most cases; 6) the primer pair should be
complementary to each other.
Table 3.5 The primers used in the PCR
No. Primer Sequence1 Amino acid
change
1 Y256C-F 5' CCGGCTTTGCTATCTGTTATTTCTCATATG 3' Tyr → Cys
Y256C-R 5' CATATGAGAAATAACAGATAGCAAAGCCGG 3' Tyr → Cys
2 Y257C-F 5' CCGGCTTTGCTATCTATTGTTTCTCATATGTTATCGG 3' Tyr → Cys
Y257C-R 5' CCGATAACATATGAGAAACAATAGATAGCAAAGCCGG 3' Tyr → Cys
3 F258C-F 5' CCGGCTTTGCTATCTATTATTGCTCATATGTTAYCGGTGATG 3' Phe → Cys
F258C-R 5' CATCACCGATAACATATGAGCAATAATAGATAGCAAAGCCGG 3' Phe → Cys
4 S259A-F 5' GCTTTGCTATCTATTATTTCGCATATGTTATCGGTGATGCGG 3' Ser → Ala

MATERIALS AND METHODS Universitat Autònoma de Barcelona
44
S259A-R 5' CCGCATCACCGATAACATATGCGAAATAATAGATAGCAAAGC 3' Ser → Ala
5 S259C-F 5' GGCTTTGCTATCTATTATTTCTGCTATGTTATCGGTGATGCGGAT 3' Ser → Cys
S259C-R 5' ATCCGCATCACCGATAACATAGCAGAAATAATAGATAGCAAAGCC 3' Ser → Cys
6 Y260C-F 5' CTATTATTTCTCATGCGTTATCGGTGATGCG 3' Tyr → Cys
Y260C-R 5' CGCATCACCGATAACGCATGAGAAATAATAG 3' Tyr → Cys
7 V261C-F 5' TTATTTCTCATATTGCATCGGTGATGCGG 3' Val → Cys
V261C-R 5' CCGCATCACCGATGCAATATGAGAAATAA 3' Val → Cys
8 G263C-F 5' TTTCTCATATGTTATCTGCGATGCGGATTTGTTCCC 3' Gly → Cys
G263C-R 5' GGGAACAAATCCGCATCGCAGATAACATATGAGAAA 3' Gly → Cys
9 A265C-F 5' GTTATCGGTGATTGCGATTTGTTCCC 3' Ala → Cys
A265C-R 5' GGGAACAAATCGCAATCACCGATAAC 3' Ala → Cys
10 D266C-F 5' CATATGTTATCGGTGATGCGTGTTTGTTCCCCTATTATCTG 3' Asp → Cys
D266C-R 5' CAGATAATAGGGGAACAAACACGCATCACCGATAACATATG 3' Asp → Cys
11 L267C-F 5' CGGTGATGCGGATTGCTTCCCCTATTATCTG 3' Leu → Cys
L267C-R 5' CAGATAATAGGGGAAGCAATCCGCATCACCG 3' Leu → Cys
12 F268C-F 5' GTGATGCGGATTTGTGCCCCTATTATCTGTC 3' Phe → Cys
F268C-R 5' GACAGATAATAGGGGCACAAATCCGCATCAC 3' Phe → Cys
1mutated nucleotides are written in red bold characters
The site-directed mutation PCR is a simple process, where a double-primer PCR
mutagenesis protocol 4 was used, as shown in Figure 3.1.

Universitat Autònoma de Barcelona MATERIALS AND METHODS
45
Figure 3.1 Schematic summary of the double-primer PCR mutagenesis protocol (see the text for
explanation)
The site-directed mutagenesis procedure was as follows:

MATERIALS AND METHODS Universitat Autònoma de Barcelona
46
1. Forward or reverse primers were amplified in two separate PCR reactions
containing the Cless template.
2. Forward and reverse primer PCR products were mixed in one test tube and
denatured in order to separate the newly synthesized products from the plasmid
template.
3. Complementary strands were allowed to anneal at the given temperature (55
oC).
4. Since the template DNA was methylated, but the mutated or the newly
synthesized were not, the mixture was digested with DpnI.
5. The reannealed new plasmids were transformed into competent E. coli DH5α
cells.
The primers were synthesized by Invitrogen of Thermo Fisher Scientific
Corporation. The initial quantity of template DNA required in the reaction as well as
other components is listed in Table 3.6.
Table 3.6 The components of PCR
Element Tube 1 Tube 2
Template plasmid DNA 500 ng 500 ng
Forward primer 40 pmol -
Reverse primer - 40 pmol
MgCl2 0.2 mM 0.2 mM
dNTPs 0.2 mM 0.2 mM
10x PCR buffer for KOD hot start DNA polymerase 2.5 μL 2.5 μL
Sterile water
KOD hot start DNA polymerase 4 U/μL 4 U/μL
Final volume 25 μL 25 μL
The programmed cycles were:
a) The initial denaturation was performed at 95 oC for five minutes.
b) The following process was repeated for 30 times: denaturing DNA at 95 oC for

Universitat Autònoma de Barcelona MATERIALS AND METHODS
47
50 Seconds; annealing the primer at 55 oC for 50 Seconds; elongating the DNA at 68
oC for seven minutes.
After the 30 cycles, the two products from the two tubes were mixed and then
transferred into the PCR machine (VWR PCR Thermal Cyclers) again, with the
following procedure: 95 oC for five minutes, 90 oC for 1 minute, 80 oC for one minute,
80 oC for 30 seconds, 70 oC for 30 seconds, 60 oC for 30 seconds, 40 oC for 30
seconds, 37 oC for one minute.
Figure 3.2 Obtaining the colonies
After mixing the products, a digestion with 600 U/mL DpnI at 37 oC was carried
out overnight. The mixture was transformed into E. coli DH5α competent cells by
incubating 30 minutes on ice, followed by heat-shocking at 42 oC for 90 seconds and
then transferred on ice for 5 minutes. After adding one mL LB medium, the cells were
incubated using moderate shaking at 37 ºC for 60 minutes. Then the cells were
precipitated by centrifugation at 3000 g for five minutes (Multi-Purpose
Floor-Standing Centrifuge 1236R). Pellets were resuspended in 100 μL LB, and 100
μL of the cell suspension was spread in a Petri dish containing 100 μg/mL ampicillin
(Figure 3.2). After incubating the plates overnight at 37 ºC, 3 colonies were selected at
random and grown overnight in 12 mL LB medium plus 100 μg/mL ampicillin at 37
ºC. The plasmids were isolated using a QIAprep Spin Miniprep Kit. The plasmids
were checked by DNA sequencing at the Center for Research in Agricultural
Genomics of the Universitat Autónoma de Barcelona. (See the results in the appendix

MATERIALS AND METHODS Universitat Autònoma de Barcelona
48
1).
The correct plasmids were amplified by using E. coli DH5α cells and finally
transformed into E. coli DW2-R cells for future use in protein purification.
In this thesis, the notation used for the MelB mutants has been the one-letter
code followed by the position of the residue in the Cless (which we used as wild-type)
protein and a final character indicating the amino acid substitution.
Table 3.7 Mutations
Residue number Amino acid change Rename
256 Y→C Y256C
257 Y→C Y257C
258 F→C F258C
259 S→A S259A
259 S→C S259C
260 Y→C Y260C
261 V→C V261C
263 G→C G263C
264 D→C D264C
265 A→C A265C
266 D→C D266C
267 L→C L267C
268 F→C F268C
3.2.1.3 Bacterial cell culture
The E.coli DW2-R cells with a plasmid containing wild-type or mutated melB
genes were stored in 30% glycerol solution at -80 ºC. Before the large-scale
expression of the MelB protein, the DW2-R cells were streaked on MacConkey plates
and incubated at 30 ºC overnight. A desired single colony from plates was inoculated
into a mini culture of 12 mL LB containing 100 μg/mL ampicillin and 10 μg/mL

Universitat Autònoma de Barcelona MATERIALS AND METHODS
49
tetracycline and incubated at 30 ºC at 200 rpm overnight. Subsequently, the 12 mL
mini culture was poured into 400 mL M9 medium which was supplemented with 10
μg/mL tetracycline (midi culture) and incubated at 30 ºC at 200 rpm for around 8 h.
For the big cultures, 50 mL of the midi culture was poured into 1 L of M9 medium
and incubated at 30 ºC at 200 rpm overnight (Figure 3.3). Bacterial cells were
harvested by centrifuging at 3134 g (Multi-Purpose Floor-Standing Centrifuge 1236R)
for 30 minutes. Pellets were resuspended in resuspension buffer with supplemented
10-15% glycerol, and frozen at -80°C until further use.
Figure 3.3 Cell growth
3.2.1.4 Protein purification
The protein purification protocol was based on the one described by Pourcher et
al 2. A summary of the protocol is given in Figure 3.5. The frozen cells were thawed at
30 oC in a water bath and washed with resuspension buffer. Then the cells were
resuspended in the same buffer and incubated with 1 mM lysozyme and 15 mM
EDTA (dissolved with 3 M NaOH) at 4oC for 30 minutes with slight shaking to
destabilize the external bacterial membranes. Before the cells were lysed or disrupted
using the microfluidizer three times at 20,000 psi, 20 μg/mL DNAase, 20 μg/mL
RNAase, and 15 mM MgSO4 were added as final concentrations. The pellets,
containing the resulting inside out vesicles were collected at a centrifugal force of
100,000 g for 1 hour. The pellets were washed with purification buffer I and
centrifuged again in the same conditions for one hour. The pellets were resuspended
in buffer 9/10 and solubilized by adding 1% (w/v) LAPAO for 30 minutes at 4 ºC or
1% (w/v) DDM and 0.1 mM AEBSF (protease inhibitor) for 2 hours at 4 ºC.
Following another ultracentrifugation at 100,000 g for 50 minutes, the supernatants
were collected. To separate the MelB protein from other solubilized proteins,
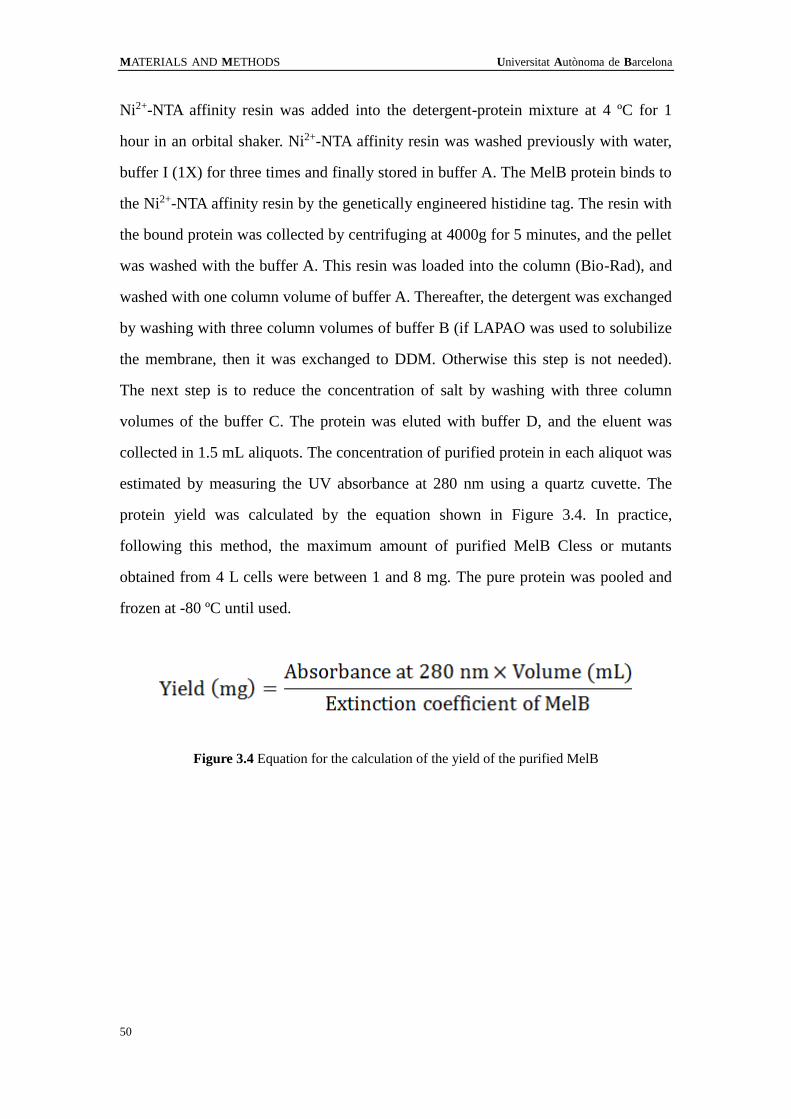
MATERIALS AND METHODS Universitat Autònoma de Barcelona
50
Ni2+-NTA affinity resin was added into the detergent-protein mixture at 4 ºC for 1
hour in an orbital shaker. Ni2+-NTA affinity resin was washed previously with water,
buffer I (1X) for three times and finally stored in buffer A. The MelB protein binds to
the Ni2+-NTA affinity resin by the genetically engineered histidine tag. The resin with
the bound protein was collected by centrifuging at 4000g for 5 minutes, and the pellet
was washed with the buffer A. This resin was loaded into the column (Bio-Rad), and
washed with one column volume of buffer A. Thereafter, the detergent was exchanged
by washing with three column volumes of buffer B (if LAPAO was used to solubilize
the membrane, then it was exchanged to DDM. Otherwise this step is not needed).
The next step is to reduce the concentration of salt by washing with three column
volumes of the buffer C. The protein was eluted with buffer D, and the eluent was
collected in 1.5 mL aliquots. The concentration of purified protein in each aliquot was
estimated by measuring the UV absorbance at 280 nm using a quartz cuvette. The
protein yield was calculated by the equation shown in Figure 3.4. In practice,
following this method, the maximum amount of purified MelB Cless or mutants
obtained from 4 L cells were between 1 and 8 mg. The pure protein was pooled and
frozen at -80 ºC until used.
Figure 3.4 Equation for the calculation of the yield of the purified MelB

Universitat Autònoma de Barcelona MATERIALS AND METHODS
51
Figure 3.5 the purification process: the cells were broken to IMV, then detergent solubilized
protein from IMV, the proteins contained His-tag were bound to nickel resin, after washed, the
pure MelB proteins were eluted
3.2.1.5 Protein reconstitution
Protein reconstitution in model membranes (liposomes) was carried out
following a procedure based on the adsorption of detergent with Bio-Beads. E. coli
lipids were dissolved rapidly in chloroform, and the chloroform was evaporated using
a rotary evaporator. In this way, a very thin lipid film was obtained. Usually, the E.
coli total lipids were prepared from a stock solution at a concentration of 10 mg/mL
buffer (20 mM MES, 100 mM KCl, pH 6.6). The lipid-buffer mix was vortexed for at
least 5 min at room temperature to form large liposomes, and then it was aliquoted
and stored at -80 oC until further use. Those liposomes were disrupted by extrusion
using 0.1 μm pore-size filter in order to downsize the diameter and yield a
homogeneous unilamellar liposome population prior to use. The liposomes were
added at a ratio of 2:1 of lipid:protein (w/w) into the protein solution. Before use,
Bio-Beads SM-2 (Bio-Rad) were washed more than 6 times with distilled water, and
one time with buffer (20 mM MES, 100 mM KCl, pH 6.6). After drying, they were
distributed into three aliquots based on 120 ~ 150 mg of Bio-Beads every one
milliliter protein solution. The liposomes were directly added to the protein solution at
4 ºC and the Bio-Beads aliquots were added by 10 min interval, then for efficient

MATERIALS AND METHODS Universitat Autònoma de Barcelona
52
detergent adsorption and protein insertion into the liposomes, the mixture was
incubated at 4 °C overnight with slight shaking. The proteoliposomes were formed as
shown in Figure 3.6. The Bio-Beads were separated from the mixture by using a
column (Bio-Rad). Proteoliposomes were collected by centrifuging at approximately
310,000 g at 4 ºC for 35 min. The pellets were washed twice with buffer (20 mM
MES, 100 mM KCl, pH 6.6). Proteoliposomes were finally resuspended in the same
buffer at approximately 20 mg/mL, then aliquoted and frozen at -80 ºC for subsequent
use.
Figure 3.6 Protein reconstitution: detergent was adsorbed by bio-beads, and at the same time
protein inserted into the liposomes
3.2.2 Preparation of vesicles

Universitat Autònoma de Barcelona MATERIALS AND METHODS
53
Figure 3.7 the formation of ISO vesicles.
3.2.2.1 Inside-out vesicles
The ISO membrane vesicles were prepared using a microfluidizer (Figure 3.7)
which is similar as a French press2, 5. In short, approximately 3 g (wet weight) of cells
was rapidly thawed at 30 ºC and washed twice with buffer (10 mM Tris-HCl, pH 8.0).
Cells were resuspended in 100 ml of the same buffer supplemented with 558 mg
EDTA (dissolved in KOH) and 100 mg lysozyme, then incubated at 4 ºC for 30 min
with slight shaking. Before applying a pressure of 20000 psi, 20 μg/mL of DNase and
RNase were added and activated by 15 mM MgSO4. This solution was passed through
the microfluidizer 3 times. The unbroken cells and large debris were eliminated by
centrifugation at 8000 g for 5 min. The supernatant was collected and centrifuged at
146,000 g for 35 minutes. The ISO membrane vesicles were washed 3 times with
buffer (100 mM Kpi, 10 mM EDTA pH 7), and resuspended in the same buffer, frozen
in liquid nitrogen and stored at -80 ºC until use.
3.2.2.2 Protein quantification of Inside-out vesicles
The Lowry’s method6 was used to check the total amount of protein in the ISO
membrane vesicles. The MelB protein was determined by western blot (Figure 3.8)
using the Histidine-Tag-specific reagent His-ProbeTM-HRP.

MATERIALS AND METHODS Universitat Autònoma de Barcelona
54
Figure 3.8 The western blot.
3.2.3 Fourier transform infrared spectroscopy (FTIR)
Figure 3.9 Schematic depiction of the Michelson interferometer
Infrared spectroscopy is one of the methods for protein structure determination.
1. Resolve protein samples
on SDS-PAGE
6. Incubate the blot with
chemiluminescent HRP
substrate and expose to film
2. Electrophoretically transfer
fractionated proteins from
gel onto nitrocellulose membrane
3. Block the membrane
with neutral protein
(BSA)
4. Incubate the membrane
with primary antibody
specific to target protein
(HisProbe-HRP)
5. Incubate the membrane
with HRP-labeled secondary
antibody specific to primary
antibody
W
E
S
T
E
R
N
B
L
O
T
7
5
5
0
3
7
2
5

Universitat Autònoma de Barcelona MATERIALS AND METHODS
55
A protein infrared spectrum provides a lot of information on the structure and the
environment of the protein backbone and the amino acid side chains7. One of the
advantages of this method is that in order to get the spectrum, there is no need to add
any external probes. For the sample, one can reconstitute the membrane protein in
liposomes8-10, resuspend it in solutions (organic, detergent or other buffers)8, 9, 11, as
well as in dry films12.
The heart of an FTIR spectrometer is the Michelson interferometer shown in
Figure 3.9. The interferometer contains a fixed mirror, a moving mirror, and a
beamsplitter. The beamsplitter transmits half of the incident radiation to the moving
mirror and reflects the other half to the fixed mirror. The two beams are reflected by
these mirrors back to the beamsplitter, where they recombine. When the fixed mirror
and the moving mirror are equidistant from the beamsplitter, the amplitudes of all
frequencies are in phase and recombine constructively. This position of zero path
difference (ZPD), or zero retardation, is where the interferogram center-burst occurs.
As the moving mirror is moved away from the beamsplitter (retarded) an optical path
difference is generated. As the position of the moving mirror changes, the two beams
travel different distances within the interferometer before recombining. A pattern of
constructive and destructive interferences is generated based on the position of the
moving mirror and the frequency of the retardation. The intensity of the radiation
varies in a complicated pattern as a function of the moving mirror position, and the
output beam is the result of the modulation by the interferometer. This modulated
output beam is then directed through the sample compartment to the detector. At the
detector it generates a continuous electrical signal called an interferogram. Then the
spectra is obtained from Fourier transformed interferograms (Figure 3.10).

MATERIALS AND METHODS Universitat Autònoma de Barcelona
56
Figure 3.10 Translation of the interferogram into a spectrum by Fourier Transformation.(A)
Interfrogram. (B) An infrared spectrum, which plots absorption (or transmittance) versus
wavenumber.
In the spectra there are many bands; an overview of amino acid side chain
infrared bands is listed in Table 3.8.
Table 3.8 Overview of amino acid side chain infrared bands*
Assignments Band position/cm−1,
(ε/M−1 cm−1) in 1H2O
Band position/cm−1,
(ε/M−1 cm−1) in 2H2O
Cys, ν(SH)
2551
1849
Asp, ν(C=O)
1716 (280)
1713 (290)
Glu, ν(C=O)
1712 (220)
1706 (280)
Asn, ν(C=O)
1677–1678 (310–330)
1648 (570)
Arg, νas(CN3H5 + )
1652–1695 (420–490)
1605–1608 (460)
Gln, ν(C=O)
1668–1687 (360–380)
1635–1654 (550)
Arg, νs(CN3H5 + )
1614–1663 (300–340)
1581–1586 (500)
HisH2 + , ν(C=C)
1631 (250)
1600 (35), 1623 (16)
Lys, δas(NH3 + )
1626–1629 (60–130)
1201
Tyr-OH, ν(CC) δ(CH)
1614–1621 (85–150)
1612–1618 (160)
Asn, δ(NH2)
1612–1622 (140–160)
Trp, ν(CC), ν(C=C)
1622
1618
Tyr–O−, ν(CC)
1599–1602 (160)
1603 (350)
Tyr–OH, ν(CC)
1594–1602 (70–100)
1590–1591 (<50)
Gln, δ(NH2)
1586–1610 (220–240)
1163
HisH, ν(C=C)
1575,1594 (70)
1569, 1575
Asp, νas(COO−)
1574–1579 (290–380)
1584 (820)
Glu, νas(COO−)
1556–1560 (450–470)
1567 (830)
Lys, δs(NH3 + )
1526–1527 (70–100)
1170
Tyr–OH, ν(CC), δ(CH)
1516–1518 (340–430)
1513–1517 (500)

Universitat Autònoma de Barcelona MATERIALS AND METHODS
57
Trp, ν(CN), δ(CH), δ(NH)
1509
Tyr–O−, ν(CC), δ(CH)
1498–1500 (700)
1498–1500 (650)
Trp, ν(CC), δ(CH)
1496
Phe, ν(CCring)
1494 (80)
δas(CH3)
1445–1480
δ(CH2)
1425–1475
Pro, ν(CN)
1400–1465
Trp, δ(CH), ν(CC), ν(CN)
1462
1455 (200)
His−, δ(CH3), ν(CN)
1439
1439
Trp, δ(NH), ν(CC), δ(CH)
1412–1435
1382
Gln, ν(CN)
1410
1409
Glu, νs(COO−)
1404 (316)
1407
Asp, νs(COO−)
1402 (256)
1404
δs(CH3)
1375 or (1368, 1385)
Trp
1352–1361
Trp
1334–1342
1334 (100)
δ(CH)
1315–1350
Trp, δ(NH), ν(CN), δ(CH)
1276
Tyr–O−, ν(C–O), ν(CC)
1269–1273 (580)
Asp, Glu, δ(COH)
1264–1450
955–1058
Trp, δ(CH), ν(CC)
1245
Tyr–OH ν(C–O), ν(CC)
1235–1270 (200)
1248–1265 (150)
His, δ(CH), ν(CN), δ(NH)
1217, 1229, 1199
1217, 1223, 1239
Trp, ν(CC)
1203
Ser, δ(COH) or δ(CO2H), ν(CO) 1181–1420
875–985
γw(CH2)
1170–1382
Tyr–OH, δ(COH)
1169–1260 (200)
913
Asp,Glu, ν(C\O)
1160–1253
1250–1300
His, ν(CN), δ(CH)
1104,1090,1106,1094
1104,1096,1107,1110
Trp, δ(CH), ν(NC)
1092
Trp, ν(NC), δ(CH), ν(CC)
1064
γt(CH2)
1063–1295
Thr, ν(C-O)
1075–1150
Ser, ν(C-O)
1030
1023
Trp, ν(CC), δ(CH)
1012–1016
1012
Ser, ν(CO) or ν(CC)
983
Ser, ν(CO), δ(CO2H)
940
Thr, δ(CO2H)
865–942
γr(CH2) 724–1174
*detail information see reference13

MATERIALS AND METHODS Universitat Autònoma de Barcelona
58
In the protein backbone, the NH stretching vibrations-amide A and B is around
~3300 and ~3070 cm-1; Amide I is ~1650 cm-1; Amide II is ~1550 cm-1; Amide III is
1400-1200 cm-1. The position of the peaks depends on the type of secondary structure
and is sensitive to environment changes.
The ATR-FTIR spectroscopy is a powerful technique in avoiding the handling
problems caused by the required short pathlength in transmission experiments13. It is
useful to study the protein and lipid in the same spectrum and yielding a strong signal
with only few micrograms of sample14.
Figure 3.11 A typical ATR setup
In an ATR experiment MelB proteoliposomes are placed on a germanium ATR
crystal (Harrick, Ossining, NY; 50 × 10 × 2 mm, yielding 12 internal reflections at the
sample side) with an index of refraction that is larger than that of the sample and
typically larger than two. Infrared light goes into the crystal and is directed towards
the sample interface at 45 oC (angle of incidence) so that it is totally reflected at the
interface between the sample film and crystal. After several reflections the measuring
light leaves the crystal and is focused on the detector. Upon reflection at the interface
between proteoliposomes and crystal, light penetrates into the sample. This so-called
evanescent wave has the same frequency as the incoming light but the amplitude of
the electric field decays exponentially with the distance from the interface. The
waste

Universitat Autònoma de Barcelona MATERIALS AND METHODS
59
evanescent wave is absorbed by the sample and thus the light reaching the detector
carries the information about the infrared spectrum of the sample10, 14 . A typical ATR
setup is shown in Figure 3.11. The whole experimental set up was illustrated by
Lorenz et al15. In brief, the general setting up steps are listed here:
1) Before setting up ATR-IR difference spectra experiments, the germanium
crystal was cleaned with a mild detergent, washed with distilled H2O and dried before
acquiring a background spectrum.
2) A proteoliposome sample was deposited on the crystal and air dried. And an
absorbance spectrum was acquired.
3) The sample was rehydrated and then difference spectra were obtained. The
conditions for obtaining the difference spectra are shown in Table 3.9.
Table 3.9 the conditions of IR difference spectrum for MelB
Difference spectrum Substrates buffer Reference buffer
10 mM Na+ vs H+ 2 min 10 mM Na+ 10 min Wash-buffer I
50 mM Na+ vs H+ 4 min 50 mM Na+ 30 min Wash-buffer II
50 mM Mel vs H+ 4 min 50 mM Mel 30 min Wash-buffer
10 mM Mel 10 mM Na+ vs Na+ 4 min 10 mM Mel 10 mM Na+ 10 min 10 mM Na+
50 mM Mel 10 mM Na+ vs Na+ 4 min 50 mM Mel 10 mM Na+ 30 min 10 mM Na+
After obtaining the spectrum, the next step was to correct it for several
contributions. These are the steps taken to obtain the final corrected difference
spectrum:
a) Correction for the difference spectrum of the buffer
The difference spectra of the buffer were obtained in the same way as the sample,
the only difference is that there was no sample on the crystal surface. The averaged
buffer difference spectrum is shown in Figure 3.12.

MATERIALS AND METHODS Universitat Autònoma de Barcelona
60
4000 3500 3000 2000 1500 1000
10mM Na1 mAU
50mM Na
2 mAU
ΔA
bsor
banc
e
50mM Mel4 mAU
10mM Na 10mM Mel4 mAU
Wavenumber (cm-1)
10mM Na 50mM Mel4 mAU
Figure 3.12 Averaged buffer difference spectra. First panel: difference spectrum for 10 mM Na+;
Second panel: difference spectrum for 50 mM Na+; Third panel: difference spectrum for 50 mM
melibiose; Fouth panel: difference spectrum for 10 mM melibiose in the presence of 10 mM Na+;
Fifth panel: difference spectrum for 50 mM melibiose in the presence of 10 mM Na+.
b) Correction for the absorbance spectrum of MelB

Universitat Autònoma de Barcelona MATERIALS AND METHODS
61
The absorbance spectrum of MelB was corrected by using the absorbance
spectrum of the sample immersed in the buffer minus the absorbance spectrum of the
buffer alone.
0,0
0,7
4000 3500 3000 2000 1500 1000
ΔA
bsor
banc
e
wet buffer *0.95 protein film
ΔA
bsor
banc
e
5 mAU
ΔA
bsor
banc
e
Wavenumber (cm-1)
1 mAU
Figure 3.13 Absorbance spectrum correction of the reconstituted MelB variant applied to the Ge
crystal. First panel: absorbance of the hydrated protein film (black line); also illustrated,
absorbance spectrum of the plain buffer (dotted grey line); the corrected absorbance spectrum of
the proteoliposomes of the MelB sample (in grey) using a subtraction factor of 0.95. Second panel:
scaled absorbance spectrum of the protein film after subtraction of water bands. Third panel:
Averaged difference spectrum for 10 mM melibiose in the presence of 10 mM Na+, in grey: single
difference spectra acquired, in black: mean of the difference spectrum after averaging single
difference spectra (before subtraction).
c) Averaged difference spectrum
To reduce the random error, we take the average of multiple measurements, as
can be seen in the third panel of Figure 3.13.
d) Correction for the melibiose contribution
The IR difference spectrum induced by melibiose clearly indicates sugar
absorption in the range from 1200 to 1000 cm-1 (Figure 3.14 first panel). The effect of
melibiose (1200 - 1000 cm-1) was corrected by using the reference IR difference

MATERIALS AND METHODS Universitat Autònoma de Barcelona
62
spectrum of the buffer containing melibiose (Figure 3.14 first panel). Then the
swelling of the protein film was eliminated (Figure 3.14 second panel). The
absorbance spectrum might change over time because of the swelling of the protein
film. Swelling means that the distance from the surface of protein film to the
reflecting surface is increased, hence the absorbance spectrum intensity decreases.
Finally, the difference spectrum was corrected for the effect of the atmospheric water
resulting in the final melibiose-induced IR difference spectrum between wavenumbers
1950 and 1350 cm-1. (Figure 3.15 third panel)
4000 3500 3000 2000 1500 1000
ΔAb
sorb
ance 0.5 mAU
ΔAb
sorb
ance 0.5 mAU
ΔAb
sorb
ance
Wavenumber (cm-1)
0.5 mAU
Figure 3.14 Corrected melibiose-induced IR difference spectrum in the presence of 10 mM Na+
for the D266C melibiose permease; First panel: in black averaged IR difference spectrum of single
difference spectra and in grey averaged IR difference spectra of the buffer; Second panel:
melibiose induced-IR difference spectra in the presence of 10 mM Na+ in black and in grey:
absorbance spectrum of the sample used to eliminate the effect of the lipid; Third panel: final
melibiose-induced IR difference spectra.
e) Correction for Na+ contribution
The protocol for the correction of the IR difference spectrum induced by Na+ was
similar to the previously described melibiose-induced difference spectrum. The Na+ is

Universitat Autònoma de Barcelona MATERIALS AND METHODS
63
non-IR active and therefore has no contribution to the spectrum. First, the negative
peak of lipids were correct, then the buffer contribution was eliminated (Figure 3.15).
4000 3500 3000 2000 1500 1000
ΔA
bsor
banc
e 0.1 mAU
ΔA
bsor
banc
e 0.2 mAU
ΔA
bsor
banc
e
Wavenumber (cm-1)
0.2 mAU
Figure 3.15 Corrected 10 mM Na+-induced IR difference spectrum for the D266C melibiose
permease; First panel: in black averaged IR difference spectrum of single difference spectra and in
grey swelling of the protein film; Second panel: Na+ induced-IR difference spectra in black and in
grey: averaged IR difference spectra of the buffer; Third panel: final Na+-induced IR difference
spectra.
f) Final IR difference spectrum
The difference spectra data were treated with Varian Resolution Pro 4.0.
Subsequent analysis has been performed by the OriginPro 8.5.1 software.

MATERIALS AND METHODS Universitat Autònoma de Barcelona
64
1900 1800 1700 1600 1500 1400 1900 1800 1700 1600 1500 1400
ΔAbs
orba
nce
Wavenumber (cm-1)
0.1 mAU
ΔAbs
orba
nce
Wavenumber (cm-1)
0.02 mAU
Figure 3.16 Final IR difference spectra for D266C MelB; Left side, melibiose-induced IR
difference spectrum in the presence of 10 mM Na+ (10 mM melibiose); Right side, 10 mM
Na+-induced IR difference spectrum in the presence of H+.
In order to compare the IR spectra of the mutant proteins, the spectra were
noramlized by the intensity of amide I and II regions in the absorbance spectra
according to Granell et al16.
To make the quantitative comparison between any mutant and Cless, a linear
regression analysis in the 1,710–1,500 cm−1 interval of two normalized difference
spectra was carried out using the first derivative of the spectra in order to eliminate
base line contributions (Figure 3.17) was used. This global analysis provides two
outputs. First, the linear correlation parameter, R2, quantifies the spectral similarity
(shape) between a mutant spectrum and the Cless spectrum. Second, the slope of the
linear correlation gives the relative intensity of the spectral features with respect to the
Cless spectrum. 16
1700 1650 1600 1550 1500-0,00005
0,00000
0,00005
1st d
eriv
ativ
e of
ΔAb
sorb
ance
Wavenumber (cm-1)
1st derivative of Cless 1st derivative of F258C
-0,00004 -0,00002 0,00000 0,00002 0,00004
-0,000004
-0,000002
0,000000
0,000002
0,000004
F258
C
Cless
R2 = 0.210 (relative intensity)m = 0.069 (relative similarity)
Figure 3.17 Linear regression analysis of the IR s relative intensity and similarity compared to the
Cless reference spectrum. In the left panel difference spectra Na+ 10 mM vs H+ of Cless (black),
F258C (red) between wavenumbers 1500 and 1710 cm-1. In the right panel: linear regression using
the slope (m) as the relative intensity and the R2 value as relative similarity.

Universitat Autònoma de Barcelona MATERIALS AND METHODS
65
3.2.4 Förster resonance energy transfer spectroscopy (FRET)
Förster resonance energy transfer describes an energy transfer mechanism
(Figure 3.18) between two fluorescent molecules (in our case transfer from Trp to
D2G) that occurs when there exists overlapping between the emission band of donor
and the absorbing band of acceptor. The fluorescent donor Trp was excited at 290 nm.
By a long-range dipole-dipole coupling mechanism, the excitation energy is then
nonradiatively transferred to D2G, the acceptor, while the donor returns to the
electronic ground state. Although the term “fluorescence resonance energy transfer” is
often used, it should be noted that the energy is actually not transferred by
fluorescence.17
Figure 3.18 The chromophore of Trp absorbs light at 290 nm and emits light at 325 nm. The D2G
that absorbs light at around 325 nm and emits light at around 460 nm. If these two moleculars are
closer, the light emitted from Trp is partly absorbed by D2G due to FRET.
The measurements were performed at 20 ºC in a 1 cm quartz cuvette (Hellma

MATERIALS AND METHODS Universitat Autònoma de Barcelona
66
GmbH & Co. KG, Germany) with a UV-visible QuantaMasterTM spectrofluorimeter
and processed with the Felix 32 software (Photon Technology International). FRET
spectra from Trp to D2G was obtained by setting the excitation wavelength at 290 nm
and collecting the emission spectrum in the interval 310 - 570 nm, in 0.1 M KPi, 0.1
M KCl, pH 7.0 buffer with the addition of substrates as described below.
300 350 400 450 500 550 600
Fluo
rece
nce
Wavelength (nm)
1 E4
Figure 3.19 Emission spectrum of D2G in the buffer containing 0.1 M KPi, 0.1 M KCl, pH 7.0 by
illuminating at 290 nm.
Before starting the measures, the proteoliposomes and ISO membrane vesicles
were subjected to 30 seconds of sonication in an ultrasonic bath (Ultrasonic cleaner,
Fungilab US, Keyland Court, NY, USA). After acquiring the protein emission
spectrum, 10 μM of D2G was added to the MelB protein suspension, the spectrum was
acquired and 10 mM NaCl was added to the sample. Finally, to displace the
fluorescent sugar from the MelB binding site, 10 mM melibiose was added to the
quartz cuvette. Each MelB fluorescence spectrum is the average of at least two
independent scans. When illuminated at 290 nm, D2G dissolved in the buffer emits
fluorescence with a maximum intensity at 558 nm (Figure 3.19). Contributions due to
the emission of free D2G were corrected by subtracting the emission spectrum
obtained in the buffer in the absence of protein from the protein-containing buffer.

Universitat Autònoma de Barcelona MATERIALS AND METHODS
67
The subtraction factor was adjusted to removing completely the D2G band at 558 nm.
3.2.5 X-ray crystallography
The MelB purification and crystallization procedure is summarized in Figure
3.20.
Figure 3.20 Flow chart of the protein purification and crystallization procedure
3.2.5.1 Protein preparation
MelB was expressed and purified similarly as described before. The protein
eluted from the Ni-NTA affinity resin column was concentrated using a 50 kDa
Amicon Ultra-4 (Millipore) filter and washed against the crystallization buffer
composed of 20 mM Tris pH 7.5, 5% glycerol, 2 mM DTT, 100 mM NaCl (3 times).
The following steps were followed to reduce the concentration of DDM: The purified
protein with Ni-NTA resin (1 ml resin can bind 15 mg protein) was mixed in a 1.5 ml
eppendorf tube, and washed with crystallization buffer (20 mM Tris pH 7.5, 5%

MATERIALS AND METHODS Universitat Autònoma de Barcelona
68
glycerol, 2 mM DTT, 100 mM NaCl) 6 times; The protein was eluted with a buffer
containing 20 mM pH 7.5 Tris, 5% glycerol, 2 mM DTT, 100 mM NaCl and 300 mM
imidazole; Then the protein was dialyzed against the buffer (20 mM Tris pH 7.5, 5%
glycerol, 2 mM DTT, 100 mM NaCl) for 3 h. This protein sample was aliquoted and
could be used in the crystallization experiments.
3.2.5.2 Crystallization and X-ray diffraction
MelB purified protein in different detergents were subjected to extensive
crystallization screens consisting of PEG400 and PEG200 at pH 4.2 and intervals of
1% PEG concentration, as well as six major commercial crystal screening kits:
MemGold, MemGold-2, PEG/ION, STRUCTURE SCREEN, INDEX and PACT
(Molecular Dimension). Additives such as α-NPG, detergents, MPD, NEM and
glycerol were screened to improve crystal order and packing. Crystallization drops
were assembled in a hanging drop fashion in 24-well plate or sitting drop fashion
(Figure 3.21) in 96-well plate.
Figure 3.21 Hanging drop fashion (left) and sitting drop fashion
MelB crystals were fished and frozen in liquid nitrogen. Crystals were examined
by a synchrotron source at ALBA beamlines 13 - XALOC in Spain. Diffraction data
were processed by using iMosflm.
3.2.6 Molecular dynamics simulation

Universitat Autònoma de Barcelona MATERIALS AND METHODS
69
Figure 3.22 Flow chart of the molecular dynamics simulation
3.2.6.1 System Setup
The model of MelBEC was built using the structure A of the 3.35 Å resolution
crystal structure of MelBST (PDB accession code 4M64)18 with the CHARMM-GUI
server 19, 20. First, the side chains of MelBST different from those of MelBEC were
mutated to those of MelBEC (See details in the appendix 3). The final monomeric
structure contained 448 residues. The protein was oriented by selecting the option
“Align the first principal axis along Z”. And then, after determining the system size, a
bilayer of 1-Palmitoyl-2-oleoyl-sn-glycero- 3-phosphoethanolamine (POPE) lipid
molecules of 90 x 90 Å2 was produced by the replacement method. The replacement
method distributes lipid-like pseudo atoms around the protein, and substitutes each
atom with a lipid molecule that is randomly selected from a lipid molecular library21.
The output of the CHARMM-GUI server was the MelBEC inserted into the bilayer.
Then, the system was loaded into the Visual Molecular Dynamics program (VMD
1.9.2) which allowed adding water molecules and 0.15 M NaCl ions. These additions
were generated using the solvate and autoionize modules of VMD22. The overview of

MATERIALS AND METHODS Universitat Autònoma de Barcelona
70
this step was shown in Figure 3.23.
Figure 3.23 Overview of generalized process of building protein/membrane complex system in
CHARMM-GUI and VMD.
3.2.6.2 Minimization and Equilibration
The energy minimization was performed in vacuo using the NAMD2.1 program
23 (http://www.ks.uiuc.edu/Research/namd/) to remove any possible steric conflicts,

Universitat Autònoma de Barcelona MATERIALS AND METHODS
71
for 100000 steps. Equilibration was done by using rigid bonds, a time step of 1 fs,
cutoff of 10 Å, switch distance of 8 Å, and slowly heating the system from 0 to 298 K
in steps of 2 K for 200 ps using an NVT conditions. The system settled down to the
desired condition and was ready for the production period to begin. For protein and
lipid atoms, the CHARMM36 force field parameters24-27 were used; for water, the
TIP3P model28 was used. The configuration files were shown in the appendix 2.
3.2.6.3 Production runs
Molecular Dynamics was produced using the ACEMD 29 program. ACEMD is a
new generation molecular dynamics software which runs only on graphics processing
units (GPUs) at the equivalent speed of hundreds of standard processors 30. A
combined parameter file which was generated from “par_all36_lipid.prm”27, 31,
“par_all36_prot.prm”24-26 and “par_all36_water_ions.prm”28 was used. And a timestep
of 4.0 fs (owing to the use of the hydrogen mass repartition scheme implemented in
ACEMD32) was used. Different replicas were produced using the particle mesh Ewald
method full-system periodic electrostatics30, 33 at a minimum of 250 ns in constant
pressure and temperature for the mutans and at a minimum of 100 ns for several
replicas of WT. Root-mean-square-deviation (RMSD) was calculated using the VMD
extension “RMSD Visualizer Tool” module after alignment of the backbone Cα atoms.
The Contact maps and the heatmap of helices curvature per residue were calculated
using the VMD extension “Contact map” and “Bendix”34 module.

MATERIALS AND METHODS Universitat Autònoma de Barcelona
72
REFERENCES
1. Botfield, M. C., and Wilson, T. H. (1988) Mutations that simultaneously alter both sugar and
cation specificity in the melibiose carrier of Escherichia coli, The Journal of biological
chemistry 263, 12909-12915.
2. Pourcher, T., Leclercq, S., Brandolin, G., and Leblanc, G. (1995) Melibiose permease of
Escherichia coli: large scale purification and evidence that H+, Na+, and Li+ sugar symport is
catalyzed by a single polypeptide, Biochemistry 34, 4412-4420.
3. Weissborn, A. C., Botfield, M. C., Kuroda, M., Tsuchiya, T., and Wilson, T. H. (1997) The
construction of a cysteine-less melibiose carrier from E. coli, Biochimica et biophysica acta
1329, 237-244.
4. Edelheit, O., Hanukoglu, A., and Hanukoglu, I. (2009) Simple and efficient site-directed
mutagenesis using two single-primer reactions in parallel to generate mutants for protein
structure-function studies, BMC biotechnology 9, 61.
5. Reenstra, W. W., Patel, L., Rottenberg, H., and Kaback, H. R. (1980) Electrochemical proton
gradient in inverted membrane vesicles from Escherichia coli, Biochemistry 19, 1-9.
6. Lowry, O. H., Rosebrough, N. J., Farr, A. L., and Randall, R. J. (1951) Protein measurement
with the Folin phenol reagent, The Journal of biological chemistry 193, 265-275.
7. Barth, A. (2000) The infrared absorption of amino acid side chains, Progress in biophysics and
molecular biology 74, 141-173.
8. Dave, N., Troullier, A., Mus-Veteau, I., Dunach, M., Leblanc, G., and Padros, E. (2000)
Secondary structure components and properties of the melibiose permease from Escherichia
coli: a fourier transform infrared spectroscopy analysis, Biophysical journal 79, 747-755.
9. Lorenz, V. A., Villaverde, J., Trezeguet, V., Lauquin, G. J., Brandolin, G., and Padros, E. (2001)
The secondary structure of the inhibited mitochondrial ADP/ATP transporter from yeast
analyzed by FTIR spectroscopy, Biochemistry 40, 8821-8833.
10. Lin, Y., Fuerst, O., Granell, M., Leblanc, G., Lorenz-Fonfria, V., and Padros, E. (2013) The
substitution of Arg149 with Cys fixes the melibiose transporter in an inward-open
conformation, Biochimica et biophysica acta 1828, 1690-1699.
11. Torres, J., and Padros, E. (1995) Spectroscopic studies of bacteriorhodopsin fragments
dissolved in organic solution, Biophysical journal 68, 2049-2055.
12. Lorenz-Fonfria, V. A., Villaverde, J., Trezeguet, V., Lauquin, G. J., Brandolin, G., and Padros,
E. (2003) Structural and functional implications of the instability of the ADP/ATP transporter
purified from mitochondria as revealed by FTIR spectroscopy, Biophysical journal 85,
255-266.
13. Barth, A. (2007) Infrared spectroscopy of proteins, Bba-Bioenergetics 1767, 1073-1101.
14. Goormaghtigh, E., Raussens, V., and Ruysschaert, J. M. (1999) Attenuated total reflection
infrared spectroscopy of proteins and lipids in biological membranes, Bba-Rev Biomembranes
1422, 105-185.
15. Lorenz-Fonfria, V. A., Leon, X., and Padros, E. (2012) Studying substrate binding to
reconstituted secondary transporters by attenuated total reflection infrared difference
spectroscopy, Methods in molecular biology 914, 107-126.
16. Granell, M., Leon, X., Leblanc, G., Padros, E., and Lorenz-Fonfria Victor, A. (2010) Structural

Universitat Autònoma de Barcelona MATERIALS AND METHODS
73
insights into the activation mechanism of melibiose permease by sodium binding, Proceedings
of the National Academy of Sciences of the United States of America 107, 22078-22083.
17. Helms, V. (2008) Principles of Computational Cell Biology, Wiley.
18. Ethayathulla, A. S., Yousef, M. S., Amin, A., Leblanc, G., Kaback, H. R., and Guan, L. (2014)
Structure-based mechanism for Na(+)/melibiose symport by MelB, Nature communications 5,
3009.
19. Jo, S., Kim, T., Iyer, V. G., and Im, W. (2008) CHARMM-GUI: a web-based graphical user
interface for CHARMM, Journal of computational chemistry 29, 1859-1865.
20. Wu, E. L., Cheng, X., Jo, S., Rui, H., Song, K. C., Davila-Contreras, E. M., Qi, Y., Lee, J.,
Monje-Galvan, V., Venable, R. M., Klauda, J. B., and Im, W. (2014) CHARMM-GUI
Membrane Builder toward realistic biological membrane simulations, Journal of
computational chemistry 35, 1997-2004.
21. Jo, S., Kim, T., and Im, W. (2007) Automated builder and database of protein/membrane
complexes for molecular dynamics simulations, PloS one 2, e880.
22. Humphrey, W., Dalke, A., and Schulten, K. (1996) VMD: visual molecular dynamics, Journal
of molecular graphics 14, 33-38, 27-38.
23. Phillips, J. C., Braun, R., Wang, W., Gumbart, J., Tajkhorshid, E., Villa, E., Chipot, C., Skeel,
R. D., Kale, L., and Schulten, K. (2005) Scalable molecular dynamics with NAMD, Journal of
computational chemistry 26, 1781-1802.
24. Best, R. B., Zhu, X., Shim, J., Lopes, P. E. M., Mittal, J., Feig, M., and MacKerell, A. D.
(2012) Optimization of the Additive CHARMM All-Atom Protein Force Field Targeting
Improved Sampling of the Backbone phi, psi and Side-Chain chi(1) and chi(2) Dihedral
Angles, J Chem Theory Comput 8, 3257-3273.
25. MacKerell, A. D., Feig, M., and Brooks, C. L. (2004) Improved treatment of the protein
backbone in empirical force fields, J Am Chem Soc 126, 698-699.
26. MacKerell, A. D., Bashford, D., Bellott, M., Dunbrack, R. L., Evanseck, J. D., Field, M. J.,
Fischer, S., Gao, J., Guo, H., Ha, S., Joseph-McCarthy, D., Kuchnir, L., Kuczera, K., Lau, F. T.
K., Mattos, C., Michnick, S., Ngo, T., Nguyen, D. T., Prodhom, B., Reiher, W. E., Roux, B.,
Schlenkrich, M., Smith, J. C., Stote, R., Straub, J., Watanabe, M., Wiorkiewicz-Kuczera, J.,
Yin, D., and Karplus, M. (1998) All-atom empirical potential for molecular modeling and
dynamics studies of proteins, J Phys Chem B 102, 3586-3616.
27. Klauda, J. B., Venable, R. M., Freites, J. A., O'Connor, J. W., Tobias, D. J.,
Mondragon-Ramirez, C., Vorobyov, I., MacKerell, A. D., and Pastor, R. W. (2010) Update of
the CHARMM All-Atom Additive Force Field for Lipids: Validation on Six Lipid Types, J
Phys Chem B 114, 7830-7843.
28. Jorgensen, W. L., Chandrasekhar, J., Madura, J. D., Impey, R. W., and Klein, M. L. (1983)
Comparison of Simple Potential Functions for Simulating Liquid Water, J Chem Phys 79,
926-935.
29. Harvey, M. J., Giupponi, G., and De Fabritiis, G. (2009) ACEMD: Accelerating Biomolecular
Dynamics in the Microsecond Time Scale, J Chem Theory Comput 5, 1632-1639.
30. Harvey, M. J., and De Fabritiis, G. (2009) An Implementation of the Smooth Particle Mesh
Ewald Method on GPU Hardware, J Chem Theory Comput 5, 2371-2377.
31. Klauda, J. B., Monje, V., Kim, T., and Im, W. (2012) Improving the CHARMM Force Field
for Polyunsaturated Fatty Acid Chains, J Phys Chem B 116, 9424-9431.

MATERIALS AND METHODS Universitat Autònoma de Barcelona
74
32. Feenstra, K. A., Hess, B., and Berendsen, H. J. C. (1999) Improving efficiency of large
time-scale molecular dynamics simulations of hydrogen-rich systems, Journal of
computational chemistry 20, 786-798.
33. Essmann, U., Perera, L., Berkowitz, M. L., Darden, T., Lee, H., and Pedersen, L. G. (1995) A
Smooth Particle Mesh Ewald Method, J Chem Phys 103, 8577-8593.
34. Dahl, A. C., Chavent, M., and Sansom, M. S. (2012) Bendix: intuitive helix geometry analysis
and abstraction, Bioinformatics 28, 2193-2194.

Universitat Autònoma de Barcelona RESULTS AND DISCUSSION
75
4 RESULTS AND DISCUSSION
4.1 Analysis of the conserved residues in loop 7-8/end of helix VII
There are 11 loops in the melibiose structure, as shown in Figure 4.1. A
homologous sequence alignment indicates that in loop 7-8/end of helix VII Tyr-256,
Tyr-257, Phe-258 and Tyr-260 have a high level of conservation. At the same time,
there are two negatively charged amino acids (Asp-264 and Asp-266) in this loop.
Apart from the four conserved amino acids, there is one more aromatic amino acid
inside this loop. Given the high content of aromatic side chains and their high
conservation the loop 7-8/end of helix VII may play an important role in the transport
mechanism of the melibiose transporter. In order to elucidate the function of the loop,
we carried out a cysteine-scanning mutagenesis of it and studied some properties of
the mutants.
Figure 4.1 Secondary structure of MelB (It was obtained by homologous sequence alignment with
MelBst1) from E. coli with conserved amino acids indicated in red color, with a conservation score
of 9 calculated with ConSurf2 (see the results in the appendix 4). The blue-colored letters represent
RESULTS AND DISCUSSION Universitat Autònoma de Barcelona
76
the replaced cysteines by Ser or Val.
4.2 Cysteine-scanning mutagenesis of loop 7-8/end of helix VII
Tyr-256, Tyr-257, Phe-258, Ser-259, Tyr-260, Val-261, Gly-263, Asp-264,
Ala-265, Asp-266, Leu-267 and Phe-268 were replaced one at a time by cysteine
(except for Ser-259 also replaced by alanine) to study the importance of loop 7-8/end
of helix VII (Ile-262 was studied by Lin3, so there are no related results present in this
thesis). The mutants were successfully obtained by using a double-primer PCR
mutagenesis protocol as described in Materials and Methods. A common feature
observed in all the mutants was the reduction of expression levels with respect to
Cless except for S259A and Y260C (Figure 4.2). The calculations of the protein
expression level for each mutant based on protein yields after the purification were
approximate since the preparations vary from one to another. However, compared to
the Cless control, larger culture volumes were required for the mutants of loop
7-8/end of helix VII to purify sufficient amount of functional protein.
Cless
Y256C
Y257C
F258C
S259A
S259C
Y260C
V261C
G263C
D264C
A265C
D266C
L267
CF26
8C
0
2
4
6
8
10
Yiel
d (m
g)
Figure 4.2 Maximum yield of purified MelB protein from 4 L cells.
The melibiose transport properties of the conserved amino acid mutant strains

Universitat Autònoma de Barcelona RESULTS AND DISCUSSION
77
were tested by growing on MacConkey agar plates. The Cless MelB protein expressed
in the DW2R strain exhibits red colonies on the MacConkey agar plate which
contained melibiose as the main carbon source (Figure 4.3). The colored colonies
indicated a pH change of the media because of the metabolization of the melibiose.
After the melibiose enters into the cell, it is cleaved intracellularly by the
α-galactosidase into the monosaccharides glucose and galactose. Then the
monosaccharides are decomposed into some acidic substances (like pyruvate, lactic
acid and so on). This reaction causes the acidification of the plate, indicated by the
neutral red, which is a pH indicator, staining the medium to a red color. However, a
red bacterial colony does not necessarily be interpreted as proof of active transport of
the melibiose. It might be passive sugar transport by MelB due to a higher
concentration of melibiose in the surrounding medium than in the cytoplasm.
However, it was interesting to find out that most of the conserved amino acid mutants
do not show red colonies. The color of the colonies can indicate the absence of
melibiose transport since the sugar does not enter the bacterial cells, no metabolizing
activity exists, and the pH of the medium will not drop.
Figure 4.3 Top: Melibiose fermentation. E. coli DW2R strain containing MelB mutants on
MacConkey agar plates supplemented with 10 mM melibiose, 10 μg/mL tetracycline and 100
μg/mL ampicillin are shown. Bottom: Western blotting (37 kDa). The mutant cells were loaded on
each well and the MelB protein detected by anti-His-tag reagent.
RESULTS AND DISCUSSION Universitat Autònoma de Barcelona
78
The molecular weight of the MelB protein is around 52 kDa. But in the western
blot the corresponding band usually shows at around 37 kDa. In Figure 4.4 the UV
absorption spectra of the solubilized and purified MelB proteins for all the mutants
are shown. They have a common peak at around 280 nm which is the characteristic
peak of the protein.
250 300 350
Wavelength (nm)
Cless Y256C Y257C F258C S259A S259C Y260C V261C G263C D264C A265C D266C L267C F268CAb
s
Figure 4.4 UV absorption spectra of the solubilized MelB proteins
4.3 Fluorescence results
4.3.1 FRET in proteoliposomes
A β-galactoside-derivative, the fluorescent sugar (2’-N-5-dimethylamino-
naphthalene-1-sulfonyl)-aminoethyl-1-thio-β-D-galactopyranoside (D2G) is able to
bind to MelB to the same binding site as melibiose (Figure 4.5). Compared to the

Universitat Autònoma de Barcelona RESULTS AND DISCUSSION
79
physiological melibiose, D2G has shown to have higher affinity for MelB. 4
Figure 4.5 the structures of D2G and melibiose
The fluorescence spectra for the MelB proteoliposomes were collected in an
interval from 310 nm to 570 nm. The experiments were done by exciting the sample
with light of 290 nm. The light of this wavelength is absorbed by the intrinsic Trp.
The FRET phenomenon occurs because there is overlapping between the D2G
excitation spectrum and the Trp emission spectrum.
The spectrum of the Cless proteoliposomes (Figure 4.6) displays the typical Trp
peak with the maximum around 325 nm (black line). After the addition of 10 μM D2G
(red line), the signal of the Trp residues decreases due to energy transfer to D2G as
well as because an inner filter effect and non-specific fluorescence quenching by the
fluorescent sugar in the medium.4 Concomitantly a small peak appears around 460 nm
due to D2G emission. The addition of sodium (blue line) results in a further decrease
of the Trp fluorescence around 325 nm and simultaneously, the peak around 460 nm
increases in intensity because of increasing amount of bound D2G. An addition of 10
mM melibiose (magenta line) reverses the effects by displacing D2G from the binding
site, decreasing the D2G FRET signal around 460 nm and increasing the Trp
fluorescence. This method is used to determine the capability of substrate’s binding
for specific mutants1, 5-9.
As shown in Figure 4.6, none of the mutants of the conserved amino acids
showed any energy transfer upon D2G addition. Except these four mutants, the other
RESULTS AND DISCUSSION Universitat Autònoma de Barcelona
80
mutants respond to the consecutive additions of D2G, Na+, and melibiose to different
levels, indicating that all of them preserve the capability of sugar/Na+ binding with
some changes in the intensity of signal. This suggests that the mutations may affect
the affinity of the substrates. Especially, MelB D266C mutant shows a little increase
in the intensity of the signal when compared with Cless while the other mutants all
decrease.
The increase in the fluorescence intensity at 460 nm upon D2G addition reflects
the fact that melibiose permease can bind the sugar in the absence of Na+ (i.e., it can
use H+ as coupling ions in the transport process). Figure 4.7 shows the fluorescence
increase upon D2G addition of the mutants in the loop 7-8/end of helix VII in the
absence of Na+ (i.e., in the presence of H+). The conserved aromatic amino acids
show nearly zero intensity compared with Cless, indicating lack of binding of D2G.
The mutants G263C and L267C show a small signal, whereas Ser-259 shows variable
intensity depending on the substituting side chain. This points to a substantial role of
these side chains in substrate binding in the presence of H+. The rest of mutants have
between half and the same intensity of Cless.
Upon Na+ addition the mutants Y256C, Y257C and Y260C, showed no increase
in the fluorescence intensity (Figure 4.8), thus no D2G binding in the presence of Na+
can be detected for these mutants. And the mutants F258C and S259A showed very
low affinity for D2G in the presence of 10 mM sodium. Surprisingly, the addition of
sodium in the solution appeared to bring a strong signal in mutant D266C, nearly two
fold that of Cless.
When melibiose was added to displace the bound D2G, the signal did not change
for mutants Y256C, Y257C, F258C and Y260C, as expected since there is no D2G
bound in these mutants. However, for the other mutants, the melibiose successfully
replaced the D2G (Figure 4.9)

Universitat Autònoma de Barcelona RESULTS AND DISCUSSION
81
300 350 400 450 500 550 600 300 350 400 450 500 550 600 300 350 400 450 500 550 600
300 350 400 450 500 550 600 300 350 400 450 500 550 600 300 350 400 450 500 550 600
300 350 400 450 500 550 600 300 350 400 450 500 550 600 300 350 400 450 500 550 600
300 350 400 450 500 550 600 300 350 400 450 500 550 600 300 350 400 450 500 550 600
300 350 400 450 500 550 600 300 350 400 450 500 550 600
Cless proteoliposomes + 10 μM D2G + 10 mM Na + 10 mM Mel
Y256C proteoliposomes + 10 μM D2G + 10 mM Na + 10 mM mel
Y257C proteoliposomes + 10 μM D2G + 10 mM Na + 10 mM mel
F258C proteoliposomes + 10 μM D2G + 10 mM Na + 10 mM Mel
S259A proteoliposomes + 10 μM D2G + 10 mM Na + 10 mM Mel
S259C proteoliposomes + 10 μM D2G + 10 mM Na + 10 mM Mel
Y260C proteoliposomes + 10 μM D2G + 10 mM Na + 10 mM Mel
V261C proteoliposomes + 10 μM D2G + 10 mM Na + 10 mM Mel
G263C proteoliposomes + 10 μM D2G + 10 mM Na + 10 mM Mel
D264C proteoliposomes + 10 μM D2G + 10 mM Na + 10 mM Mel
A265C proteoliposomes + 10 μM D2G + 10 mM Na + 10 mM Mel
D266C proteoliposomes + 10 μM D2G + 10 mM Na + 10 mM Mel
L267C proteoliposomes + 10 μM D2G + 10 mM Na + 10 mM Mel
F268C proteoliposomes + 10 μM D2G + 10 mM Na + 10 mM Mel
Figure 4.6 Substrates-induced Trp→D2G FRET signal changes of MelB mutants in
proteoliposomes. Representative plot of fluorescence changes of different MelB mutants induced
by the sequential addition of proteoliposomes (black), D2G (red), NaCl (blue) and melibiose
(magenta). The samples were illuminated at 290 nm, and the emission spectra were collected at
310-570 nm. The spectra were normalized to the same amount of protein. Abscissa, wavelength
(nm); ordinate, fluorescence intensity. Each data is the average of at least two scans.

RESULTS AND DISCUSSION Universitat Autònoma de Barcelona
82
Cless
Y256C
Y257C
F258C
S259A
S259C
Y260C
V261C
G263C
D264C
A265C
D266C
L267
CF26
8C
-20
0
20
40
60
80
100
120
140
Effe
ct o
f 10μ
M D
2G re
lativ
e to
Cle
ss (%
)
Figure 4.7 FRET between Trp and D2G. The protein samples reconstituted in liposomes in 100
mM KPi and 100 mM KCl pH7.0, were illuminated at 290 nm, and the emission spectra were
collected at 310-570 nm. The graph here represents the percentage of increase between after and
before the addition of 10μM D2G at 460 nm with respect to Cless. Each data is the average of at
least two scans.
Cless
Y256C
Y257C
F258C
S259A
S259C
Y260C
V261C
G263C
D264C
A265C
D266C
L267
CF26
8C
0
50
100
150
200
250
Effe
ct o
f 10m
M N
a re
lativ
e to
Cle
ss (%
)
Figure 4.8 Effect of Na+ addition on the FRET signal. The protein samples reconstituted in
liposomes in 100 mM KPi and 100 mM KCl pH7.0 with 10 μM D2G, were illuminated at 290 nm,
and the emission spectra were collected at 310-570 nm. The graph here represents the percentage
of increase between after and before the addition of 10 mM NaCl at 460 nm with respect to Cless.
Each data is the average of at least two scans.

Universitat Autònoma de Barcelona RESULTS AND DISCUSSION
83
Cless
Y256C
Y257C
F258C
S259A
S259C
Y260C
V261C
G263C
D264C
A265C
D266C
L267
CF26
8C
-20
0
20
40
60
80
100
120
140
160
Effe
ct o
f 10m
M M
el re
lativ
e to
Cle
ss (%
)
Figure 4.9 Effect of melibiose addition on the FRET signal. The protein samples reconstituted in
liposomes in 100 mM KPi and 100 mM KCl pH7.0 with 10 μM D2G, 10 mM Na+, were
illuminated at 290 nm, and the emission spectra were collected at 310-570 nm. The graph here
represents the percentage of increase between after and before the addition of 10 mM Melibiose at
460 nm with respect to Cless. Each data is the average of at least two scans
4.3.2 FRET of Inside Out (ISO) vesicles
The activity of membrane proteins can be modulated by the phospholipid
composition of the membrane. The reconstitution of membrane proteins into a model
membrane allows investigation of individual features and activities of a given cell
membrane component. However, the activity of membrane proteins is often difficult
to sustain following purification and reconstitution, since the composition of the
detergents and the liposomes differs from that of the native cell membrane. In the
vesicles, the protein is localized in its natural lipid bilayer conserving the original
three-dimensional structure after the expression and insertion into the cell membrane.
We therefore obtained ISO vesicles with the same total protein and nearly equal
MelB protein content (Figure 4.10).The FRET results of the ISO vesicles after adding
D2G (Figure 4.11) are mainly consistent with our earlier research of proteoliposomes.
The Cless and DW2R vesicles are the control vesicles. The Cless vesicles
demonstrate a significant fluorescence increase after the addition of 10 mM NaCl to

RESULTS AND DISCUSSION Universitat Autònoma de Barcelona
84
the sample in the presence of 10 μM D2G. The DW2R E. coli strain containing the
same mixture of membrane proteins except MelB is the negative control. In this
control the D2G does not cause any increase of the fluorescence signal in the ISO
vesicles.
The results from the measurements with ISO vesicles of Y256C, Y257C, F258C
and Y260C results are in agreement with the proteoliposomes data where the D2G
does not produce an increase of the fluorescence signal. And for other mutants, the
results are similar to Cless except a little change of the intensity.
Therefore, fluorescence results are in line with the fact that Tyr-256, Tyr-257,
Phe-258 and Tyr-260 are conserved amino acids. If we change those amino acids, the
protein will lose the function since no longer can bind the sugar.
Figure 4.10 Western blotting. The ISO vesicles of the mutants were loaded on each well and
the MelB protein detected by anti-His-tag reagent. M: Marker; 1: Cless; 2: Y256C; 3: Y257C; 4:
F258C; 5: S259A; 6: S259C; 7: Y260C; 8: V261C; 9: G263C; 10: D264C; 11: A265C; 12: D266C;
13: L267C; 14: F268C.
37 kDa →

Universitat Autònoma de Barcelona RESULTS AND DISCUSSION
85
400 450 500 550 400 450 500 550 400 450 500 550
400 450 500 550 400 450 500 550 400 450 500 550
400 450 500 550 400 450 500 550 400 450 500 550
400 450 500 550 400 450 500 550 400 450 500 550
400 450 500 550 400 450 500 550 400 450 500 550
DW2R ISO + 10 μM D2G + 10 mM Na + 10 mM mel
Cless ISO + 10 μM D2G + 10 mM Na + 10 mM mel
Y256C ISO + 10 μM D2G + 10 mM Na + 10 mM mel
Y257C ISO + 10 μM D2G + 10 mM Na + 10 mM mel
F258C ISO + 10 μM D2G + 10 mM Na + 10 mM mel
S259A ISO + 10 μM D2G + 10 mM Na + 10 mM mel
S259C ISO + 10 μM D2G + 10 mM Na + 10 mM mel
Y260C ISO + 10 μM D2G + 10 mM Na + 10 mM mel
V261C ISO + 10 μM D2G + 10 mM Na + 10 mM mel
G263C ISO + 10 μM D2G + 10 mM Na + 10 mM mel
D264C ISO + 10 μM D2G + 10 mM Na + 10 mM mel
A265C ISO + 10 μM D2G + 10 mM Na + 10 mM mel
D266C ISO + 10 μM D2G + 10 mM Na + 10 mM mel
L267C ISO + 10 μM D2G + 10 mM Na + 10 mM mel
F268C ISO + 10 μM D2G + 10 mM Na + 10 mM mel
Figure 4.11 Substrates-induced Trp→D2G FRET signal changes of MelB mutants in ISO
membrane vesicles. The graph shows representative plots of fluorescence changes of different
MelB mutants induced by the sequential addition of ISO vesicles (black), 10 μ M D2G (red), 10
mM NaCl (blue) and 10 mM melibiose (magenta). The ISO membrane vesicles in 100 mM KPi
and 100 mM KCl pH7.0 with different substrates where indicated, were illuminated at 290 nm,
and the emission spectra were collected at 400-570 nm. Abscissa, wavelength (nm); ordinate,
fluorescence intensity. Each data is the average of at least two scans.
RESULTS AND DISCUSSION Universitat Autònoma de Barcelona
86
4.3.3 Conclusions from the fluorescence results
Y256C, Y257C, F258C and Y260C in ISO vesicles and reconstituted in
proteoliposomes do not bind the fluorescent sugar D2G, as demonstrated in the FRET
experiments.

Universitat Autònoma de Barcelona RESULTS AND DISCUSSION
87
4.4 The infrared difference spectra
The MelB transporter was expressed, purified, solubilized and reconstituted into
liposomes (E. coli lipids). In proteoliposomes the binding of substrates to the MelB
transporter was assessed by infrared difference spectroscopy using buffers
supplemented with the substrates of MelB at different concentrations.
4.4.1 General features of the infrared difference spectra
We take as an example the spectra in Figure 4.11 where they were acquired in the
presence or absence of 10 mM sodium. The Cless infrared difference spectrum in the
first row on the left displays different positive and negative peaks. The difference
spectrum is the subtraction between the absorbance spectrum in the absence of the
sodium and the absorbance spectrum in the presence of the sodium. A peak-less
spectrum visible as a nearly straight line would imply an absence of interaction of the
sodium with MelB. The positive and negative peaks indicate vibrational differences
between the states in the absence of sodium (or the states in the presence of proton)
and the states in the presence of sodium. This can be interpreted as structural changes
of the MelB transporter when replacing the proton with sodium in the ion binding site.
The Cless carrier possesses almost identical properties as the wild-type transporter.10
Throughout the study we used Cless as a control for infrared difference spectra.
Although we acquired the difference spectrum from 4000 to 1000 cm-1, the most
interesting part of a difference spectrum is the amide region (1700-1500 cm-1)
containing the protein major bands amide I and II. Therefore, we focus on the
vibrational changes appearing in the amide I (1700-1600 cm-1) and amide II (~1550
cm-1) region to explain the conformational changes. The major peaks correspond to α
helices (1668-1650 cm-1 region) or to β-sheets, 310 helices or open loops11 in the 1700
cm-1 or the 1645 cm-1 regions. On the other hand, the region between 1400 cm-1 and
1350 cm-1 may be important for fingerprint analysis of certain amino acid side chains,

RESULTS AND DISCUSSION Universitat Autònoma de Barcelona
88
like the carboxylic acids peaks at 1598-1600 cm-1, 1576-1579cm-1, 1404 cm-1 and
1383 cm-1.10
4.4.2 Conserved amino acids in loop 7-8
As mentioned above, the study of the homologous sequence alignment showed
four conserved amino acids (Tyr-256, Tyr-257, Phe-258 and Tyr-260). Here, we will
discuss three mutants (Y256C, F258C and Y260C) of the conserved amino acids.
4.4.2.1 Sodium-induced IR difference spectra of Y256C, F258C and Y260C
mutants
1800 1700 1600 1500 1400
Cless 10mM Na
0.1 mAU
Y256C 10mM Na
F258C 10mM Na
ΔA
bsor
banc
e
Y260C 10mM Na
Wavenumber (cm-1)
Figure 4.11 10 mM Na+-induced IR difference spectra of Cless, Y256C, F258C and Y260C. The
spectra correspond to the effect of 10 mM NaCl at 25 oC and pH 6.6 in a buffer containing 20 mM
MES and 100 mM KCl.
By comparing the infrared difference spectra of the Y256C, F258C and Y260C
mutants with Cless, one can conclude the lack of apparent response of these mutants
to Na+ addition. No significant 10 mM Na+-induced spectral intensity was obtained
for any of the MelB mutants shown in Figure 4.11. The mutations have either blocked

Universitat Autònoma de Barcelona RESULTS AND DISCUSSION
89
the access to the cation binding site, or the replacement of the protons by sodium ions
is inhibited due to a reduced affinity for the latter. In all three cysteine replaced
mutants, the spectral intensity and similarity were lower than that of Cless, and thus
considered insignificant. Therefore, it can be concluded that sodium does not interact
with any of the three mutants (Y256C, F258C and Y260C).
50 mM sodium was used to detect whether the effect of the three mutants was
due to a reduced affinity for sodium. It can clearly be seen that Y256C, F258C, and
Y260C MelB mutations cause the absence of cation binding of MelB (Figure 4.12).
Since even a high sodium concentration could not induce any clear signal in the IR
difference spectra of these mutants, one can say that the three mutants are defective in
cation binding.
1800 1700 1600 1500 1400
Cless 50mM Na
0.05 mAU
Y256C 50mM Na
ΔA
bsor
banc
e
F258C 50mM Na
Y260C 50mM Na
Wavenumber (cm-1)
Figure 4.12 50 mM Na+-induced IR difference spectra of Cless, Y256C, F258C and Y260C. The
spectra correspond to the effect of 50 mM NaCl at 25 oC and pH 6.6 in a buffer containing 20 mM
MES and 100 mM KCl.
4.4.2.2 Melibiose-induced IR difference spectra of Y256C, F258C and Y260C
mutants

RESULTS AND DISCUSSION Universitat Autònoma de Barcelona
90
The same technique has been used to acquire difference spectra induced by
melibiose interaction. The melibiose-induced difference spectrum for the Cless carrier
differs in its characteristics from the sodium-mediated difference spectrum. The Cless
transporter was used as the reference again. The 50 mM melibiose-induced difference
spectrum in the absence of sodium displayed a variety of different positive and
negative peaks. The difference spectra suggest an extremely decreased melibiose
binding affinity for the three mutants (Figure 4.13).
To check if the melibiose could produce structural changes in the presence of the
co-substrate sodium, the difference spectra were acquired by supplementing the buffer
with 10 mM NaCl in the presence of 10 mM or 50 mM melibiose. The difference
spectrum from Cless mutant works as a control again.
1800 1700 1600 1500 1400
Cless 50mM melibiose
0.1 mAU
Y256C 50mM Melibiose
F258C 50mM Melibiose
ΔA
bsor
banc
e
Y260C 50mM Melibiose
Wavenumber (cm-1)
Figure 4.13 50 mM Melibiose-induced IR difference spectra of Cless, Y256C, F258C and Y260C.
The spectra correspond to the effect of 50 mM melibiose at 25 oC and pH 6.6 in a buffer
containing 20 mM MES and 100 mM KCl.
The melibiose-induced difference spectrum in the presence of 10 mM sodium
displayed a variety of different positive and negative peaks (Figure 4.14), like the
Na+-induced spectra. The main peaks occur in the region between 1668 and 1652 cm-1

Universitat Autònoma de Barcelona RESULTS AND DISCUSSION
91
corresponding to α-helix structures.11 Melibiose-induced IR difference spectra for the
MelB mutants were first acquired in the absence of the sodium and then in the
presence of 10 mM sodium. Sodium increases the affinity for the sugar12, 13, which
could be observed by higher spectral intensity compared to the spectrum in the
absence of sodium.
None of the three mutants showed melibiose-induced conformational
rearrangements similar to the Cless, as shown by the lack of clear peaks in the IR
difference spectra. The quantitative comparison of the region between 1500 and 1710
cm-1 by the first derivative of IR difference spectra with respect to the Cless
confirmed the lack of melibiose binding in the MelB mutants of Y256C and Y260C in
the presence of 10 mM sodium (Figure 4.14). Nevertheless, the mutant F258C
displays some features in the difference spectrum. The evaluation of the difference
spectra was further assessed by using the spectral intensity and the spectral similarity
with respect to the Cless spectrum. A detailed description of how the calculation was
done is included in the Materials and Methods section. This offers the idea that this
mutant might preserve the binding ability, but be affected by a decreased affinity
constant, requiring an elevated concentration of melibiose to stimulate binding events.
Therefore, as we did when testing for sodium binding, the three mutants were also
exposed to higher sugar concentrations (50 mM melibiose), still in the presence of 10
mM sodium.

RESULTS AND DISCUSSION Universitat Autònoma de Barcelona
92
1800 1700 1600 1500 1400
Cless 10mM Na 10mM melibiose
0.2 mAU
Y256C 10mM Na 10mM melibiose
F258C 10mM Na 10mM Melibiose
ΔA
bsor
banc
e
Y260C 10mM Na 10mM Melibiose
Wavenumber (cm-1)
Cless F258C0
40
80
120
160
200
Rel
ativ
e to
Cle
ss (%
)10 mM Sodium 10 mM Melibiose
Intensity Similarity
Figure 4.14 In the left panel: 10 mM Melibiose-induced IR difference spectra in the presence of
10 mM sodium of Cless, Y256C, F258C and Y260C. The spectra correspond to the effect of 10
mM melibiose at 25 oC and pH 6.6 in a buffer containing 20 mM MES, 100 mM KCl and 10 mM
NaCl. In the right panel: Spectral similarity and intensity in the 1710-1500 cm-1 interval on the
first derivative of the 10 mM Melibiose-induced IR difference spectra in the presence of 10 mM
sodium of Cless and F258C.
A lower IR difference spectra intensity compared with Cless can be interpreted
either as a reduced affinity or a reduced protein stability. At a concentration of 50 mM
melibiose (Figure 4.15), the Y256C and Y260C mutants generated also a feature-less
difference spectrum which indicated the lack of melibiose-induced structural changes
of the transporter. Only the F258C mutant presents a difference spectrum with high
similarity (80%), although the spectral intensity is reduced (30% compared to Cless).
Therefore, the Y256C and Y260C mutants lost the binding of both substrates, whereas
F258C shows decreased affinity.

Universitat Autònoma de Barcelona RESULTS AND DISCUSSION
93
1800 1700 1600 1500 1400
Cless 10mM Na 50mM melibiose
0.1 mAU
Y256C 10mM Na 50mM melibiose
F258C 10mM Na 50mM Melibiose
ΔA
bsor
banc
e
Y260C 10mM Na 50mM Melibiose
Wavenumber (cm-1)
Cless F258C0
20
40
60
80
100
120
140 Intensity Similarity
Rel
ativ
e to
Cle
ss (%
)10 mM Sodium 50 mM Melibiose
Figure 4.15 In the left panel: 50 mM Melibiose-induced IR difference spectra in the presence of
10 mM sodium of Cless, Y256C, F258C and Y260C. The spectra correspond to the effect of 50
mM melibiose at 25 oC and pH 6.6 in a buffer containing 20 mM MES, 100 mM KCl and 10 mM
NaCl. In the right panel: Spectral similarity and intensity in the 1710-1500 cm-1 interval on the
first derivative of the 50 mM Melibiose-induced IR difference spectra in the presence of 10 mM
sodium of Cless and F258C.
4.4.2.3 Evaluation of the absorbance spectra of the Y256C, F258C and Y260C
mutants
Abso
rban
ce
Wavenumber (cm-1)
Y260C F258C Y256C Cless
1740 1659 1546 Wavenumber (cm-1)1659 1546
Figure 4.16 Comparison of absorbance spectra of the three conserved mutants with Cless in the
left panel; Second derivative of the absorbance spectra in the right panel. The dashed lines mark
the maximum of lipid C=O (around 1740 cm-1), the maximum of the amide I (1659 cm-1) and the
amide II (1546 cm-1) band.

RESULTS AND DISCUSSION Universitat Autònoma de Barcelona
94
Since the cysteine replacement of single amino acid in position 256, 258 and 260
tremendously alter the binding characteristics for both substrates, either these residues
are essential for the transferring of both substrates, or more likely the mutation might
affect the protein structure. The IR absorption spectra in the protein backbone
sensitive region 1700 - 1500 cm-1 for each mutant compared with Cless was analyzed
to check the latter hypothesis (Figure 4.16). In the broad amide I and II bands, the
stretching vibrations of the C=O and C-N groups were the main structural information
one can obtain in the IR absorption spectra. At first sight, the absorbance spectra of
the three conserved mutants are similar in the amide I and amide II region to the
reference spectra of the fully functional Cless transport protein (Figure 4.16). Because
of the broad band in the protein structure sensitive amide I and II region, the hidden
patterns can’t be easily distinguished from the absorbance spectra. So the second
derivative of the absorbance spectrum was computed to resolve small structural
changes caused by the single cysteine replacement. The second derivative leads to
narrow bands in the amide I and amide II regions of proteins as well as flattening of
the baselines.
For the mutants Y256C and Y260C, the second derivative spectra demonstrate
small spectral differences with Cless at around 1630 cm-1, used for the comparison
(Figure 4.16). But for the mutant F258C, that peak was not present around 1630 cm-1.
This wavenumber was attributed to β-sheets. The replacement of tyrosine by cysteine
seems to cause some structural alterations in MelB which could block the substrates
passway. Most noteworthy, in all three mutants the amide I peak at 1659 cm-1 is
shifted to 1657 cm-1. As observed for other MelB mutants.14 It can be concluded that
the mutations at 256, 258 or 260 produce some minor structural alterations, but global
conformational changes can be discarded.
4.4.3 Charged amino acids in loop 7-8:D264C and D266C

Universitat Autònoma de Barcelona RESULTS AND DISCUSSION
95
4.4.3.1 Sodium-induced IR difference spectra of D264C and D266C mutants
1800 1700 1600 1500 1400
Cless 10mM Na
0.1 mAU
D264C 10mM Na
ΔAb
sorb
ance
D266C 10mM Na
Wavenumber (cm-1)
Cless D264C D266C0
20
40
60
80
100
120
Intensity Similarity
Rel
ativ
e to
Cle
ss (%
)10 mM Sodium
Figure 4.17 In the left panel: 10 mM Na+-induced IR difference spectra of Cless, D264C and
D266C. The spectra correspond to the effect of 10 mM NaCl at 25 oC and pH 6.6 in a buffer
containing 20 mM MES and 100 mM KCl. In the right panel: Spectral similarity and intensity in
the 1710-1500 cm-1 interval on the first derivative of the 10 mM Na+-induced IR difference
spectra of Cless, D264C and D266C.
Few alterations are observed when one compares the difference spectra induced
by Na+ binding with D266C and Cless (Figure 4.17). The structural changes resulting
from the replacement of the coupling H+ by Na+ are therefore alike in both permeases.
Some variations are visible in the difference spectrum between D264C and Cless,
suggesting that D264C is involved in the transport mechanism of MelB or has some
structural role.
In order to know if the effect on charged amino acids in loop 7-8 is due to a
reduced affinity for sodium, sodium-induced difference spectra were acquired also at
50 mM. The 50 mM Na+-induced IR difference spectra (Figure 4.18) showed similar
result as 10 mM sodium.

RESULTS AND DISCUSSION Universitat Autònoma de Barcelona
96
1800 1700 1600 1500 1400
Cless 50mM Na0.05 mAU
D264C 50mM Na
ΔAb
sorb
ance
D266C 50mM Na
Wavenumber (cm-1)
Cless D264C D266C0
20
40
60
80
100
120 Intensity Similarity
Rel
ativ
e to
Cle
ss (%
)
50 mM Sodium
Figure 4.18 In the left panel: 50 mM Na+-induced IR difference spectra of Cless, D264C and
D266C. The spectra correspond to the effect of 50 mM NaCl at 25 oC and pH 6.6 in a buffer
containing 20 mM MES and 100 mM KCl. In the right panel: Spectral similarity and intensity in
the 1710-1500 cm-1 interval on the first derivative of the 50 mM Na+-induced IR difference
spectra of Cless, D264C and D266C.
4.4.3.2 Melibiose-induced IR difference spectra of D264C and D266C mutants
1800 1700 1600 1500 1400
Cless 50mM melibiose
0.1 mAU
D264C 50mM Melibiose
ΔAb
sorb
ance
D266C 50mM Melibiose
Wavenumber (cm-1)
Cless D266C0
20
40
60
80
100
120
Rel
ativ
e to
Cle
ss (%
)
50 mM Melibiose
Intensity Similarity
Figure 4.19 In the left panel: 50 mM Melibiose-induced IR difference spectra of Cless, D264C
and D266C. The spectra correspond to the effect of 50 mM melibiose at 25 oC and pH 6.6 in a
buffer containing 20 mM MES and 100 mM KCl. In the right panel: Spectral similarity and
intensity in the 1710-1500 cm-1 interval on the first derivative of the 50 mM Melibiose-induced IR
difference spectra of Cless and D266C.

Universitat Autònoma de Barcelona RESULTS AND DISCUSSION
97
The sugar-induced difference spectrum gives further insights of how MelB is
eventually influenced by the replacement of the charged amino acids in the
periplasmic loop 7-8. The spectrum of D266C corresponding to 50 mM melibiose in
the presence of H+ showed almost the same degree of similarity and intensity as the
10 mM Na+-induced difference spectrum when compared with the spectrum of Cless
(Figure 4.19). However, the 50 mM melibiose-induced difference spectrum of D264C
suggested an extremely decreased melibiose binding affinity.
1800 1700 1600 1500 1400
Cless 10mM Na 10mM melibiose
0.2 mAU
D264C 10mM Na 10mM Melibiose
ΔAb
sorb
ance
D266C 10mM Na 10mM Melibiose
Wavenumber (cm-1)
Cless D266C0
20
40
60
80
100
120
Rel
ativ
e to
Cle
ss (%
)
10 mM Sodium 10 mM Melibiose
Intensity Similarity
Figure 4.20 In the left panel: 10 mM Melibiose-induced IR difference spectra in the presence of
10 mM sodium of Cless, D264C and D266C. The spectra correspond to the effect of 10 mM
melibiose at 25 oC and pH 6.6 in a buffer containing 20 mM MES, 100 mM KCl and 10 mM NaCl.
In the right panel: Spectral similarity and intensity in the 1710-1500 cm-1 interval on the first
derivative of the 10 mM Melibiose-induced IR difference spectra in the presence of 10 mM
sodium of Cless and D266C.
To check if the melibiose could produce structural changes in the presence of
sodium, the difference spectra were acquired in the presence of both substrates.
The presence of sodium can increase the melibiose binding affinity of MelB. The
spectra of D266C and D264C were the same either in the absence or presence of
sodium (Figure 4.20 and 4.21). The D266C showed almost the same spectra as Cless
while the D264C almost did not show any peak in the difference spectra. This

RESULTS AND DISCUSSION Universitat Autònoma de Barcelona
98
suggests that the Asp-264 may play a more important role than Asp-266.
1800 1700 1600 1500 1400
Cless 10mM Na 50mM melibiose
0.2 mAU
D264C 10mM Na 50mM Melibiose
ΔAb
sorb
ance
D266C 10mM Na 50mM Melibiose
Wavenumber (cm-1)
Cless D266C0
20
40
60
80
100
120
Rel
ativ
e to
Cle
ss (%
)10 mM Sodium 50 mM Melibiose
Intensity Similarity
Figure 4.21 In the left panel: 50 mM Melibiose-induced IR difference spectra in the presence of
10 mM sodium of Cless, D264C and D266C. The spectra correspond to the effect of 50 mM
melibiose at 25 oC and pH 6.6 in a buffer containing 20 mM MES, 100 mM KCl and 10 mM NaCl.
In the right panel: Spectral similarity and intensity in the 1710-1500 cm-1 interval on the first
derivative of the 50 mM Melibiose-induced IR difference spectra in the presence of 10 mM
sodium of Cless and D266C.
4.4.3.3 Evaluation of the absorbance spectra of the D264C and D266C mutants
Abso
rban
ce
Wavenumber (cm-1)
D266C D264C Cless
1740 1659 1546 1659 1546
Wavenumber (cm-1)
Figure 4.22 Comparison of absorbance spectra of the two charged mutants with Cless in the left
panel; Second derivative of the absorbance spectra in the right panel. The dashed lines marked the
maximum of lipid C=O (around 1740 cm-1), the maximum of the amide I (1659 cm-1) and the
amide II (1546 cm-1) band.

Universitat Autònoma de Barcelona RESULTS AND DISCUSSION
99
The mutants D264C and D266C display similar small secondary structure
alterations as already seen in the Y256C and Y260C mutants. They show a peak shift
from 1659 to 1657 cm-1 as well as small alterations at lower wavenumbers. Therefore,
no gross alterations in the protein secondary structure are induced by the mutation.
4.4.4 The unconserved aromatic amino acid in loop 7-8: F268C
4.4.4.1 Sodium-induced IR difference spectra of F268C mutant
Unlike F258C, the mutant F268C under normal conditions demostrates a Cless
likes interaction with the substrates. As Figure 4.23 and 4.24 show, the
sodium-induced IR difference spectra are similar to those of Cless, illustrating that the
F268C mutant behaves similar to Cless with respect to sodium binding.
1800 1700 1600 1500 1400
Cless 10mM Na
ΔAbs
orba
nce
0.1 mAU
F2658C 10mM Na
Wavenumber (cm-1)
Cless F268C0
20
40
60
80
100
120
Intensity Similarity
Rel
ativ
e to
Cle
ss (%
)
10 mM Sodium
Figure 4.23 In the left panel: 10 mM Na+-induced IR difference spectra of Cless and F268C. The
spectra correspond to the effect of 10 mM NaCl at 25 oC and pH 6.6 in a buffer containing 20 mM
MES and 100 mM KCl. In the right panel: Spectral similarity and intensity in the 1710-1500 cm-1
interval on the first derivative of the10 mM Na+-induced IR difference spectra of Cless and
F268C.

RESULTS AND DISCUSSION Universitat Autònoma de Barcelona
100
1800 1700 1600 1500 1400
ΔAbs
orba
nce
Cless 50mM Na0.05 mAU
F268C 50mM Na
Wavenumber (cm-1)
Cless F268C0
20
40
60
80
100
120 Intensity Similarity
Rel
ativ
e to
Cle
ss (%
)
50 mM Sodium
Figure 4.24 In the left panel: 50 mM Na+-induced IR difference spectra of Cless and F268C. The
spectra correspond to the effect of 50 mM NaCl at 25 oC and pH 6.6 in a buffer containing 20 mM
MES and 100 mM KCl. In the right panel: Spectral similarity and intensity in the 1710-1500 cm-1
interval on the first derivative of the 50 mM Na+-induced IR difference spectra of Cless and
F268C.
4.4.4.2 Melibiose-induced IR difference spectra of F268C mutant in the presence
of sodium
The melibiose-induced difference spectra of the F268C mutant in the presence of
10 mM sodium (Figures 4.26 and 4.27) exhibit similarities and intensities high
enough indicating that the phenylalanine in position 268 is not essential for the sugar
binding.

Universitat Autònoma de Barcelona RESULTS AND DISCUSSION
101
1800 1700 1600 1500 1400
Cless 10mM Na 10mM melibiose
ΔAbs
orba
nce 0.2 mAU
F268C 10mM Na 10mM Melibiose
Wavenumber (cm-1)
Cless F268C0
20
40
60
80
100
120
Intensity Similarity
Rel
ativ
e to
Cle
ss (%
)
10 mM Sodium 10 mM Melibiose
Figure 4.26 In the left panel: 10 mM Melibiose-induced IR difference spectra in the presence of
10 mM sodium of Cless and F268C. The spectra correspond to the effect of 10 mM melibiose at
25 oC and pH 6.6 in a buffer containing 20 mM MES, 100 mM KCl and 10 mM NaCl. In the right
panel: Spectral similarity and intensity in the 1710-1500 cm-1 interval on the first derivative of the
10 mM Melibiose-induced IR difference spectra in the presence of 10 mM sodium of Cless and
F268C.
1800 1700 1600 1500 1400
Cless 10mM Na 50mM melibiose
ΔAbs
orba
nce
0.2 mAU
F268C 10mM Na 50mM Melibiose
Wavenumber (cm-1)
Cless F268C0
20
40
60
80
100
120
Intensity Similarity
Rel
ativ
e to
Cle
ss (%
)
10 mM Sodium 50 mM Melibiose
Figure 4.27 In the left panel: 50 mM Melibiose-induced IR difference spectra in the presence of
10 mM sodium of Cless and F268C. The spectra correspond to the effect of 50 mM melibiose at
25 oC and pH 6.6 in a buffer containing 20 mM MES, 100 mM KCl and 10 mM NaCl. In the right
panel: Spectral similarity and intensity in the 1710-1500 cm-1 interval on the first derivative of the
50 mM Melibiose-induced IR difference spectra in the presence of 10 mM sodium of Cless and
F268C.

RESULTS AND DISCUSSION Universitat Autònoma de Barcelona
102
4.4.4.3 Evaluation of the absorbance spectra of the F268C mutant
In Figure 4.28 the qualitative approach of comparing the second derivative of the absorbance
spectra of the mutant with the Cless reference demonstrate that the mutant F268C almost overlap
with the Cless spectrum in the main peaks of amino I and II. Therefore, the F268C mutation
produces no major alterations of the protein structure.
Abs
orba
nce
Wavenumber (cm-1)
F268C Cless
1740 1659 1546 1659 1546
Cless F268C
Wavenumber (cm-1)
Figure 4.28 Comparison of absorbance spectra of F268C with Cless in the left panel; Second
derivative of the absorbance spectra in the right panel. The dashed lines marked the maximum of
lipid C=O (around 1740 cm-1), the maximum of the amide I (1659 cm-1) and the amide II (1546
cm-1) band.

Universitat Autònoma de Barcelona RESULTS AND DISCUSSION
103
4.4.4.4 Summary and conclusions from the infrared difference
spectra results
1900 1800 1700 1600 1500 1400
1900 1800 1700 1600 1500 1400
1900 1800 1700 1600 1500 1400
1900 1800 1700 1600 1500 1400
1900 1800 1700 1600 1500 1400
1900 1800 1700 1600 1500 1400
Wavenumber (cm-1)
1800 1700 1600 1500 1400
1900 1800 1700 1600 1500 1400
1900 1800 1700 1600 1500 1400
1900 1800 1700 1600 1500 1400
1900 1800 1700 1600 1500 1400
1900 1800 1700 1600 1500 1400
Wavenumber (cm-1)
1900 1800 1700 1600 1500 1400
1900 1800 1700 1600 1500 1400
1900 1800 1700 1600 1500 1400
1900 1800 1700 1600 1500 1400
1900 1800 1700 1600 1500 1400
1900 1800 1700 1600 1500 1400
Wavenumber (cm-1)
1900 1800 1700 1600 1500 1400
1900 1800 1700 1600 1500 1400
1900 1800 1700 1600 1500 1400
1900 1800 1700 1600 1500 1400
1900 1800 1700 1600 1500 1400
1900 1800 1700 1600 1500 1400
Wavenumber (cm-1)
1900 1800 1700 1600 1500 1400
1900 1800 1700 1600 1500 1400
1900 1800 1700 1600 1500 1400
1900 1800 1700 1600 1500 1400
1900 1800 1700 1600 1500 1400
1900 1800 1700 1600 1500 1400
Wavenumber (cm-1)
Abs
orba
nce
Wavenumber (cm-1)
F268C D266C D264C Y260C F258C Y256C Cless
1740 1659 1546
Figure 4.29 A: IR difference spectra of the indicated MelB mutants. B: Comparison of absorbance
spectra of the MelB mutants with Cless
In the IR difference spectra of MelB mutants (Figure 4.29), the mutants Y256C
A 10mM Na 50mM Na 50mm mel 10mM Na10mM mel 10mM Na 50mM mel
Y256C
F258C
Y260C
D264C
D266C
F268C
B

RESULTS AND DISCUSSION Universitat Autònoma de Barcelona
104
and Y260C showed no difference spectra; F258C showed difference spectra only in
the presence of both substrates; D264C only exhibited a reduced intensity and
similarity in the sodium-induced difference spectra; D266C and F268C indicated
similar substrate binding as Cless.
All the mutants showed very similar absorbance spectra when compared with
Cless except several small shifts on the main peak. The spectra suggested some
conformational changes in the MelB protein.

Universitat Autònoma de Barcelona RESULTS AND DISCUSSION
105
4.5 Molecular dynamics
A protein atomistic model for the E. coli MelB was build using the
tridimensional coordinates of S. typhimurium’s MelB structure and changing the
required amino acids to those of E. coli MelB. This model was inserted into a POPE
lipid bilayer, and then water and ions were added into the system. After checking the
correctness of the system, the minimization and equilibration was carried out.
4.5.1 Minimization and Equilibration
0 20000 40000 60000 80000 100000
0
2
4
6
8
10
Min
imiz
atio
n R
MSD
(Å)
Steps
Y260C F258C Y257C Y256C WT
0 100 200 300 400 500
0
2
4
6
8
10
Equ
ilibr
atio
n R
MS
D (Å
)
Time (ps)
Y260C F258C Y257C Y256C WT
Figure 4.30 In the left panel: RMSD of protein backbone during the minimization procedure; In
the right panel: RMSD of protein backbone during the equilibration procedure.
The root-mean-square-deviation (RMSD) during the minimization procedure
showed that the system was stable15 after 100,000 steps in all the mutants and wild
type MelBEC (Figure 4.30, left panel). The gaps between the boxes in the periodic
systems were checked to make sure the atoms will not be lost in the simulation
procedure. Then the system was heated slowly from 0 to 298 K in 2K increments. The
RMSD of protein backbone of the equilibration procedure showed a stable movement
of the atoms from 0 to 298 K (Figure 4.30, right panel). Now, the model was ready for
the Molecular Dynamics simulations.

RESULTS AND DISCUSSION Universitat Autònoma de Barcelona
106
4.5.2 Molecular Dynamics of wild type MelBEC
Figure 4.31 In the left panel: structural changes of wild type MelBEC after 100 ns molecular
dynamics (red: open conformation); In the right panel: The distance between the carbon alpha of
Tyr-256 and that of Tyr-33 is plotted as a measure of extracellular opening. The crystal structures
of outward open conformation of the fucose transporter FucP and the putative drug efflux
proteinYajR are shown for comparison.
Twelve replicas of the wild type simulation were produced for 100 ns each,
starting from two different equilibrated systems. From these, two replicas of the wild
type simulation yielded an outward open state (Figure 4.31: 1 and 2), one from each
equilibrated system, whereas ten replicas yielded a partially occluded-like state or
even a totally occluded state (Figure 4.31: 3 and 4, for two representative partially
occluded states) as judged by the plot of distances between the alpha carbon of Tyr-33
and Tyr-256, compared to the initial state (0 ns). It is shown that the distance change
between Tyr-33-Cα and Tyr-256-Cα in the open conformation was nearly two times
more than the initial state. Opening to the periplasmic space was further confirmed by
a surface representation of the water molecules (Figure 4.32). In models 1 and 2, the
solvent accessible surfaces of the transport area in the periplasmic side were bigger

Universitat Autònoma de Barcelona RESULTS AND DISCUSSION
107
than in 3 and 4.
Figure 4.32 the surface representation of water molecules allows identifying the water occupancy
in the 0 ns and 100 ns states. The numbers of the models are the same as in Figure 4.31.
Figure 4.33 A. Bendix plot16 rendered in VMD representing the transition from 0 ns (outward
partially occluded) to 250 ns (outward fully opened) for a WT simulation. B. Heatmap of helices
curvature per residue as a function of time.
The MD for one of the two outward open models was extended up to 250 ns
(Figure 4.33) to search for further conformational changes. Only small changes were
observed beyond the first 100 ns (Figure 4.33A and Figure 4.34A, B). The dynamics
reveals that the loop 7-8 suffers conformational changes (Figure 4.34D) involving
also a curvature change in helix VII at around 50 ns (Figure 4.33B). This change was
mainly at the Gly-252 position, and we can see from the figure that the helix curvature
was decreased (Figure 4.34B). This change causes the separation of the helix VII and
helix I resulting in the open conformation of MelB. The interaction between helix I

RESULTS AND DISCUSSION Universitat Autònoma de Barcelona
108
and VII was broken as we can see in Figure 4.35. The intra-helix conformational
changes of Helix VII represent a deviation from the rigid body rocking-bundle model
(Figure 4.34B). At around 100 ns, the protein shows a fully open shape that hardly
changes until the end of the simulation (Figures 4.33B, 4.34C and D). As reported by
Stelzl et al for other transporters,17 the periplasmic gate distance of the open
conformation was estimated by Cα atoms of the residues in helix I and VII (FucP:
Gln-51/Ile-282; YajR: Thr-37/Pro-236), which is around 20 Å (measured by VMD).
This value fits well with the values found in our case of about 25 Å (Figure 4.31 and
4.34C).
Figure 4.34 A. Initial (blue) and final (250 ns, red) states of MelBEC after spatial alignment. B.
Initial (blue) and final (red) states of helix VII and I in MelBEC after spatial alignment; Gly 252
was colored in yellow and inside the circle. C. Helical motions in MelBEC on reaching the open
conformation. Four superimposed conformations of helix VII and helix I (left): initial (t = 0 ns;
blue) and final (t = 250 ns; grey) along with two intermediate snapshots (t = 50 ns; red. t = 100 ns;
yellow) are shown. Distances between the helix VII and helix I (right) measured by Cα atoms of
representative residues are shown in the figure. D. RMSD per residue of the MelBEC opening. The
scale bar indicates RMSD in Å.
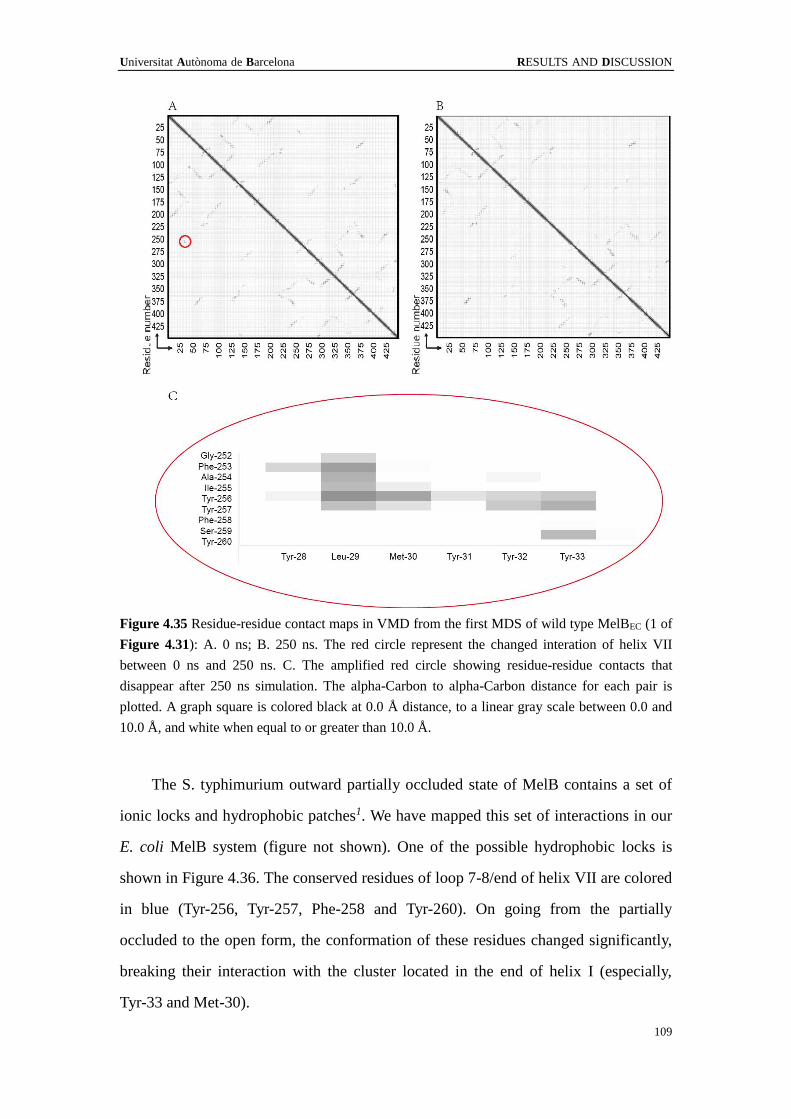
Universitat Autònoma de Barcelona RESULTS AND DISCUSSION
109
Figure 4.35 Residue-residue contact maps in VMD from the first MDS of wild type MelBEC (1 of
Figure 4.31): A. 0 ns; B. 250 ns. The red circle represent the changed interation of helix VII
between 0 ns and 250 ns. C. The amplified red circle showing residue-residue contacts that
disappear after 250 ns simulation. The alpha-Carbon to alpha-Carbon distance for each pair is
plotted. A graph square is colored black at 0.0 Å distance, to a linear gray scale between 0.0 and
10.0 Å, and white when equal to or greater than 10.0 Å.
The S. typhimurium outward partially occluded state of MelB contains a set of
ionic locks and hydrophobic patches1. We have mapped this set of interactions in our
E. coli MelB system (figure not shown). One of the possible hydrophobic locks is
shown in Figure 4.36. The conserved residues of loop 7-8/end of helix VII are colored
in blue (Tyr-256, Tyr-257, Phe-258 and Tyr-260). On going from the partially
occluded to the open form, the conformation of these residues changed significantly,
breaking their interaction with the cluster located in the end of helix I (especially,
Tyr-33 and Met-30).

RESULTS AND DISCUSSION Universitat Autònoma de Barcelona
110
Figure 4.36 Details of the partially occluded state (0 ns) and the outward full open state (250 ns).
Illustrative representation highlighting the hydrophobic lock between helix VII and I. The
conserved residues of helix VII are shown in blue and the four residues of helix I are shown in red.
4.5.3 Molecular Dynamics of MelB mutated at conserved amino acids in loop
7-8/end of helix VII
Two replicas of each mutants (Y256C, Y257C, F258C and Y260C) yielded
relatively small changes during the simulation. Y256C and F258C showed a moderate
tendency to open, giving in each case a partially occluded-like state more open than
the initial state. Y257C and Y260C showed almost no changes during simulations. To
illustrate changes, Figure 4.37 shows the plot of distances between the carbon alpha
of Tyr33 and residue 256, compared to the initial state (0 ns). The observed change of
the periplasmic space was further confirmed by a surface representation of the water
molecules (Figure 4.38). And the curvature analysis of helix VII (figure 4.39) showed
only few changes after the first 50 ns of simulation. It is possible that more replicas or
longer simulations could show differences compared to WT.

Universitat Autònoma de Barcelona RESULTS AND DISCUSSION
111
5 6 7 8 9 10 11 120
2
4
6
8
10
12
14
Y33
Ca-
256C
a di
stan
ce (Å
)
0 ns 100 ns
Figure 4.37 In the upper panel: the structure of MelBEC mutants changes from 0 ns to 100 ns (5
and 6: Y256C; 7 and 8: Y257C; 9 and 10:F258C; 11 and 12: Y260C); In the lower panel: The
distance between the carbon alpha of Tyr33 and the residue of 256 is plotted as a measure of
extracellular opening.

RESULTS AND DISCUSSION Universitat Autònoma de Barcelona
112
Figure 4.38 the surface representation of water molecules allows identifying the water occupancy
in the 0 ns and 100 ns. The numbers for the replicas were the same as in Figure 4.37.
Figure 4.39 Heatmap of helix VII curvature per residue as a function of time of WT (1), Y256C
(5), Y257C (7), F258C (9), and Y260C (11) MelBEC mutants.
4.5.4 Conclusions from the molecular dynamics results
The open conformation of MelB protein proceeds through a considerable

Universitat Autònoma de Barcelona RESULTS AND DISCUSSION
113
movement on the helices, especially on helix VII.
The conserved amino acids in loop 7-8/end of helix VII may be important to help
controlling the open movement of the protein, since they interact with residues on
helix I in the occluded state.

RESULTS AND DISCUSSION Universitat Autònoma de Barcelona
114
4.6 Crystallization studies of MelB R149C mutant
The conformational dynamics of secondary transporters make it difficult to get a
good resolution crystal. So, a mutant with decreased conformational flexibility may
help the crystallization of transporters. Our group found that the R149C mutant9 can
bind substrates and also traps the protein in an inward-facing conformation.
Therefore, it seems that this R149C mutant is suitable for crystallization trials.
As described in the Materials and Methods, we purified the R149C protein and
prepared this protein at enough high concentration, then commercial crystal
screening kits were assayed to try to improve the previous conditions obtained by
Lin3.
We successfully got crystals in a condition containing 0.1 M MES, pH 7, 0.1 M
NaCl and 34% PEG 300 (Figure 4.40). But the diffraction patterns of these crystals
yielded resolutions around 7 Å, a little better than previously described, but not good
enough to be processed. Although we tried to optimize the conditions (pH, different
PEG concentration and so on), no better crystals were obtained.
Figure 4.40 X-ray diffraction patterns of R149C crystals obtained at synchrotron ALBA
XALOC-13 beamline.

Universitat Autònoma de Barcelona RESULTS AND DISCUSSION
115
REFERENCES
1. Ethayathulla, A. S., Yousef, M. S., Amin, A., Leblanc, G., Kaback, H. R., and Guan, L. (2014)
Structure-based mechanism for Na(+)/melibiose symport by MelB, Nature communications 5,
3009.
2. Goldenberg, O., Erez, E., Nimrod, G., and Ben-Tal, N. (2009) The ConSurf-DB:
pre-calculated evolutionary conservation profiles of protein structures, Nucleic acids research
37, D323-327.
3. Lin, Y. (2012) Structural and functional studies of melibiose permease of Escherichia coli, In
Department of Biochemistry and Molecular Biology, Universitat Autònoma de Barcelona.
4. Maehrel, C., Cordat, E., Mus-Veteau, I., and Leblanc, G. (1998) Structural studies of the
melibiose permease of Escherichia coli by fluorescence resonance energy transfer. I. Evidence
for ion-induced conformational change, The Journal of biological chemistry 273,
33192-33197.
5. Cordat, E., Mus-Veteau, I., and Leblanc, G. (1998) Structural studies of the melibiose
permease of Escherichia coli by fluorescence resonance energy transfer. II. Identification of
the tryptophan residues acting as energy donors, The Journal of biological chemistry 273,
33198-33202.
6. Abdel-Dayem, M., Basquin, C., Pourcher, T., Cordat, E., and Leblanc, G. (2003) Cytoplasmic
loop connecting helices IV and V of the melibiose permease from Escherichia coli is involved
in the process of Na+-coupled sugar translocation, J Biol Chem 278, 1518-1524.
7. Guan, L., Nurva, S., and Ankeshwarapu, S. P. (2011) Mechanism of melibiose/cation symport
of the melibiose permease of Salmonella typhimurium, The Journal of biological chemistry
286, 6367-6374.
8. Guan, L., Jakkula, S. V., Hodkoff, A. A., and Su, Y. (2012) Role of Gly117 in the
cation/melibiose symport of MelB of Salmonella typhimurium, Biochemistry 51, 2950-2957.
9. Lin, Y., Fuerst, O., Granell, M., Leblanc, G., Lorenz-Fonfria, V., and Padros, E. (2013) The
substitution of Arg149 with Cys fixes the melibiose transporter in an inward-open
conformation, Biochimica et biophysica acta 1828, 1690-1699.
10. Leon, X., Leblanc, G., and Padros, E. (2009) Alteration of sugar-induced conformational
changes of the melibiose permease by mutating Arg141 in loop 4-5, Biophys. J. 96,
4877-4886.
11. Leon, X., Lemonnier, R., Leblanc, G., and Padros, E. (2006) Changes in secondary structures
and acidic side chains of melibiose permease upon cosubstrates binding, Biophysical journal
91, 4440-4449.
12. Ganea, C., Pourcher, T., Leblanc, G., and Fendler, K. (2001) Evidence for intraprotein charge
transfer during the transport activity of the melibiose permease from Escherichia coli,
Biochemistry 40, 13744-13752.
13. Ganea, C., and Fendler, K. (2009) Bacterial transporters: charge translocation and mechanism,
Biochimica et biophysica acta 1787, 706-713.
14. Fuerst, O., Lin, Y., Granell, M., Leblanc, G., Padros, E., Lorenz-Fonfria, V. A., and Cladera, J.
(2015) The Melibiose Transporter of Escherichia coli: CRITICAL CONTRIBUTION OF
LYS-377 TO THE STRUCTURAL ORGANIZATION OF THE INTERACTING
SUBSTRATE BINDING SITES, The Journal of biological chemistry 290, 16261-16271.
15. Law, R. J., Capener, C., Baaden, M., Bond, P. J., Campbell, J., Patargias, G., Arinaminpathy, Y.,

RESULTS AND DISCUSSION Universitat Autònoma de Barcelona
116
and Sansom, M. S. (2005) Membrane protein structure quality in molecular dynamics
simulation, Journal of molecular graphics & modelling 24, 157-165.
16. Dahl, A. C., Chavent, M., and Sansom, M. S. (2012) Bendix: intuitive helix geometry analysis
and abstraction, Bioinformatics 28, 2193-2194.
17. Stelzl, L. S., Fowler, P. W., Sansom, M. S., and Beckstein, O. (2014) Flexible gates generate
occluded intermediates in the transport cycle of LacY, Journal of molecular biology 426,
735-751.

Universitat Autònoma de Barcelona GENERAL DISCUSSION
117
5 GENERAL DISCUSSION
Some studies show that the loops are important for the structure and function of
membrane proteins. For example, research on Lac permease shows that a minimum
length of the central cytoplasmic loop is necessary for activity, stability, and insertion
into the membrane.1 A loop of the calcium pump was found to be important for the
transport process: the loop is mediating contact between the intramembranous
Ca2+-binding sites and the cytosolic phosphorylation site2; the loop 6-7 participates in
the formation of an entrance port, before subsequent high affinity binding of Ca2+
inside the membrane3. A study about the cytoplasmic loop 4-5 of MelB suggests that
it is involved in the process of Na+-coupled sugar translocation4.
Figure 5.1 The distribution of helices and loops. A. Before the 3D structure was solved.5 B. After
the 3D structure was solved.6

GENERAL DISCUSSION Universitat Autònoma de Barcelona
118
The fact that four aromatic amino acids (Tyr-256, Tyr257, Phe-258 and Tyr-260)
that have a high level of conservation are located in the loop 7-8 and the end of helix
VII suggested that this loop/end of helix may also have some role in the transport
mechanism of MelB. In addition, there are two negatively charged residues (Asp-264
and Asp-266) and one more aromatic amino acid (Phe-268) in this loop, out of the
residues mentioned before.
At the beginning of this project, the MelB 3D structure was not known, and the
distribution of helices and loops was that established by prediction methods5 as shown
in Figure 5.1A. Shortly afterward, the transporter 3D structure was published6,
establishing some differences in the distribution of helices and loops (Figure 5.1B). It
therefore resulted that three of the conserved residues are in fact located at the end of
helix VII.
For all the mutants described in this thesis, the FRET (Trp → D2G) of
MelB-containing proteoliposomes and ISO vesicles was measured. The results show
that the mutants of the four conserved amino acids are almost unable to bind D2G and
no subsequent effect of Na+ or melibiose were observed. On the other hand, the IR
difference spectra of Y256C and Y260C do not show the same peaks as in Cless, after
Na+ or melibiose addition. These set of experiments demonstrate the absence of
interaction of the MelB substrates with these mutants. However, F258C showed some
peaks in the difference spectra, suggesting a low binding affinity of substrates for this
mutant. The positions of the four conserved residues are shown in Figure 5.2. Except
for Tyr-260 in the loop 7-8, the other three residues (Tyr-256, Tyr-257 and Phe-258)
are located at the end of helix VII. When these amino acids are mutated to cysteine,
the occupied volumes are decreased since the volume of cysteine is smaller than
tyrosine or phenylalanine. The results of two repeats of 250 ns molecular dynamics
simulation of each of the mutants Y256C, Y257C, F258C and Y260C showed only
small changes in the protein conformation. However, the fact that these mutants are
unable to bind the substrates indicates that these four residues are very important in
the MelB transport mechanism, in keeping with the conservation analysis. As Guan et

Universitat Autònoma de Barcelona GENERAL DISCUSSION
119
al 6indicated, LacY and MelB have similar sugar specificity as well as similar location
of the sugar-recognition site, and the aromatic residues may contribute to interact with
the sugar by CH/π-interactions with the pyranosyl ring. Therefore, these four residues
could help the sugar to find the right way to go inside the MelB protein. However, the
fact that the mutated MelB also lack interaction with the co-substrate Na+ calls for a
more structural role. In the context of this hypothesis, it was shown by Molecular
Dynamics that the interactions between the end of helices VII and I (the hydrophobic
lock) in which these four aromatic side chains participate are broken upon opening of
the extracellular side (Figure 5.5). Thus, this hydrophobic lock may have a role on the
opening/closing mechanism necessary for permitting substrates binding/release and
thus necessary for the transport mechanism.
Figure 5.2 The positions of four conserved amino acids in loop 7-8/end of helix VII of the MelB.
A, MelBST-A6; B, Wild type-MelBEC; C, Y256C-MelBEC; D, Y257C-MelBEC; E, F258C-MelBEC;
F, Y260C-MelBEC. (256-yellow; 257-red; 258-blue; 260-grey)
Apart from the four conserved residues, there are two negatively charged
residues (Asp-264 and Asp-266) in loop 7-8 (Figure 5.3). The mutation of these two

GENERAL DISCUSSION Universitat Autònoma de Barcelona
120
charged residues shows similar results in FRET experiments as for Cless. But the IR
difference spectra show somewhat altered results. The IR difference spectra of D266C
have almost the same peaks as Cless, however, D264C only shows similar peaks as
Cless in the presence of sodium but not in the presence of melibiose. It is possible that
mutation of Asp-264 affects the melibiose binding site thus giving rise to altered IR
difference spectra.
Figure 5.3 The two charged amino acids of loop 7-8 in the MelBST-A6. (Asp-264: yellow;
Asp-266: orange)
There is another aromatic amino acid in loop 7-8, Phe-268. The FRET shows that
F268C keeps the ability to bind sodium, D2G and melibiose. The IR difference spectra
give an identical conclusion. Some other residues (S259A, S259C, V261C, G263C,
A265C, L267C) of the loop 7-8/helix VII were also studied in FRET experiments;
they show the capability of binding Na+, D2G and melibiose to different levels.
The loop 7-8 had not been studied before, whereas other loops such as 4-5 or
10-11 have merited interest in the past. The Arg-141 and Arg-149 in loop 4-5 were
found to be involved in the reaction of co-substrate translocation or substrate release
in the inner compartment.4 Later research suggested that Arg-149 was not in the loop
but in the helix V7; the Arg-141 has a role in catalyzing the subsequent

Universitat Autònoma de Barcelona GENERAL DISCUSSION
121
conformational change necessary for substrate translocation.8 Another study
suggested that the loop 4-5 contributes to the coordinated interactions between the ion
and sugar binding sites; it also participates in an electrogenic conformational
transition after melibiose binding.9 A cysteine scan on the loop 10-11 shows that in the
melibiose transporter functionally charged resides are structurally conserved.10 The
loop 10-11 was not totally exposed in the cytoplasmic side, as some parts have a
re-entrant loop structure.11
Since the loop 7-8 is located in the inner part of the periplasmic side of the
protein, its movement can cause a considerable effect on the protein conformation. As
shown in Figure 5.4, when the loop bends to the inner side of the cave, the open area
will become smaller. Which looks like a part of the gates as hypothesis in a 6-state
model of SGLTs 2 (see in the Introduction part: Figure 1.10).
Figure 5.4 The scheme of the helices positions from the open conformation of MelBEC of MDS.
Left: 0 ns; Right: 250 ns

GENERAL DISCUSSION Universitat Autònoma de Barcelona
122
Considering the existing hypothetical mechanisms of sugar transporters (LacY12,
13, SGLTs14 and MelBST6 ), the following mechanism is proposed (Figure 5.6) : 1.
occluded-empty state; 2. Outward-empty state; 3. Outward sodium bound state.
Binding of a Na+ to the cation-binding site induces an increase in sugar affinity,
maybe let the sugar binding site form; 4. Outward sodium and melibiose bound sate.
The sodium was binding in the middle of a trigonal bipyramid formed by the residues
at positions Asp-55/Asp-59/Asp-124 and Tyr-120/Thr-121/Thr-3736. And the
melibiose is near Asp-1246, 15 which is the area of sugar binding site; 5. Occluded
sodium and melibiose bound state; 6. Inward sodium and melibiose bound state; 7.
Inward melibiose released state; 8. Inward sodium released state. The transport
process is continuous from 1 to 8.
Figure 5.5 Details of the partially occluded state (0 ns) and the outward full open state (250 ns).
Illustrative representation highlighting one of the hydrophobic lock (between helixVII and I), the
residues of helix VII are showed in blue and the residues of helix I are showed in red.
Our results are relevant for several steps of the transport cycle (see Figure 5.6).
In the empty transporter, interactions between the extremes of helices I and VII such
those we describe (the hydrophobic lock) appear to be important for the equilibrium
outwardly open↔occluded↔inwardly open (steps 2, 1, 8). To allow the equilibrium,
the hydrophobic lock should remain sufficiently weak. After binding of substrates, an
increase in the interaction force within the lock drives the transporter to a stabilized

Universitat Autònoma de Barcelona GENERAL DISCUSSION
123
form predominantly opened toward the cytoplasm to allow the release of substrates
(steps 6, 7, 8). This strengthening of the lock could occur by substrate-induced
conformational changes leading to a more favorable interaction. The protein returns to
the initial equilibrium state requiring a weaker force of interaction involved in the
hydrophobic lock, upon substrates release. Finally, it is interesting to remark that helix
VII is not moving as a rigid body, but a kink initially present at the level of Gly-252
disappears, giving rise to a straight helix upon opening of the extracellular side, as can
be seen in Figure 5.7.
Figure 5.6 The scheme of kinetic steps for Na+/melibiose symport. 1. occluded-empty state; 2.
Inward-empty state; 3. Inward sodium bound state; 4. Inward sodium and melibiose bound sate; 5.
Occluded sodium and melibiose bound state; 6. Outward sodium and melibiose bound state; 7.
Outward melibiose released state; 8. Outward sodium released state. Sodium: yellow cycle;
melibiose: red star.

GENERAL DISCUSSION Universitat Autònoma de Barcelona
124
Figure 5.7 Initial (blue) and final (red) states of helix VII and I in MelBEC after spatial alignment,
Gly 252 was colored by yellow. Drawing method of helix VII and I: A. Tube; B. Cartoon.
Universitat Autònoma de Barcelona GENERAL DISCUSSION
125
REFERENCES
1. Weinglass, A. B., and Kaback, H. R. (2000) The central cytoplasmic loop of the major
facilitator superfamily of transport proteins governs efficient membrane insertion,
Proceedings of the National Academy of Sciences of the United States of America 97,
8938-8943.
2. Zhang, Z., Lewis, D., Sumbilla, C., Inesi, G., and Toyoshima, C. (2001) The role of the
M6-M7 loop (L67) in stabilization of the phosphorylation and Ca(2+) binding domains of the
sarcoplasmic reticulum Ca(2+)-ATPase (SERCA), The Journal of biological chemistry 276,
15232-15239.
3. Menguy, T., Corre, F., Juul, B., Bouneau, L., Lafitte, D., Derrick, P. J., Sharma, P. S., Falson,
P., Levine, B. A., Moller, J. V., and le Maire, M. (2002) Involvement of the cytoplasmic loop
L6-7 in the entry mechanism for transport of Ca2+ through the sarcoplasmic reticulum
Ca2+-ATPase, The Journal of biological chemistry 277, 13016-13028.
4. Dayem, M. A., Basquin, C., Pourcher, T., Cordat, E., and Leblanc, G. (2003) Cytoplasmic loop
connecting helices IV and V of the melibiose permease from Escherichia coli is involved in
the process of Na+-coupled sugar translocation, Journal of Biological Chemistry 278,
1518-1524.
5. Pourcher, T., Bibi, E., Kaback, H. R., and Leblanc, G. (1996) Membrane topology of the
melibiose permease of Escherichia coli studied by melB-phoA fusion analysis, Biochemistry
35, 4161-4168.
6. Ethayathulla, A. S., Yousef, M. S., Amin, A., Leblanc, G., Kaback, H. R., and Guan, L. (2014)
Structure-based mechanism for Na(+)/melibiose symport by MelB, Nature communications 5,
3009.
7. Lin, Y., Fuerst, O., Granell, M., Leblanc, G., Lorenz-Fonfria, V., and Padros, E. (2013) The
substitution of Arg149 with Cys fixes the melibiose transporter in an inward-open
conformation, Biochimica et biophysica acta 1828, 1690-1699.
8. Leon, X., Leblanc, G., and Padros, E. (2009) Alteration of sugar-induced conformational
changes of the melibiose permease by mutating Arg141 in loop 4-5, Biophys. J. 96,
4877-4886.
9. Meyer-Lipp, K., Sery, N., Ganea, C., Basquin, C., Fendler, K., and Leblanc, G. (2006) The
inner interhelix loop 4-5 of the melibiose permease from Escherichia coli takes part in
conformational changes after sugar binding, The Journal of biological chemistry 281,
25882-25892.
10. Ding, P. Z. (2003) An investigation of cysteine mutants on the cytoplasmic loop X/XI in the
melibiose transporter of Escherichia coli by using thiol reagents: implication of structural
conservation of charged residues, Biochemical and biophysical research communications 307,
864-869.
11. Ding, P. Z. (2004) Loop X/XI, the largest cytoplasmic loop in the membrane-bound melibiose
carrier of Escherichia coli, is a functional re-entrant loop, Biochimica et biophysica acta 1660,
106-117.
12. Madej, M. G., Sun, L., Yan, N., and Kaback, H. R. (2014) Functional architecture of MFS
D-glucose transporters, Proceedings of the National Academy of Sciences of the United States
of America 111, E719-727.
13. Stelzl, L. S., Fowler, P. W., Sansom, M. S., and Beckstein, O. (2014) Flexible gates generate

GENERAL DISCUSSION Universitat Autònoma de Barcelona
126
occluded intermediates in the transport cycle of LacY, Journal of molecular biology 426,
735-751.
14. Wright, E. M., Loo, D. D., and Hirayama, B. A. (2011) Biology of human sodium glucose
transporters, Physiological reviews 91, 733-794.
15. Shaikh, S. A., Li, J., Enkavi, G., Wen, P. C., Huang, Z., and Tajkhorshid, E. (2013) Visualizing
functional motions of membrane transporters with molecular dynamics simulations,
Biochemistry 52, 569-587.
16. Fuerst, O., Lin, Y., Granell, M., Leblanc, G., Padrós, E., Lorenz-Fonfria, V. A., and Cladera, J.
(2015) The Melibiose Transporter of Escherichia coli: CRITICAL CONTRIBUTION OF
LYS-377 TO THE STRUCTURAL ORGANIZATION OF THE INTERACTING
SUBSTRATE BINDING SITES, The Journal of biological chemistry 290, 16261-16271.

Universitat Autònoma de Barcelona CONCLUSIONS
127
CONCLUSIONS
1) There are four conserved amino acids (Tyr-256, Tyr-257, Phe-258 and Tyr-260)
in the loop 7-8/end of helix VII.
2) The Förster Resonance Energy Transfer and infrared difference spectra results
of Y256C and Y260C show that the mutants are not able to bind D2G, Na+ or
melibiose.
3) The FRET spectra of Y257C and F258C suggest the mutants have lost the
binding ability with D2G, Na+ or melibiose. But the IR difference spectra of F258C
have some peaks in the presence of sodium and melibiose, indicative of low binding
affinity.
4) D264C gave similar FRET spectra as Cless in ISO vesicles and
proteoliposomes, although of reduced intensity. But the IR difference spectra showed
peaks only in the presence of Na+ (i.e. there are no peaks in the presence of melibiose).
These results suggest that Asp-264 has some structural role in the transport
mechanism.
5) The mutants S259A, S259C, V261C, G263C, A265C, D266C, L267C and
F268C are able to give a similar response as Cless in the fluorescence experiments
when D2G, Na+ or melibiose was added. And the IR difference spectra of D266C and
F268C also show similar peaks as Cless.
6) Molecular dynamics simulations of MelBEC show conformational changes
from an occluded state to an outward open state. The helix VII undergoes significant
changes, during which the extracellular part separates from helix I. Combining these
results with those from FRET and IR spectra, it is suggested that the conserved
residues may form an hydrophobic lock which may be important in the transport
process.
7) We got some crystals of R149C which can diffract to a resolution near 7 Å.

CONCLUSIONS Universitat Autònoma de Barcelona
128
However, the data from the diffraction patterns are not good enough to be processed
to get structural information.

Universitat Autònoma de Barcelona APPENDIX
129
APPENDIX
Appendix 1 Sequencing of mutants. Comparison with Cless.
Y256C
Y257C
F258C
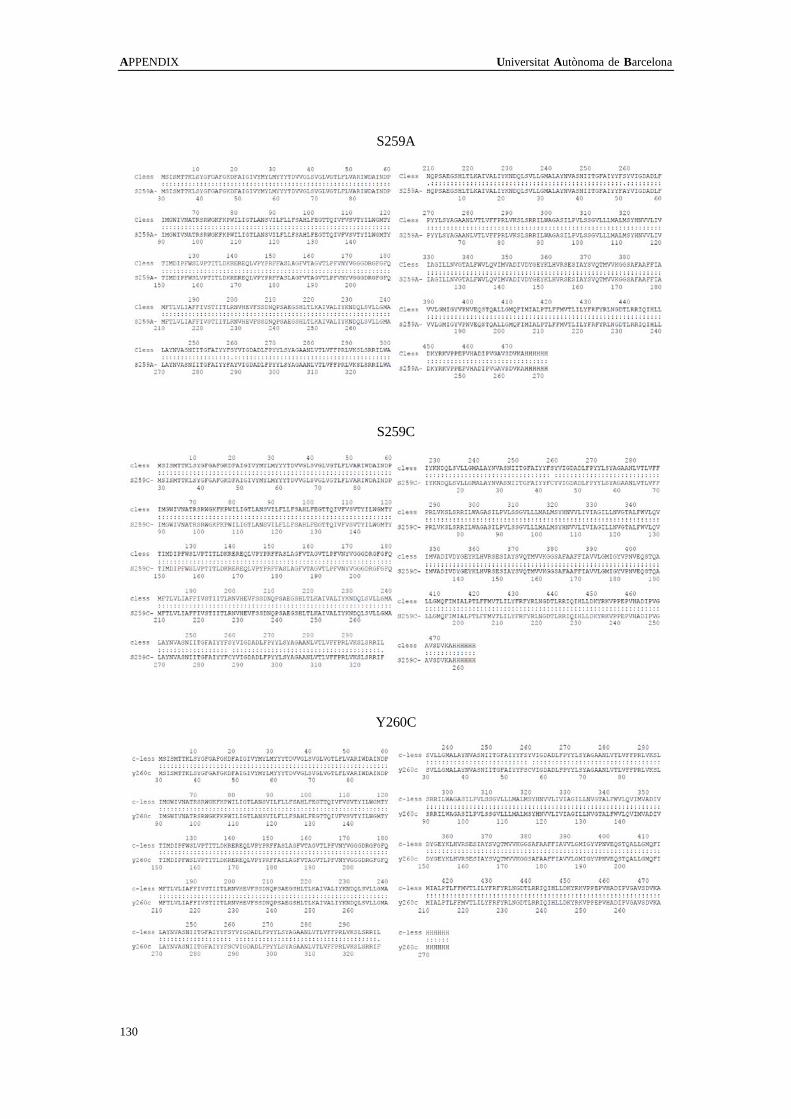
APPENDIX Universitat Autònoma de Barcelona
130
S259A
S259C
Y260C
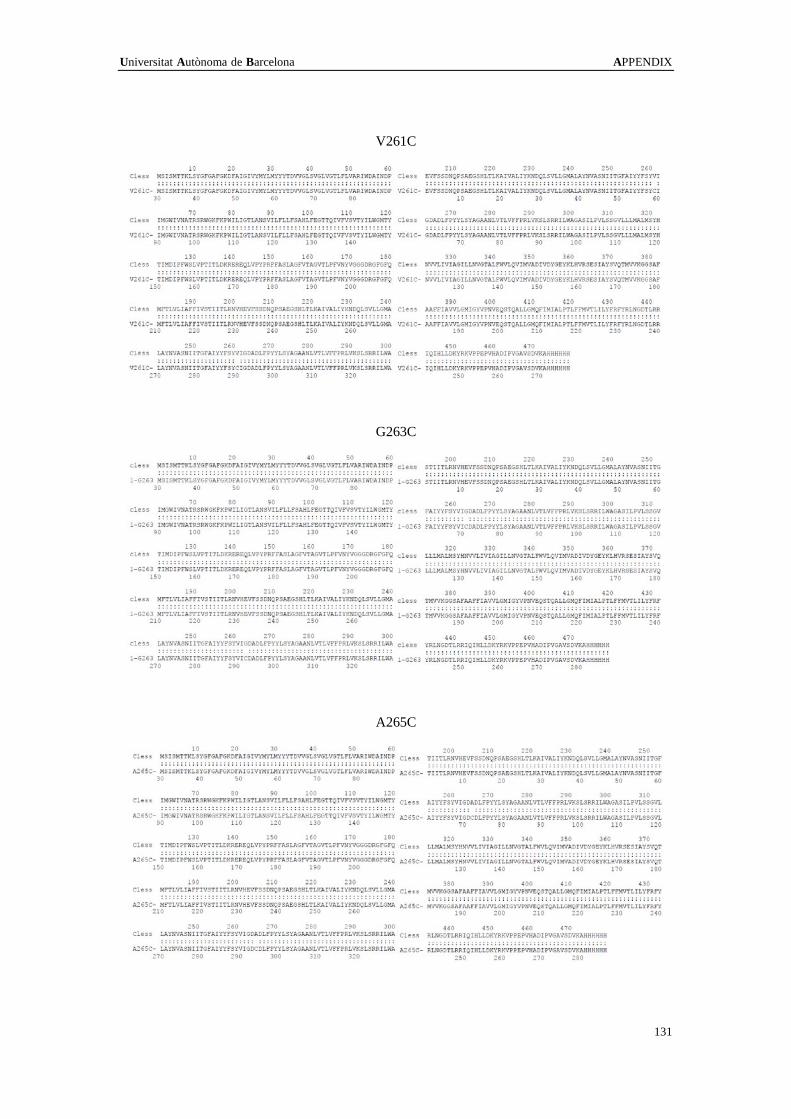
Universitat Autònoma de Barcelona APPENDIX
131
V261C
G263C
A265C

APPENDIX Universitat Autònoma de Barcelona
132
D266C
L267C
F268C

Universitat Autònoma de Barcelona APPENDIX
133
Appendix 2 The files used in the MDS
CONFIGURATION FILES
1. Minimization
# minimization with NAMD
# Periodic conditions. 100 ps.
coordinates ionized.pdb
structure ionized.psf
parameters par_all36_lipid.prm
parameters par_all36_prot.prm
parameters toppar_water_ions.mod.str
paratypecharmm on
set output minimized
outputname $output
dcdfile ${output}.dcd
xstFile ${output}.xst
dcdfreq 500
xstFreq 500
binaryoutput no
binaryrestart no
outputEnergies 200
restartfreq 1000
rigidbonds all
rigidTolerance 0. 5
exclude scaled1-4
1-4scaling 1
COMmotion no
dielectric 1.0
switching on
switchdist 8
cutoff 10
pairlistdist 12
firsttimestep 0
stepspercycle 20
timestep 1.0
nonbondedFreq 1
fullElectFrequency 2
set temperature 298
temperature $temperature
cellBasisVector1 X 0 0 # according to cell dimensions.
cellBasisVector2 0 Y 0

APPENDIX Universitat Autònoma de Barcelona
134
cellBasisVector3 0 0 Z
cellOrigin a b c
wrapWater on
wrapAll on
wrapNearest off
PME yes
PMEGridSpacing 1.0
minimize 100000
2. Equilibration
# Equilibration in Windows with NAMD after minimization all free in Windows
# Periodic conditions
# 100 ps. Heating from 0K in 2K increments.
# input
set input minimized
coordinates ${input}.coor
extendedSystem ${input}.xsc
structure ionized.psf
parameters par_all36_lipid.prm
parameters par_all36_prot.prm
parameters toppar_water_ions.mod.str
paratypecharmm on
# output
set output equilibrated
outputname $output
dcdfile ${output}.dcd
xstFile ${output}.xst
dcdfreq 200
xstFreq 500
binaryoutput no
binaryrestart no
outputEnergies 200
restartfreq 1000
# mobile atom selection:
fixedAtoms off
# Basic dynamics
exclude scaled1-4
1-4scaling 1
COMmotion no
dielectric 1.0
# Simulation spacepartitioning

Universitat Autònoma de Barcelona APPENDIX
135
switching on
switchdist 8
cutoff 10
pairlistdist 12
# Multiple timeste pping
firsttimestep 0
stepspercycle 20
timestep 1.0 ;# 1fs/step
rigidBonds all ;# needed if 2fs steps
nonbondedFreq 1 ;# nonbonded forces every step
fullElectFrequency 2 ;# PME only every other step
wrapWater on ;# wrap water to central cell
wrapAll on ;# wrap other molecules too
wrapNearest off ;# use for non-rectangular cells
#PME (for full-system periodic electrostatics)
PME yes
# let NAMD determi ne grid
PMEGridSpacing 1.0
# Scripting
temperature 0 # starting at 0 K
reassignFreq 500
reassignIncr 2
reassignHold 298 # target T: 298 K
numsteps 100000
3. Molecular Dynamics (production)
# Production in linux with ACEMD (250 ns) after equilibration with NAMD in Win.
# Periodic conditions. Equilibration started at 0 K, 2K incr.
# input
set input equilibrated
coordinates ${input}.coor
extendedsystem ${input}.xsc
velocities ${input}.vel
structure ionized.psf
parameters par_all36_prot_lipids_na_carb_ethers_water_ions.prm
# output
restart on
set output Melbec-250
outputname $output
dcdfile ${output}.dcd
dcdfreq 25000
restartfreq 1000000

APPENDIX Universitat Autònoma de Barcelona
136
restartname ${output}
restartsave on
energyfreq 10000
# Basic dynamics
exclude scaled1-4
1-4scaling 1
dielectric 1.0
# Simulation space partitioning
switching on
switchdist 8
cutoff 10
pairlistdist 12
# Multiple time stepping
timestep 4.0 ;# 4fs/step
rigidbonds all ;# needed for 4fs steps
fullelectfrequency 2 ;# PME only every other step
hydrogenscale 4 ;# needed for 4fs steps
# Constant Temperature Control
langevin on ;# langevin dynamics
langevindamping 2 ;# damping coefficient of 2/ps
langevintemp 298 ;# random noise at this level
berendsenpressure on
berendsenpressuretarget 101.325
berendsenpressurerelaxationtime 400
useconstantratio on
#PME (for full-system periodic electrostatics)
pme on
wrap on ;# wrap all to central cell
pmegridspacing 1.0
# Scripting
run 62500000 ;# 250 ns (because 4 fs/step)

Universitat Autònoma de Barcelona APPENDIX
137
Appendix 3 The changed amino acids
Salmonella typhimurium to Escherichia coli
No. RESID Amino acid Mutant
1 86 THR ALA
2 89 LEU VAL
3 90 VAL ILE
4 104 ALA THR
5 106 VAL ILE
6 147 PHE TYR
7 162 ILE VAL
8 168 SER ASN
9 173 ALA GLY
10 192 ALA VAL
11 196 VAL ILE
12 205 TYR PHE
13 210 GLY GLN
14 211 VAL PRO
15 212 THR SER
16 214 GLY GLU
17 215 ARG GLY
18 216 PRO SER
19 222 THR ALA
20 225 GLY ALA
21 245 ILE VAL
22 251 ASN THR
23 259 THR SER
24 281 LEU VAL
25 284 ILE VAL
26 285 VAL PHE
27 292 MET SER
28 304 VAL ILE
29 305 MET LEU
30 311 ALA GLY
31 312 GLY VAL
32 314 PHE LEU
33 315 ALA LEU
34 319 ALA MET
35 320 ASP SER
36 321 ILE TYR
37 324 ALA VAL

APPENDIX Universitat Autònoma de Barcelona
138
38 325 ALA VAL
39 329 ALA ILE
40 333 PHE LEU
41 336 ILE VAL
42 352 THR ILE
43 358 PHE TYR
44 361 ASN HSD
45 362 ILE VAL
46 389 LEU VAL
47 393 LEU MET
48 397 THR VAL
49 401 ALA GLU
50 404 ALA THR
51 406 THR ALA
52 408 GLN LEU
53 416 VAL ALA
54 419 VAL THR
55 424 MET VAL
56 427 VAL ILE
57 432 TYR PHE
58 439 MET THR
59 442 LYS ARG

Universitat Autònoma de Barcelona APPENDIX
139
Appendix 4 The result from ConSurf


