
STUDY OF THE MEASUREMENT OF LABOR PRODUCTIVITY IN
THE PALESTINIAN CONSTRUCTION INDUSTRY: THE GAZA STRIP
Eng. Zeyad Ahmed Abo Mostafa
B.Sc. Civil Engineering
Supervised by
Prof. Dr. Adnan Enshassi
Professor of Construction Engineering and Management
A Thesis Submitted in Partial Fulfillment of the Requirements for the Degree of Master
of Science in Construction Management
The Islamic University of Gaza-Palestine
December, 2003
The Islamic University-Gaza
Faculty of Engineering
Higher Education Deanship
غزة –الجامعة االسالمیة
كلیة الھندسة
عمادة الدراسات العلیا

II
بسم اهللا الرحمن الرحیم
:یقول اهللا تعالى
وقل اعملوا فسیرى اهللا عملكم و"
"رسولھ والمؤمنون
صدق اهللا العظیم

III
Dedication
To my parents and wife
for their unlimited
support
Zeyad Abo Mostafa

IV
Acknowledgments
⇒ I would like to express my deepest appreciation to my supervisor
Professor Adnan Enchassi for his professional guidance, useful advice,
continuous encouragement, and motivated support that made this thesis
possible.
⇒ Special thanks to the staff of construction management for their keen
academic supervision during my study at the Islamic university.
⇒ My best wishes to Dr. Samir Shihada, Dr. Zaher Kuhail, and Dr.
Kamalain Sha'at for their professional advice during the study.
⇒ Grateful acknowledge to workers in Sheikh Zayed township project for
their co-operation during the field study.
⇒ Grateful acknowledgment to my colleagues in Al-Zafer Group Company
for their support and encouragement.
⇒ I express my grateful thanks to all contracting companies in the Gaza
Strip who participated in filling the questionnaires and provided
valuable information for this study.
⇒ Finally I express my sincere acknowledgement to Dr. Essam Shihada for
his assistance in revising the thesis.

V
ABSTRACT
Productivity is an issue of a particular importance to the Gaza Strip projects as it is
considered a newly developed area and because of the huge amount of projects planned to be
carried out in the near future. The purpose of this research is to study "measurement of labor
productivity in the construction industry in the Gaza Strip". The main objectives of this study
are to gain understanding of the factors affecting labor productivity in buildings construction
and measuring labor productivity of block work operation in the Gaza Strip.
The objectives of this research have been achieved through a study of seventy – six
questionnaires and a case study in the Gaza Strip. The results of analysis of 45 factors
considered in the questionnaire concluded that the main factors negatively affecting labor
productivity in buildings construction are: material shortages, lack of labor experiences, lack
of labor surveillance, misunderstanding between labor and superintendents, drawings and
specifications alteration during execution, payment delay, labor disloyalty, inspection delay,
working for 7 days of the week without holiday, and tool / equipment shortages. The results
of site observations of block work operation in the case study demonstrated that average
productivity of skilled laborer in laying blocks 20 is 38.40 blocks per hour (3.07 m2/h) while
average productivity of skilled laborer in laying blocks 10 is 40.50 blocks per hour
(3.24m2/h). The findings also indicate that productive time of skilled labor is 77.01% of
working time, contributory time of skilled labor is 9.76 % of working time, and unproductive
time of skilled labor is 13.23% of working time.
The results of this study recommended that contracting companies have to conduct labor
productivity study in their projects to improve labor productivity. It is important for each
contracting company to adopt motivational or personnel management measures to boost
workers’ morale. Contracting companies are requested to use project scheduling techniques
such as computer-aided construction project management in their projects.

VI
ملخص البحث
نتاجیة للعمال فى صناعة التشیید فى قطاع غزةقیاس اإلدراسة
ارھا منطقة تطویر جدیدة ونظرا للع دد الكبی ر م ن موضوع اإلنتاجیة یمثل اھمیة خاصة للمشاریع فى قطاع غزه وذلك باعتب
الت شیید ص ناعة نتاجیة العمال ف ى أجراء ھذا البحث بغرض دراسة قیاس إتم . المشاریع المتوقع أنشائھا فى المستفبل القریب
م شاریع ف ى نتاجی ة العم ال العوام ل االساس یة الم ؤثرة عل ى إ ان االھ داف الرئی سیة لھ ذا البح ث ھ و معرف ة . فى قطاع غ زة
اس تخدم ھ ذا البح ث اس لوب . ف ى قط اع غ زةنتاجی ة العم ال ف ي بن اء الحج ر قی اس إ ف ى قط اع غ زة باإلض افة إل ى المب اني
نتاجی ة ض افة ال ي دراس ة حال ة عملی ة لقی اس إ إلاالستبیان لجمع المعلومات الخاصة بالعوامل المؤثرة على إنتاجیة العم ال با
. رالعمال في بناء الحج
ف ى االس تبیان أن العوام ل الرئی سیة الت ي ت ؤثر س لبا ع امال ت م س ردھا النتائج الخاصة بتحلی ل خم سة واربع ون لقد أوضحت
العمال أثناء العم ل م ن مراقبة ومتابعةعدم عمال وخبرة ال النقص فى المواد وقلة: على إنتاجیة العمال فى مشاریع البناء ھي
التغیی ر ف ى المواص فات و الم سئول ع ن العم ل والمھن دسم ب ین العم الالتف اھ غی اب قب ل المھن دس الم سئول ع ن العم ل و
والتأخیر فى دفع رواتب العمال و عدم شعور العامل بالوالء واألنتماء لل شركة الت ي یعم ل بھ ا وت أخر اثناء التنفیذ والخرائط
.لنقص فى عدد االالت والمعدات والعمل كل أیام األسبوع بدون أخذ یوم أجازة وابل األشرافقفحص االعمال الجاھزة من
٢٠كما أظھرت نتائج مالحظة عملیة بناء الحجر فى الحالة الدراسیة أن متوسط إنتاجیة العام ل الفن ي ف ي بن اء حج ر مق اس
ھ و ١٠ومتوسط إنتاجی ة العام ل الفن ي ف ي بن اء حج ر مق اس ) متر مربع فى الساعة٣٫٠٧( حجر فى الساعة ٣٨٫٤٠ھو
م ن % ٧٧٫٠١ لعام ل الفن ي یق ضي االنت ائج أن أی ضا أظھ رت ). الساعة متر مربع فى ٣٫٢٤( ساعة حجر فى ال ٤٠٫٥٠
% ١٣٫٢٣ فعالیات ت ساعد عل ى االنت اج و یق ضي العمل فىمن أوقات % ٩٫٧٦ فعالیات منتجة و یقضي العمل فى أوقات
. فعالیات غیر منتجةالعمل فىمن أوقات
س بل لمعرف ة قیام شركات المقاوالت بدراسة إنتاجیة العم ال ف ى جمی ع م شاریعھا ان أھم توصیات ھذا البحث ھي ضرورة
. أیضا یجب أن تقوم شركات المقاوالت بتطبی ق نظ ام ح وافز مناس ب لتحفی ز العم ال عل ى زی ادة اإلنتاجی ة . تحسین االنتاجیة
.ستخدام تقنیات جدولة المشاریع فى إدارة المشاریعألكما أن ھناك حاجة ماسة
VII
Table of contents
List of abbreviations XI
List of Tables XII
List of figures XIV
CHAPTER 1 1
Introduction 1
1.1 Construction industry background 1
1.2 The Palestinian economy 2
1.3 The construction industry in Palestine 3
1.4 Research Problem 6
1.5 Research importance 7
1.6 Research aim 8
1.7 Research objectives 8
1.8 Research boundaries 9
CHAPTER 2 10
Productivity 10
2.1 Introduction 10
2.2 Productivity – concept, and basic definition 10
2.3 Differences between Productivity and production 13
2.4 Types of productivity 13
2.4.1 Single factor productivity 13
2.4.2 Total factor productivity 15
2.4.3 Total productivity 16
2.5 Productivity variables 17
2.6 Productivity cycle 18

VIII
2.7 Construction productivity 19
2.8 Factors affecting construction productivity 19
2.8.1 Classification of productivity factors 20
2.8.2 Factors affecting construction productivity 23
2.8.3 Summary of factors affecting labor productivity 30
2.9 Productivity measurement 31
2.9.1 Time study 32
2.9.2 Activity sampling 36
2.9.3 Craftsman questionnaire 42
2.9.4 Foreman delay surveys 44
CHAPTER 3 46
Methodology 46
3.1 Introduction 46
3.2 Research design 46
3.3 Research period 48
3.4 Factors affecting productivity 48
3.4.1 Contractors' views 50
3.4.2 Defining the factors affecting labor productivity in construction
building projects in the Gaza Strip 50
3.4.3 Questionnaire design 53
3.4.4 Research population 54
3.4.5 Sample size 54
3.4.6 Sample method 55
3.4.7 Instrument validity 55
3.4.8 Pilot study 56
IX
3.4.9 Reliability analysis 57
3.4.10 Measurement scales 57
3.4.11 Data analysis 57
3.5 Labor productivity measurement 58
3.5.1 Data Collection technique 58
3.5.2 Case study 58
3.5.3 Number of observations 60
3.5.4 Activity sampling procedure 61
3.5.5 Pilot study 62
3.6 Productivity factors evaluation on construction sites 67
3.7 Study boundaries 67
CHAPTER 4 68
Results 68
4.1 Introduction 68
4.2 Factors affecting labor productivity 68
4.2.1 Study of population characteristics 68
4.2.2 Study of degree of contractors concerned in the productivity 71
4.2.3 Factors negatively affecting labor productivity 76
4.3 Labor productivity measurement 87
4.3.1 Study sample characteristic 87
4.3.2 Distributions of Block work working time 89
4.3.3 Block work skilled labor productivity 91
4.3.4 Site evaluation of factors affecting productivity 94
CHAPTER 5 99
Discussion 99

X
5.1 Introduction 99
5.2 Factors affecting labor productivity 99
5.2.1 Sample size characteristics 99
5.2.2 Degree of contractors concerned in the productivity 100
5.2.3 Factors negatively affecting labor productivity 101
5.3 Labor productivity measurement 113
5.3.1 Case study characteristics 113
5.3.2 Distributions of Block work working time 114
5.3.3 Skilled labor productivity in block work 116
5.3.4 Summary of labor productivity measurement 117
5.4 Factors affecting labor productivity of block work 118
CHAPTER 6 120
Conclusions and Recommendations 120
6.1 Conclusions 120
6.1.1 Introduction 120
6.1.2 Factors negatively affecting labor productivity in building projects 120
6.1.3 Distributions of labor working time in block work 121
6.1.4 Skilled labor productivity in block work 122
6.1.5 Factors affecting labor productivity of block work 122
6.2 Recommendations 123
6.3 Proposed additional studies 125
References 127
LIST OF ANNEXES 132
Annex 1 English Language Questionnaire 133
Annex 2 Arabic Language Questionnaire 139
XI
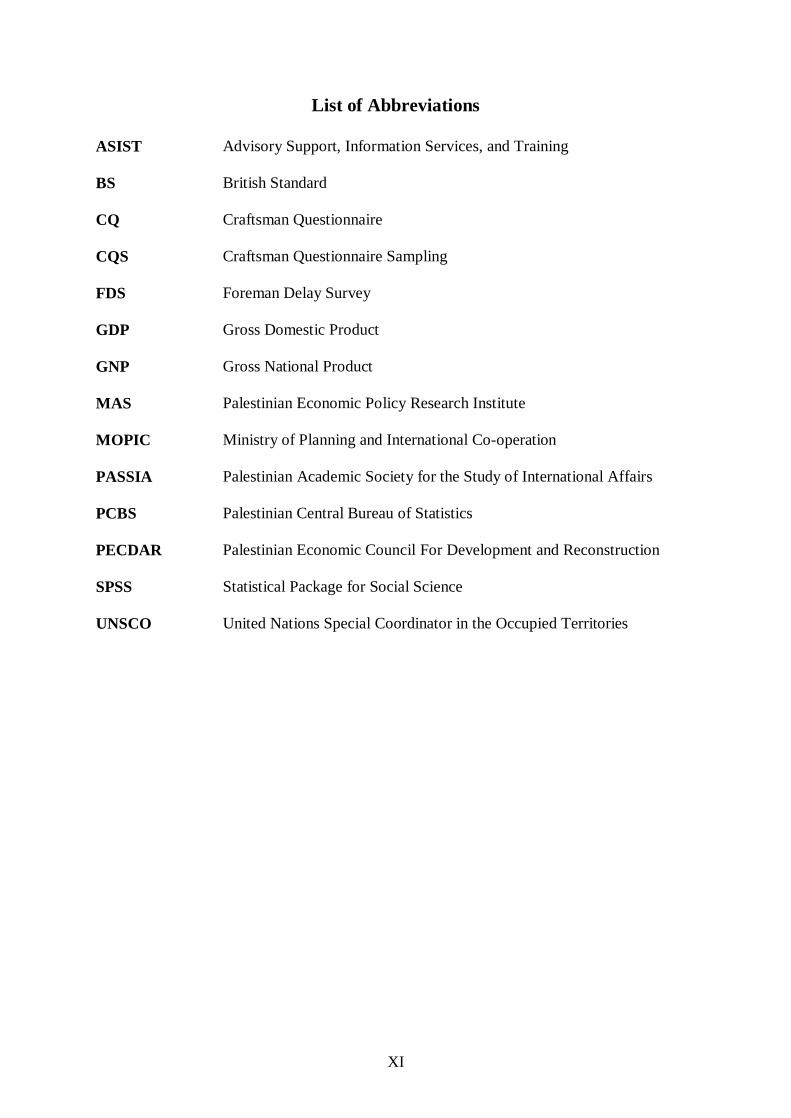
List of Abbreviations
ASIST Advisory Support, Information Services, and Training
BS British Standard
CQ Craftsman Questionnaire
CQS Craftsman Questionnaire Sampling
FDS Foreman Delay Survey
GDP Gross Domestic Product
GNP Gross National Product
MAS Palestinian Economic Policy Research Institute
MOPIC Ministry of Planning and International Co-operation
PASSIA Palestinian Academic Society for the Study of International Affairs
PCBS Palestinian Central Bureau of Statistics
PECDAR Palestinian Economic Council For Development and Reconstruction
SPSS Statistical Package for Social Science
UNSCO United Nations Special Coordinator in the Occupied Territories

XII
List of Tables
Table 1.1 Cost of construction of buildings in Palestine Territory during the year of
1999
5
Table 1.2 Cost of buildings in Palestine Territory during the year of 1999 6
Table 2.1 Chronology of important definitions of productivity 11
Table 2.2 Productivity problems rank 27
Table.3.1 Factors negatively affecting labor productivity 51
Table.3.2 Classification of sample size of the contracting companies 55
Table 3.3 Sheikh Zayed Township project data 59
Table 3.4 Sample of activity sampling study sheet 63
Table 3.5 Element codes and description 64
Table 3.6 Sample of activity sampling study summary sheet 65
Table.3.7 Block work activities 66
Table 4.1 Distribution of number and value of projects 70
Table 4.2 Methods of measuring labor productivity in contracting company 72
Table 4.3 Degree of studying reasons of decline and increase of productivity in
contracting companies
73
Table 4.4 Tools of studying reasons of decline and increase of productivity in
contracting companies
74
Table 4.5 Degree of availability of plans for developing labor productivity in
contracting companies
75
Table 4.6 Tools of productivity development plans in contracting companies 75
Table 4.7 Ranking manpower factors 76
Table 4.8 Ranking leadership factors 77
Table 4.9 Ranking motivation factors 78
XIII
Table 4.10 Ranking time factors 79
Table 4.11 Ranking materials / tools factors 80
Table 4.12 Ranking supervision factors 80
Table 4.13 Ranking project factors 81
Table 4.14 Ranking safety factors 82
Table 4.15 Ranking quality factors 83
Table 4.16 Ranking external factors 83
Table 4.17 Overall ranking of factors negatively affecting labor productivity 84
Table.4.18 Ranking factors negatively affecting productivity among groups 86
Table 4.19 Block work working hour's basic statistics 90
Table 4.20 Distributions of block work activities 91
Table 4.21 Block work skilled labor productivity statistics 92
Table 4.22 Correlation between different factors and skilled labor productivity 95
Table 4.23 Skilled labors ranking of factors negatively affecting labor
productivity
96
Table.4.24 Skilled labors ranking of factors negatively affecting productivity among
groups
98
Table 5.1 Block work operation productivity basic statistics 117

XIV
List of Figures
Figure 1.1 International compressions of construction industry share of GDP 1
Figure 1.2 Distribution of GDP by sector in Palestine 4
Figure 1.3 Labor forces employed in the Palestinian construction sector 5
Figure 2.1 Productivity cycle 18
Figure 2.2 Conceptual representation of the findings of the UN report 20
Figure 2.3 Factors model 21
Figure 2.4 Classification of construction working day 39
Figure: 2.5 Forman's delay survey questionnaire 44
Figure 3.1 Flow chart of methodology 47
Figure 4.1 Establishment year of contracting companies 68
Figure 4.2 Number of employees in contracting companies 69
Figure 4.3 Classification of respondent contractors 70
Figure 4.4 Distributions of respondent's occupation 71
Figure 4.5 Degree of labor productivity measurement in contracting companies 72
Figure 4.6 Distributions of administration title of officer who measure labor
productivity
73
Figure 4.7 Distributions of skilled labor age 88
Figure 4.8 Distributions of skilled labor experiences 88
Figure 4.9 Distributions of skilled labor education background 89
Figure 4.10 Frequency histogram of skilled labor productivity in Blocks 20 92
Figure 4.11 Frequency histogram of skilled labor productivity in Blocks 10 93
Figure 4.12 Histogram representing skilled labor productivity in hours of day 93
Figure 4.13 Histogram representing skilled labor productivity in week days 94
1
Chapter 1
Introduction
1.1 Construction industry background
There is no doubt that construction industry is a key activity in any economy; it influences,
and is influenced by the gross domestic product (GDP) of that nation (Cox et al, 1998, cited
in Madi, 2003) but construction industry share of GDP in developed countries is more than
construction industry share of GDP in developing countries (Cox et al, 1998, cited in Madi,
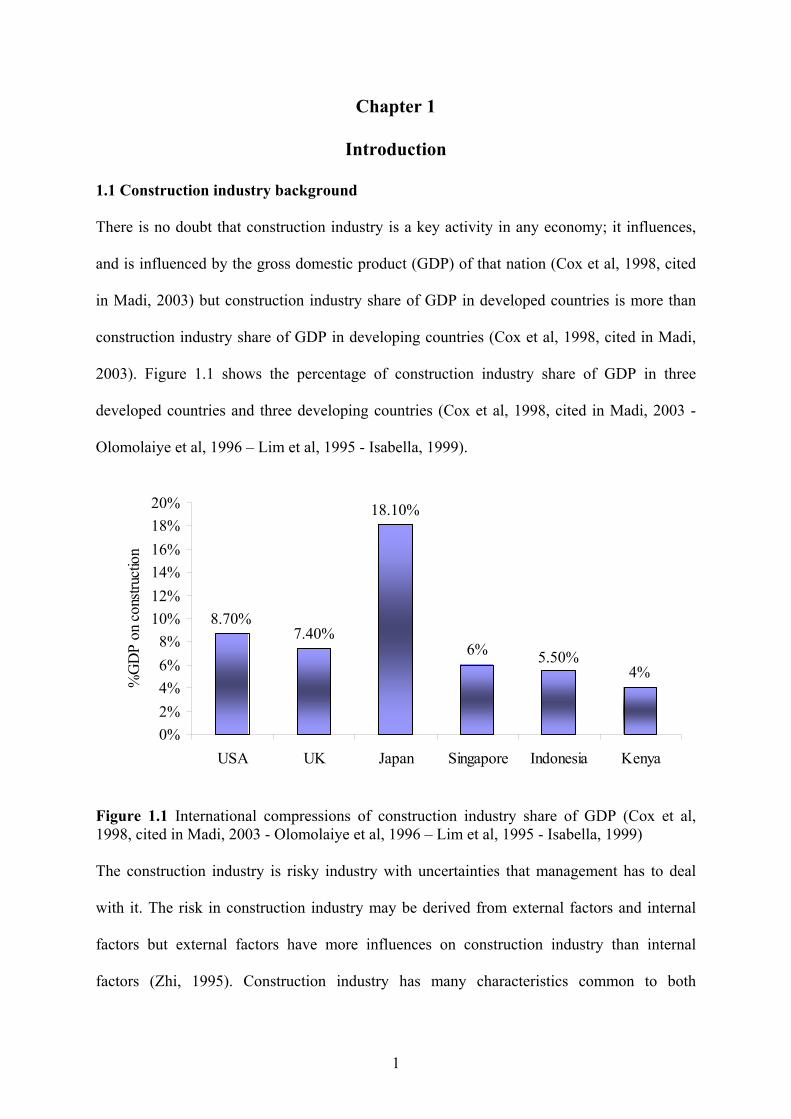
2003). Figure 1.1 shows the percentage of construction industry share of GDP in three
developed countries and three developing countries (Cox et al, 1998, cited in Madi, 2003 -
Olomolaiye et al, 1996 – Lim et al, 1995 - Isabella, 1999).
8.70%7.40%
4%5.50%6%
18.10%
0%2%4%6%8%
10%12%14%16%18%20%
USA UK Japan Singapore Indonesia Kenya
%G
DP
on c
onstr
uctio
n
Figure 1.1 International compressions of construction industry share of GDP (Cox et al, 1998, cited in Madi, 2003 - Olomolaiye et al, 1996 – Lim et al, 1995 - Isabella, 1999) The construction industry is risky industry with uncertainties that management has to deal
with it. The risk in construction industry may be derived from external factors and internal
factors but external factors have more influences on construction industry than internal
factors (Zhi, 1995). Construction industry has many characteristics common to both

2
manufacturing and service industries. These characteristics are physical products, cost, and
complexity but construction industry like service industry more than manufacturing industry
(Barrie et al, 1992). The construction industry includes residential construction, building
construction, heavy engineering construction, and industrial construction (Barrie et al, 1992).
Construction industry suffered in recent years from rapid decline in the growth of
productivity (Abdul-Kadir et al, 1995).
1.2 The Palestinian economy
The Palestinian economy may be characterized by its limited size. In 1999, GDP accounted
for approximately US $ 4.15 billion; the total population was approximately 2.8 million; and
thus GDP per capita reached approximately $1,500 (World Bank, 2000). The gross national
product (GNP) per capita was higher, around $1,800, given the large inflow of remittances
from Palestinian workers in Israel and international aid (World Bank, 2000). Using GNP or
GDP criteria, the West Bank and Gaza Strip ranks within the group of lower middle-income
countries (World Bank, 2000).
Average real monthly expenditures for seven-person households in the West Bank and Gaza
Strip in 1997 averaged US$ 750 as compared to US$ 828 in 1996 with a decline of 9.4
percent (UNSCO, 1998). The rate of inflation on consumer prices in the West Bank and Gaza
Strip was 6.1 percent in 1997. The consumer price index rose by 4.8 percent in the West
Bank, 6.9 percent in the Gaza Strip (UNSCO, 1998).
Poverty in the West Bank and Gaza Strip is estimated at 23.2 percent of the population in
1998, equivalent to about 682,000 persons. The overall poverty figures mask significant
differences between the West Bank and Gaza Strip. In 1998, the share of the Gazan
population living in poverty was 37 percent, more than twice as high as in the West Bank
where it was 15 percent (World Bank, 2001). Private investment in productive activities

3
remains low, around 14 percent of GDP in 1998, while public investment amounts to 7
percent of GDP, financed almost entirely by external assistance (World Bank, 2000).
Since 1994, over $3 billion has been disbursed under various donor programs, making the
West Bank and Gaza Strip the third largest per capita recipient of non military foreign aid in
the world after Israel and Bosnia-Herzegovina. Most foreign assistance has taken the form of
grants, and the public level of external borrowing remains low, representing only 7 percent of
GDP in 1999 (World Bank, 2000). The West Bank and Gaza Strip has no currency, and uses
mostly the New Israeli Shekel for its domestic transactions (World Bank, 2000).
Elaqsa Intifada caused steep decline in all Palestinian economic indicators. Gross national
income (GNI) in 2002 mounted to 40 percent less than in 2000 (World Bank, 2003). Also
physical damages resulting from conflict jumped from US$ 305 million at the end of 2001 to
US$ 728 million by the end of August 2002 (World Bank, 2003). Between June 2000 and
June 2002 Palestinian exports declined by 45 percent in Value (World Bank, 2003). World
Bank estimated that 21 percent of the Palestinian population was poor on the eve of the
Intifada, a number that increased to about 60 percent by December, 2002. Accounting for
population growth, the numbers of poor have tripled from 682,000 to just under 2 million
(World Bank, 2003).
1.3 The construction industry in Palestine
The construction sector in Palestine had experienced a considerable growth in the aftermath
of 1967. Its share of GDP increased from under 9 % in 1972 to over 17 % in 1985. During
that period the contribution of sector had fluctuated in an upward long run trend bounded by
9 % & 19 % from 1970 to 1980 and by 15.2 % & 23 % from 1980 to 1985 (Pecdar, 1997).
However in 1996 it appears that the contribution of the construction sector to the GDP has
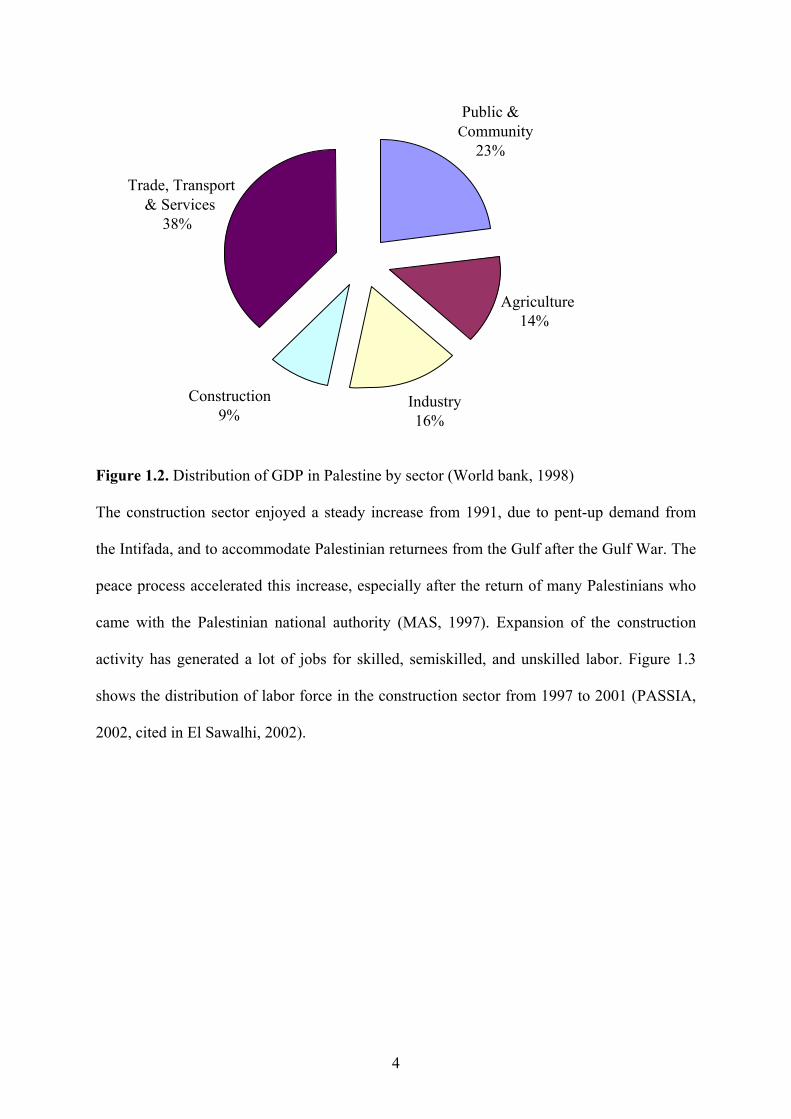
been reduced to 9 % (World bank, 1998) and in 1998 become 10.63% (PCBS, 2000). Figure
1.2 illustrates the distribution of GDP among different sectors during the year 1996.
4
Figure 1.2. Distribution of GDP in Palestine by sector (World bank, 1998)
The construction sector enjoyed a steady increase from 1991, due to pent-up demand from
the Intifada, and to accommodate Palestinian returnees from the Gulf after the Gulf War. The
peace process accelerated this increase, especially after the return of many Palestinians who
came with the Palestinian national authority (MAS, 1997). Expansion of the construction
activity has generated a lot of jobs for skilled, semiskilled, and unskilled labor. Figure 1.3
shows the distribution of labor force in the construction sector from 1997 to 2001 (PASSIA,
2002, cited in El Sawalhi, 2002).
Public & Community
23%
Agriculture14%
Industry16%
Construction 9%
Trade, Transport & Services
38%

5
Figure1.3. Labor forces employed in the Palestinian construction industry (PASSIA, 2002, cited in El Sawalhi, 2002). Building construction is one of the pioneer sectors that achieved high growth rates during last
two decades and played a crucial role in absorbing gradual injections into the Palestinian
labor force (PCBS, 2000). Table 1.1 and table1.2 show the cost of construction of buildings
in Palestinian Territory by cost item and region during the year of 1999 (PCBS, 2000).
Table 1.1. Cost of construction of buildings in Palestine Territory during the year of 1999. (Value in US$ 1000) (PCBS, 2000)
Cost Item Gaza Strip West Bank
Excavation by machinery
Workmanship
Construction materials
Workmanship + materials
Contracting companies
Licensing fees
Utilities construction fees
Others
Total
980.20
41794.60
117500.20
60080.80
23339.40
2242.20
2723.10
1438.80
250099.30
12011.60
132578.00
453381.20
93280.50
20647.20
6617.20
6174.30
2277.90
726968.20
1997-199820.09%
1999 22.30%
200019.70%
2001 15.10%
199612.60%

6
Table 1.2. Cost of buildings in Palestine Territory during the year of 1999 (Values in Million US $) (PCBS, 2000)
Item Value
A. cost of building construction by building type:
a. Building
b. Villa / House
c. Establishment
d. Others, including marginal buildings and enclosures
211.30
463.80
43.40
281.50
B. Cost of building construction by building status:
a. Completed
b. Under construction
c. Under construction and utilized but not completed
405.30
445.20
249.50
C. Cost of building construction by building utilization:
a. Residential only
b. Work only
c. Work and residential
d. Others
499.50
49.80
104.70
346.00
1.4 Research Problem
Contractors construction time and cost estimation at the time of tender is based on personal
experience whether good or poor because there are no manuals of productivity rates in the
construction industry in the Gaza Strip to estimate the required resources and time for
projects. In a number of cases it would seem as though time and cost estimates at the time of
tender is still very poor resulting in gross time and cost overrun. Very little has been done in
terms of productivity with respect to the building construction industry in the Gaza Strip. In
an effort to try and correct this situation it was found necessary to carry out a productivity

7
rate measurement study to establish productivity rates for one of the main trades in the
construction industry and study factors negatively affecting labor productivity in building
projects.
Labor Productivity rate measurement could be used in improving labor productivity in
construction sites and determines the required resources to execute the activities of the
projects and required duration to carry these activities according to specifications and time
period of the contract.
1.5 Research importance
Productivity remains an intriguing subject and a dominant issue in construction sector,
promising efficient usage of resources and cost savings and ultimately affecting the bottom
line of every effort in the construction sector (Olomolaiye et al, 1998). At the bid stage of a
project, contractors are interested in site labor productivity index in order to estimate the
likely labor cost for particular task (Gilleard, 1992). However if the contract is awarded to the
contractors, the company needs to ensure that this estimated level of productivity is achieved
or bettered. Hence the more accurate the original data, the more able the construction
manager will be to (Gilleard, 1992):
a. Determine how effectively his or her projects are being managed;
b. Detect adverse trends quickly so that corrective action may be taken quickly;
c. Determine the effects of changed methods and conditions;
d. Identify both high and low areas of productivity and reasons for this differences;
e. Compare performance between sites.
Only few studies focused on measuring productivity rate in the construction sector in the
Gaza Strip, therefore there are no reference handbooks and manuals of productivity rate in
the construction industry in the Gaza Strip to estimate the required resources and time to
control projects. In this research due to the importance of labor productivity role in

8
construction industry development, labor productivity for block work and factors that lead to
low productivity in the building construction in the Gaza Strip was be investigated to
determine the labor productivity rate in this activity and factors negatively affecting labor
productivity in the building construction.
Labor Productivity rate measurement data can be used by management for planning,
estimating, and controlling the project activities. Also Productivity rate measurement data can
be used for following management functions (Guhathakurta et al, 1993):
a. Determine the number of workers to be assigned for a task;
b. Determine the most economic method from alternatives;
c. Determine the unit rate for various operations; and
d. Provide basis for cost control.
1.6 Research aim
The aim of this research is to study measurement of labor productivity in the construction
industry in the Gaza Strip. Labor productivity formed the focal area of the study because it is
the main value adding function in the construction industry in the Gaza Strip as well as
developing countries.
1.7 Research objectives
1. Exploring the factors and their relative importance that negatively affecting labor
productivity in building projects;
2. Measuring productivity rate of skilled labor in block work operation;
3. Studying relationship between productivity of skilled labor and working hours and days
in block work operation;
4. Measuring productive time, contributory time, and unproductive time of skilled labor and
unskilled labor in block work operation;

9
5. Studying the impact of skilled labor age, skilled labor experience, skilled labor wage, and
number of skilled labor in gang on productivity of skilled labor in block work operation;
6. Evaluating and Ranking the factors that negatively affecting labor productivity of block
work operation; and
7. Providing practical suggestions and recommendations aiming to upgrade the knowledge
and improve the labor productivity in construction projects.
1.8 Research boundaries
1. Due to time limitation, this research was concerned with building construction only and did
not take into account the other categories of construction industry like heavy engineering
construction ( tunnels, bridge, dams), industrial projects (factories and workshops), and
utilities construction (sewage and water supply).
2. Research focus on labor productivity without including total factors productivity and
financial productivity.
3. Only contractors registered in the Palestinian contractors union and block work labor
working in Sheikh Zayed Township project were be involved in this study.
4. This research focus on evaluating the factors affecting labor productivity in construction
building projects, and measuring labor productivity in block work activity.

10
CHAPTER 2
Productivity
2.1 Introduction
Productivity is one of the most important issues in both developed and developing countries.
Developed countries aware that productivity is very important for economical growth and
social welfare. Developing countries which face unemployment problems, inflation, resource
scarcity and growth rate decline try to utilize its resources in such away that achieve
economical growth and improve citizens life. Productivity is one of the key measures of
utilization of human and financial resources because it is a strong indicator of efficient use of
available resources and converts it to noticeable results.
This chapter will deal with different definitions of the term productivity, types of
productivity, importance of productivity in construction industry, factors affecting labor
productivity, and measurement of labor productivity.
2.2 Productivity – concept, and basic definition
Improving productivity is a major concern of any profit oriented organization as representing
the effective and efficient conversion of resources into marketable products and determining
business profitability (Wilcox et al, 1993). Consequently considerable effort has been
directed to understanding the productivity concept, with the different approaches taken by
researchers resulting in a wide variety of definitions of productivity. Some of these
definitions are listed in a chronological order in table 2.1.

11
Table 2.1. Chronology of important definitions of productivity (Alfeld, 1988 - Lema, 1995 - Pilcher, 1997 - Gupta et al, 2000 - Oglesby, 2002)
Century Author Year Definition
19th Littre 1883 Faculty to produce.
Early 1900s Relationship between output and means employed to
produce this output.
Davis 1955 Change in product obtained for the resources used.
Fabricant 1962 Always a ratio of output to input.
Kendrick et al
1965 Functional definition of partial, total factor and total
productivity.
Siegel 1976 A family of ratios of output to input
Sumanth 1979 Total productivity - the ratio of tangible output to
tangible input.
Alfeld 1988 The ratio that relates measurements of outputs to
measurements of inputs.
Lema 1995 The ratio of outputs to inputs in a production process.
Pilcher 1997 The rate of producing i.e output divided by input.
Gupta et al 2002 The output in any productive work in relation to inputs.
20th
Oglesby et al 2002 The ability to produce an abundance or richness of
output.
Some productivity definitions also originated from special interest groups such as
economists, industrialists, trade unions and politicians. Individuals or groups have meanings
that fit their situation. For example the Organization for the European Economic Co-
operation (cited in lema, 1995) defined productivity as "a quotient obtained by dividing
output by one of the factors of production. In this way it is possible to speak of the

12
productivity of capital, investment, or raw materials according to whether output is being
considered in relation to capital, investment or raw materials etc".
Japanese National Productivity Centre (cited in lema, 1995) described productivity as follows
"Productivity is above all else, an attitude of mind. It is a mentality of progress, of constant
improvement of that which exists. It is the certainty of being able to do better today than
yesterday and less well than tomorrow. It is the will to improve the present situation, no
matter how good it may seem, no matter how good it may really be. It is a constant
adaptation of economic and social life to changing conditions; it is the continual effort to
apply new techniques to new methods; it is faith in human progress."
International Labor Office (1996) described productivity as follows "Productivity is a
comparison between how much you have put into the projects in terms of manpower,
material, machinery or tools and the result you get out of the project. Productivity has to do
with the efficiency of production. Making a site more productive means getting more output
for less cost in less time. Productivity covers every activity that goes into completing the
construction site works, from the planning stage to the final site clearing. If the contractor can
carry out these activities at lower cost in less time with fewer workers, or with less equipment
then productivity will be improved" (Andersson et al, 1996) .
From the above definitions it is concluded that productivity is generally defined as the ratio
of outputs to inputs.
Inputs
Outputs ty Productivi =
It is important to specify the inputs and outputs to be measured when calculating productivity
because there are many inputs, such as labor, materials, equipment, tools, capital, and design.
The conversion process from inputs to outputs associated with any operation is also complex,
influenced by the technology used, by many externalities such as government regulations,

13
weather, unions, economic conditions, management, and various internal environmental
components.
2.3 Differences between Productivity and production
Many people are confused between productivity and production terms. They think that the
greater the production, the greater the productivity. This is not necessarily true. Production in
any productive work denotes the outputs only without any reference to inputs. But
productivity is concerned with the effective and efficient utilization of resources (inputs) in
producing goods or services (outputs) (Gupta et al, 2000). If viewed in quantities terms,
production is quantity of outputs produced, while productivity is the ratio of the outputs
produced to the inputs used (Gupta et al, 2000).
2.4 Types of productivity
There are three types of productivity, namely single factor productivity, total factor
productivity and total productivity.
2.4.1 Single factor productivity
Single factor productivity is a ratio of outputs to one type of input (Lema, 1995). For example
labor productivity is the ratio of outputs to labor input. Similarly capital productivity is the
ratio between outputs and capital input. Single factor productivity is widely used as measures
of economic efficiency and have at least the advantages of simplicity but it suffers from a
weakness in that it does not include the total productive process and it does not adequately
deal with the impact of technological change and factor substitution (Lowe, 1987).

14
2.4.1.1 Labor productivity
Labor productivity is the most widely used yardstick of operational efficiency. This does not
imply that labor is the best input element for productivity measurement but simply reflects
the difficulty or impossibility of obtaining numerical values for the other determinants of
productivity. Thus many of the essays on productivity seem to assume that labor productivity
is the only suitable measure (Lowe, 1987). One common measure of average labor
productivity is a ratio of output per labor.
LQ ty productivilabor Average = (1)
Where Q = outputs
L = Labor employed
Labor employed (L) has to be quantified and while to take it as the number of operatives has
at least the advantages of simplicity and because it utilize statistics which are fairly easily
available (Lowe, 1987). Numerous permutations on this theme have been formulated-
outputs / operative hours, outputs / operative year, index of labor costs, etc (Lowe, 1987). In
this context average labor productivity is a measure of the labor intensity of the productive
process and does not necessarily imply anything about the efficiency of use of resources.
Labor productivity can thus be increased by substituting another factor – usually capital for
labor. This substitution may or may not result in a better use of resources and cheaper unit
costs of production. Thus for example if plant is substituted for site labor, this will improve
labor productivity. Similarly using off-site fabricated components, which involve substituting
off-site labor for on-site labor will also improve average labor productivity (Lowe, 1987).
15
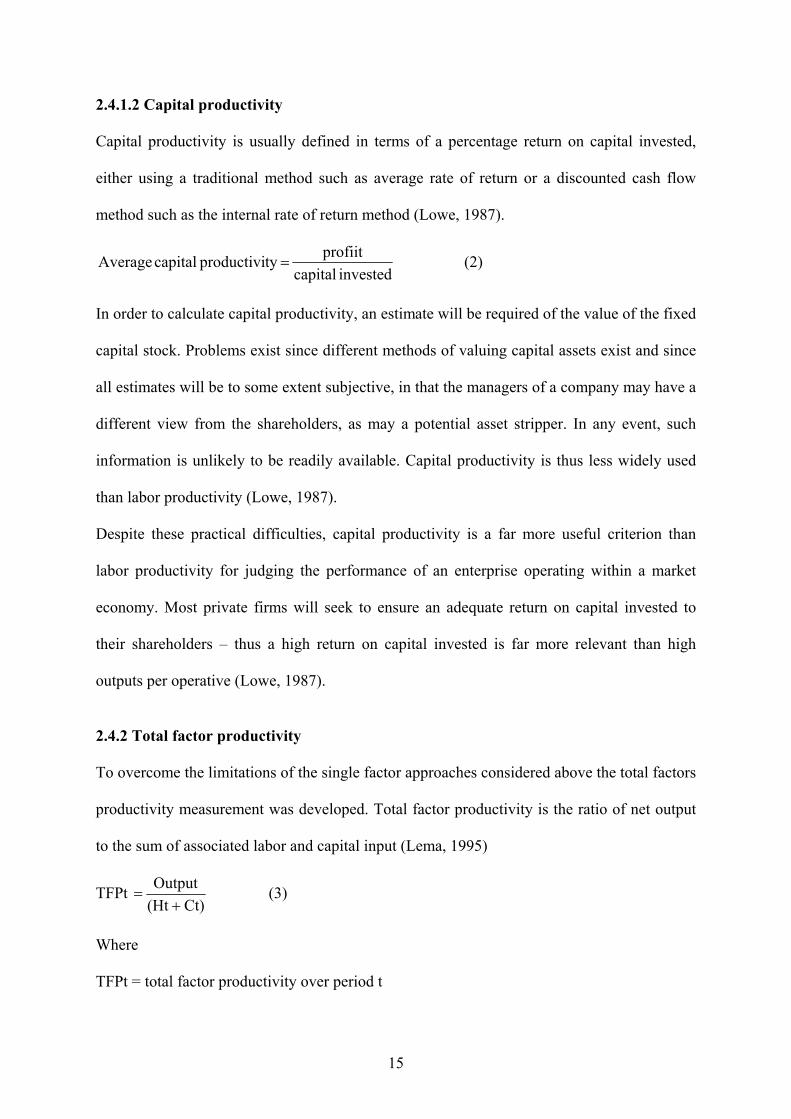
2.4.1.2 Capital productivity
Capital productivity is usually defined in terms of a percentage return on capital invested,
either using a traditional method such as average rate of return or a discounted cash flow
method such as the internal rate of return method (Lowe, 1987).
invested capitalprofiit ty productivi capital Average = (2)
In order to calculate capital productivity, an estimate will be required of the value of the fixed
capital stock. Problems exist since different methods of valuing capital assets exist and since
all estimates will be to some extent subjective, in that the managers of a company may have a
different view from the shareholders, as may a potential asset stripper. In any event, such
information is unlikely to be readily available. Capital productivity is thus less widely used
than labor productivity (Lowe, 1987).
Despite these practical difficulties, capital productivity is a far more useful criterion than
labor productivity for judging the performance of an enterprise operating within a market
economy. Most private firms will seek to ensure an adequate return on capital invested to
their shareholders – thus a high return on capital invested is far more relevant than high
outputs per operative (Lowe, 1987).
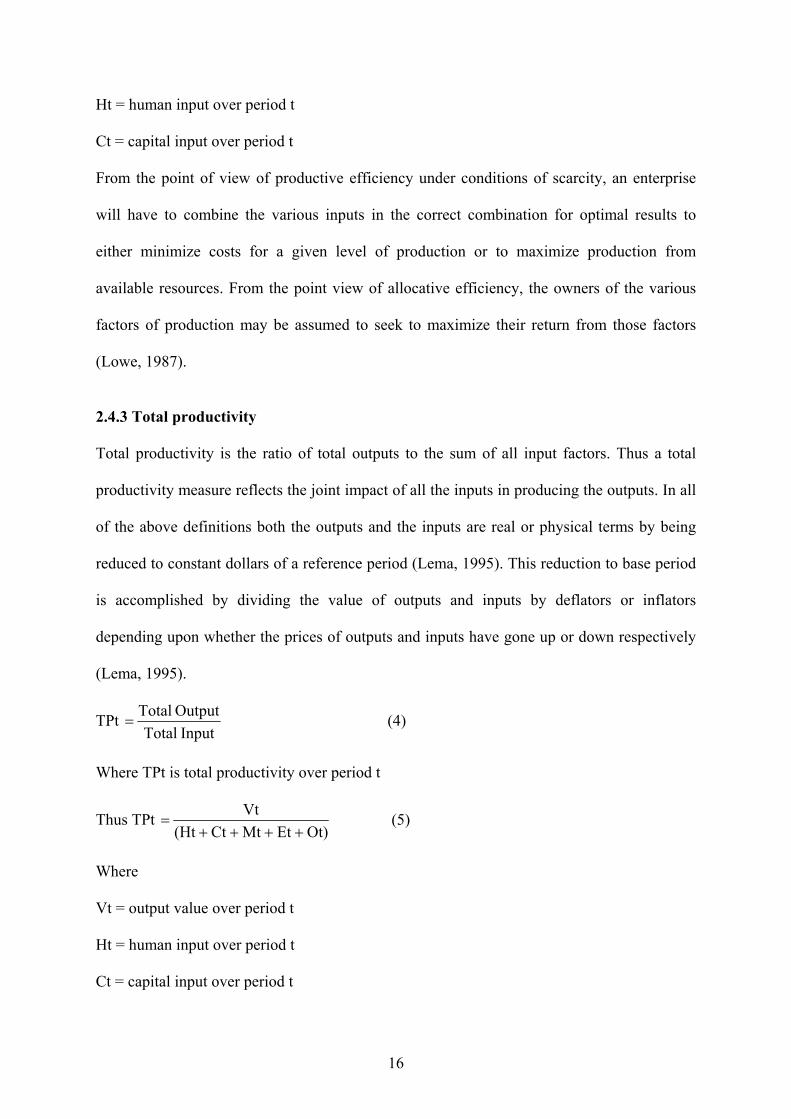
2.4.2 Total factor productivity
To overcome the limitations of the single factor approaches considered above the total factors
productivity measurement was developed. Total factor productivity is the ratio of net output
to the sum of associated labor and capital input (Lema, 1995)
TFPt Ct) (Ht
Output +
= (3)
Where
TFPt = total factor productivity over period t
16
Ht = human input over period t
Ct = capital input over period t
From the point of view of productive efficiency under conditions of scarcity, an enterprise
will have to combine the various inputs in the correct combination for optimal results to
either minimize costs for a given level of production or to maximize production from
available resources. From the point view of allocative efficiency, the owners of the various
factors of production may be assumed to seek to maximize their return from those factors
(Lowe, 1987).
2.4.3 Total productivity
Total productivity is the ratio of total outputs to the sum of all input factors. Thus a total
productivity measure reflects the joint impact of all the inputs in producing the outputs. In all
of the above definitions both the outputs and the inputs are real or physical terms by being
reduced to constant dollars of a reference period (Lema, 1995). This reduction to base period
is accomplished by dividing the value of outputs and inputs by deflators or inflators
depending upon whether the prices of outputs and inputs have gone up or down respectively
(Lema, 1995).
TPt Input Total
Output Total = (4)
Where TPt is total productivity over period t
Thus TPt Ot) Et Mt Ct (Ht
Vt ++++
= (5)
Where
Vt = output value over period t
Ht = human input over period t
Ct = capital input over period t

17
Mt = material input over period t
Et = energy input over period t
Ot = other expenses over period t.
2.5 Productivity variables
Productivity increases exist because of the management of three variables. These productivity
variables are labor, capital, and management. These three factors are critical to productivity
improvement. They represent the broad areas in which managers can take action to obtain
better productivity (Heizer et al, 1990).
A. Labor
The quality of labor is very important to improve productivity. Three traditional variables for
improved labor productivity have been (Heizer et al, 1990).
1- Basic education appropriate for an effective labor force;
2- Diet of the labor force;
3- Social overhead that makes labor available, such as transportation and sanitation.
In developing countries these three variables are very important however, in developed
nation; the critical variable is maintaining and enhancing the skill of labor.
B. Capital
Human being is a tool using animals. Capital investment provides those tools. These tools can
range from desk computers to complex machinery and new airports (Heizer et al, 1990).
Production can often be accomplished with some trade-off between labor and capital. That is,
if we want to build a road we can do so with crews of thousands using shovels or we can
invest in earth moving equipment. The trade-off between capital and labor is continually in
flux (Heizer et al, 1990).
18
C. Management
Management is a factor of production and an economic resource. It is responsible for insuring
that labor and capital are effectively used to increase productivity. The arts and sciences of
management include improvements made by technology and knowledge. Such improvement
requires training and education as well as dynamic organization (Heizer et al, 1990).
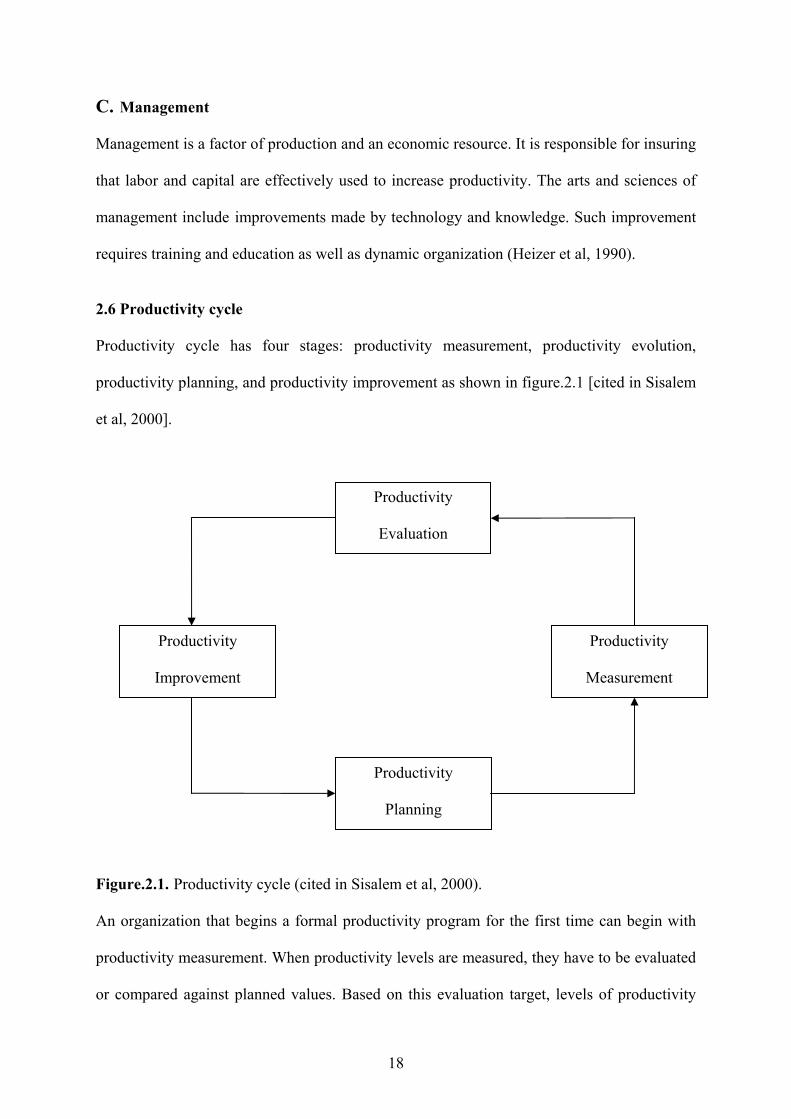
2.6 Productivity cycle
Productivity cycle has four stages: productivity measurement, productivity evolution,
productivity planning, and productivity improvement as shown in figure.2.1 [cited in Sisalem
et al, 2000].
Figure.2.1. Productivity cycle (cited in Sisalem et al, 2000).
An organization that begins a formal productivity program for the first time can begin with
productivity measurement. When productivity levels are measured, they have to be evaluated
or compared against planned values. Based on this evaluation target, levels of productivity
Productivity
Evaluation
Productivity
Measurement
Productivity
Improvement
Productivity
Planning

19
are planned on short and long terms bases. To achieve the planned targets, productivity
improvement will take place next period; productivity level must be measured again. This
cycle thus continues for as long as the productivity program operates in the organization
(Armstrong, 1988).
The productivity cycle concept shows us that productivity improvement must be preceded by
measurement, evolution, and planning. All four phases are important not just productivity
measurement or just productivity improvement. Also this cycle emphasizes the process nature
of the productivity issue. A productivity program is not one time project but rather a
continuous on going process.
2.7 Construction productivity
Construction productivity is central to the value of money obtained by construction client.
The knowledge of productivity is essential part of the construction management. The most
application of accurate productivity measurement in the area of resource management.
However productivity rates are related to many other subjects in the construction process
such as cost estimating, activities scheduling, cost control, labor resources, and payroll
(Herbsman et al, 1990). Therefore accurate determination of productivity is very important
but productivity measurement in construction is a complex issue because of the interaction of
labor, capital, materials, and equipment and varying effect of various site conditions on
productivity rates of most standard construction items.
2.8 Factors affecting construction productivity
The factors that influence construction productivity have been the subject of inquiry by many
researchers. In order to improve productivity, a study of the factors that affect it, whether
positively or negatively is necessary. Making use of the factors that have a positive effect,
and eliminating (or controlling) factors that have a negative effect will improve productivity.

20
If all factors influencing productivity are known, it would also be possible to forecast
productivity (lema, 1995). Several researchers have investigated the factors that influence
labor productivity. These include United Nations (1965), Kane et al (1980), Thomas, et al
(1991), Yates et al (1993), Lim et al (1995), lema (1995), Olomolaiye et al (1996), Heizer et
al (1996) , Olomolaiye et al (1998), Kaming, et al (1998), Teicholz (2001), Thomas et al
(2001), Wachira. (2001), Rojas et al (2003). In spite of such intensive investigations,
researchers have not agreed on a universal set of factors with significant influence on
productivity nor has there been agreement on the classifications of these factors.
2.8.1 Classification of productivity factors
There have been several approaches to the classification of the factors affecting construction
productivity can be identified. The following examples illustrate some of approaches to the
classification of productivity factors.
A United Nations (1965) (cited in Lema, 1995) report stated that, in ordinary situations, there
are two major factors affecting site labor-productivity requirements: organizational continuity
and executional continuity. Organizational continuity encompasses physical components of
work, specification requirements, design details, and so forth. Executional continuity relates
to work environment and how well a job is organized and managed. Management aspects
include weather, material and equipment availability, congestion, and out-of-sequence work.
A conceptual representation of the findings of the UN report is shown in Figure 2.2.
In p u t O u tp u t
W o rk e n vi ro nm e n t
W o rk to b e d on e
Figure 2.2. Conceptual representation of the findings of the UN report (cited in Lema, 1995).
21
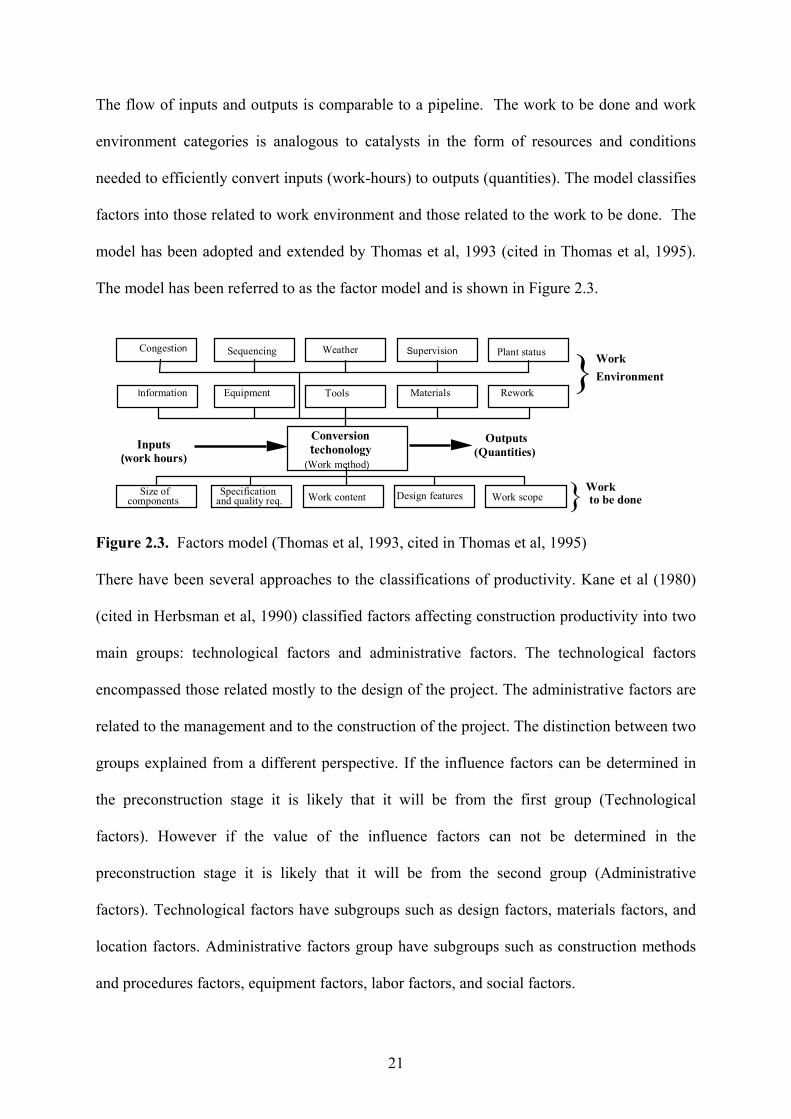
The flow of inputs and outputs is comparable to a pipeline. The work to be done and work
environment categories is analogous to catalysts in the form of resources and conditions
needed to efficiently convert inputs (work-hours) to outputs (quantities). The model classifies
factors into those related to work environment and those related to the work to be done. The
model has been adopted and extended by Thomas et al, 1993 (cited in Thomas et al, 1995).
The model has been referred to as the factor model and is shown in Figure 2.3.
Congestion Sequencing Weather Supervision Plant status
ReworkMaterialsTools EquipmentInformation
Conversion techonology
Outputs (Quantities)Inputs
(work hours) (Work method)
Size of components
Specification and quality req. Work content Design features Work scope
WorkEnvironment
Work to be done
}
}
Figure 2.3. Factors model (Thomas et al, 1993, cited in Thomas et al, 1995)
There have been several approaches to the classifications of productivity. Kane et al (1980)
(cited in Herbsman et al, 1990) classified factors affecting construction productivity into two
main groups: technological factors and administrative factors. The technological factors
encompassed those related mostly to the design of the project. The administrative factors are
related to the management and to the construction of the project. The distinction between two
groups explained from a different perspective. If the influence factors can be determined in
the preconstruction stage it is likely that it will be from the first group (Technological
factors). However if the value of the influence factors can not be determined in the
preconstruction stage it is likely that it will be from the second group (Administrative
factors). Technological factors have subgroups such as design factors, materials factors, and
location factors. Administrative factors group have subgroups such as construction methods
and procedures factors, equipment factors, labor factors, and social factors.

22
On the other hand, Heizer et al (1996) classified factors influence site productivity into three
groups: labor characteristics factors, project work conditions factors and non productive
activities.
a) Labor characteristics divided into two factors (Heizer et al, 1996):
• Age and experience of workforce; and
• Leadership and motivation of workforce.
b) Project work conditions included among other factors (Heizer et al, 1996):
• Job size and complexity;
• Job site accessibility;
• Labor availability;
• Equipment utilization;
• Contractual agreements; and
• Local climate;
• Local cultural characteristics, particularly in foreign operations.
c) Non productive activities included (Heizer et al, 1996):
• Rework for correcting unsatisfactory work;
• Temporary work stoppage due to inclement weather or material shortage;
• Absentee time, including late start and early quits; and
• Strikes.
Olomolaiye et al (1998) stated that factors affecting construction productivity are rarely
constant and may vary from country to country, from project to project, and even on the same
project depending on the circumstances. Olomolaiye et al (1998) classified factors
influencing construction productivity into two categories external and internal representing
those outside the control of the firm's management and those originating within the firm
respectively. External factors included Nature of the industry; Construction client knowledge
23
of construction procedure, weather, and level of economic development. Internal factors
included management, technology, labor, and labor unions.
2.8.2 Factors affecting construction productivity
The diversity of methodologies of quantification or evaluation of the factors makes it difficult to
compare findings. The following examples illustrate the diversity of factors.
Thomas et al (1990) (cited in Lema, 1995) studied masonry productivity similarities in seven
countries. Their study utilized the following productivity disruptive factors that were considered
to be significant:
• Materials delay or suspension of work;
• Size and organization of materials storage area;
• Materials handling and distribution;
• Materials availability;
• Tools availability;
• Interference with other crews or congestion;
• Out of sequence work or prerequisite work;
• Rework or fabrication errors;
• Accidents;
• Equipment availability; and
• Supervision and staffing.
Productivity factors have been identified by Thomas et al (1991) in their study of masonry labor
productivity comparison for various projects in seven countries. These included:
• Manpower and labor pool;
• Total quantity of a task;
• Design features;

24
• Environmental conditions and weather;
• Construction methods;
• Project organization;
• Project features;
• Management practices and control; and
• Daily diary.
Guhathakurta et al (1993) found that there is a 100 percent agreement on the five most delay
causing factors between the US and Nigeria. The factors affecting productivity was
a) Lack of material
The reasons given for this problem in US were (Borcherding et al, 1980, cited in
Guhathakurta et al, 1993):
• Lack of crane or trucks or both in transport materials;
• Too few laborers to retrieve orders from the warehouse;
• Excessive paper work necessary for requesting;
• Nonexistence of certain items at the site;
• Receival of improper materials upon delivery to the work area; and
• Lack of proper planning by supervisors.
The reasons given for this problem in Nigeria were (Olomolaiye et al, 1987, cited in
Guhathakurta et al, 1993):
• Cash flow problems experienced by contractors;
• Lack of proper planning; and
• Site transporting difficulties.
b) Lack of proper tools
The major's causes for this problem in both US and Nigeria were (Borcherding et al, 1980,
Olomolaiye et al, 1987, cited in Guhathakurta et al, 1993):
25
• Poor quality tools;
• Improper maintenance; and
• Insufficient tools.
c) Repeat work
The major's causes for this problem in both US and Nigeria were (Yates et al, 1993):
• Change orders;
• Poor quality of engineering drawings; and
• Poor instructions as results of misinterpretation of drawings and instructions.
d) Inspection delays
A considerable number of artisans both in the US and Nigeria blamed supervisors
incompetence and inspection delay as contributing to low productivity.
Lim et al (1995) conducted a survey of top civil engineering and building contractors in
Singapore to identify the problems that could affect construction productivity. They found
that the most important issues affecting productivity are:
• Difficulty in the recruitment of supervisors;
• Difficulty in the recruitment of workers;
• A high rate of labor turn over;
• Absenteeism at work site; and
• Communication problems with foreign workers.
Lema (1995) studied factors affecting labor productivity in Tanzanian building construction.
The investigation demonstrated that Key productivity factors affecting productivity are:
• Financial incentives;
• Wages;
• Other non-financial incentives;
• Level of skill;
26
• Level of mechanization; and
• Quality of leadership on site.
Andersson et al (1996) reported that the common reasons for low productivity in construction
sites are:
• Supervisors looking after too many;
• Dissatisfied workers with a perceived grievance (for example low pay);
• Very heavy work on a hot day;
• Waiting for materials;
• Waiting for tools;
• Waiting for instruction;
• Machine breakdown;
• Waiting for another worker to finish so they can follow on (poor site layout);
• Working in a confined space and getting in each others way; and
• Working gangs are out of balance (e.g. too many laborers to one mason);
Olomolaiye et al (1996) investigated the problems influencing craftsmen's productivity on 27
large construction sites in Indonesia. Findings showed that problems affecting craftsmen
productivity in Indonesia are:
a) Lack of material
The causes of this problem were (Olomolaiye et al, 1996):
• On site transportation difficulties;
• Excessive paper works for request ;
• Improper material shortage; and
• Inadequate planning.
b) Rework
The causes of this problem were (Olomolaiye et al, 1996):
27
• Design change; and
• Poor instruction.
c) Absenteeism
The causes for quitting the job were (Olomolaiye et al, 1996):
• No enough work site;
• Better pay from other projects; and
• Better working environment on other site.
d) Interference
Interference between gangs and workers was caused by (Olomolaiye et al, 1996):
• Mismanagement of the work sequence; and
• Unbalanced gang sizes.
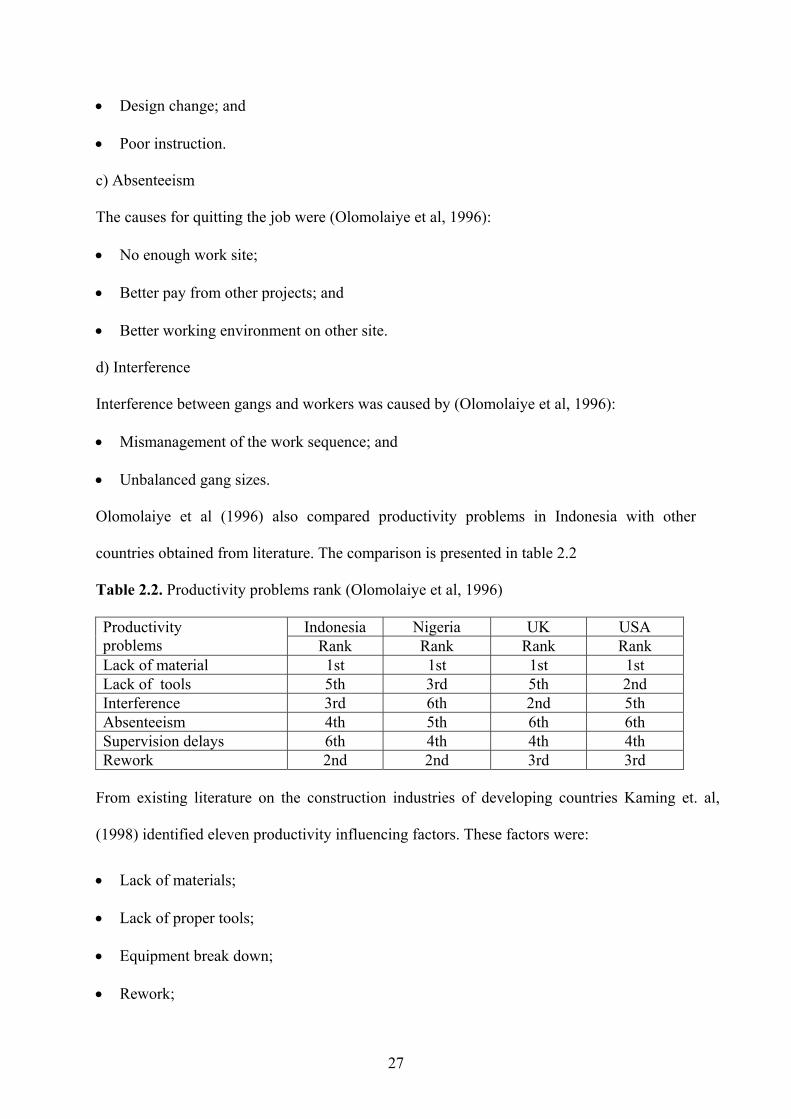
Olomolaiye et al (1996) also compared productivity problems in Indonesia with other
countries obtained from literature. The comparison is presented in table 2.2
Table 2.2. Productivity problems rank (Olomolaiye et al, 1996)
Indonesia Nigeria UK USA Productivity problems Rank Rank Rank Rank Lack of material 1st 1st 1st 1st Lack of tools 5th 3rd 5th 2nd Interference 3rd 6th 2nd 5th Absenteeism 4th 5th 6th 6th Supervision delays 6th 4th 4th 4th Rework 2nd 2nd 3rd 3rd
From existing literature on the construction industries of developing countries Kaming et. al,
(1998) identified eleven productivity influencing factors. These factors were:
• Lack of materials;
• Lack of proper tools;
• Equipment break down;
• Rework;
28
• Change crew members;
• Workers interference;
• Workers absenteeism;
• Supervision delay;
• Overcrowding;
• Changing Forman; and
• Working overtime.
ASIST information services (1998) reported that labor productivity might be affected by many
factors which are fortunately under the control of the project management. These factors were:
• Experience of the workforce;
• Motivation;
• Organization of the work;
• Type and condition of tools and equipment; and
• Continual monitoring of performance.
Enchassi et al (2000) studied the relationship between the effectiveness of construction manager
style and workforce productivity in Palestine and United State of America. The results of study
showed that there is a significant positive relation between the effectiveness of construction
managers and the level of workforce productivity.
Teicholz (2001) mentioned that possible causes of declining of labor productivity in US
construction sector from 1970 to 1998 include:
• Inadequate training of workers;
• Fewer younger workers entering the workforce;
• Increased complexity of projects;
• More safety procedure;
• Greater time pressure on project completion; and

29
• Greater fragmentation of the work process.
Thomas et al (2001) studied the effect of workforce management quality on labor productivity of
concrete formwork in four highway bridge construction projects. The results of study indicated
that inefficient workforce management accounts for an average of almost 65% of the total
inefficient work hours in these projects. The workforce errors observed in these projects were:
• Overstaffing;
• Interference with other crews; and
• No alternative work assigned.
Wachira (2001) listed the following factors that influence labor productivity of construction
sector in Kenya:
• Unfair wages;
• Recruitment of unskilled personnel;
• Poor communication;
• Late deliveries of materials and equipment;
• Poor welfare facilities;
• Lack of motivation;
• Lack of training; and
• Lack of investment in research and development.
Rojas et al (2003) studied many factors which affects labor productivity in construction
sector in United State of America. The results of study indicated that management systems
and strategies and manpower issues were the two areas with greatest potential to affect labor
productivity.
a) Important management systems and strategies issues were (Rojas et al, 2003):
• Management skills;
• Work scheduling; and
30
• Materials & Equipment management.
b) Important manpower issues were (Rojas et al, 2003):
• Labor experience;
• Activity training;
• Education; and
• Motivation.
2.8.3 Summary of factors affecting labor productivity
It is clear from the above that factors affecting construction productivity are both numerous
and diverse. It is nevertheless not exhaustive. It would be unreasonable to assume that it is
possible to quantify the effect of each on productivity in a predictable manner since what may
be significant in one environment, may be insignificant in another situation. Nevertheless,
the literature provides a pool of factors that may be considered for productivity studies. The
following is a summary of factors that have been identified in literature
• Lack of materials in local market;
• Worker absenteeism at work site;
• Using motivation system;
• Lack of tools;
• Delays in materials deliveries to working site;
• Labor skill;
• Area of work site;
• Gang size;
• Disruption of power/ water supplies;
• Rework;
• Interference;

31
• Supervisors absenteeism;
• Climate conditions;
• Accidents;
• Management practices;
• Labor age;
• Safety; and
• Job size and complexity.
2.9 Productivity measurement
Productivity measurement at project and crew levels has both immediate and long-term
objectives. Schedule control, cost control, target setting, and motivating the workforce are
some of the short term objectives. Employees need productivity data as a feedback on their
performance and may be used for pay bargaining. The same actions will lead to the provision
of a performance database for planning and evaluating performance at this level.
Performance at this level provides management with information that can influence their
strategic actions (lema, 1995).
There are two different techniques of generating labor productivity standards, accountancy-
based and engineering-based method. Accountancy based standards rely on the analysis of
historical accounting data to establish work hour requirements for specific type of work
whilst Engineering-based standards involve breaking down complex work processes into
small manageable parts and analyzing these parts for the length of time required to complete
these processes (Gilleard, 1992). There are four productivity measurement methods often
used for measuring labor productivity in construction projects. These methods are time study,
activity sampling, craftsman questionnaire, and forman delay survey.

32
2.9.1 Time study
Time study was the fundamental approach to productivity improvement introduced by Taylor
and Gilbreth in the late 19th and early 20th centuries, and it is the principle technique of work
measurement even today (Olomolaiye et al, 1998) . Time study is used to determine the time
required by a qualified and well-trained persons working at normal pace to do a specified task
(Barnes, 1980). Time study therefore involves (Pilcher, 1997, Olomolaiye et al, 1998):
• Familiarization with the work to be studied;
• Timing to discover how long various operations are taking;
• Rating to assess the worker being observed against a norm;
• Building up of time standards by allowing for appropriate relaxation and contingency
allowances.
Time study provides an analytical basis for budgeting and controlling human resource costs.
It can be an important aid to increase productivity by providing standards against which
performance can be planned, monitored and improved ((Armstrong, 1990).
2.9.1.1 Time study equipment
The equipment required to measure and record output information consists of a stop watch,
study board and pre-prepared time study sheets, supplemented by a hand calculator, tape
measure, micrometer, etc. depending upon the type of work (Harris et al, 1995). The stop
watch may take several forms. The simplest type, with one hand is not recommended since it
can accumulate an appreciable error if the watch is stopped and read at the end of each cycle
element (Olomolaiye et al, 1998). The popular type has a large hand which completes one
minute per revolution and is graduated in hundredths of a minute while the small hand
records cumulative time up to 30 minutes in one minute graduations. A fly back mechanism
on the large hand allows the timing of elements to start at zero for each element without
affecting the elapsed time shown on the small hand (Harris et al, 1995).
33
2.9.1.2 Rating
Because the objective of the time study is to obtain a realistic time for the element, the time
study observer must additionally make a judgment on the effective rate of working of the
subject under observation since the elapsed time observed for one worker my be different
from another doing an identical task (Harris et al, 1995). British Standard (BS) 3138 defines
rating (cited in Olomolaiye et al, 1998) as "to assess the workers rate of working relative to
the observer's concept of the rate corresponding to standard rating". Thus in addition to
timing the observer should also assess the rate of working for each time element. To do this
accurately the time study practitioner must have correct concept of standard rating, which
comes only from practical experience and training in judging different speeds of movement,
effort, consistency, and dexterity (Olomolaiye et al, 1998). The B.S. divided rating scale in 4
point graduations (Cited in Harris et al, 1995) as follows:
125: Very quick; high skill; highly motivated.
100: Brisk; qualified skill; motivated.
75: Not fast; average skill; disinterested.
50: Very slow; unskilled; unmotivated.
There are different Factors affecting the rating. These factors can be summarized as follows
(Olomolaiye et al, 1998):
• Effectiveness. This implies application of correct and effective methods, the good signs
being correct choice of tools, shortest path of movement, adherence to the best method,
avoidance of unnecessary activities, tidiness and systematic arrangement of tools and
materials;
• Skill. Sureness of touch or sequence, intelligent application of movements and events,
effective use of both hands and so on; and

34
• Speed. This implies diligence, steadiness and continuity; the good signs being rhythm,
speed of movement, steady effort, making the job look easy.
2.9.1.3 Basic time
Basic time is the time in which an element would be completed if it had been undertaken at a
standard rating. It can be calculated as follow (Pilcher, 1997):
The basic or normal time for a job rating Standard
rating Observed* timeObserved =
2.9.1.4 Relaxation allowances
During a time study it is usual to exclude any elements of relaxation so that the basic time is
not affected by the degree of relaxation enjoyed by any individual worker. Relaxation
allowance consists of two components (Pilcher, 1997). One is an allowance for the personal
needs of worker such as an occasional stretch, a visit to the toilet, and having a drink of
water; the other is an allowance for fatigue. Both allowances are normally made by adding a
percentage to the basic time. Allowance for the personal needs of worker can be assessed
with a reasonable degree of accuracy but allowance for fatigue is very difficult to assess but
many companies and industries make their own recommendations (Olomolaiye et al, 1998).
2.9.1.5 Contingency allowance
In addition to relaxation allowances a further amount is added to the basic time to cover
contingencies. The following contingencies are typical and can either be added as a
percentage to the basic time or as absolute time itself (Harris et al, 1995):
1. Adjustment and maintenance of tools;
2. Waiting time caused by subcontractors, machine breakdowns, lack of materials, etc;
3. Unexpected site conditions, e.g. bad ground, high winds, and bad weather;
4. Learning time;
35
5. One-off tasks; and
6. Design changes.
2.9.1.6 Standard time
Standard time is the proper time required for a qualified worker working at standard rating to
complete a task. If this is achieved then the worker is considered to have achieved standard
performance (Olomolaiye et al, 1998). BS 3138 defines standard performance as follows
(Olomolaiye, 1998 - Harris, 1995): "The rate of output which qualified workers will naturally
achieve without over exertion as an average over the working day or shift provided they are
motivated to apply themselves to their work".
Thus standard time = basic time + relaxation allowances + contingency allowance
Because construction work is so variable the difference between standard time and basic time
for a job can be quite large and as a consequence, most records or data banks of out times are
kept as basic times, with the user applying suitable contingencies as necessary (Harris et al,
1995).
2.9.1.7 Number of observations
The correct sample size is difficult to determine accurately but the simplest method is to plot
the cumulative average basic time, preferably for a short cycle element against the number of
observations. When the line begins to stabilize, sufficient number of observations has
probably been taken (Olomolaiye et al, 1998).
2.9.1.8 Time study procedure
Time study procedure can be summarized as follows (Barnes, 1980):
1. Determine the objective of the study and select the operation to be observed;
2. Divide the operation into elements;
3. Select the time study method and equipment to be used;

36
4. Make a sketch of the piece and of the work place;
5. Secure the cooperation of the workers to be observed and their Forman; and
6. Record as much detail about work as possible.
When the study is completed, check to make certain that sufficient number of observations
have been taken.
2.9.1.9 Limitation of time studies
The main difficulty in using time study techniques for labor productivity studies in
developing countries is the lack of work-study experiences not only in construction but also
in manufacturing (Lema, 1995). Other difficulties in using time study techniques can be
summarized as follows (Olomolaiye et al, 1998):
• The number of workers studied by one observer is limited which requires employment of
several observers making manual study prohibitively expensive;
• The information obtained by time studies is limited to the times recorded and facts that
can be interpreted from the observers notes which may not cover sufficient details such as
interdependencies among components, exact reasons for taking longer or shorter
elemental times. These will increase the variability and reduce accuracy; and
• The data cannot be assembled quickly especially in civil engineering where the variables
on site complicate the interpretation of information as the relaxation and contingency
allowances needed often considerably exceed the required basic time.
2.9.2. Activity sampling
Activity sampling is a technique through which information can be obtained not only quickly
and economically but also to predetermine levels of accuracy (Olomolaiye et al, 1998). It is a
method that measures the time labor spent in various categories of activities (Thomas et al,
1991). Activity sampling is also known as (Lema, 1995):

37
• Ratio survey;
• Observation ratio;
• Snap reading method;
• Random observation method; and
• Work sampling.
Activity sampling can be defined as a technique in which a large number of instantaneous
observations are made over a period of time of workers, machines, or processes. Each
observation records what is happening at that instant and the percentage of observations
recorded for a particular activity or delay is a measure of the percentage of time during which
that activity or delay occurs (Thomas et al, 1986). Activity sampling study provides the
necessary information to help determine how time is being employed by the workforce,
identify the problem area that cause the work delay, and set up a base line measure for
productivity improvement (Thomas et al, 1986). The main advantage of using activity
sampling is that it allows a larger number of machines or men to be studied at one time that
can be managed using a continuous time study. This leads to a broader picture of the
efficiency of a particular operation than that obtained from a more concentrated but
continuous study on a smaller group (Pilcher, 1997).
There are general rules for activity sampling should be observed in sampling construction
such as (Oglesby et al, 2002):
a) The observer must be able quickly to identify the individuals to be included in and
excluded from the sampling;
b) There should be an equal likelihood of observing every worker;
c) Observation must have no sequential relationship;
d) The basic characteristics of the work situation must remain the same while the
observations are being made.

38
2.9.2.1 Activity sampling theory
Activity sampling concepts based on two facts, first fact is a working day can be subdivided
into three major parts: productive, contributory, and unproductive time (Oglesby et al, 2002);
Productive time: time spent in elements directly involved in the actual process of putting
together or adding to a unit being constructed;
Contributory time: time spent in elements not directly added to but essential to finish the unit;
Unproductive time: idle time or time spent in not useful or all other elements.
Second fact on which activity sampling based is small number of chance occurrences tends to
form the same distribution pattern as the whole operation. Thus it is a mathematical technique
closely associated with statistics and the theory of probability (Olomolaiye et al, 1998).
Activity sampling being based on a sample of observations must adhere to certain statistical
principles and rules to obtain a proper representation of the studied operation. Any sampling
carried out should be large enough to be statistically valid – can be used to predict the
characteristics of studied operation with a desirable degree of accuracy.
The following formula can be used to calculate the required sample size and achieve the
specified confidence level and accuracy criteria (Currie, 1987 - Harris et al, 1995 – Lema,
1995 - Pilcher, 1997 - Olomolaiye et al, 1998).
N =2L
P) - (1 P 2Z ×× (6)
Where:
N = number of observations required;
P = proportion of the total operation being observed;
L = limit (in percentage) of accuracy required; and
Z = standard normal variable depending on the level of confidence.

39
In construction work, it is generally accepted that 95 percent confidence limits with limit of
error of ±5 percent give satisfactory results that can assist in making a real contribution to
increase effectiveness (Lema, 1995 - Pilcher, 1997 - Olomolaiye et al, 1998). Also The value
of proportion of the total operation being observed, for construction work usually falls within
the limits of 0.40 to 0.6 (Lema, 1995 - Pilcher, 1997 - Olomolaiye et al). For construction
work, 384 observations are normally accepted as a minimum satisfactory number of
observations which allow statistically significant results to be obtained (Pilcher, 1997 -
Oglesby et al, 2002).
In practice, other time classifications may be of interest in an activity sampling study. An
example of how the construction working day could be broken down along with illustrating
some of the classifications is shown in Figure 2.5 (Olomolaiye, 1988, cited in Lema, 1995).
W O R K ING D AY
A B SE N C E T IM E A T T E N D A N C E T IM E
SU PE R V ISIO N T IM E
B RE A K T IM E RE ST IN G T IM E IN ST RUC T IO NT IM E
IN SPE C T IO N T IM E
U N PR O D U C T IV E T IM E PR O D U C T IV E T IM E
U N R E L AT E D W OR KS
W AIT IN G T IM E ID LE T IM E
IN T E R N A L D E L AY S
E X T E R N A L D E L AY S
W O R K IN G T IM E
APP O R T ION E D W OR K
AN C IL L AR Y W O R K
E X T R A R E L AX AT ION
E AR LY Q U IT SL AT E ST AR T S
O FFIC IA L R E L A X A T IO N T IM E
Figure 2.5. Classification of construction working day (Olomolaiye, 1988, cited in Lema, 1995)

40
2.9.2.2 Activity sampling procedure
Activity sampling procedure can be summarized as follows (Lema, 1995 – Harris et al,
1995):
1) Determine the objective of the study and select the activity to be observed;
2) In terms of chosen confidence level and accuracy range, determine N (the number of
observations needed);
3) Identify the workers by name and list the operations and tasks to be studied;
4) Prepare a suitable observation sheet for recording the information;
5) Prepare a planned time table of observation times;
6) Choose a suitable position for taking the observations;
7) Record each activity that is in operation at the instant it is observed together with the
worker involved; and
8) Summarize and analyze the results.
2.9.2.3 Activity sampling as a work measurement tool - the dilemma
Strictly, activity sampling is not a labor productivity measurement technique, but a labor
activity measurement technique as suggested in the definition. Oglesby et al (2002) stated
that activity sampling is a technique for quantifying the time spent by construction or
maintenance labor in certain predetermined categories and provides valuable information on
areas of low activity and the objective of establishing the level of activity is to enable
identification of opportunities for increasing productivity through better utilization of time
but activity rate is not synonymous with productivity and a person who looks busy may not
necessarily be productive. When activity sampling is used to quantify output, it is a
productivity measurement tool.
Several studies have been performed on the basic assumption that a decrease in unproductive
time in the construction process has an influence on productivity (Thomas et al, 1982;

41
Thomas et al, 1984 - Liou et al, 1986 - Price 1986). Some models suggested that by using
labor activity rate, labor productivity predictions could be made through work sampling
(Handa et al 1989 - Liou, 1984 and Liou et al 1986). This relationship seems logical
although arguments against it have been pointed out in recent studies (Thomas 1991).
Thomas (1991) examined data from 159 work-sampling studies from more than 30 nuclear
power plants constructed between 1973 and 1985 in USA. These studies were conducted in
the form of general site wide tours. Direct work was established on the basis of these tours.
The study concluded that there was a very weak correlation between direct work and labor
productivity. This can be taken to imply that:
1. Productivity cannot be predicted by activity rate; and
2. Improved labor utilization, through better productive time, would not necessarily result in
increased productivity.
These two arguments, first advanced by Thomas (1991) and later adopted by various other
researchers have probably diminished the value of activity sampling as a work measurement
tool in construction. A careful examination of work done by Thomas (1991) revealed that
methodology used in this work is illogical because the productivity definitions adopted were
unconventional. Productivity was expressed in form of a performance factor (PF) defined as
the ratio between the estimated and the actual unit rate (work hours per unit). In other words,
estimated output in work hours per unit was divided by achieved output to obtain
productivity. Firstly, uniformity in the estimated output across all the thirty projects has to be
ensured because two similar outputs from different projects could result in two different
performance factors depending on the estimate. For example, an actual output of say one
hour per unit will result in a performance factor of 120 percent and 80 percent for an
estimated output of 1.2 hours per unit and 0.8 hour per unit respectively. It is unlikely that all

42
the thirty projects had the same estimate given that they were constructed over a period of 13
years and most likely by different contractors.
Horner (1992) (cited in Lema, 1995) argued that because activity sampling represents a
snapshot of the work process, it fails to distinguish between unproductive time arising out of
long and short delays. He asserted that productivity was adversely affected by interruptions
longer than 15 minutes, while interruptions shorter than 15 minutes have no such effect. He
concluded that the percentage of time spent at work determined from activity sampling
studies couldn’t therefore be used as a surrogate for productivity. Despite the dilemma,
activity sampling is still a powerful tool in establishing labor utilization on sites when the
scope of work is narrowly defined.
2.9.3 Craftsman questionnaire
Craftsman questionnaire (CQ) used to investigate the problems that adversely affect workers
productivity and motivation. The questionnaire usually requires craftsmen to estimate loss of
time due to various causes, ranking the severity of the problems and provide potential
solutions to productivity problems (Olomolaiye et al, 1998). The questions that are usually
asked in this questionnaire are specific for each job site and each craft. The areas that might
be covered in this questionnaire are (Oglesby et al, 2002):
• Craft area, type of work;
• Materials: availability, suitability, and conditions;
• Tool: availability, and conditions;
• Equipment: availability, and conditions;
• Rework: amount, and why necessary;
• Crew interferences: with what craft and reason;
• Causes of Overcrowded work areas;
• Availability of instructions and other information: what is missing and why;

43
• Inspection: reasonableness and whether or not done at proper time; and
• Hours per week lost from each of the above causes, by category
The questionnaire can be simple requiring only 15 minutes of an employee's time or longer
and in depth, which takes 45 minutes or more (Oglesby et al, 2002). Careful planning,
organizing, and implementation of questionnaire are required. Furthermore information
gathered should be effectively analyzed (Olomolaiye et al, 1998).
Another approach to CQ has been called craftsman questionnaire sampling (CQS) whereby a
sample of workers selected and interviewers question them about an activity in which they
were engaged. These questions will cover the same topics as those of the CQ just described
(Oglesby et al, 2002). The procedure of CQS is very similar to activity sampling; the CQS
administrator tours the site and randomly selects workers and supervisors by sight. The
selected workers are then asked whether they were engaged in productive or unproductive
work at that time when they were chosen and the detailed causes of unproductive work by
completing a simple questionnaire (Olomolaiye et al, 1998).
More accurate and revealing information about production problems gathered by CQ and
CQS since information collected directly from the workers and not through the normal
channels of communications, where information can be lost or manipulated for the benefit of
either the sender or the receiver but CQ and CQS have disadvantages such as (Olomolaiye et
al, 1998):
1. Delay time estimate in the CQ and CQS are usually requested as number of hours lost per
week and hence are subject to under or over estimating, casting doubt on the validity of the
estimates; and
2. It does not provide information about the efficiency of construction methods or the
competence of the workforce.

44
2.9.4 Foreman delay surveys
Foreman delay survey (FDS) is one such method whereby production problems are exposed
by foreman's through the identification of causes and quantification of delays in the daily
routine of their workforce (Olomolaiye et al, 1998). The primary purpose of this technique is
to highlight problems that are outside the responsibility and control of individual foreman
(Oglesby et al, 2002). Figure 2.6 shows a typical FDS form for a single crew (Alfeld, 1988 -
Oglesby et al, 2002).
Date: ---------------------------
Number in crew: ---------------
General Foreman: -------------------
Foreman's name: --------------------
Problems causing delay
Man hours lost
Problems causing delay Numbers
of hours *
Numbers
of workers = Labor hours
Changes / redo (design error or change) -------- * -------- = --------
Changes / redo (prefabrication error) -------- * -------- = --------
Changes / redo (field error or damage) -------- * -------- = --------
Waiting for materials -------- * -------- = --------
Waiting for tools -------- * -------- = --------
Waiting for construction equipment -------- * -------- = --------
construction equipment breakdown -------- * -------- = --------
Waiting for information -------- * -------- = --------
Waiting for other crews -------- * -------- = --------
Waiting for fellow crew members -------- * -------- = --------
Others: ----------------------------------- -------- * -------- = --------
----------------------------------------- -------- * -------- = --------
Comments: --------------------------------------------------------------------------------------------------
----------------------------------------------------------------------------------------------------------------
-------------------------------------------------------------------------------------------------------
Figure: 2.5. Forman's delay survey questionnaire (Alfeld, 1988 - Oglesby et al, 2002)

45
Depending on circumstance FDS can be conducted in several ways such as daily, with
weekly reporting, daily for several weeks, or as needed (Oglesby et al, 2002). The results of
FDS will show the major causes of work delay for each craft and the number of hours lost
and by correlating the reported lost time with the causes of delays, project management can
take action to resolve the problems and to eliminate the delays (Alfeld, 1988). The survey is
widely used because it is simple and foreman can complete the form in a few minutes but the
potential weakness of this technique is found in the survey reliance on gross estimates by
foreman of how much time they actually lose and hence there is doubt on its validity (Alfeld,
1988).

46
CHAPTER 3
Methodology
3.1 Introduction The preceding chapter described, in detail, the concept of productivity and argued that for full
understanding of productivity, total productivity should be studied. However, construction
industry research has not yet advanced sufficiently to be able to achieve this, and that partial
productivity measures are generally used, the most common of which is labor productivity.
Furthermore, a detailed literature review was performed that culminated in identifying four
productivity measurement methods and labor productivity factors.
In this chapter, a description of data collection procedure adopted for this research is
described. A detailed methodology and tools used are described.
3.2 Research design
The term "research design" refers to the plan or organization of scientific investigation,
designing or a research study involves the development of a plan or strategy that will guide
the collection and analyses of data (Polit et al, 1999, cited in Madi, 2003). Research design is
an action plan for getting from "here" to "there", where "here" may be defined as the initial
set of questions to be answered, and "there" is some set of conclusion (answers) about the
questions (Naoum, 1998). The research design is the logical sequence that connects the
empirical data produced by research to the study's initial research questions and ultimately to
its conclusions (yin, 1989, cited in El Sawalhi, 2002). One of the principal purposes of the
design is to help avoid the situation in which the collected data does not address the initial
research questions (Robson, 1993, cited in El Sawalhi, 2002). Site observations and
structured questionnaire had been used in this research. Research sequence can be presented
simply by the chart indicated in figure 3.1.
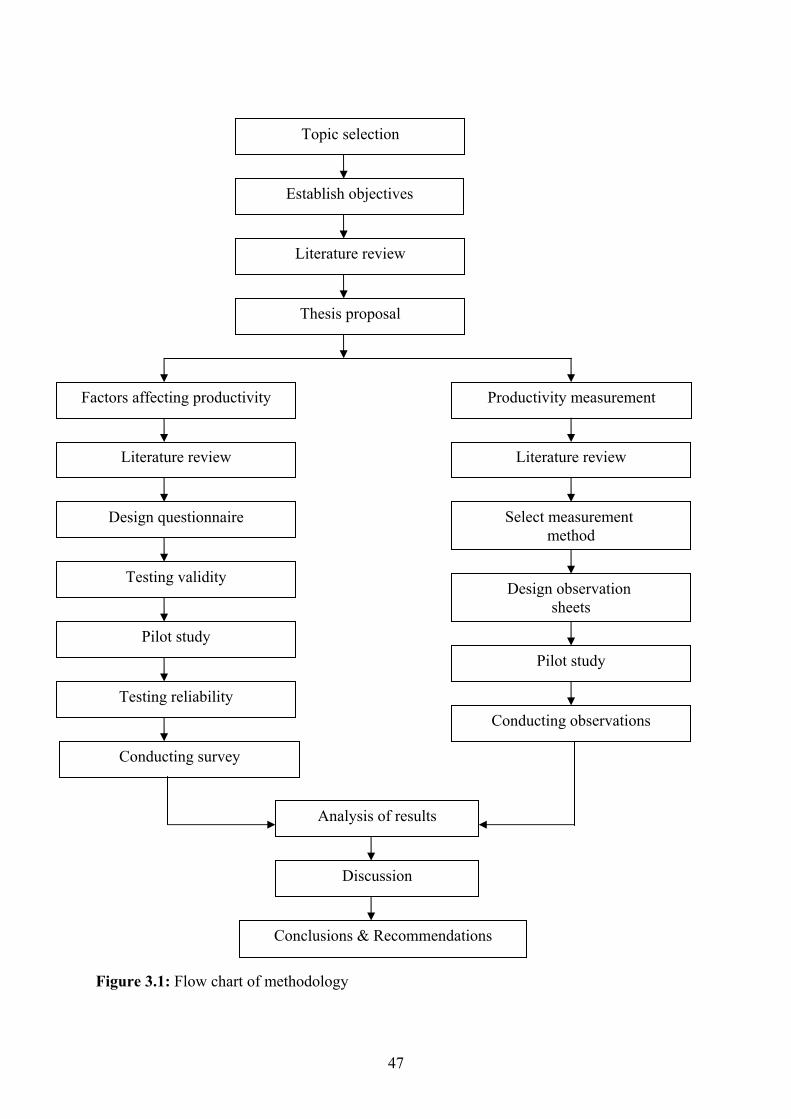
47
Figure 3.1: Flow chart of methodology
Topic selection
Establish objectives
Literature review
Thesis proposal
Factors affecting productivity
Literature review
Productivity measurement
Design questionnaire Select measurement method
Testing validity Design observation
sheets
Pilot study
Testing reliability
Pilot study
Conducting observations
Literature review
Conducting survey
Analysis of results
Discussion
Conclusions & Recommendations
48
3.3 Research period
This research started on 1st of November 2002 when the initial proposal was approved. The
literature review was completed on 20 March 2003. Observation method selection,
observation sheets design, questionnaire building, validity testing and piloting completed on
1st of May 2003. The collection of data started on 1st of May 2003 and completed on 15th of
July 2003. Preparing results, analysis, conclusions and recommendations were ready in
November 2003.
3.4 Factors affecting productivity
A literature review of factors that affect labor productivity revealed a long list of factors as
shown in Chapter 2. The list included the following factors (Kane et al (1980), Thomas et al
(1991), Guhathakurta et al (1993), Lim et al (1995), lema (1995), Olomolaiye et al (1996),
Heizer et al (1996), Olomolaiye et al (1998), Kaming et al (1998), Teicholz (2001), Thomas
et al (2001), Wachira (2001), Rojas et al (2003)):
1. Material shortages;
2. Tool shortages;
3. Crew motivation;
4. Labor skill;
5. Labor age;
6. Gang composition;
7. Workers relation;
8. Crew superintendent relation;
9. Labor absenteeism;
10. Job dissatisfaction;
11. Leadership characteristics;
12. Supervisors absenteeism;

49
13. Inspection delays;
14. Dispute with owner;
15. Acceleration of the work;
16. Rework;
17. Interference;
18. Extent of training;
19. Payment;
20. Overtime;
21. Working in confined space;
22. Methods of employment (direct work versus subcontracting);
23. Project feature;
24. Construction method;
25. Specification and design requirements;
26. Weather and environmental effects;
27. Safety;
28. Government regulations; and
29. Economics development.
These factors were related to studies performed in independent and stable countries and their
applicability in the Gaza Strip environment could not be taken for granted. Indeed, some of the
factors that may not be considered significant in these countries may have a profound influence
on workers productivity in the Gaza Strip. Identification of the relevant factors in the Gaza Strip
construction industry was therefore performed by asking ten building contractors to suggest
factors which in their opinion affect labor productivity in the Gaza Strip construction industry.

50
3.4.1 Contractors' views
All of interviewed contractors were of the opinion that motivation and payment influence
labor productivity. Seven interviewed contractors stated that material shortages, tool and
equipment shortages, labor experiences, misunderstanding between Workers,
misunderstanding between workers and superintendents, psychological status of worker,
work surveillance, and overtime affect labor productivity. Five interviewed contractors
believe that work planning, extent of training, safety, and weather affect labor productivity.
Only two interviewed contractors agreed that labor age, gang size, worker loyalty, project
feature, construction method, specification and design requirements, raw materials quality,
quality of required work, evaluate problems facing works and resolve it, and height of
working place affect labor productivity. The factors collected from literature and contractors
formed the basis of questionnaire with the objective of rating the factors on the basis of the
extent of influence on labor productivity.
3.4.2 Defining the factors affecting labor productivity in construction building projects in
the Gaza Strip
A thorough literature review was conducted to identify factors which affect labor productivity as
recognized by researchers and practitioners in this field. Combining this literature review with
results of interviews of contractors sample, the factors negatively affect labor productivity were
identified. They are categorized into 10 groups. Each group includes number of factors as shown
in table 3.1.
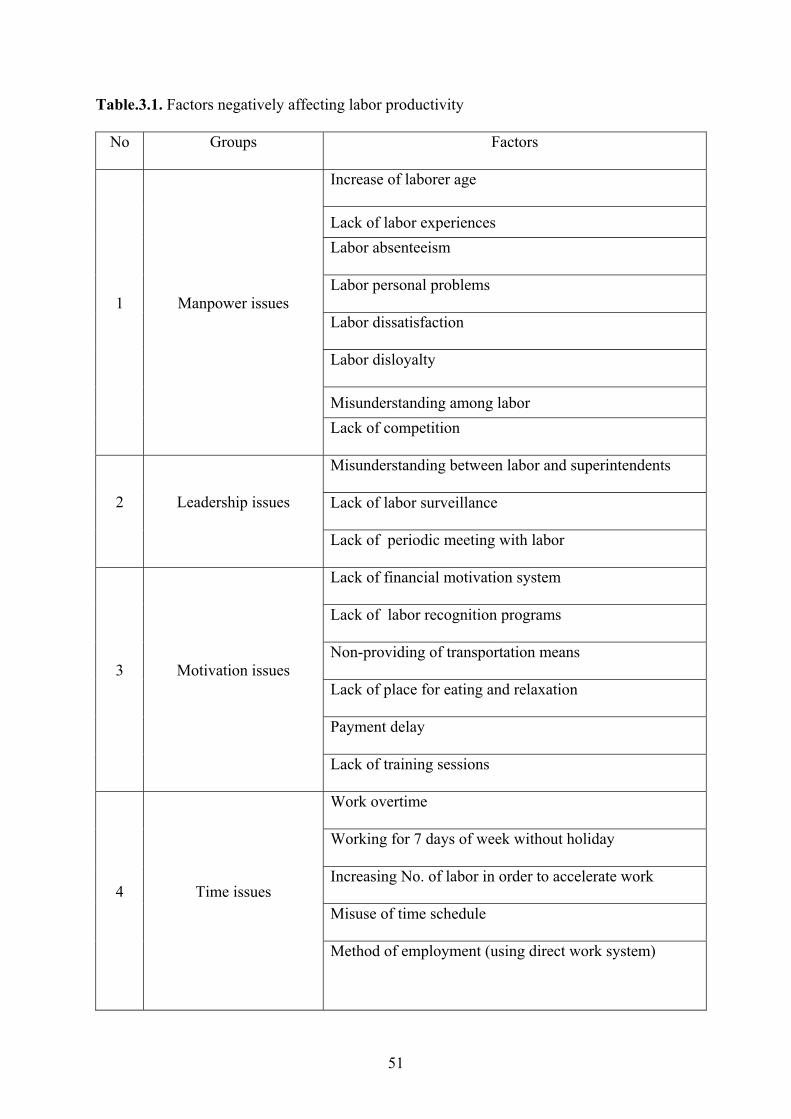
51
Table.3.1. Factors negatively affecting labor productivity
No Groups Factors
Increase of laborer age
Lack of labor experiences Labor absenteeism
Labor personal problems
Labor dissatisfaction
Labor disloyalty
Misunderstanding among labor
1 Manpower issues
Lack of competition
Misunderstanding between labor and superintendents
Lack of labor surveillance 2 Leadership issues
Lack of periodic meeting with labor
Lack of financial motivation system
Lack of labor recognition programs
Non-providing of transportation means
Lack of place for eating and relaxation
Payment delay
3 Motivation issues
Lack of training sessions
Work overtime
Working for 7 days of week without holiday
Increasing No. of labor in order to accelerate work
Misuse of time schedule 4 Time issues
Method of employment (using direct work system)

52
Material shortages
Unsuitability of materials storage location 5 Materials / Tools issues
Tool and equipment shortages
Rework
Supervisors absenteeism
Inspection delay 6 Supervision issues
Drawings and specifications alteration during execution
Type of activities in the project Construction method Interference
7 Project issues
Working in confined space
Violation of safety precautions
Accidents
Unemployment of safety officer in construction site
Working at high places
Bad ventilation
Insufficient lighting
8 Safety issues
Noise
Low quality of raw materials
High quality of required work 9 Quality issues
Inefficiency of equipment
Weather changes
10 External issues Augmentation of Government regulations related to the
construction sector
53
3.4.3 Questionnaire design
According to the review of literature related to the concern subject and after interviewing
sample of contractors. A well designed questionnaire was developed with mainly closed
ended questions. The questionnaire was built from three sections that cover the main
questions of the study. The first section is related to the company profile and it includes 7
questions about companies' name, year of establishment, degree of classification, number of
permanent employees, number of executed projects during the last five years, and average
value of executed projects per year during the last five years. Second section related to extent
of importance of productivity topic in construction companies and it includes questions about
productivity measurement, studying reasons of growth and decline of labor productivity, and
availability of productivity development plans. Third section related to factors negatively
affecting labor productivity. It includes 10 groups of factors such as manpower issues,
leadership issues, motivation issues, time issues, materials / tools issues, supervision issues,
project issues, safety issues, quality issues, and external issues. The original questionnaire
was developed in English language. English language questionnaire is attached in (Annex 1)
Due to the researcher believes that questionnaire would be much effective and easier to be
understood and to get more realistic results, the questionnaire was translated to the Arabic
language and the Arabic language questionnaire is attached in (Annex 2). Unnecessary
personal data, complex and duplicated questions were avoided. In each questionnaire, an
explanatory letter was attached to explain the way of responding, the aim of the study and the
security of the information.
A draft questionnaire was designed with the help of supervisor. This draft was discussed with
a group of specialists. They advised some changes such as modifying the wording of some
questions in section two and three. Some of them recommended adding questions in section
three such as labor dissatisfaction and disloyalty. Some of them also recommended changing

54
the answer options in questions of section two from two options to five options. Other
changes were also made after the pilot study to clarify confusion and ambiguity reported by
the pilot study subjects.
3.4.4 Research population
The studied population includes contractors who have a valid registration by the Contractors
Union in buildings specialization in Gaza Strip. The total number of contractors who have
valid registration under first, second and third category are 105 companies. The first class has
41 companies, the second class has 47 companies, and the third class has 17 companies.
3.4.5 Sample size
A systematic random sample to ensure a representative sample of all contractors was
selected. Sample size calculated using formula 7 and formula 8 (Hogg et al, 1997 - Amer,
2002)
2P*) - (1 *P 2Zm
ε
××= (7)
N1- m 1
m n +
= (8)
Where
m = sample size of unlimited population
n = sample size of limited population
Z = value (e.g. 1.96 for 95 % confidence level)
P* = Degree of variance between the elements of population (0.5)
ε = maximum error of the point estimate
385 384.16 2(0.5)
0.5) -(1 0.5 2(1.96) m ==××
=

55
83 82.67
1051- 385 1
385 n ==+
=
To insure good representation of each stratum, the percentage of representation within strata
was calculated as shown in table 3.2.
Table.3.2: Classification of sample size of the contracting companies
Class No of Companies
(buildings specialization)
% of the Whole
population
No. needed from
the sample size
First 41 39 % 33
Second 47 45% 37
Third 17 16 % 13
3.4.6 Sample method
The samples were selected randomly from each level of three contractor's categories. The
contractor's union list is ordered by the company number, three lists of contractors were
prepared to represent the first, second, and third categories. The randomly selection among
three lists was done by the researcher using non-replacement random selection. 33, 37, and
13 companies were selected from first, second, and third lists respectively to represent the
total sample size.
3.4.7 Instrument validity
To establish quality of any research, the researcher must deal with the validity problem. The
validity of an instrument is defined as "an integrated evaluative judgment of the degree to
which empirical evidence and theoretical rational support the adequacy of inferences and
actions based on test scores or other models of measurement" (Abu Kumboze, 2002, cited in
Al-Ghuraiz, 2002). To improve validity, questions should be worded to increase the
56
likelihood that they will mean the same thing to each respondent. Also interviewing the
respondents during the pilot studies enable to determine where questions were unclear or
misleading (Noliske, 1995, Cited in El Sawalhi, 2002). Five experts in the field of the labor
productivity were chosen to evaluate the study instrument. Each of them has full information
about the research objectives, the scale of evaluation etc. The experts have been requested to
rate the content relevance of each item using a 4 point rate. The adopted scale 1 = not
relevant, 2 = not relevant unless major change, 3 = relevant after doing minor change, 4 =
relevant (Abul kumboze, 2002, Cited in El Sawalhi, 2002). The accepted item should take at
least four points from five. Some items were added, modified, or deleted.
3.4.8 Pilot study
All questionnaires should initially be piloted; completed by a small sample of respondents
(Fellows et al, 1997). The pilot study was conducted before the start of data collection to test
response rate, size of effect, validity and suitability of questionnaire as well as areas of
ambiguity. A pilot study provides a trial run for the questionnaire, which involves testing the
wording of questions, identifying ambiguous questions, testing the techniques that used to
collect data and measuring the effectiveness of standard invitation to respondents (Naoum,
1998). Six forms were distributed to sample of six contractors as a survey pretest. The chosen
sample was invited to participate in the piloting so they received an explanation about the
study and had been asked to complete the questionnaire. Some of them asked questions about
the explanation of certain items. By the end, discussion with study sample about the meaning
of questions took place to ensure the validity and reliability of questionnaire. The pretest
shows the need to modify wording of some questions, and delete some irrelative questions. A
number of phraseology changes were made to make it more understandable. This pretest was
useful to fit and cope precisely with the aim of the questionnaire.

57
3.4.9 Reliability analysis
Reliability concerns the consistency of a measure (Fellows et al, 1997). A question is reliable
if it evokes consistent response (that is, a person would answer the questions the same way in
the subsequent interviews). One cause of unreliable response is ambiguous wording of the
questions (El Sawalhi, 2002). To compute the reliability of the questionnaire instrument, a
random sample of five respondents was taken from population. These respondents were
asked to fill the questionnaire in the beginning of May, 2003, and then they were asked to fill
it again after two weeks. Reliability analysis was done by using test - retest analysis through
SPSS program. The result shows that reliability of the instrument equals 0.89, which is
acceptable for such instrument.
3.4.10 Measurement scales
The most popular scales are nominal scale and ordinal scale. Nominal scale is nominal
numbering implies belonging to a classification. Ordinal scale is a ranking of a rating data
that normally uses integers in ascending or descending order. The numbers assigned to the
agreement scale (5, 4, 3, 2, 1) do not indicate that the interval between the scales are equal,
nor they indicate absolute quantities (Naoum, 1998). They are merely numerical labels. This
study used ordinal scale.
3.4.11 Data analysis
For analyzing data using ordinal scale, an importance index (I) was used. The importance
index was computed using the following equation (Lim et al, 1995).
Importance index = 100 * n5) n4 n3 n2 (n1 5
n1 n2 2 3n3 4n4 5n5++++++++ (9)
Where
n1 = number of respondents who answered "little effect"
n2 = number of respondents who answered "some effect"

58
n3= number of respondents who answered "average effect"
n4 = number of respondents who answered "high effect"
n5 = number of respondents who answered "very high effect"
The importance index ( I ) for all factors had been calculated. The indexes had been ranked.
The group index had been calculated by taking the average of factors in each group.
3.5 Labor productivity measurement
The study aimed at collecting information on: average output per labor hour, labor productive
time, labor contributory time, and labor unproductive time for block work operation. To
achieve these objectives the following data collection procedure had been used.
3.5.1 Data Collection technique The preceding chapter described in some detail four techniques of measuring labor
productivity. These techniques are time study, activity sampling, craftsman questionnaire,
and foreman questionnaire. The researcher decided to use activity sampling, because this
technique has the following advantages (Lema, 1995):
1. Observation skills required in this technique are not as demanding as those required to
accomplish similar objectives using other techniques such as time study;
2. It provides information on the extent of labor utilization on construction sites;
3. It is possible to identify in detail the sub-activities involved in the production process; and
4. It is possible to attach statistically quantifiable inferences to the results of the study.
3.5.2 Case study
Data collected from construction sites of Sheikh Zayed Township project through
observations. Sheikh Zayed Township project includes construction of 70 five-storey
buildings, twelve-storey building, mosque, school, shops, and two water reservoirs. It

59
includes also the construction of infrastructure works for the aforementioned Township. The
project data reported in table 3.3.
Table 3.3. Sheikh Zayed Township project data
Project Name Construction of Sheikh Zeyad Township
Funded by Abu Dhabi Fund for Development
Consultant DIWI Consult International
Main contractors Consolidated Contractors Company
Subcontractor Al-Zafer Group for Investment & Development
Beneficiary Ministry of Housing
Budget 55345000 US Dollars
Duration 24 calendar months
Contract start date 1 / 2 /2001
Contract completion data 6 / 3 / 2003
There are 14 Block laying Gangs working in this project. A decision was made then to base
initial studies in Sheikh Zayed Township project for a number of reasons:
• Sheikh Zayed Township project is the largest construction project in the Gaza Strip with a
larger proportion of construction activities in comparison to any other location in the
Gaza Strip;
• It was easier to obtain sites where productivity observation was conducted due to personal
contacts;
• Amount of work is very large therefore there is continuity in construction activities;
• Data collection in one centre would facilitate comparison by limiting the number of
variables.
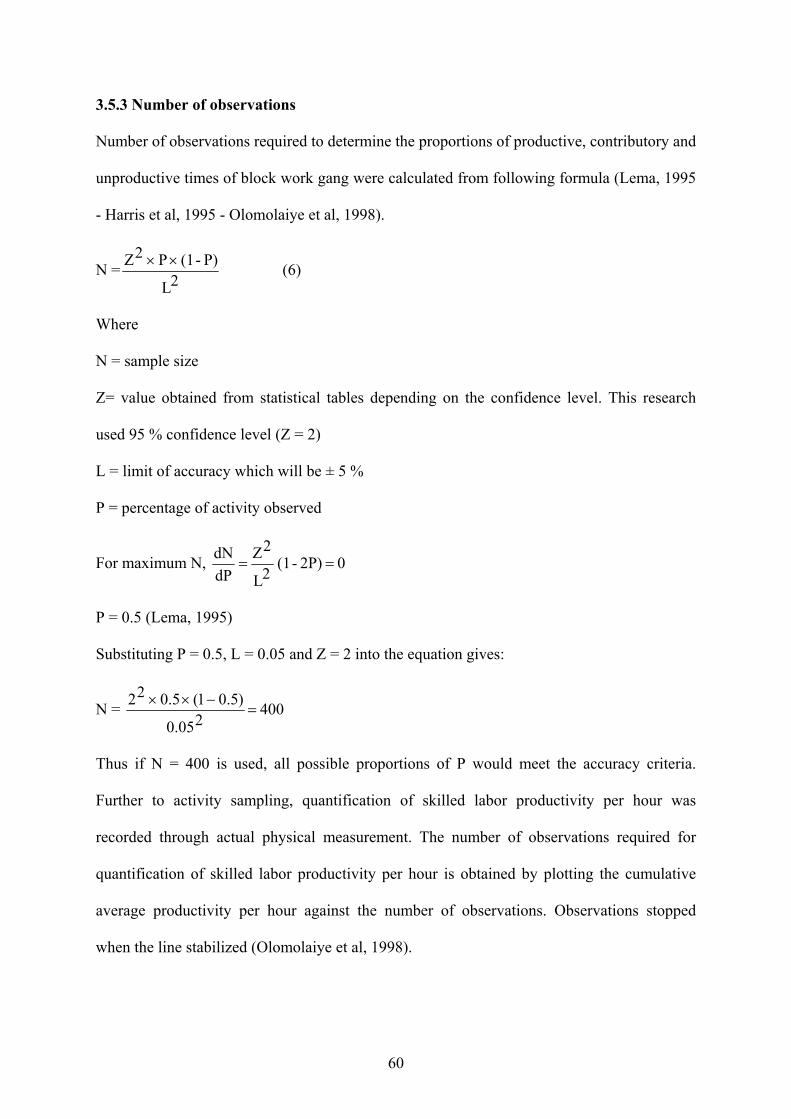
60
3.5.3 Number of observations
Number of observations required to determine the proportions of productive, contributory and
unproductive times of block work gang were calculated from following formula (Lema, 1995
- Harris et al, 1995 - Olomolaiye et al, 1998).
N =2L
P) - (1 P 2Z ×× (6)
Where
N = sample size
Z= value obtained from statistical tables depending on the confidence level. This research
used 95 % confidence level (Z = 2)
L = limit of accuracy which will be ± 5 %
P = percentage of activity observed
For maximum N, 0 2P) - (1 2L
2Z dPdN
==
P = 0.5 (Lema, 1995)
Substituting P = 0.5, L = 0.05 and Z = 2 into the equation gives:
N = 400 205.0
)5.01(5.022=
−××
Thus if N = 400 is used, all possible proportions of P would meet the accuracy criteria.
Further to activity sampling, quantification of skilled labor productivity per hour was
recorded through actual physical measurement. The number of observations required for
quantification of skilled labor productivity per hour is obtained by plotting the cumulative
average productivity per hour against the number of observations. Observations stopped
when the line stabilized (Olomolaiye et al, 1998).
61
3.5.4 Activity sampling procedure
The following procedure was adopted for conducting the field study to meet the research
objectives:
1. Construction sites were visited and ongoing activities were identified in consultation with
site staff;
2. Individuals to be included in the sample were identified ;
3. The block work operation was broken down into three groups of elements, namely
productive, contributory, and unproductive activities (Oglesby et al, 2002);
a) Productive elements: elements directly involved in the actual process of putting
together or adding to a unit being constructed (Oglesby et al, 2002);
b) Contributory elements: elements not directly adding to but essential to finishing the
unit (Oglesby et al, 2002);
c) Unproductive elements: not useful or idle or all other elements (Oglesby et al, 2002);
4. An appropriate study sheet with random observation intervals equal 5 minutes was designed
(Currie, 1987 - Lema, 1995 - Harris et al, 1995 - Plicher, 1997 - Olomolaiye et al, 1998). A
sample of the study sheet is presented in table 3.4, 3.5;
1. Before starting the actual observation, the following was ensured:
• All persons involved in the activity were clearly identified and their specific
roles were defined; and
• Work completed prior to the start of the study was noted as accurately as
possible. This enabled an accurate assessment of work accomplished during
the observation interval;
2. Observations were made at pre-identified times. At any instantaneous observation, a
record was made of the sub-activity being performed by each of the workers. A sample
of observation record is included in table 3.4, 3.5;

62
7. An accurate physical measure of the work accomplished per hour was recorded;
8. Additional information such as labor age, labor experience, method of payment, general
level of supervision, tools and equipment used, gang sizes, and general site conditions were
recorded;
9. The data were summarized in a separate sheet at the end of each observation period. A
sample summary sheet is presented in Table 3.6.
3.5.5. Pilot study
The main purpose of pilot study is to make sure that the identified activity elements are
sufficient to record all the activities involved in the operation being studied, and modify it if
necessary (Olomolaiye et al, 1998). Forty five observations had been carried for three block
work gangs. The pilot study shows the need to modify and merge some other elements. The
final classification of productive, contributory, and unproductive activities is shown in table
3. 7.

63
Table 3.4. Sample of activity sampling study sheet (Currie, 1987 - Lema, 1995 - Harris et al, 1995 - Plicher, 1997 - Olomolaiye et al, 1998)
ISLAMIC UNIVERSITY Labor Productivity Measurement Research
Data Collection Sheet
1. Project Title: .............................................................................................................. 2. Activity:.................................................. 3. Location:............................................. 4. Day :................................................... 4. Time :............................................ 6. Skilled labor numbers :……… 5. Unskilled labor numbers :……
No Time A B C D E F Notes 1 9:00 2 9:05 3 9:10 4 9:15 5 9:20 6 9:25 7 9:30 8 9:35 9 9:40 10 9:45 11 9:50 13 9:55 14 10:00 15 10:05 16 10:10 17 10:15 18 10:20 19 10:25 20 10:30 21 10:35 22 10:40 23 10:45 24 10:50 25 10:55
General Notes:
8-9 9-10 10-11 11-12 12-13 13-14 14-15 15-16 16-17 Productivity Q T Q T Q T Q T Q T Q T Q T Q T Q T
A B C
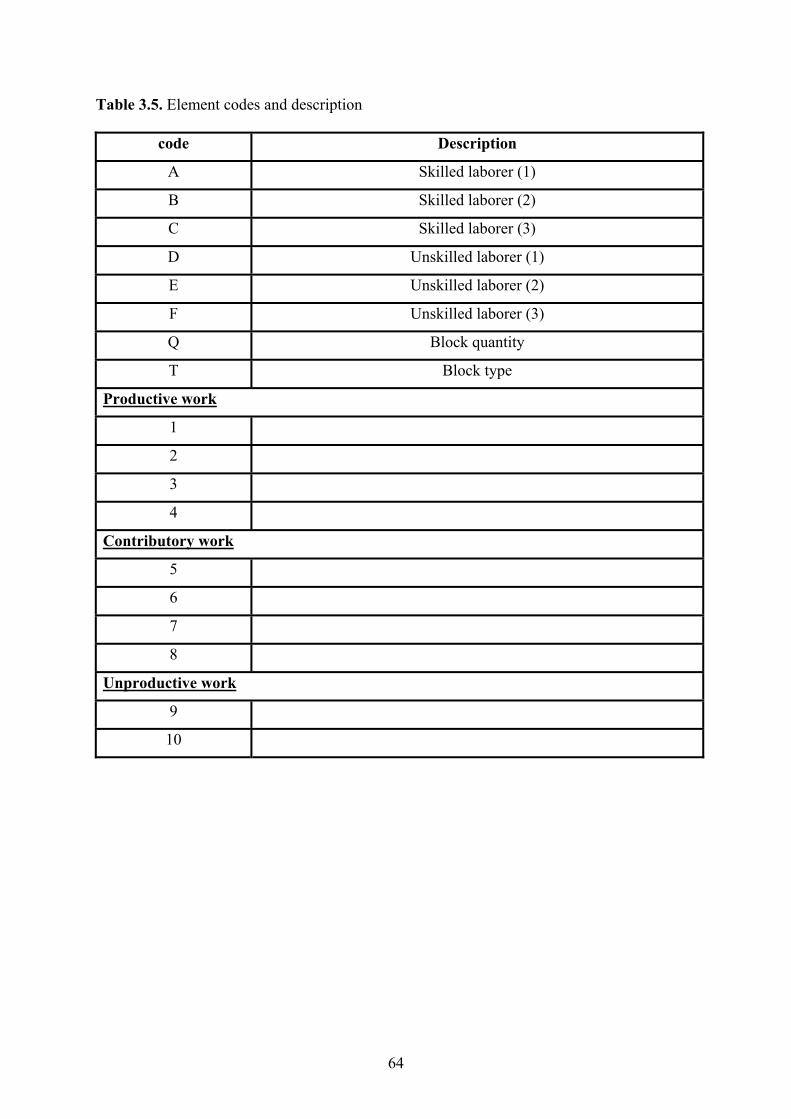
64
Table 3.5. Element codes and description
Description code
Skilled laborer (1) A
Skilled laborer (2) B
Skilled laborer (3) C
Unskilled laborer (1) D
Unskilled laborer (2) E
Unskilled laborer (3) F
Block quantity Q
Block type T
Productive work
1
2
3
4
Contributory work
5
6
7
8
Unproductive work
9
10

65
Table 3.6. Sample of activity sampling study summary sheet ((Lema, 1995 - Harris et al, 1995 - Plicher, 1997 - Olomolaiye et al, 1998)
ISLAMIC UNIVERSITY Labor Productivity Measurement Research
Data Summary Sheet
1. Project Title: .............................................................................................................. 2. Activity:.................................................. 3. Location:............................................. 4. Day :................................................... 4. Time :............................................ 5. Skilled labor numbers: ……… 6. Unskilled labor numbers: ……
Observation Productive work Contributory work Unproductive work Activity 1 2 3 4 5 6 7 8 9 10 Number of observations Percentage of observations Productivity Computation: Skilled labor productivity = volume of work done / hour

66
Table.3.7. Block work activities
activities description
Productive activities
Spreading mortar
Cutting blocks
Laying blocks
Raking and pointing
Spreading mortar on the wall in preparation for laying blocks
Cutting blocks to required size
Positioning and pressing the block on the course, and checking
verticality and horizontality of blocks
Placing mortar into vertical gaps between blocks and
Removing excess mortar
Contributory activities
Making mortar
Ancillary work
Distributing blocks or mortar
Cleaning
Mixing mortar and filling it in buckets
Work relevant to block work such as fixing angles and setting
scaffolding, Checking distances in line with drawings, taking
instruction from supervisors.
Distribution of mortar and blocks to spots close to operators
Cleaning working site
Unproductive activities
Idle
Rework
Not working
Removing and replacing already completed work due to
operators fault or management fault

67
3.6 Productivity factors evaluation on construction sites
As shown above productivity studies were performed on Sheikh Zayed Township project
focusing on block work only. Activity sampling, combined with the physical measurement
of work performed, was used utilizing study forms (see Table 3.4 and 3.5). A systematic
procedure for the evaluation of productivity factors was introduced. The personal interviews
with skilled labor of block work gangs were used for filling the third section of questionnaire
which includes factors negatively affecting labor productivity. It is a face to face interview, in
which the interviewer asks the respondents questions and make a brief clarification for the
ideas included in the questions. A personal interview approach was considered more practical
for the skilled labor, because some of them may not have been able to read or write.
3.7 Study boundaries
Due to limited time available, limited resources such as educational materials, journals and
books, and lack of logistic facilities, the study has the following limitations:
1. Research focus on studying productivity in the construction sector at the Gaza Strip only.
Therefore, generalizability is reduced. To extend the generalizability of this study, future
comparative research could perhaps focus on samples from other places in Palestine;
2. Research is concerned only with labor productivity without including total factor
productivity and financial productivity;
3. Research is related with productivity measurement of block work only. Therefore, there
is need for future research to focus on other activities in construction projects such as
concrete work, tile work, painting work, Plastering work, …… etc;
4. The surveyed questionnaires also inherit another limitation related to the fact that it
directs the participants to give opinions in regard to certain given statement. There could
be other factors that affect labor productivity but not mentioned in the questionnaire and
the respondents may have not the time to remember them.
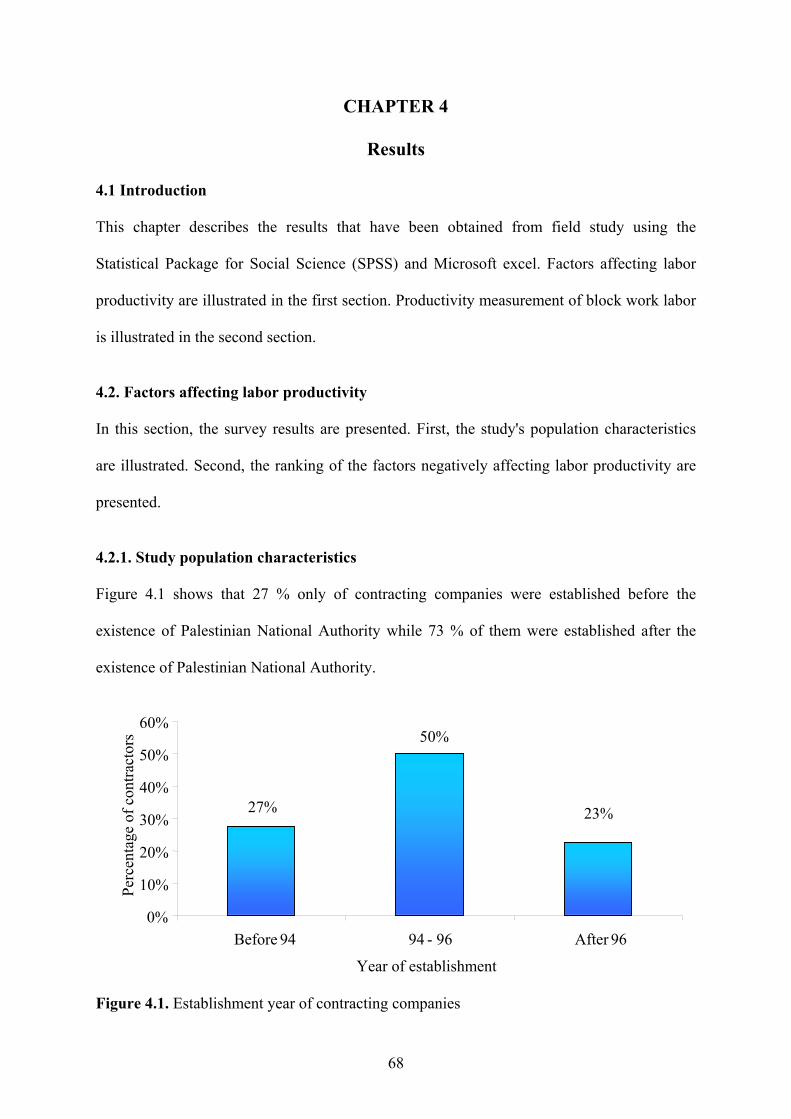
68
CHAPTER 4
Results
4.1 Introduction
This chapter describes the results that have been obtained from field study using the
Statistical Package for Social Science (SPSS) and Microsoft excel. Factors affecting labor
productivity are illustrated in the first section. Productivity measurement of block work labor
is illustrated in the second section.
4.2. Factors affecting labor productivity
In this section, the survey results are presented. First, the study's population characteristics
are illustrated. Second, the ranking of the factors negatively affecting labor productivity are
presented.
4.2.1. Study population characteristics
Figure 4.1 shows that 27 % only of contracting companies were established before the
existence of Palestinian National Authority while 73 % of them were established after the
existence of Palestinian National Authority.
Figure 4.1. Establishment year of contracting companies
23%
50%
27%
0%
10%
20%
30%
40%
50%
60%
Before 94 94 - 96 After 96
Year of establishment
Perc
enta
ge o
f con
tract
ors

69
Figure 4.2 shows that more than half of the contracting companies have less than 10
permanent employees (58 %), whilst 36 % of contracting companies have from 11-30
permanent employees, 5 % of contracting companies have 31-50 permanent employees and
only 1 % of contracting companies have more than 50 permanent employees.
Figure 4.2. Number of employees in contracting companies
Table 4.1 shows that 35.5 % of contracting companies executed less than 10 building projects
during the last five years, and 33 % of contracting companies executed 11-20 building
projects during the last five years while 10.5 % of contracting companies executed 21-30
building projects during the last five years, and 21 % of contracting companies executed
more than 30 building projects during the last five years.
As shown in table 4.1, average value per year of executed projects during the last 5 years in
20 % of contracting companies is less than 0.5 million US dollars whilst average value per
year of executed projects during the last 5 years in approximately half of contracting
companies (47%) is 0.51-2 million US dollars. Also average value per year of executed
projects during the last 5 years in 33% of contracting companies is more than 2 million US
1%5%
36%
58%
0%
10%
20%
30%
40%
50%
60%
70%
≤ 10 11 - 30 31 - 50 > 50
Number of employees
Perc
enta
ge o
f con
tract
ors

70
dollars. The number and value of projects indicate that majority of executed projects are of
small size.
Table 4.1. Distribution of number and value of projects
Contractors Variable
Number % Total Number
≤ 10 27 35.5
11 - 20 25 33
21 - 30 8 10.5 Executed projects during last five years
> 30 16 21
76
≤ 0.5 15 20 0.51 - 1 17 22 1.1 - 2 19 25
Average value per year of projects executed during last 5 years (million $)
> 2 25 33
76
Regarding the classification of respondent contracting companies in buildings specialization,
figure 4.3 illustrates that 42 % of the companies were classified as first class, 43.5 % of them
were classified as second class, while only 14.5 % of them were classified as third class.
Figure 4.3. Classification of respondent contractors
Figure 4.4 shows that 46 % of respondents were company presidents, 33 % of respondents
were projects managers and 21 % of respondents were site engineers. The higher position of
Second class43.50%
Third class14.50%
First class42%

71
respondents gives more confidence in the quality of answers and also expresses the
respondent's high concern to deal seriously with this research.
Figure 4.4 Distributions of respondent's occupation
4.2.2. Study degree of contractors concerned in the productivity
Figure 4.5 shows that approximately half of contracting companies (45%) always measure
labor productivity in their projects whilst 39% of contracting companies usually measure
labor productivity in their projects. On the other hand, a small percentage of contracting
companies never measure labor productivity in their projects (3%). This shows that
measuring labor productivity is a very important topic in contracting companies. It should
also be noted that the majority of contracting companies which do not measure labor
productivity have no technical cadres capable of measuring labor productivity.
Projects managers33%
Site Engineers 21%
Company presidents
46%

72
Figure 4.5 Degree of labor productivity measurement in contracting companies
From table 4.2, it is observed that more than half of contractors (59%) use "measuring
required time for performing the work during implementation" as a tool for measuring labor
productivity, whilst around one third of contractors (31%) use "analysis data recorded in
daily reports to measure the number of hours needed to accomplish the work" as a tool for
labor productivity measurement. Also it should be noted that small number of contractors
(7%) use both methods for measuring labor productivity in their projects.
Table 4.2. Methods of measuring labor productivity in contracting companies
Method of productivity measurement Number Percentage
Analysis of data recorded in daily reports 24 31
Measuring required time during implementation 45 59
Use of both methods 5 7
Figure 4.6 indicates that site engineers measure labor productivity in more than half of
contracting companies (58%), meanwhile foremen and projects managers measure labor
productivity in one third of contracting companies (34%). On the other hand, only 7 % of
contracting companies hired specialist engineers for measuring labor productivity.
39%45%
10%3% 3%
0%
10%
20%
30%
40%
50%
Always Usually Some times Rarely Never
Perc
enta
ge o
f con
tract
ors

73
Figure 4.6. Distributions of administration title of officer who measure labor productivity
Table 4.3 indicates that around half of contracting companies (43%) always study reasons of
decline and increase of labor productivity in their projects and more than one-fourth of
contracting companies (32%) usually study reasons of decline and increase of labor
productivity in their projects. In addition to, 21 % of contracting companies sometimes study
reasons of decline and increase of labor productivity in their projects. On the other hand, only
4 % of contracting companies do not care about studying reasons of decline and increase of
productivity in their projects.
Table 4.3. Degree of studying reasons of decline and increase of productivity in contracting companies
Always Usually Some times Rarely Never Studying reasons of decline
and increase of productivity No. % No. % No. % No. % No. %
First class 14 44 12 37 6 19 0 0 0 0
Second class 14 42 8 24.5 8 24.5 2 6 1 3
Third class 5 46 4 36 2 18 0 0 0 0
Total 33 43 24 32 16 21 2 3 1 1
7%
1%
16%
58%
18%
0% 10% 20% 30% 40% 50% 60% 70%
Specialist engineer
Company manager
Projects manager
Site engineer
Foreman
Percentage of contractors

74
As shown in table 4.4, more than two-third of contracting companies (69 %) depend on
monitoring work during implementation for studying reasons of decline and increase of
productivity and 11 % of contracting companies interviewing company engineers and labor in
the projects to study reasons of decline and increase of productivity. Also it should be noted
that 16 % of contracting companies use both methods (interviewing engineers and labor and
monitoring the work during implementation) for investigating the reasons of decline and
increase of productivity in contracting companies.
Table 4.4. Tools of studying reasons of decline and increase of productivity in contracting companies Tool Number %
Consulting specialist in the field of labor productivity 0 0
Making interviews with company engineers and labor in the projects 8 11
Distributing questionnaire to company engineers and labor and analyze it
2 3
Monitoring work during implementation 53 69
Making interviews with engineers and labor and monitoring the work during implementation
12 16
As shown in table 4.5, 13 % of contracting companies always have plans for developing
productivity in their projects and 43 % of them often have plans for developing productivity
in their projects. In addition, approximately one-fourth of these companies sometime have
plans for developing productivity in their projects. On the other hand, a small number of
contracting companies (8 %) rarely have plans for developing productivity in their projects
and only 12% of contracting companies does not care about productivity development. 55 %
of contracting companies which sometime have, rarely have or have no plans for developing
labor productivity, stated that there is no need for such plans because of labor working in
company is not permanent. Also 37% of them stated that most of activities in company

75
projects executed by subcontractors and only 8 % of them stated that company does not have
technical cadres capable of applying such plans.
Table 4.5. Degree of availability of plans for developing labor productivity in contracting companies
Always Often Some times Rarely Never Availability of plans for
developing labor productivity No. % No. % No. % No. % No. %
First class 6 19 16 50 7 22 2 6 1 3
Second class 4 12 14 42.5 8 24.5 3 9 4 12
Third class 0 0 3 27.3 3 27.2 1 9 4 36.5
Total 10 13 33 43 18 24 6 8 9 12
As listed in table 4.6, more than one-fourth of contractors (28.5 %) depend on good planning
and monitoring of work to improve labor productivity, meanwhile 18 % of contractors apply
motivation system to improve labor productivity. In addition 13.5 % of contractors use time
schedule techniques and 9 % of them enhance labor loyalty toward company to improve
productivity. Also it is observed that approximately one-third of contractors (31%) use two
tools or more from tools no 1,2,4,5.
Table 4.6. Tools of productivity development plans in contracting companies
Tool No. Tool No. %
1 Good planning and monitoring of work 19 28.5
2 Applying motivation system 12 18
3 Conducting training courses for labor 0 0
4 Using time schedule techniques 9 13.5
5 Enhancing labor loyalty toward company 6 9
6 Use of two or more from tools No. 1,2,4,5 21 31

76
4.2.3. Factors negatively affecting labor productivity
The questionnaire included 45 factors, which derived from both previous studies, and those
factors related to local contracting companies in the Gaza Strip. The factors were distributed
into ten groups.
4.2.3.1 Manpower factors
Results indicate that lack of labor experiences is the most important factor in the manpower
group (Table 4.7). Also labor disloyalty is rated second while labor dissatisfaction rated third
in this group. On the other hand, labor absenteeism and labor personal problems are lowest
factors negatively affecting labor productivity in this group. Testing correlation for agreement
on important indexes of manpower factors between first class, second class, and third class
revealed that there is very high correlation between first class and second class (rho = 0.952).
Also there is high correlation between first class and third class (rho = 0.815) and there is
high correlation between second class and third class (rho = 0.861). T-test indicated that the
correlation is significant at the 0.01 level. Therefore, it can be concluded with 99 %
confidence that there is an association between the important indexes of first class, second
class, and third class contractors.
Table 4.7. Ranking manpower factors
Group Factors Imp. index Rank
Increase of laborer age 62.63 6
Lack of labor experiences 84.21 1
Labor absenteeism 55.00 7
Labor personal problems 54.74 8
Labor dissatisfaction 72.11 3
Labor disloyalty 78.55 2
Misunderstanding among labor 71.58 4
Manpower
factors
Lack of competition 66.84 5
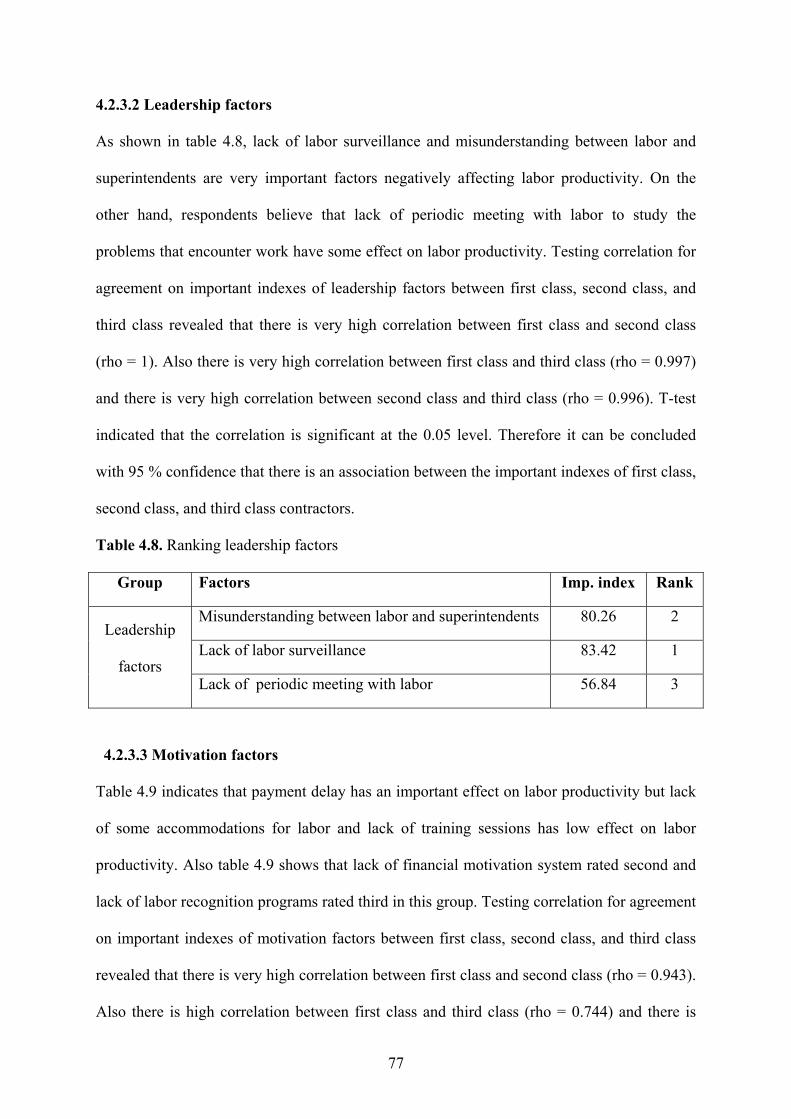
77
4.2.3.2 Leadership factors
As shown in table 4.8, lack of labor surveillance and misunderstanding between labor and
superintendents are very important factors negatively affecting labor productivity. On the
other hand, respondents believe that lack of periodic meeting with labor to study the
problems that encounter work have some effect on labor productivity. Testing correlation for
agreement on important indexes of leadership factors between first class, second class, and
third class revealed that there is very high correlation between first class and second class
(rho = 1). Also there is very high correlation between first class and third class (rho = 0.997)
and there is very high correlation between second class and third class (rho = 0.996). T-test
indicated that the correlation is significant at the 0.05 level. Therefore it can be concluded
with 95 % confidence that there is an association between the important indexes of first class,
second class, and third class contractors.
Table 4.8. Ranking leadership factors
Group Factors Imp. index Rank
Misunderstanding between labor and superintendents 80.26 2
Lack of labor surveillance 83.42 1 Leadership
factors Lack of periodic meeting with labor 56.84 3
4.2.3.3 Motivation factors
Table 4.9 indicates that payment delay has an important effect on labor productivity but lack
of some accommodations for labor and lack of training sessions has low effect on labor
productivity. Also table 4.9 shows that lack of financial motivation system rated second and
lack of labor recognition programs rated third in this group. Testing correlation for agreement
on important indexes of motivation factors between first class, second class, and third class
revealed that there is very high correlation between first class and second class (rho = 0.943).
Also there is high correlation between first class and third class (rho = 0.744) and there is

78
high correlation between second class and third class (rho = 0.677). T-test indicated that the
correlation is significant at the 0.01 level. Therefore it can be concluded with 99 %
confidence that there is an association between the motivation factors, important indexes of
first class, second class, and third class contractors.
Table 4.9. Ranking motivation factors
Group Factors Imp. index Rank
Lack of financial motivation system 68.95 2
Lack of labor recognition programs 61.84 3
Non-providing of transportation means 56.05 4
Lack of place for eating and relaxation 55.53 5
Payment delay 78.68 1
Motivation
factors
Lack of training sessions 50.26 6
4.2.3.4 Time factors
Table 4.10 indicates that working for 7 days of week without taking a holiday is rated first
(imp. Index = 76.58) in the time factors group whilst misuse of time schedule techniques in
managing work rated second (imp. Index = 74.74) in this group. Also method of employment
rated third (imp. Index = 65.79), increasing No. of labor in order to accelerate work rated
fourth (imp. Index = 64.47) and work overtime rated fifth in time group (imp. Index = 62.37).
It should be noted that all time factors have some important effect on labor productivity.
Testing correlation for agreement on important indexes of time factors between first class,
second class, and third class revealed that there is very high correlation between first class
and second class (rho = 0.898). On the other hand, there is a moderate correlation between
first class and third class (rho = 0.561) and there is little correlation between second class and
third class (rho = 0.2). T-test indicated that the correlation between first class and second
class contractors only is significant at 0.05 level. Therefore it can be concluded with 95 %

79
confidence that there is an association between the time factors, important indexes of first
class and second class contractors only.
Table 4.10. Ranking time factors
Group Factors Imp. index Rank
Work overtime 62.37 5
Working for 7 days of week without taking a holiday 76.58 1
Increasing No. of labor in order to accelerate work 64.47 4
Misuse of time schedule 74.74 2
Time factors
Method of employment (using direct work system) 65.79 3
4.2.3.5 Materials / Tools factors
All materials / tools factors have high influence on labor productivity (see table 4.11). Indeed
material shortages are the most important factor in this group. Also shortage of tools and
equipment has high impact on labor productivity (imp. Index = 75.26). On the other hand,
unsuitability of materials storage location has less impact than above two factors on labor
productivity. Testing correlation for agreement on important indexes of materials / tools
factors between first class, second class, and third class revealed that there is very high
correlation between first class and second class (rho = 0.94). Also there is very high
correlation between first class and third class (rho = 0.979) and there is high correlation
between second class and third class (rho = 0.99). T-test indicated that the correlation is not
significant at the 0.05 level. Therefore, it can be concluded that there is no association
between the materials and tools factors important indexes of first class, second class, and
third class contractors

80
Table 4.11. Ranking materials / tools factors
Group Factors Imp. index Rank
Material shortages 89.47 1
Unsuitability of materials storage location 69.21 3 Materials / Tools
factors Tool and equipment shortages 75.26 2
4.2.3.6 Supervision factors
Table 4.12 shows that drawings and specifications alteration during execution is the most
important factor among other supervision issues. Inspection delay ranked second while
rework ranked third in supervision factors group. The least important factor in this group is
supervisors absenteeism. Indeed all supervision factors have high influences on labor
productivity. Testing correlation for agreement on important indexes of supervision factors
between first class, second class, and third class revealed that there is high correlation
between first class and second class (rho = 0.790). There is moderate correlation between first
class and third class (rho = 0.575) and there is a moderate correlation between second class
and third class (rho = 0.466). T-test indicated that the correlation is not significant at the 0.05
level. Therefore it can be concluded that there is no association between the supervision
factors important indexes of first class, second class, and third class contractors
Table 4.12. Ranking supervision factors
Group Factors Imp. index Rank
Rework 75 3
Supervisors absenteeism 71.84 4
Inspection delay 77.63 2
Supervision
factors
Drawings and specifications alteration during execution
80.00 1

81
4.2.3.7 Project factors
The degree of importance of project related factors is described in table 4.13. The important
factors in project factors group are working in confined space and interference. Construction
method and type of activities in the project have low importance in effecting labor
productivity. Testing correlation for agreement on important indexes of project factors
between first class, second class, and third class revealed that there is very high correlation
between first class and second class (rho = 0.955). On the other hand, there is little
correlation between first class and third class (rho = 0.156) and there is little correlation
between second class and third class (rho = 0.271). T-test indicated that the correlation is
significant at the 0.05 level between first class and second class only. Therefore it can be
concluded with 95 % confidence that there is an association between the project factors
important indexes of first class and second class contractors only.
Table 4.13. Ranking project factors
Group Factors Imp. index Rank
Type of activities in the project
61.58 4
construction method
62.11 3
Interference 67.11 2 Project factors
Working in confined space 70.26 1
4.2.3.8 Safety factors
As illustrated in table 4.14, accidents and violation of safety precautions have large effect on
labor productivity. On the other hand bad ventilation, working at high places, unemployment
of safety officer in the construction site and noise have low effect on labor productivity.
Indeed insufficient lighting has average influence on labor productivity. Testing correlation
for agreement on important indexes of safety factors between first class, second class, and
third class revealed that there is high correlation between first class and second class (rho =

82
0.704). Also there is very high correlation between first class and third class (rho = 0.905)
and there is high correlation between second class and third class (rho = 0.851). T-test
indicated that the correlation is significant at the 0.05 level. Therefore, it can be concluded
with 95 % confidence that there is an association between the safety factors important
indexes of first class, second class, and third class contractors.
Table 4.14. Ranking safety factors
Group Factors Imp. index Rank
Violation of safety precautions 67.63 2
Accidents 72.37 1
Unemployment of safety officer in the construction site 53.16 6
Working at high places 58.68 5
Bad ventilation 61.32 4
Insufficient lighting 64.74 3
Safety
factors
Noise 48.42 7
4.2.3.9 Quality factors
As detailed in table 4.15, inefficiency of equipment and low quality of raw materials
approximately have same effect on labor productivity. In fact, all quality factors have large
effect on labor productivity. Testing correlation for agreement on important indexes of
quality factors between first class, second class, and third class revealed that there is no
correlation between first class and second class and there is no correlation between first class
and third class. But there is moderate correlation between second class and third class (rho =
0.61). T-test indicated that the correlation is not significant at the 0.05 level. Therefore it can
be concluded that there is no association between the quality factors important indexes of first
class, second class, and third class contractors.

83
Table 4.15. Ranking quality factors
Group Factors Imp. index Rank
Low quality of raw materials 71.32 2
High quality of required works 67.89 3 Quality factors
Inefficiency of equipment 71.58 1
4.2.3.10 External factors
Looking at table 4.16 showed that weather changes ranked first in external factors group
whilst augmentation of Government regulation related to the construction sector ranked
second in this group. Testing correlation for agreement on important indexes of external
factors between first class, second class, and third class revealed that there is correlation
between first class and third class (rho = 1). On the other hand there is no correlation between
first class and second class and there is no correlation between second class and third class.
T-test indicated that the correlation between first class and third class is significant at the 0.01
level. Therefore it can be concluded with 99 % confidence that there is an association
between the external factors important indexes of first class and third class contractors.
Table 4.16. Ranking external factors
Group Factors Imp. index Rank
Weather changes 63.95 1
External factors Augmentation of Government regulations related
to the construction sector 60.79 2
4.2.3.11 overall ranking of factors negatively affecting labor productivity
As indicated in table 4.17, the most five important factors negatively affecting labor
productivity are material shortages, lack of labor experiences, lack of labor surveillance,
misunderstanding between labor and superintendents, drawings and specifications alteration

84
during execution. Also results indicate that lowest factors which effects labor productivity are
labor absenteeism, labor personal problems, unemployment of safety officer in the
construction site, lack of training sessions, and noise. Furthermore, results indicate that
payment delay, labor disloyalty, inspection delay, working all days of week without taking
holidays, tool and equipment shortages and rework have high effect on labor productivity and
should be avoided to improve labor productivity. Testing correlation for agreement on
ranking factors negatively affecting labor productivity between first class, second class, and
third class revealed that there is very high correlation between first class and second class
(rho = 0.894). Also there is high correlation between first class and third class (rho = 0.784)
and there is high correlation between second class and third class (rho = 0.751). T-test
indicated that the correlation is significant at the 0.01 level. Therefore it can be concluded
with 99 % confidence that there is an association between the first class, second class, and
third class contractors in ranking factors negatively affecting labor productivity.
Table 4.17. Overall ranking of factors negatively affecting labor productivity
Groups Factors Imp. index
Rank
Increase of laborer age 62.63 30
Lack of labor experiences 84.21 2
Labor absenteeism 55.00 41
Labor personal problems 54.74 42
Labor dissatisfaction 72.11 14
Labor disloyalty 78.55 7
Misunderstanding among labor 71.58 17
Manpower
factors
Lack of competition 66.84 25
Misunderstanding between labor and superintendents 80.26 4
Lack of labor surveillance 83.42 3 Leadership
factors Lack of periodic meeting with labor 56.84 38
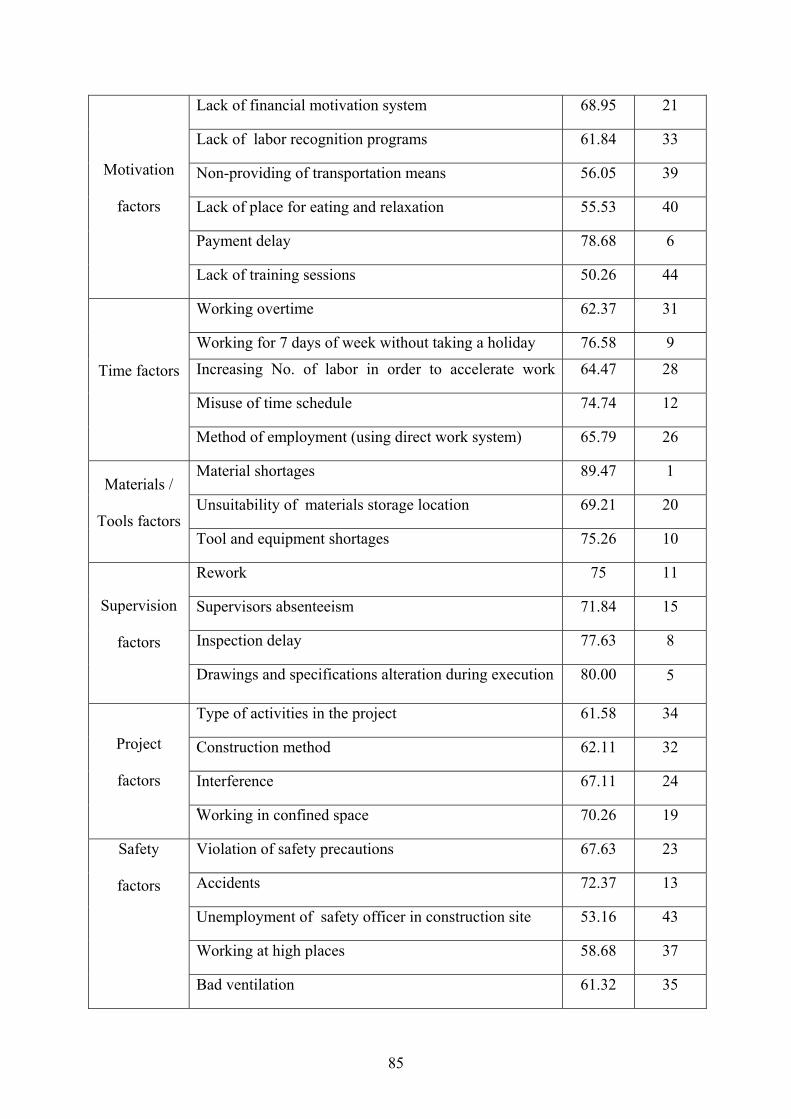
85
Lack of financial motivation system 68.95 21
Lack of labor recognition programs 61.84 33
Non-providing of transportation means 56.05 39
Lack of place for eating and relaxation 55.53 40
Payment delay 78.68 6
Motivation
factors
Lack of training sessions 50.26 44
Working overtime 62.37 31
Working for 7 days of week without taking a holiday 76.58 9
Increasing No. of labor in order to accelerate work 64.47 28
Misuse of time schedule 74.74 12
Time factors
Method of employment (using direct work system) 65.79 26
Material shortages 89.47 1
Unsuitability of materials storage location 69.21 20 Materials /
Tools factors Tool and equipment shortages 75.26 10
Rework 75 11
Supervisors absenteeism 71.84 15
Inspection delay 77.63 8
Supervision
factors
Drawings and specifications alteration during execution 80.00 5
Type of activities in the project
61.58 34
Construction method
62.11 32
Interference 67.11 24
Project
factors
Working in confined space 70.26 19
Violation of safety precautions 67.63 23
Accidents 72.37 13
Unemployment of safety officer in construction site 53.16 43
Working at high places 58.68 37
Safety
factors
Bad ventilation 61.32 35

86
Insufficient Lighting 64.74 27
Noise 48.42 45
Low quality of raw materials 71.32 18
High quality of required work 67.89 22 Quality
factors Inefficiency of equipment 71.585 16
Weather changes 63.95 29 External
factors Augmentation of Government regulations related to the
construction sector
60.79 36
4.2.3.12 Ranking of groups in affecting labor productivity
Survey results indicate that materials / tools factors group ranked most important among all
groups of productivity factors (table.4.18). On the other hand, safety factors group ranked
least important among all factors groups. Supervision factors group ranked second important
and leadership factors group ranked third important.
Table.4.18. Ranking factors negatively affecting productivity among groups
Factors groups Imp. index Rank
Materials / Tools factors 77.98 1
Supervision factors 76.12 2
Leadership factors 73.51 3
Quality factors 70.36 4
Time factors 68.79 5
Manpower factors 68.16 6
Project factors 65.26 7
External factors 62.38 8
Motivation factors 61.85 9
Safety factors 60.9 10

87
4.3 Labor productivity measurement
The labor productivity measurement on construction sites was based on studying block work
in the Gaza Strip. The main reasons for block work productivity studies on construction sites
were:
a. The significance of the cost contribution of block work in relation to other building
activities;
b. Block work would provide an opportunity to study a variety of factors;
c. Its inputs and outputs are easily quantifiable;
d. It is a relatively easy activity to observe and quantify because of its intensity.
Block work productivity observations and productivity factors were evaluated as follows:
Activity sampling along with the physical measurement of output per hour was used. An
evaluation of productivity factors during the process was also performed.
Specialized teams performed all block work operations in construction sites. They are also
responsible for hiring all equipment for the project’s task. These comprised hammer, trowel,
bucket, axe, hatchet and spirit level. Contractor provided all materials. Block work would
normally start daily at 8 A.M and finish at 5 P.M. there is one hour break for lunch from 12
o'clock to 1 o'clock therefore day working hours of block work gang are 8 hours. There are
two types of blocks mainly used for block work. First type is block 20 and second type is
block 10. The size of block 20 is (20cm * 40cm * 20cm). The size of block 10 is (10cm *
40cm * 20cm).
4.3.1 Study of sample characteristics
Figure 4.7 shows that more than half of the skilled labor sample (58.33 %) were aged below
30 years. This indicated that block work is young men trade.
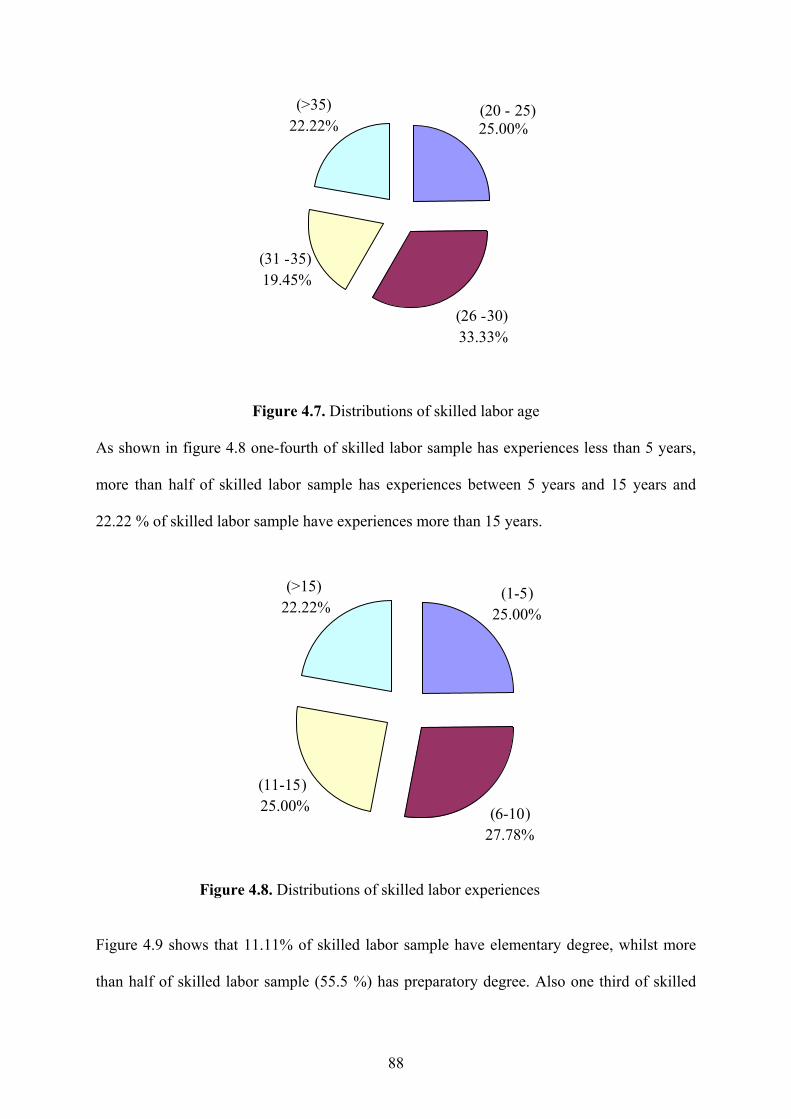
88
Figure 4.7. Distributions of skilled labor age
As shown in figure 4.8 one-fourth of skilled labor sample has experiences less than 5 years,
more than half of skilled labor sample has experiences between 5 years and 15 years and
22.22 % of skilled labor sample have experiences more than 15 years.
Figure 4.8. Distributions of skilled labor experiences
Figure 4.9 shows that 11.11% of skilled labor sample have elementary degree, whilst more
than half of skilled labor sample (55.5 %) has preparatory degree. Also one third of skilled
(>35)22.22%
(31 -35) 19.45%
(26 -30) 33.33%
(20 - 25) 25.00%
(6-10)27.78%
(11-15) 25.00%
(1-5)25.00%
(>15) 22.22%

89
labor sample have secondary degree and none of skilled labor sample has university degree.
This means that most of block work labor have not high education. All of skilled labor
sample trained on-site learning from their seniors and they were not formally trained in trade
schools.
Figure 4.9. Distributions of skilled labor education background
4.3.2 Distributions of Block work working time
Table 4.19 shows that productive time of skilled labor is 77.01% of working time whilst
productive time of unskilled labor is 9.34% of working time. Also productive time of block
work gang is 48.28% of working time. Contributory time of skilled labor is 9.76 % of
working time. On the other hand, Contributory time of unskilled labor is 54.66% of working
time. Contributory time of block work gang is 28.72% of working time. Finally unproductive
time of skilled labor is 13.23% of working time, unproductive time of unskilled labor is 36%
of working time, and unproductive time of block work gang is 23% of working time.
Secondary degree33.33%
Preparatory degree55.56%
Elementary degree 11.11%

90
Table 4.19: Block work working hour's basic statistics
Mean parameter Statistics Skilled labor Unskilled labor Gang
Mean 77.01% 9.34% 48.28% Productive time
Std. Deviation 9% 8.23% 8.58%
Mean 9.76 % 54.66% 28.72% Contributory time
Std. Deviation 6.6 % 18.62% 9.2%
Mean 13.23% 36% 23% Unproductive time
Std. Deviation 6.67% 14% 7.1%
Table 4.20 indicates that spreading mortar on the wall take 21.17% of skilled labor working
time, 0.55 % of unskilled labor working time and 12.25 % of block work gang working time.
Cutting blocks to required size take 5.69% of skilled labor working time, 5.58 % of unskilled
labor working time and 5.55 % of block work gang working time. Positioning and pressing
the block on the course, and checking verticality and horizontality of blocks take 38.87% of
skilled labor working time, 2.25 % of unskilled labor working time and 23.76 % of block
work gang working time. Placing mortar into vertical gaps between blocks and removing
excess mortar take 11.28% of skilled labor working time, 0.96 % of unskilled labor working
time and 6.72 % of block work gang working time. Mixing mortar and filling it in bucket
take 0.20% of skilled labor working time, 22.55 % of unskilled labor working time and 9.47
% of block work gang working time. Distribution of mortar and blocks to spots close to
operators take 0.52% of skilled labor working time, 23.59 % of unskilled labor working time
and 10.61% of block work gang working time. Work relevant to block work such as (fixing
angles, setting scaffolding, checking distances in line with drawings, and taking instruction
from supervisors) takes 6.68% of skilled labor working time, 6.81 % of unskilled labor
working time and 6.40% of block work gang working time. Cleaning working site takes
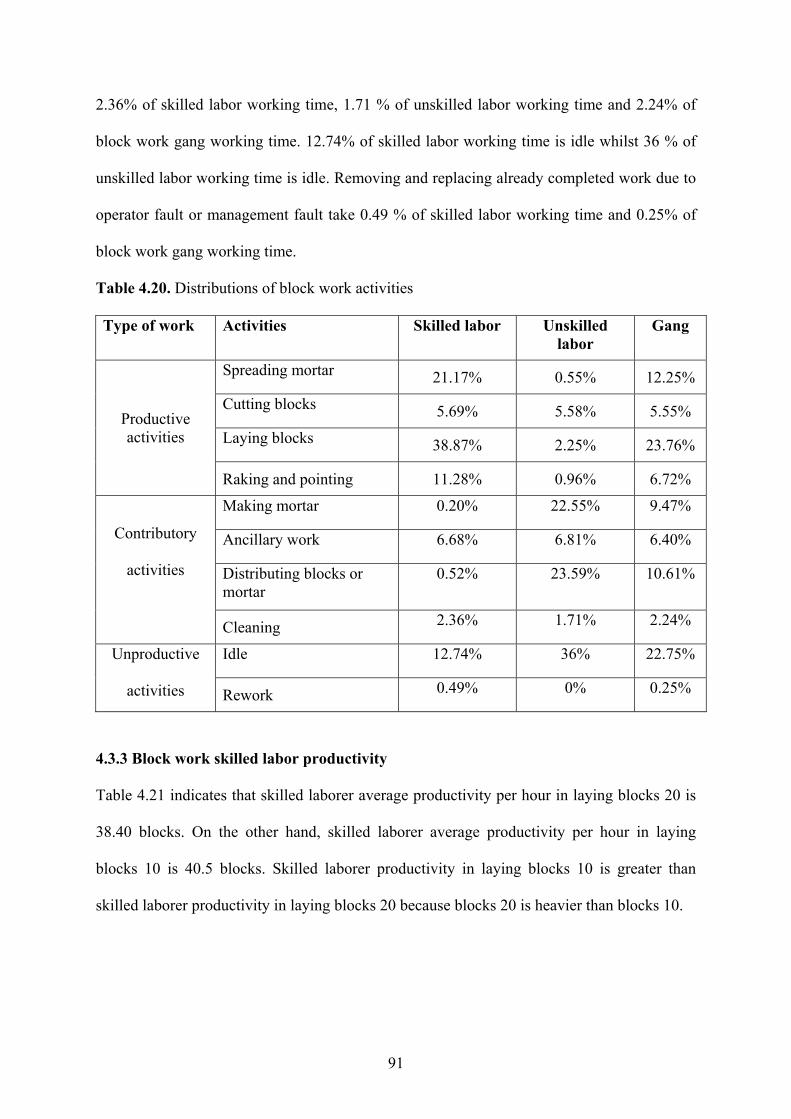
91
2.36% of skilled labor working time, 1.71 % of unskilled labor working time and 2.24% of
block work gang working time. 12.74% of skilled labor working time is idle whilst 36 % of
unskilled labor working time is idle. Removing and replacing already completed work due to
operator fault or management fault take 0.49 % of skilled labor working time and 0.25% of
block work gang working time.
Table 4.20. Distributions of block work activities
Type of work Activities Skilled labor Unskilled labor
Gang
Spreading mortar 21.17% 0.55% 12.25%
Cutting blocks 5.69% 5.58% 5.55%
Laying blocks 38.87% 2.25% 23.76%
Productive activities
Raking and pointing 11.28% 0.96% 6.72%
Making mortar 0.20% 22.55% 9.47%
Ancillary work 6.68% 6.81% 6.40%
Distributing blocks or mortar
0.52% 23.59% 10.61%
Contributory
activities
Cleaning 2.36% 1.71% 2.24%
Idle 12.74% 36% 22.75% Unproductive
activities Rework 0.49% 0% 0.25%
4.3.3 Block work skilled labor productivity
Table 4.21 indicates that skilled laborer average productivity per hour in laying blocks 20 is
38.40 blocks. On the other hand, skilled laborer average productivity per hour in laying
blocks 10 is 40.5 blocks. Skilled laborer productivity in laying blocks 10 is greater than
skilled laborer productivity in laying blocks 20 because blocks 20 is heavier than blocks 10.

92
Table. 4.21. Block work skilled labor productivity statistics
Std. Deviation Mean
(blocks/Hour)
Block type
11.86 38.40 Blocks 20
12.52 40.50 Blocks 10
Frequency histograms were drawn for skilled labor productivity in blocks 20 and blocks 10 to
provide a visual illustration of the frequency distributions of skilled labor productivity in both
types of blocks. These have been presented in figure 4.10, 4.11. Both figures show a high
variation of skilled labor productivity in both blocks 20 and blocks10.
Figure 4.10. Frequency histogram of skilled labor productivity in Blocks 20
Results indicate that skilled labor has highest productivity from 9 o'clock to 11 o'clock and
from 2 o'clock to 3 o'clock and they have lowest productivity from 8 o'clock to 9 o'clock and
from 4 o'clock to 5 o'clock for both types of blocks (figure 4.12). But it should be noted that
Skilled labor productivity (blocks / hour)
70.065.0
60.055.0
50.045.0
40.035.0
30.025.0
20.015.0
10.0
Freq
uenc
y (r
eadi
ngs n
umbe
r = 8
59)
160
140
120
100
80
60
40
20
0

93
skilled labor productivity in morning hours higher than skilled labor productivity in afternoon
hours for blocks 10 but skilled labor productivity in morning hours approximately equals
skilled labor productivity in afternoon hours for blocks 20.
Figure 4.11. Frequency histogram of skilled labor productivity in Blocks 10
Figure 4.12. Histogram representing skilled labor productivity in hours of day
Results indicate that skilled labor has highest productivity on Sunday for blocks 10 (figure
4.13) whilst they have highest productivity on Wednesday for blocks 20. On the other hand,
43.6 44.84036.8
40.038.2 37.2
41.142.6
34.2
39.9 38.939.5 39.6 39.6
35.4
0.0
10.0
20.0
30.0
40.0
50.0
8-9 9-10 10-11 11-12 1-2 2-3 3-4 4-5Working Day Hours
Block 10Block 20
Skilled labor productivity (blocks / hour)
70.065.0
60.055.0
50.045.0
40.035.0
30.025.0
20.015.0
10.0
Freq
uenc
y (r
eadi
ngs n
umbe
r = 8
64)
140
120
100
80
60
40
20
0

94
skilled labor has lowest productivity on Thursday for both types of blocks. Also it should be
noted that skilled labor productivity is high on Monday and Wednesday for both types of
blocks.
Figure 4.13. Histogram representing skilled labor productivity in week days
4.3.4 Site evaluation of factors affecting labor productivity
Some factors that may have some influence on productivity were recorded during block
laying operation. Some relationships between them and productivity have also been explored.
These factors are:
1. Skilled laborer age;
2. Skilled labor experiences;
3. Skilled labor wage;
4. Number of skilled labor in working gang.
Table 4.22 indicates that there is strong positive impact of skilled labor wage on productivity
(partial correlation = 0.55). On the other hand, there is low negative impact of skilled laborer
age on productivity (partial correlation = -0.20). Number of skilled labor in working gang has
positive impact on productivity but its impact is very low (partial correlation = 0.12). Skilled
296
372350
299
352
276300 306 303
330 336
270
050
100150200250300350400
Saturday Sunday
Monday Tuesday
Wednesday
Thursday
Weekdays
Prod
uctiv
ity (b
lock
s / d
ay)
Block 10Block 20

95
labor experiences have very high positive impact on productivity in the first five years
(partial correlation = 0.80) but after 5 year of experiences the impact of increase of
experiences on productivity decreased, therefore, correlation between skilled labor and
productivity become low (partial correlation = 0.277).
Table 4.22. Correlation between different factors and skilled labor productivity
Parameter Partial correlation P
Skilled labor age - 0.20 0.477
Skilled labor wage 0.55 0.034
Number of Skilled labor in working gang 0.12 0.68
Experiences from 1 year to 5 years 0.80 0.055
Experiences 0.277 0.317
To identify the important factors negatively affecting productivity of block work skilled
labor. The personal interviews with skilled labor of block work gangs were used for filling
the third section of questionnaire which includes factors negatively affecting labor
productivity. Table 4.23 shows skilled labor evaluation of factors negatively affecting
productivity. As mentioned in table 4.23 skilled labor believe that most five important factors
negatively affecting productivity are material shortages, rework, payment delay, low quality
of raw materials, and lack of labor experiences. Skilled labor agreed that lowest factors which
effect labor productivity are supervisors absenteeism, unemployment of safety officer in
construction site, non-providing of transportation means, lack of training sessions, and lack of
place for eating and relaxation. Also skilled labor agreed that misunderstanding between
labor and superintendents, interference, insufficient lighting, tool and equipment shortages,
and labor disloyalty are important factors which should be considered. Testing correlation for
agreement on ranking factors negatively affecting labor productivity between contractors and
skilled labor revealed that there is a moderate correlation between contractors and skilled
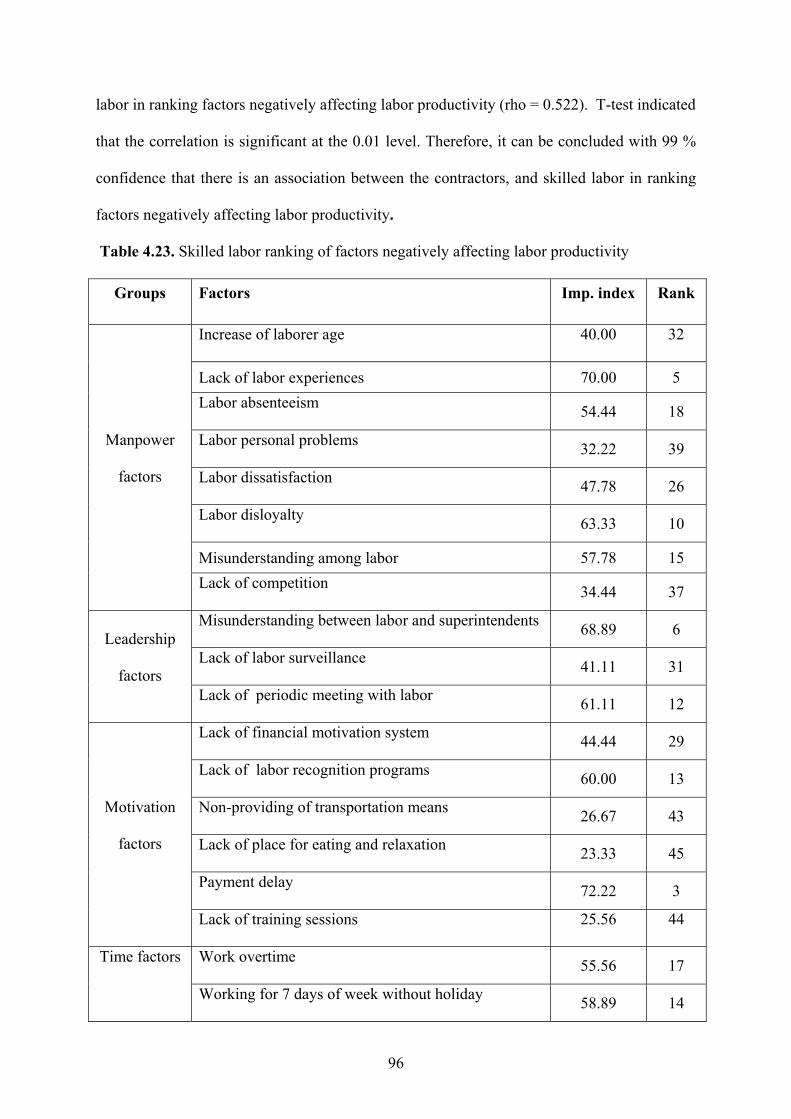
96
labor in ranking factors negatively affecting labor productivity (rho = 0.522). T-test indicated
that the correlation is significant at the 0.01 level. Therefore, it can be concluded with 99 %
confidence that there is an association between the contractors, and skilled labor in ranking
factors negatively affecting labor productivity.
Table 4.23. Skilled labor ranking of factors negatively affecting labor productivity
Groups Factors Imp. index Rank
Increase of laborer age 40.00 32
Lack of labor experiences 70.00 5 Labor absenteeism 54.44 18
Labor personal problems 32.22 39
Labor dissatisfaction 47.78 26
Labor disloyalty 63.33 10
Misunderstanding among labor 57.78 15
Manpower
factors
Lack of competition 34.44 37
Misunderstanding between labor and superintendents 68.89 6
Lack of labor surveillance 41.11 31
Leadership
factors Lack of periodic meeting with labor 61.11 12
Lack of financial motivation system 44.44 29
Lack of labor recognition programs 60.00 13
Non-providing of transportation means 26.67 43
Lack of place for eating and relaxation 23.33 45
Payment delay 72.22 3
Motivation
factors
Lack of training sessions 25.56 44
Work overtime 55.56 17 Time factors
Working for 7 days of week without holiday 58.89 14
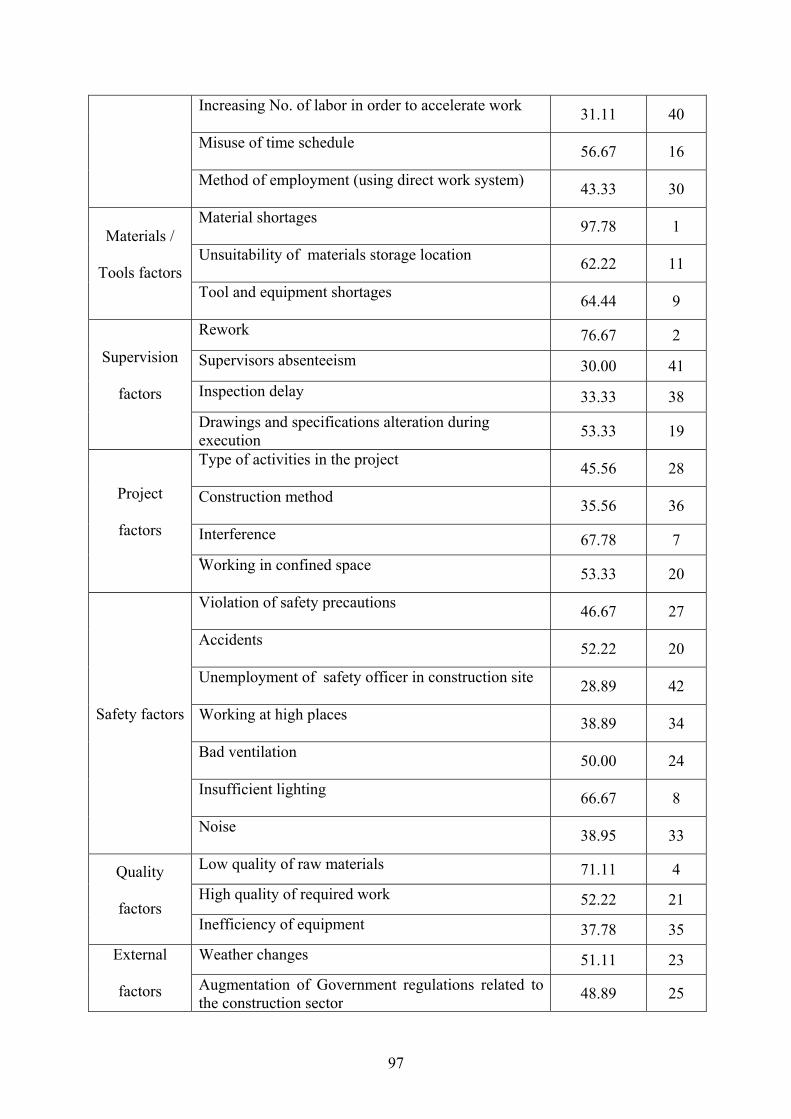
97
Increasing No. of labor in order to accelerate work 31.11 40
Misuse of time schedule 56.67 16
Method of employment (using direct work system) 43.33 30
Material shortages 97.78 1
Unsuitability of materials storage location 62.22 11
Materials /
Tools factors Tool and equipment shortages 64.44 9
Rework 76.67 2 Supervisors absenteeism 30.00 41 Inspection delay 33.33 38
Supervision
factors
Drawings and specifications alteration during execution 53.33 19
Type of activities in the project 45.56 28
Construction method 35.56 36
Interference 67.78 7
Project
factors
Working in confined space 53.33 20
Violation of safety precautions 46.67 27
Accidents 52.22 20
Unemployment of safety officer in construction site 28.89 42
Working at high places 38.89 34
Bad ventilation 50.00 24
Insufficient lighting 66.67 8
Safety factors
Noise 38.95 33
Low quality of raw materials 71.11 4 High quality of required work 52.22 21
Quality
factors Inefficiency of equipment 37.78 35 Weather changes 51.11 23 External
factors Augmentation of Government regulations related to the construction sector 48.89 25

98
Table.4.24 shows that block work skilled labor ranked materials / tools factors group most
important among all groups of productivity factors on the contrary they ranked motivation
factors group least important among all factors groups. They ranked leadership factors group
second important and quality factors group third important.
Table.4.24. Skilled labor ranking of factors negatively affecting productivity among groups
Factors groups Imp. index Rank
Materials / Tools factors 74.81 1 Leadership factors 57.04 2 Quality factors 55.93 3 Time factors 51.33 4 Manpower factors 50.00 5 Supervision factors 48.33 6 External factors 48.15 7 Project factors 47.78 8 Safety factors 46.04 9 Motivation factors 40.93 10

99
Chapter 5
Discussion
5.1 Introduction
This study is conducted to investigate the labor productivity of the construction sector in the
Gaza Strip. The main objectives for the study are to explore the factors affecting labor
productivity in building construction and labor productivity measurement of block work. This
issue is of a particular importance to the Gaza Strip projects as a new developed area and due
to expected huge amount of projects planned to be done in the near future. In this chapter, the
findings of this study will be discussed in further detail. Findings of factors affecting labor
productivity are discussed in the first section and findings of labor productivity measurement
of block work are discussed in the second section.
5.2 factors affecting labor productivity
The sample size of the study was selected randomly to represent the study population of first,
second, and third class categories of contracting companies in buildings specialization at the
Gaza Strip contractors union. The total sample size was 83 contracting companies. The
general response rate, was 91.5 %, the majority of sample (76 contracting companies) were
responded and participated in the study. The high response rate reflect the relevant
importance that was paid by contracting companies in the Gaza Strip to the objectives of the
study and personal follow up by researcher, which has increased the accuracy of the study.
5.2.1 Sample size characteristics
The results showed that around three-fourth of contracting companies in buildings
specialization of contractors union were established after the existence of Palestinian
National Authority in 1994. This means that most contracting companies in the Gaza Strip
are newly established so they have short period of experience "nine years".

100
The findings indicate that majority of contracting companies (94 %) have less than 30
employees. These results reveal the simple organization of contracting companies in the Gaza
Strip.
It has been found that the majority of contracting companies have executed less than 30
projects in the last five years. This finding indicates that number of building projects which
executed by different organizations during a year is very small (2 – 6). It was also found that
value of building projects per year executed by majority of contracting companies is small
(0.5 million – 2 million). The results regarding both number of executed building projects and
their value depicts that the size of building projects in Gaza Strip is classified as small and
simple projects.
The results demonstrate that more than three-fourth (79 %) of respondents designation are
either company president or projects manager. The higher designation of respondents
increases the accuracy of the results and also expresses the respondent's high concern to deal
seriously with this study.
5.2.2. Degree of contractors concerned in the productivity
Findings illustrate that about half of contracting companies always measure labor
productivity and study reasons of decline or increase of labor productivity in their projects.
This might be justified as contracting companies become distressed by labor productivity in
recent years because the number of projects increased and owners forced contractors to
comply with the contract duration in many projects especially international projects. But it
should be noted that contractors only concerned about labor productivity of critical activities
which may cause projects delay.
Findings indicate that more than half of contracting companies use "measuring required time
during implementation" as a tool for measuring labor productivity in construction sites. Also
findings show that more than half of contracting companies depend on "monitoring the work

101
during implementation" as a tool to investigate the factors affecting productivity in their
projects. This findings show that contracting companies depend on monitoring the work in
construction sites to study labor productivity in their projects.
More than half of contracting companies depend on site engineers to measure labor
productivity in construction sites. This result might be interpreted as number and value of
projects are small therefore contracting companies did not hire specialist engineer to measure
labor productivity in construction sites.
Results show that around half of contracting companies often have plans for developing labor
productivity in their projects while one – fourth of contracting companies some times have
plans for developing productivity in their projects. This result reflects that contracting
companies in the Gaza Strip do not pay enough attention for improving labor productivity in
their projects. 55 % of contracting companies which answered some time have, rarely have or
have no plans for developing labor productivity stated that there is no need for such plans
because labor working in company are not permanent. Also 37% of them stated that most of
activities in company projects executed by subcontractors and only 8 % of them stated that
company does not have technical cadres capable of applying such plans.
Around half of contracting companies monitors the work in construction sites and use
motivation system to improve labor productivity in their projects. Also it should be noted that
around one – third of contracting companies use two methods or more for improving labor
productivity in their projects.
5.2.3 Factors negatively affecting labor productivity
In this study, 45 factors negatively affecting labor productivity in buildings construction of
the Gaza Strip have been considered and their importances have been analyzed. All factors
selected by a careful review of literature and suggestion of a sample of building contractors.
The factors have been classified into 10 groups. These groups are classified as manpower,
102
leadership, motivation, time, materials / tools, supervision, project, safety, and external
factors.
5.2.3.1 Manpower factors group
The results show that under group of manpower factors, the most important factor is lack of
labor experiences followed by labor disloyalty, labor dissatisfaction, misunderstanding
among labor, lack of competition, increase of laborer age, labor absenteeism, and labor
personal problems.
More than half of respondents (51%) rated lack of labor experiences with very high degree of
effect on labor productivity. This indicates that lack of labor experiences have very high
effect on labor productivity. This result is supported by Paulsion (1975) (cited in Lema, 1995)
who mentioned that experiences of the craftsmen affect labor productivity. Also this result
supported by Heizer et al (1996) who mentioned that experience of workforce affects job site
productivity. This result is justified as experience improves intellectual and physical abilities
of labor which consequently increase labor productivity.
Labor disloyalty had high effect on labor productivity and ranked in the second position in
manpower group with important index 78.55. Labor disloyalty also ranked seventh among all
factors negatively affecting labor productivity. Results also indicate that labor dissatisfaction
has high effect on labor productivity. This result is supported by Robbins (1998) who
mentioned that organization with more satisfied employees tended to be more effective than
organization with less satisfied employees.
Furthermore, results indicate that misunderstanding among labor has average effect on labor
productivity. This factor was ranked 17 among all factors negatively affecting labor
productivity. This result is justified as misunderstanding among labor creates disagreement
among labor about responsibilities and work bounds of each laborer. This disagreement leads
to a lot of mistakes in work and consequently decreases labor productivity.
103
Findings also show that 41 % of respondents rated lack of competition with average effect on
labor productivity. This factor ranked at position 25 among all factors negatively affecting
labor productivity. Findings also show that 32 % of respondents rated increase of laborer age
with average effect on labor productivity. This factor ranked at position 30 among all factors
negatively affecting labor productivity. Heizer et al (1996) support this result who mentioned
that age of workforce affect job site productivity. This result is justified as labor speed,
agility, and strength decay over time and contributes to reduced productivity.
Labor absenteeism had low effect on labor productivity and ranked at position 41 among all
factors negatively affecting productivity, whilst this factor had high effect on labor
productivity in Indonesia and Nigeria. This result might be justified as labor of the
construction sector in the Gaza Strip working on daily basis therefore contractor can hire
additional labor to cover absenteeism of any laborer. Personal problems have low negative
effect on labor productivity and ranked in position 42 among all factors negatively affecting
labor productivity. This result might be justified as personal problems cause only mental
distraction for labor. Mental distraction affects labor safety more than labor productivity.
5.2.3.2 Leadership factors group
The results illustrate that the three factors under leadership factors, were ranked as follows:
lack of labor surveillance, misunderstanding between labor and superintendents, and lack of
periodic meeting with labor. Lack of labor surveillance has high effect on labor productivity
(imp. index = 83.42) and ranked in position 3 among all factors negatively affecting labor
productivity. This result is justified as lack of labor surveillance increases labor mistakes at
work and also delays correction action for these mistakes.
Misunderstanding between labor and superintendents have high effect on labor productivity
(imp. index = 80.26) and ranked in position 4 among all factors negatively affecting labor
productivity. This result is justified as misunderstanding between labor and superintendents

104
originate bad relation between them. This bad relation has adverse effect on labor mood and
consequently decreases his productivity. Finally lack of periodic meeting with labor has low
effect on labor productivity and ranked in position 38 among all factors negatively affecting
labor productivity. This result might be justified because building projects in the Gaza Strip
are small and problems facing work can be discussed at any time with superintendents,
therefore, there is no need for periodic meeting with labor to discuss these problems.
5.2.3.3 Motivation factors group
The result of this study indicates that under motivation factors group, the six factors were
placed on descending order according to their importance as follows: payment delay, lack of
financial motivation system, lack of labor recognition programs, non-providing of
transportation means, lack of place for eating and relaxation, lack of training sessions. Results
demonstrate that payment delay has high effect on labor productivity (imp. index = 78.68)
and ranked in position 6 among all factors negatively affecting labor productivity. This result
is justified as payment delay has very bad effect on labor mood and consequently decreases
its productivity.
Contractors believe that lack of financial motivation system has more bad impact on labor
productivity than lack of labor recognition programs and ranked lack of financial motivation
system in position 21 whilst they ranked lack of labor recognition programs in position 32
among all factors negatively affecting labor productivity. But skilled labor of block work did
not support these results and stated that lack of labor recognition programs has more bad
effect on labor productivity than lack of financial motivation. Regardless of which type of
motivation is more effective, motivation is essential for labor as it gives workers satisfaction
at work site such as achievement, sense of responsibility and pleasure from the work itself.
Non-providing of transportation means and place for eating and relaxation have low effect on
labor productivity and ranked in positions 39 and 40 among all factors negatively affecting

105
labor productivity. This result is not supported by Lema (1995) who mentioned that non
financial benefits such as (transport, meals, and uniform) have high effect on labor
productivity. These results might be justified in the Gaza Strip because area of the Gaza Strip
is small and transportation to any place in the Gaza strip can be available easily, therefore,
there is no need to provide transportation to labor. Also Palestinian labor is not sensitive
about place of eating. According to their culture, any place can be used for eating and there is
no need to provide a special place for eating and relaxation.
Furthermore, findings illustrate that lack of training sessions have low effect on labor
productivity and ranked in position 44 among all factors negatively affecting labor
productivity. Surveyed contractors illustrate that there is no need for training sessions and
labor can be trained more effectively in site by working with experienced workers.
5.2.3.4 Time factors group
the results show that the five factors under group of time factors were ranked according to
their importance in affecting labor productivity as follows: "working for 7 days of week
without holiday" was first, " misuse of time schedule" was second, "method of employment
(using direct work system) " was third, "increasing workforce to accelerate work" was fourth,
and "work overtime" was fifth.
Working for 7 days of week without holiday have high effect on labor productivity whilst
working additional hours in working day have average effect on labor productivity. Hinze
(1999) supported these results and stated that working additional days and hours have
negative impact on labor productivity. These results are not surprising because working
additional days and hours create an adverse effect on the motivation, and physical strength of
labor and thus decrease their productivity. But the impact of additional hours for short period
may be not noticeable or may be non existent.

106
Results also demonstrate that misuse of time schedule has high negative impact on labor
productivity. This result is acceptable because good use of time schedule leads to many
advantages such as: continuous flow of work, reduced amount of rework, and minimize
confusion and misunderstanding.
Using daily work system instead of unit rate system has average negative effect on labor
productivity and ranked in position 31 among all factors negatively affecting labor
productivity. This result is justified as labor desire to work by unit rate system to earning
more money therefore labor work too hard to finish the greatest amount of work when
working by unit rate system.
Increasing workforce in construction site has a moderate effect on labor productivity and
ranked in position 28 among all factors negatively affecting labor productivity. This result
was also supported by Hinze (1999) who mentioned that increase of workforce in
construction site has adverse impact on labor productivity. This result is justified as
increasing workforce in construction site cause overcrowding of labor and interference
between labor and gangs which consequently reduce labor productivity.
5.2.3.5 Materials / Tools factors group
The results demonstrate that three factors under materials / tools factors group were ranked
according to their importance in effecting labor productivity as follows: material shortages,
tool and equipment shortages, and unsuitability of materials storage location. The findings
show that, the most important factors among all factors negatively affecting labor
productivity is material shortages. Important index of material shortages is 89.47 and three
classes of contracting companies ranked this factor first among all factors. This is
understandable in that work can not be done without the necessary materials. Material
shortages rated in first position among factors affecting labor productivity in US, UK,
Indonesia, Nigeria, Singapore, and Kenya (Guhathakurta et al, 1993 - lim et al, 1995 -
107
Olomolaiye et al, 1996). This result is justified in the Gaza Strip as most of materials used in
construction projects are imported from Israel therefore any closure of crossing points
between the Gaza strip and Israel stop work in large numbers of construction projects.
Results also show that tool and equipment shortages have high effect on labor productivity
and ranked in position 10 among all factors negatively affecting labor productivity. Tool and
equipment shortages also have high effect on labor productivity in US, UK, Indonesia, and
Nigeria (Guhathakurta et al, 1993 - Olomolaiye et al, 1996). This result might be justified as
labor needs a minimum number of tools and equipment to work effectively. If there is lack of
equipment and tools, the productivity will decrease.
Results also illustrate that unsuitability of materials storage location have average effect on
labor productivity and ranked in position 20 among all factors negatively affecting labor
productivity. This result was supported by Thomas et al (1990) (cited in Lema, 1995) who
stated that size and organization of materials storage location have significant impact on
masonry productivity. This result is justified as labor needs more time in fetching required
materials from unsuitable storage location and this negatively affects productivity.
5.2.3.6 Supervision factors group
All supervision factors have high impact on labor productivity and ranked according to their
importance as follows: drawings and specifications alteration during execution, inspection
delay, rework, and supervisors absenteeism.
Drawings and specifications alteration during execution is the most important factor in
supervision factors group and ranked within the 10 most important factors negatively
affecting productivity with imp. index 80. This result is supported by Thomas et al (1995)
who stated that there is a 30% loss of efficiency when work changes are being performed.
This result can be interpreted as changes of specifications and drawings require additional

108
time for the adjustments of resources and manpower so that the change can be met. Also
labor morale is affected by extensive numbers of changes.
Inspection delay is second important factor in supervision factors group and also ranked
within the 10 most important factors negatively affecting productivity. Inspection delay also
has high impact on labor productivity in US, UK, Nigeria, and Indonesia (Guhathakurta et al,
1993 – Olomolaiye et al, 1996). This result is justified as work inspection by supervisor is an
essential process to proceed in work, for example contractors can not cast concrete before
inspection of formwork and steel work therefore inspection delay contributes to delays of
work activities.
Supervisors absenteeism is the last factor in supervision factors group but it is ranked in
position 15 among all factors negatively affecting labor productivity. This is not surprising in
the Gaza Strip projects as absenteeism of supervisors stop work totally in some activities
which require attendance of supervisors such as casting concrete and backfilling. Also
supervisors absenteeism delays inspection of ready work which leads to delay
commencement of new work.
5.2.3.7 Project factors group
The most important factor in this group was working in a confined space followed by
interference, construction method, and type of activities in project. Working in confined
space ranked in position 19 among 45 factors negatively affecting labor productivity. This
result supported by Andersson et al (1996) which reported that one of common reasons for
low productivity is working in a confined space. This result might be justified as confined
spaces reduce free movement of labor and consequently reduce their productivity.
Interference has average impact on labor productivity and ranked in position 24 among all
factors negatively affecting labor productivity. Interference also has significant impact on
labor productivity in US, UK, Nigeria, and Indonesia (Guhathakurta et al, 1993 - Olomolaiye

109
et al, 1996). Interference between gangs and workers is caused by mismanagement in
construction sites. Steel fixers suffer more of this. Perhaps this is because they are more
dependent on other trade. The steel fixers have to wait before fixing the reinforcement rods if
the carpenters have not completed the formworks.
Results also indicate that construction method and type of activities in project have low
importance and ranked in positions 32 and 34 among 45 factors negatively affecting labor
productivity. This result is not supported by Thomas et al (1992) who mentioned that
construction method and project features have high impact on labor productivity. This result
might be justified because the building projects in the Gaza Strip are not complex and with
small size therefore activities in different projects approximately have same features and also
there is no major difference between methods used in construction.
5.2.3.8 Safety factors group
The result depicts that the seven factors under safety group are placed in descending order as
follows: accidents, violation of safety precautions, insufficient lighting, bad ventilation,
working at high places, unemployment of safety officer in construction site and noise.
Accidents have high impact on labor productivity and ranked in position 13 among 45 factors
negatively affecting labor productivity. These results were supported by Thomas et al (1990)
(cited in Lema, 1995) who stated that accidents have significant impact on labor productivity.
There are three types of accidents as follows:
a) Accidents resulting in the death of an injured worker, this type of accident leads to total
stoppage of work a number of days.
b) Accidents which cause an injured laborer to be hospitalized for at least 24 h, this type of
accident decreases the productivity of gang in which this injured laborer was working.
c) Small accidents which result from nails and steel wires, it affect productivity only in few
cases.
110
Insufficient lighting has average impact on labor productivity and ranked in position 27
among all factors negatively affecting labor productivity. This result is justified as labor need
a sufficient lighting to work effectively and consequently insufficient lighting has negative
impact on labor productivity. Bad ventilation and working at high places has low importance
and ranked in positions 35, 37 among all factors negatively affecting labor productivity. This
result is justified as most of building projects in the Gaza Strip are upgrade and have little
number of stories therefore labor seldom faces these problems in building projects in the
Gaza Strip.
Results also indicate that unemployment of safety officer in construction site has low impact
on labor productivity. This result is justified in the Gaza Strip as contractors seldom employ
safety officers in building projects, therefore they, are not aware of the importance of
employing safety officer in construction sites. It should be noted that employment of safety
officer in construction sites helps labor to understand the required safety regulations and then
follow it. This prevents or at least reduces number of accidents in construction sites which
consequently improve labor productivity. Noise also had low impact on labor productivity
and ranked in last position among all factors affecting productivity. This result is justified as
equipment and tools used in building projects at the Gaza Strip cause little noise.
5.2.3.9 Quality factors group
The results depict that the three factors under quality factors group are placed in descending
order as follows: inefficiency of equipment, bad quality of raw materials, and high quality of
required work. The surveyed companies have more tendencies to place inefficiency of
equipment as most important factor within this group with imp. index 71.585. This result
might be justified as productivity rate of inefficient equipment is low and this consequently
has adverse impact on labor productivity depending on this equipment. Also type of
equipment affects labor productivity. New and modern equipment have high productivity

111
rate. On the other hand, old equipment have low productivity rate and subjected to large
number of breakdowns. Andersson et al (1996) mentioned that machine breakdown is one of
the common reasons of low productivity.
The surveyed companies ranked bad quality of raw materials at position 18 among all factors
affecting labor productivity with imp. index 71.32. This result might be justified as time
needed to build materials of bad quality is higher than time needed to build materials of
proper quality. Also wastage in materials of bad quality is high especially during handling.
Furthermore, using materials of bad quality leads to a work of bad quality which
consequently is rejected by supervisor.
Quality of required work has average impact on labor productivity and ranked in position 22
among 45 factors negatively affecting labor productivity. This result is acceptable as time
required to finish work depends greatly on allowed tolerance of required work i.e. labor
worked slowly when allowed tolerance of required work is very low to avoid unacceptable
mistakes.
5.2.3.10 Weather factors group
The results demonstrate that two factors of external factors group are ranked according to
their importance as follows: weather changes and augmentation of government regulations
related to the construction sector. Weather changes have average impact on labor productivity
and ranked in position 29 among all factors affecting labor productivity. Thomes et al (1999)
support this result in his study of analysis factors affecting productivity in US. Temperature
in the Gaza Strip is normal therefore increase and decrease of temperature has low effect on
labor productivity but adverse weather in winter such as winds and rains reduce labor
productivity especially at external work such as formwork, steel work, concrete casting,
external plastering, external painting, and external tiling. Adverse weather sometimes stopped
work totally.
112
Augmentation of government regulations related to the construction sector has low
importance and ranked in position 36 among all factors negatively affecting labor
productivity. This result might be justified in the Gaza Strip as government regulations of
construction projects is subjected to minor changes only in the last years.
5.2.3.11 Overall ranks of all factors negatively affecting labor productivity
The results depict that the most five important factors negatively affecting labor productivity
are material shortages, lack of labor experiences, lack of labor surveillance, misunderstanding
between labor and superintendents, drawings and specifications alteration during execution
with imp. indexes 89.47, 84.21, 83.42, 80.26, and 80. On the other hand results indicate that
labor absenteeism, labor personal problems, unemployment of safety officer in construction
site, lack of training sessions, and noise were lowest factors negatively affecting labor
productivity with imp. indexes 55, 54.74, 53.16, 50.26, and 45 respectively.
The Spearmen's correlation test for the agreement on ranking of factors negatively affecting
productivity revealed that there is very high correlation between first class and second class
(rho = 0.894). Also there is high correlation between first class and third class (rho = 0.784)
and there is high correlation between second class and third class (rho = 0.751). Furthermore,
correlation is significant at the 0.01 level. These results mean that contracting companies in
the Gaza Strip have similar opinions regarding the factors negatively affecting labor
productivity.
5.2.3.12 Degree of effectiveness of the various groups on labor productivity
The results demonstrate that the ten groups and their factors were ranked according to their
importance as follows: rank 1 is "materials / tools factors", rank 2 is "supervision factors",
rank 3 is "leadership factors", rank 4 is "quality factors", rank 5 is "time factors", rank 6 is
113
"manpower factors", rank 7 is "project factors", rank 8 is "external factors", rank 9 is
"motivation factors", and rank 10 is "safety factors".
It is noted that "materials / tools factors" group was ranked first among ten factors groups
negatively affecting labor productivity. This result is justified as any project can not be
executed without availability of materials and tools. Current political situation in the Gaza
Strip causes frequent closures of crossing points between the Gaza Strip and Israel which
consequently result in shortage of materials and some tools in local market. This situation
affects labor productivity too much. On the other hand, "safety factors" group were ranked
last among the ten groups affecting labor productivity, this can be readily interpreted as
safety is a new topic in the construction sector in the Gaza Strip, so contracting companies
have little awareness about the impact of safety factors on labor productivity, therefore, they
rated that safety factors had either average impact or low impact only on labor productivity.
5.3 Labor productivity measurement
This section discusses findings obtained from observations of block work operation in
construction sites. The researcher carried observations of block work operation in
construction sites of Sheikh Zeyad Township project. This project is selected because it is the
largest construction project in the Gaza Strip with a larger proportion of construction
activities and continuous work compared to any other location in the Gaza Strip.
5.3.1 Case study characteristics
Observations of block work operation were carried out in construction sites of Sheikh Zeyad
Township project. Buildings of Sheikh Zeyad Township project were 70 five storey
buildings, twelve storey building, mosque, school, and 2 shops. Block work gangs worked in
Sheikh Zeyad Township project were 14. Block work gangs consisted of 36 skilled labor and
23 unskilled labor.
114
More than half of the block work skilled labor was aged below 30 years. This indicated that
block work are young men trade. Also more than half of block work skilled labor had
experiences between 5 years and 15 years and a preparatory degree. This indicated that block
work skilled labor start their career at early age. Furthermore, all block work skilled labor
trained on site, learning from their seniors. This confirms the limited attention paid by
Palestinian Authority to a proper skill based education and training. It would also seem that
contractors are not interested in any formal skill acquisition programs for block work labor
working in their sites. This result also matches with low rating of the factor "lack of training
seasons" by both contractors and skilled labor.
5.3.2 Distributions of block work working time
The researcher divided block work operation into three groups of activities. First group,
productive activities which included "spreading mortar on the wall in preparation for laying
blocks", "cutting blocks to required size", "positioning and pressing the block on the course,
and checking verticality and horizontality of blocks", and "placing mortar into vertical gaps
between blocks and Removing excess mortar". Second group, contributory activities which
included "mixing mortar and filling it in buckets", "ancillary work such as fixing angles and
setting scaffolding, Checking distances in line with drawings, taking instruction from
supervisors", "distribution of mortar and blocks to spots close to skilled labor", and "cleaning
working site". Third group, unproductive activities which included "idle time", and
"removing and replacing already completed work due to operator fault or management fault".
Findings show that skilled labor spent more than three-fourth (77.01%) of his working time
in productive work. On the other hand, skilled labor spent only 9.76% of his working time in
contributory work. This indicates that skilled labor work mainly in productive activities.
Findings also show that unskilled labor spent only 9.34% of his working time in productive
work. On the other hand unskilled labor spent more than half (54.66%) of his working time in

115
contributory work. This indicated that unskilled labor work mainly in contributory activities.
Unproductive time of skilled labor was 13.23% of his working time whilst unproductive time
of unskilled labor was 36% of his working time.
Results illustrate that the most important activity done by skilled labor was laying blocks
which had taken 38.87% of skilled labor working time. Second important activity done by
skilled labor was spreading mortar on wall which had taken 21.17% of skilled labor working
time. On the other hand, the most important activity done by unskilled labor was distribution
blocks and mortar which had taken 23.59% of unskilled labor working time. Second
important activity done by unskilled labor was making mortar which had taken 22.55% of
unskilled labor working time. This result is acceptable as the main job of skilled labor is
laying blocks while the main job of unskilled labor is providing materials required for skilled
labor to perform his work.
Results also indicate that skilled labor and unskilled labor spent approximately equal time in
cutting blocks. Also skilled labor and unskilled labor spent approximately equal time in
ancillary work. This is because some gangs depend on skilled labor for cutting blocks and
ancillary work and other gangs depend on unskilled labor to perform these two activities.
As mentioned in results, idle time of unskilled labor (36%) is higher than idle time of skilled
labor (12.74%). This indicates that the work is not well distributed between skilled and
unskilled labor. Findings also indicated that skilled labor lost only 0.49 % of his working
time in rework. This result might be interpreted as block work in all buildings of Sheikh
Zeyad Township project is typical from ground storey to last storey therefore block work is
repeated from storey to storey and from building to building. This repetition of work helped
skilled labor to understand drawing and specification requirements and consequently reduce
rework. Findings illustrate that block work gangs spent more than three-fourth (77%) of their

116
working time in working activities. This percentage is acceptable but it could be improved by
effective distribution of work between skilled and unskilled labor.
5.3.3 Skilled labor productivity in block work
Findings indicate that the average productivity of skilled laborer in laying blocks 20 is 38.40
blocks per hour while average productivity of skilled laborer in laying blocks 10 is 40.50
blocks per hour. Skilled laborer productivity in laying blocks 10 greater than skilled laborer
productivity in laying blocks 20 because blocks 10 is lighter than blocks 20 thus blocks 10 is
easier than blocks 20 in handling and fixing .
Skilled labor productivity in laying both blocks 10 and blocks 20 were high from 9 o'clock to
11 o'clock. On the other hand, skilled labor productivity in laying both blocks 10 and blocks
20 were low from 8 o'clock to 9 o'clock and from 4 o'clock to 5 o'clock. High productivity
from 9 o'clock to 11 o'clock because these hours are first hours of working day thus skilled
labor in these hours is vital and have more power and ability for production. The Low
productivity from 8 o'clock to 9 o'clock because skilled labor spent approximately 10 minutes
of first hour preparing mortar required to start block laying and Low productivity from 4
o'clock to 5 o'clock because skilled labor was tired by that hour.
Skilled labor had high productivity in laying blocks 10 on Sunday, Monday, and Wednesday
whilst they were had medium productivity on Saturday, and Tuesday. On the other hand,
skilled labor had low productivity in Thursday. Skilled labor had high productivity in laying
blocks 20 on Tuesday, and Wednesday whilst they were had medium productivity on
Saturday, Sunday, and Monday. On the other hand, skilled labor had low productivity on
Thursday. Low productivity in laying blocks in Thursday might be interpreted as this day is
last working day in the week thus skilled labor were tired and fatigued in that day. Also
skilled labor was subjected to mental distraction in that day because they plan for the method
of spending weekend.
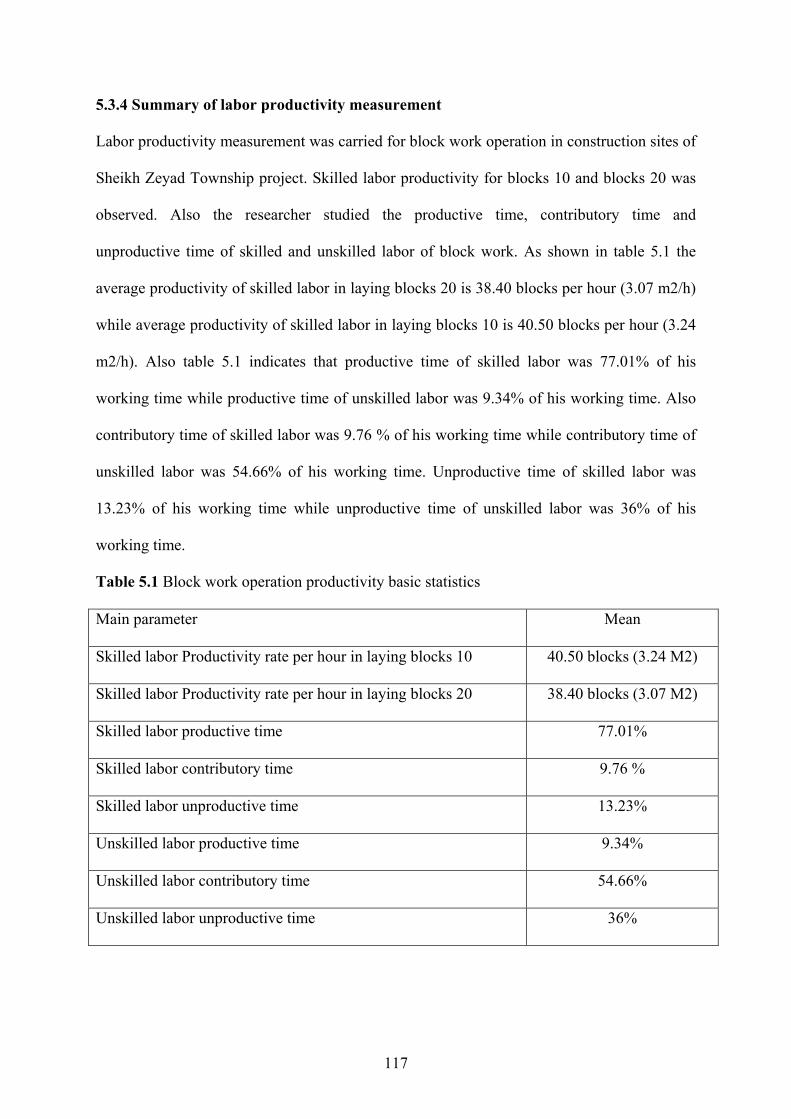
117
5.3.4 Summary of labor productivity measurement
Labor productivity measurement was carried for block work operation in construction sites of
Sheikh Zeyad Township project. Skilled labor productivity for blocks 10 and blocks 20 was
observed. Also the researcher studied the productive time, contributory time and
unproductive time of skilled and unskilled labor of block work. As shown in table 5.1 the
average productivity of skilled labor in laying blocks 20 is 38.40 blocks per hour (3.07 m2/h)
while average productivity of skilled labor in laying blocks 10 is 40.50 blocks per hour (3.24
m2/h). Also table 5.1 indicates that productive time of skilled labor was 77.01% of his
working time while productive time of unskilled labor was 9.34% of his working time. Also
contributory time of skilled labor was 9.76 % of his working time while contributory time of
unskilled labor was 54.66% of his working time. Unproductive time of skilled labor was
13.23% of his working time while unproductive time of unskilled labor was 36% of his
working time.
Table 5.1 Block work operation productivity basic statistics Main parameter Mean
Skilled labor Productivity rate per hour in laying blocks 10 40.50 blocks (3.24 M2)
Skilled labor Productivity rate per hour in laying blocks 20 38.40 blocks (3.07 M2)
Skilled labor productive time 77.01%
Skilled labor contributory time 9.76 %
Skilled labor unproductive time 13.23%
Unskilled labor productive time 9.34%
Unskilled labor contributory time 54.66%
Unskilled labor unproductive time 36%
118
5.4 Factors affecting labor productivity of block work
Some factors that may have influence on productivity were recorded during block laying
operation. These factors were skilled labor age; skilled labor experiences; skilled labor wage;
and number of skilled labor in working gang. Findings show that value of skilled labor wage
had significant impact on his productivity (partial correlation = 0.55). This is acceptable as
increase of wage motivate labor to increase his productivity.
Labor experiences had high impact on labor productivity when experiences are less than five
years (partial correlation = 0.80) while the impact of labor experiences become low when
exceeded five years (partial correlation = 0.277). This is acceptable because labor always has
low productivity when it starts his career and productivity increase rapidly by increase of
experiences till certain limit. After this limit, increase of his experiences does not affect his
productivity. Skilled labor age and number of skilled labor in working gang had low impact
on productivity of skilled labor working in construction sites with partial correlation -0.2 and
0.12 respectively.
To identify the important factors negatively affecting productivity of block work skilled
labor. The personal interviews with skilled labor of block work gangs were used for filling
the third section of questionnaire which includes factors negatively affecting labor
productivity. Findings depict that the most five important factors negatively affecting block
work skilled labor productivity are material shortages, rework, payment delay, low quality of
raw materials, and lack of labor experiences with imp. indexes 97.78, 76.67, 72.22, 71.11,
and 70. Skilled labor also agreed that the lowest factors which affect labor productivity are
supervisors absenteeism, unemployment of safety officer in construction site, non-providing
of transportation means, lack of training sessions, and lack of place for eating and relaxation
with imp. indexes 30, 28.89, 26.67, 25.56, and 23.33. Also skilled labor agreed that

119
misunderstanding between labor and superintendents, interference, insufficient lighting, tool
and equipment shortages, and labor disloyalty are important factors and should be considered.
120
CHAPTER 6
Conclusions and Recommendations
6.1 Conclusions
6.1.1 Introduction
The main objective of this research was to study measurement of labor productivity in the
Palestinian construction industry. Productivity formed the focal area of the study because it is
the main value adding function in the construction sector. Identification of factors that
influences construction productivity was based on a careful review of literature and
suggestion of a sample of building contractors. Productivity measurement carried out for
block work because of its significance in building construction and its specific characteristics
which make it more interesting to study.
Generally, these objectives have been achieved and some actions that may contribute to the
productivity improvement in the construction industry have been recommended.
6.1.2 Factors negatively affecting labor productivity in building projects
An exploration of factors negatively affecting labor productivity in building projects was
conducted in order to find the degree of importance for each factor. The result of analysis of
45 factors considered in the questionnaire filled by representative sample of contracting
companies registered in buildings specialization at contractors union in the Gaza Strip
concluded that the main factors negatively affecting labor productivity are:
1. Material shortages;
2. Lack of labor experiences;
3. Lack of labor surveillance;
4. Misunderstanding between labor and superintendents;
5. Drawings and specifications alteration during execution;
121
6. Payment delay,
7. Labor disloyalty;
8. Inspection delay;
9. Working for 7 days of week without holiday; and
10. Tool / equipment shortages.
Furthermore 45 factors considered in the study were distributed among 10 groups, which are
ranked in importance order as follows:
1. Materials / tools factors group;
2. Supervision factors group;
3. Leadership factors group;
4. Quality factors group,
5. Time factors group;
6. Manpower factors group;
7. Project factors group;
8. External factors group;
9. Motivation factors group; and
10. Safety factors group.
Also results indicated that three classes of contracting companies have similar opinions
regarding the factors negatively affecting labor productivity.
6.1.3 Distributions of labor working time in block work
The research studied the distributions of skilled labor time and unskilled labor time in
working day. The findings indicate that skilled labor work mainly in productive activities as
they spend 77.01% of their working time in productive activities. Also it is indicated that
unskilled labor work mainly in contributory activities as they spend 54.66% of their working
time in contributory activities. Also findings highlight that the work is not well distributed
122
between skilled labor and unskilled labor as idle time of unskilled labor (36%) is higher than
idle time of skilled labor (12.74%).
6.1.4 Skilled labor productivity in block work
Productivity of skilled labor is another issue that was studied in this research. The findings
confirm that average productivity of skilled labor in laying blocks 20 is 38.40 blocks per hour
(3.07 m2/h) while average productivity of skilled labor in laying blocks 10 is 40.50 blocks
per hour (3.24m2/h). Skilled labor productivity in laying both blocks 10 and blocks 20 were
high from 9 o'clock to 11 o'clock. On the other hand, skilled labor productivity in laying both
blocks 10 and blocks 20 were low from 8 o'clock to 9 o'clock and from 4 o'clock to 5 o'clock.
Moreover the findings show that skilled labor has high productivity in laying blocks 10 on
Sunday, Monday, and Wednesday while lowest productivity of skilled labor in laying blocks
10 on Thursday. On the other hand, skilled labor has highest productivity in laying blocks 20
on Tuesday, and Wednesday while skilled labor has lowest productivity in Thursday.
6.1.5 Factors affecting labor productivity of block work
In investigating the factors affecting skilled labor productivity of block work, impact of
skilled labor experiences; skilled labor wage; skilled labor age; and number of skilled labor in
working gang were recorded during block laying operation. Findings show that value of
skilled labor wage has significant impact on skilled labor productivity. Labor experiences
have high positive impact on labor productivity when experiences are less than five years
while the positive impacts of labor experiences become low when it exceeded five years. On
the other hand skilled labor age and number of skilled labor in working gang have low impact
on productivity of skilled labor working in construction sites.
Finally, findings show that the highest ten factors negatively affecting labor productivity of
block work operation are: material shortages, rework, payment delay, low quality of raw

123
materials, lack of labor experiences, misunderstanding between labor and superintendents,
interference, insufficient lighting, tool and equipment shortages, and labor disloyalty.
6.2 Recommendations
1. Materials procurement
It is recommended that contracting companies have to provide materials supply schedule for
each project. This schedule should include the time required to supply materials and the
availability of materials in the local market to furnish the required materials in the suitable
time. Also contracting companies should select a suitable storage location for purchased
materials in each project. This storage location should be easily accessible and close to
constructed buildings to avoid wastage of labor time in fetching materials.
2. Materials and tools quality
Contracting companies have to give more attention to the quality of construction materials
and tools used in their projects as using perfect materials and tools reduce the time taken to
finish the work and wastage of materials. Also using perfect materials and tools have positive
effect on the quality of work which consequently improves labor productivity.
3. Leadership characteristics
Project management has to assign or recruit the right people to do the job. Also it should keep
a close eye on labor work to make sure that they understand instruction. Furthermore it ought
to keep a friendship relation with labor and make them know that they are important to the
organization and involve them in the making of decisions affecting their jobs such as method
improvements.
4. Use of scheduling techniques
It is necessary to use project scheduling techniques such as computer-aided construction
project management in each project to optimize the times of related activities and make sure
124
that works allow continuous task performance so as to reduce the idleness of the labor force
to a minimum.
5. Use of motivation system
It is important for each contracting companies to adopt motivational or personnel
management measures to boost workers’ morale. For example, tie compensation to
performance; ensure that pay, fringe benefits, safety, and working conditions are all at least
adequate; and enlarge the jobs to include challenge, variety, wholeness, and self-regulation.
6. Productivity study
Contracting companies have to conduct productivity study at the activity/operation level such
as studying factors affecting labor productivity and labor productivity measurement to
describe the detailed tasks performed for an activity / operation by individual or group in
order to find out problem areas and propose ways to improve labor productivity. Also
contracting companies are encouraged to keep historical data of productivity study in finished
projects to improve the effectiveness and accuracy of cost estimation of future projects.
7. Project procurement system
There is a need to change the traditional system of project procurement to design build
system. This new procurement system will enable contractors to participate in design process
which minimize change orders during project execution.
8. Improving contract condition
It is necessary to improve the contract condition towards adopting more use of management
practices. Contract should include statements about time planning and productivity
management to be implemented in a regular base through projects life cycle.
9. Training in productivity improvement programs
It is necessary to conduct training courses and seminars in the topics that will improve
productivity in construction projects. The training effort should be tailored to improve the

125
abilities to use the project scheduling techniques such as Microsoft project and Primavera.
Also the training effort should be tailored to improve the methods of studying productivity
and ways of productivity improvement in construction sites.
10. Trade's schools
There is a need to increase the number of trade's schools which focus on teaching
construction trades such as block work, formwork, painting, plastering, plumbing …….etc to
improve the abilities and skills of craftsmen working in construction projects.
11. Transferring of technology
More efforts should be spent by contracting companies to get the use of what other developed
countries had achieved through transferring of technology and best use of benchmarking.
6.3 Proposed additional studies
The study has proposed some actions that could lead to labor productivity improvement in the
construction industry. A number of areas of further research have also been identified. These
include:
1. The effect of different ten groups on labor productivity was evaluated in this study.
However, the researchers are encouraged to examine separately each group with more
associated factors to find out their relative importance on labor productivity.
2. There is a need for further studies in factors affecting labor productivity in the Gaza Strip
construction industry to develop labor productivity models based on actual site
observations to quantify the effects of different factors on labor productivity.
3. This study investigate factors affecting labor productivity, however, there is a need to more
studies that investigate factors affecting financial productivity and total factor productivity.
4. This study is related with productivity measurement of block work only. Therefore there is
need for further researchs to focus on other activities in construction projects such as
concrete work, tile work, painting work, plastering work, …… etc.

126
5. Further studies are recommended to relate between performance at various levels in the
construction industry that is operative, project, company, and industry level.
127
References
Abdul-Kadir, M. R., 1995. Conceptual phase of construction projects. International journal of
project Management, vol.13, issue 6, pp. 387-393.
Amer M. I., 2002. Modeling the factors affecting quality of building construction projects
during the construction phase in the Gaza Strip. Msc Thesis, Islamic university - Gaza
(Unpublished).
Andersson C. A., Miles D., Neale R., and Ward J., 1996. Site management handbook.
International Labour Office, Geneva.
Armstrong Michael, 1988. Handbook of human resource management. Kogan Page Ltd,
Londen.
Barnes M. Ralph, 1980. Motion and time study design and measurement of work. Wiley
publishers.
Barrie D., and Paulson B., 1992. Professional construction management. McGraw-Hill, Inc.
Currie R. M., 1987. Work study 4th edn. Pitman publishing, London.
Economic Policy Research Institute (MAS), 1997. Monitoring the Palestinian economy.
www.palecon.org.
El Ghuraiz Y. S., 2002. Water pricing for domestic use in the Gaza Strip. (Msc Thesis),
Islamic university-Gaza (Unpublished).
El Sawalhi N. I., 2002. Project management practices by public owners and contractors in
the Gaza Strip. Msc Thesis, Islamic university - Gaza (Unpublished).

128
Enchassi A., and Liska R., 2000. Comparison between the leadership style of American and
Palestinian construction managers. Islamic University Journal, vol. 8, issue 1, pp. 1-33.
Fellows R., and Liu A., 1997. Research method for construction. Blackwell science Ltd.
Gilleard John, 1992. The creation and use of labor productivity standards among specialist
subcontractors in the construction industry. Cost engineering journal, vol.34, issue 4, pp.11-
16.
Guhathakurta S., and Yates J., 1993. International labor productivity. Cost Engineering
journal, vol.35, issue 1, pp. 15-25.
Harris F. C. and McCaffer R., 1995. Modern construction management 4th edn. Oxford:
Blackwell Science.
Heizer J., and Render B., 1990. Production and operations management "strategic and tactical
decisions". Prentice hall, New Jersey.
Herbsman Z., and Ellis R., 1990. Research of factors influencing construction productivity.
Construction Management and Economics, vol.32, issue 8, pp. 49-61.
Hinze J. W., 1999. Construction planning and scheduling. Prentice-Hall, New Jersey.
Hooge R. V., and Tannis E.A., 1997. Probability and statistical inferences. Printice Hall.
Information services and training (ASIST), 1998. Productivity norms for labour-based
construction. International Labour Office, Nairobi.
Isabella N. W., 1999. Labor productivity in the Kenyan Construction Industry. University of
Nairobi, Kenya.

129
Kaming P. Peter, Holt D. Gary, Kometa Siman, and Olomolaiye O. Paul, 1998. Severity
diagnosis of productivity problems - reliability analysis. International journal of project
Management, vol.16, issue 2, pp. 107-113.
Lema N. M.,1995. Construction of labour productivity modeling. University of Dar elsalaam.
Lim E. C., and Alum J., 1995. Construction productivity: issues encountered by contractors
in Singapore. International journal of project Management, vol.13, issue 1, pp. 51-58.
Liou, F., and Bocherding, J. D., 1986. Work sampling can predict unit rate productivity.
Journal of Construction Engineering and Management, ASCE, vol. 112, issue 1, pp. 90-103.
Lowe John, 1987. The measurement of productivity in the construction industry.
Construction Management and Economics, vol.29, issue 5, pp. 101-113.
Madi I. M., 2003. Essential factors affecting accuracy of cost estimation of building
contractors. Msc Thesis, Islamic University - Gaza (Unpublished).
MAS (Palestinian economic policy research institute), 2001. Economic monitoring report.
www.palecon.org/masdir/monitor/monitor.html.
Oglesby C., Parker H., and Howell G., 2002. Productivity improvement in construction.
McGraw-Hill, Inc, United States of America.
Naoum S. G., 1998. Dissertation research and writing for construction students. Butterworth-
heinemann.
Olomolaiye P., Kaming P., Holt G., and Harris F., 1996. Factors influencing craftsmen's
productivity in Indonesia. International journal of project Management, vol.15, issue 1, pp.
21-30.
130
Olomolaiye P., Jayawardane A., and Harris F., 1998. Construction productivity management.
Chartered Institute of building, England.
PCBS (the Palestinian central bureau of statistics), 2000. Number of enterprises and persons
engaged for construction contractors (1995 – 1999). www.pcbs.org.
PECDAR, 1997. Housing in Palestine. www.pecdar.org.
Pilcher. 1997. Principles of construction management. McGraw-Hill, Inc, United States of
America.
Robbins S., 1998. Organization behavior. Prentice-Hall, New Jersey.
Rojas M. E., and Aramvareekul P., 2003. Labor productivity drivers and opportunities in the
construction industry. Journal of management in engineering, vol. 19, issue 2, pp78-82.
Shouqing W., 1999. Improving construction productivity by management. School of building
and real estate, national university of Singapore, Singapore.
Sisalem E., Aboubad K., and Hamad M., 2000 Engineering management "value added
assessment of construction". (Graduation project), Islamic university - Gaza (unpublished).
Teicholz Paul, 2001. U.S. construction labor productivity trends, 1970-1998. Journal of
Construction Management and Engineering, ASCE, vol.127, issue 5, pp. 427-429.
Thomas H. R., Guevara, J. M. and Gustenhoven, C. T., 1984. Improving productivity
estimates by work sampling. Journal of Construction Management and Engineering, ASCE,
vol.110, issue 2, pp. 178-188.

131
Thomas H. R., 1991. labour productivity and work sampling: the bottom line. Journal of
Construction Engineering and Management, ASCE, vol. 117, issue 3, pp. 309-320.
Thomas, H. R., and Sanders, S. R., 1991. Factors affecting masonry productivity. Journal of
Construction Engineering and Management, ASCE, vol.117, issue 4, pp. 626-644.
Thomas H. R., 1995. Quantitative effects of construction productivity. Journal of
Construction Management and Engineering, ASCE, vol.120, issue 2, pp. 290-296.
Thomas H. R., 1999. Construction baseline productivity: theory and practice. Journal of
Construction Management and Engineering, ASCE, vol.125, issue 5, pp. 295-303.
UNSCO, 1998. UNSCO report on economic and social conditions in the West Bank and
Gaza Strip. www.pecdar.org.
Wachira I. N., 2001. Labour management in Kenya. Department of building economics and
Management, university of Nairobi, Nairobi.
Wilcox S., Stringfellow B., Harris R., and Martin B., 2000. Management and productivity.
Transportation research board, committee on management and productivity.
World Bank, 2000. West Bank and Gaza Strip in brief. www.worldbank.org.
World Bank, 2001. Poverty in the West Bank and Gaza Strip. www.worldbank.org.
World Bank, 2003. Two years of Intifada, closures and Palestinian economic crisis.
www.worldbank.org.
Zhi, H., 1995. Risk management for overseas construction projects. International journal of
project Management, vol.13, issue 4, pp. 231-237.

132
List of Annexes
Annex 1 Questionnaire in English Language
Annex 2 Questionnaire in Arabic Language

133
Annex 1
THE ISLAMIC UNVIRSITY - GAZA
Higher Education Deanship
Faculty of Engineering – Civil Engineering Department
Questionnaire
STUDYING FACTORS AFFECTING LABOR
PRODUCTIVITY OF BUILDING PROJECTS
A Thesis Submitted in Partial Fulfillment of the Requirements for the
Degree of Master of Science in Construction Management
Researcher
Eng. Zeyad Abo Mostafa
Supervisor
Professor Dr. Adnan Enshassi
Professor of Construction Engineering and Management
May, 2003 / Rabi Awwal, 1424

134
Questionnaire for aims to study factors affecting labor productivity in the Gaza Strip
Dear contractor,
To start, I would like to present my appreciation and thanks to you for taking part of your
time and effort to complete this questionnaire.
This questionnaire aims to study factors affecting labor productivity in the construction sector
at the Gaza Strip (buildings projects).This is part of partial fulfillment of the requirements for
degree of Master of Science in construction management from Islamic University.
Contents of Questionnaire:-
1. Company Profile.
2. Degree of contractors concerned in the productivity.
3. Factors affecting labor productivity.
Information in the questionnaire:-
All information in the questionnaire will be used for research with complete commitment for
absolute secrecy to your information.
First Part:
Company Profile
1. Name of the Company: ………………………………………………………………...
2. Year of establishment: …………………………………………………………………
3. Classification of the company / according to Contractors Union:
First Class Second Class Third Class
4. The position of officer who fills the questionnaire:
Company Manger Projects Manger Site Engineer Foreman
5. Number of Company's Employees:
Less than 10 11 - 30 31 – 50 More than 50

135
6. Number of executed projects during the last five years:
Less than 10 11 - 20 21 – 30 More than 30
7. Average value per year of executed projects during the last five years (in million dollars):
Less than 0.5 0.51 - 1 1.1 – 2 More than 2
Second Part:
Degree of contractors concerned in the productivity
8. Your company measure labor productivity:
Always Usually Sometime Rarely No
8.1 Labor productivity is measured through:
Analyzing the data recorded in the daily reports to estimate the number of hours needed for performing a task Measuring the time needed for executing a task during implementation
Another method, define (……………………………………………………………)
8.2 The title of the employee who measures the labor productivity is:
Specialist Engineer Site Engineer Foreman Other
8.3 Reason of not measuring labor productivity is:
Measuring labor productivity is not necessary
Measuring labor productivity is costly
There are no cadres capable of measuring labor productivity
Another reasons, define (……………………………………………………………)
9. Your company studies the reasons of increase and decline of productivity:
Always Usually Sometime Rarely Never

136
9.1 Studying of causes of increase and decline of productivity is done through:
Consulting specialist in the field of labor productivity
Making interviews with company engineers and labor who work in the projects
Distributing questionnaire to company engineers and labor who work in the projects and analyze it Monitoring work during implementation
Another method, define (……………………………………………………………)
10. Your company has plans for developing labor productivity:
Always Usually Sometime Rarely Never
10.1 Method upon which labor productivity development plans is dependent on: Good planning and monitoring the work
Applying motivation system to encourage the labor to increase productivity
Conducting training course for the labor Enhancing the labor loyalty toward company
Using time schedule techniques
Another method, define (……………………………………………………………)
10.2 Reason of unavailability of labor productivity development plans is:
There are no cadres capable of applying these plans
Labor in the company is not permanent
Most of activities in company projects executed by subcontractors
Another reasons, define (……………………………………………………………)

137
Third Part:
Factors affecting labor productivity
11. In the table below there are numbers of factors negatively affecting labor productivity in
building projects. Please define the degree of importance of these factors in affecting labor
productivity taking into consideration the under mentioned table.
Symbol Meaning
1 Affects with little degree
2 Affects something
3 Affects with average degree
4 Affects with large degree
5 Affects with very large degree
No Groups Factors affecting labor productivity Degree of importance
Increase of laborer age 1 2 3 4 5
Lack of labor experiences 1 2 3 4 5
Labor absenteeism 1 2 3 4 5
Labor personal problems 1 2 3 4 5
Labor dissatisfaction 1 2 3 4 5
Labor disloyalty 1 2 3 4 5
Misunderstanding among labor 1 2 3 4 5
1 Manpower issues
Lack of competition 1 2 3 4 5 Misunderstanding between labor and superintendents 1 2 3 4 5
Lack of labor surveillance 1 2 3 4 5 2 Leadership issues
Lack of periodic meeting with labor 1 2 3 4 5
Lack of financial motivation system 1 2 3 4 5
Lack of labor recognition programs 1 2 3 4 5
Non-providing of transportation means 1 2 3 4 5
Lack of place for eating and relaxation 1 2 3 4 5
Payment delay 1 2 3 4 5
3 Motivation issues
Lack of training sessions 1 2 3 4 5

138
Work overtime 1 2 3 4 5
Working for 7 days of week without holiday 1 2 3 4 5
Increasing No. of labor in order to accelerate work 1 2 3 4 5
Misuse of time schedule 1 2 3 4 5
4 Time issues
Method of employment (using direct work system) 1 2 3 4 5
Material shortages 1 2 3 4 5
Unsuitability of materials storage location 1 2 3 4 5 5 Materials / Tools issues
Tool and equipment shortages 1 2 3 4 5
Rework 1 2 3 4 5
Supervisors absenteeism 1 2 3 4 5
Inspection delay 1 2 3 4 5 6 Supervision
issues Drawings and specifications alteration during execution 1 2 3 4 5
Type of activities in the project 1 2 3 4 5 Construction method 1 2 3 4 5
Interference 1 2 3 4 5 7 Project
issues
Working in confined space 1 2 3 4 5
Violation of safety precautions 1 2 3 4 5
Accidents 1 2 3 4 5
Unemployment of safety officer in construction site 1 2 3 4 5
Working at high place 1 2 3 4 5
Bad ventilation 1 2 3 4 5
Insufficient Lighting 1 2 3 4 5
8 Safety issues
Noise 1 2 3 4 5
Low quality of raw materials 1 2 3 4 5
High quality of required work 1 2 3 4 5 9 Quality issues
Inefficiency of equipments 1 2 3 4 5
Weather changes 1 2 3 4 5 10 External
issues Augmentation of Government regulations related to the construction sector 1 2 3 4 5

139
Annex 2
بسم اهللا الرحمن الرحيم
غزة- الجامعة االسالمية
عمادة الدراسات العليا
قسم الهندسة المدنية– آلية الهندسة
استبيان
فى صناعة التشييدنتاجية العمالإدراسة العوامل المؤثرة في
)مشاريع البناء (
ييدالتش من البحث التكميلي لنيل درجة الماجستير في إدارة جزءوذلك آ
إعداد
زياد أبو مصطفى. م
أشراف
عدنان إنشاصي: دآتور الستاذ األ
التشييدأستاذ إدارة
2003يو ما/ هجري 1424 ربيع أول

140
بسم اهللا الرحمن الرحيم
نتاجية فى قطاع غزةإلدراسة العوامل المؤثرة في ا استبيان يهدف إلى
السالم عليكم ورحمة اهللا وبرآاته: أخي المقاول
بداية أتقدم بجزيل شكري وتقديري بالمساهمة بجزء من وقتكم وجهدآم في تعبئة هذا االستبيان
) المبانيمشاريع (نتاجية العمال فى صناعة التشييد فى قطاع غزة إإن هذا االستبيان يهدف إلى دراسة العوامل المؤثرة في من الجامعة اإلسالمية بغزة التشييدوهو جزء من البحث التكميلي لنيل درجة الماجستير فى إدارة
-:مكونات اإلستبيان
أقسامثالثةينقسم هذا االستبيان إلى
السيرة الذاتية للشرآة-أوال نتاجيةإل مدى أهتمام الشرآة بموضوع ا-ثانيا نتاجيةإل العوامل التي تؤثر فى ا-ثالثا
-:المعلومات الواردة فى االستبيان
واردة فى هذا االستبيان سوف يتم إستخدامها ألغراض البحث العلمي مع اإللتزام التام بالمحافظة على إن آافة المعلومات ال
سرية المعلومات الخاصة بكم
-الجزء األول
للشرآةالسيرة الذاتية ........................................: .................................................................... الشرآة سمأ -1 .......................................... : ................................................................... سنة التأسيس -2 )المباني( حسب اتحاد المقاولين تصنيف الشرآة -3
بتعبئة االستبيانالوظيفة األدارية لمن يقوم -4
فى الشرآة الموظفين الدائمينعدد -5
فى مجال المبانىعدد المشاريع المنفذة خالل السنوات الخمس الماضية -6
)دوالر مليون( فى مجال المبانى لسنوات الخمس الماضية خالل ا سنويا الشرآة اعمال حجممتوسط -7
درجة ثالثة درجة ثانية درجة أولى
المراقب مهندس الموقع المشاريعمدير مدير الشرآة
30اآثر من 30-2021-11 10أقل من
مليون2 من اآثر مليون2 – مليون 1.1 مليون1 – 0.51 0.5أقل من
50أآثر من 50-3031-11 10 أقل من

141
الجزء الثانى
مدى اهتمام المقاولين بموضوع االنتاجية فى شرآتكم العمالنتاجيةإيتم قياس -8
نتاجية العمال من خالل إيتم قياس -8.1
الذي يقوم بقياس انتاجية العمال فى الشرآة- 8.2
نتاجيةإلأسباب عدم قياس ا -8.3
نتاجيةإلتقوم الشرآة بدراسة أسباب زيادة ونقص ا -9
يتم دراسة أسباب زيادة ونقص االنتاجية من خالل -9.1
استشارة الخبراء المختصين فى مجال اإلنتاجية
ال احيانا نادرا غالبا دائما
ال احيانا نادرا غالبا دائما
...............................................)(...............................................................حدد ، طريقة أخرى
مراقبة العمل أثناء التنفيذ
توزيع استبيان على المهندسين والعمال فى المشروع وتحليله
أجراء مقابالت مع المهندسين والعمال فى المشروع
.....)(.........................................................................................................حدد ، أسباب أخرى
ال يوجد آوادر فنية قادرة على قياس االنتاجية
تكلفة قياس االنتاجية مرتفعة
قياس االنتاجية غير ضروري
لتقارير اليومية لحساب عدد الساعات المطلوبة النجاز العملتحليل البيانات الواردة فى ا
(...........................................................................................................)حدد ، طريقة أخرى
قياس الوقت المطلوب النجاز العمل خالل التنفيذ
(..........)حدد ، غيره مراقب مهندس الموقع مهندس متخصص

142
نتاجيةإل لتطوير ا خطة يوجد لدى الشرآة -10
نتاجيةإل لتطوير االخطة عتمد عليها ت الطريقة التى -10.1
نتاجيةإل لتطوير اخطة أسباب عدم وجود -10.2
-:الثالثالجزء
نتاجية إلالعوامل المؤثرة على ا
يرجى . نتاجية العمال فى صناعة التشييد فى مشاريع البناءإ فى الجدول التالي عدد من العوامل التي تؤثر سلبا على -11 نتاجية العمال مع األخذ بعين اإلعتبار الرموز التاليةإتحديد درجة تأثير هذه العوامل على
درجة التأثير الرمز
يؤثر بدرجة قليلة 1
يؤثر بعض الشى 2
يؤثر بدرجة متوسطة 3
يؤثر بدرجة آبيرة 4
رة جدايؤثر بدرجة آبي 5
(............................................)حدد ، طريقة أخرى االنتماء عند العمال اتجاه الشرآةتنمية روح
ال احيانا نادرا غالبا دائما
د آوادر فنية قادرة على تطبيق البرنامجال يوج
العمال فى الشرآة غير دائمين
معظم الفعاليات فى المشروع يتم تنفيذها من خالل مقاولى الباطن
(......................................................................................................)حدد ، أسباب أخرى
استخدام تقنيات الجداول الزمنية فى إدارة المشاريع دورات تدريبية للعمال اجراء
اتباع نظام حوافز لتشجيع العمال على زيادة االنتاجية التخطيط والمراقبة الجيدة للعمل

143
درجة التأثير العوامل المؤثرة على االنتاجية المجموعة الرقم
5 4 3 2 1 زيادة عمر العامل
5 4 3 2 1 خبرة العامل قلة
5 4 3 2 1 فى مجموعة العمل العمال احد او بعضغياب
5 4 3 2 1 التي يتعرض لها العاملالمشاآل العائلية والخاصة
5 4 3 2 1 )عدم وجود رضا وظيفي(عدم رضا العامل عن عمله
5 4 3 2 1 عدم شعور العامل باالنتماء والوالء للشرآة
5 4 3 2 1 التفاهم بين العمال فى مجموعة العمل عدم
عوامل متعلقة بالقوى البشرية 1 )العمال(
5 4 3 2 1وجود روح التنافس بين العمال فى مجموعة العمل عدم المسئول عن أو المهندسالتفاهم بين العمال والمراقب غياب 5 4 3 2 1 العمل
عدم مراقبة ومتابعة العمال أثناء العمل من قبل المراقب أو عوامل متعلقة بالقيادة 2 5 4 3 2 1 المهندس المسئول عن العمل
عدم عقد اجتماعات دورية مع العمال لدراسة المشاآل التي 5 4 3 2 1 تواجه العمل ومحاولة حلها
5 4 3 2 1 المادية الحوافزاستخدام نظامعدم
5 4 3 2 1 الحوافز المعنوية استخدام نظامعدم
5 4 3 2 1 توفير المواصالت للعامل عدم
5 4 3 2 1 وفير مكان للراحة واالآل للعاملتعدم
5 4 3 2 1 التأخير فى دفع رواتب العمال
3 عوامل متعلقة بالحوافز
5 4 3 2 1 حصول العامل على دورات تدريبية عدم
5 4 3 2 1 العمل لساعات اضافية
5 4 3 2 1 العمل آل أيام االسبوع بدون أخذ يوم أجازة
5 4 3 2 1 بغرض تسريع العملالعمال فى موقع العمل زيادة عدد
5 4 3 2 1 استعمال الجداول الزمنية في ادارة المشاريع عدم
عوامل متعلقة بالوقت 4
5 4 3 2 1 العمل بنظام اليومية بدال من نظام المقاولة
5 4 3 2 1 ص المواد نق
المعدات/عوامل متعلقة بالمواد 5 5 4 3 2 1 ن مكان العملبعد مكان تشوين المواد فى المشروع ع
5 4 3 2 1 ت ال واالالنقص في عدد المعدات
5 4 3 2 1 بسبب رفض العمل من قبل االشراف العملاعادة
5 4 3 2 1 غياب جهاز االشراف
5 4 3 2 1 تأخر فحص االعمال الجاهزة من قبل االشراف عوامل متعلقة باإلشراف 6
5 4 3 2 1 اثناء التنفيذ لخرائط واالتغيير فى المواصفات
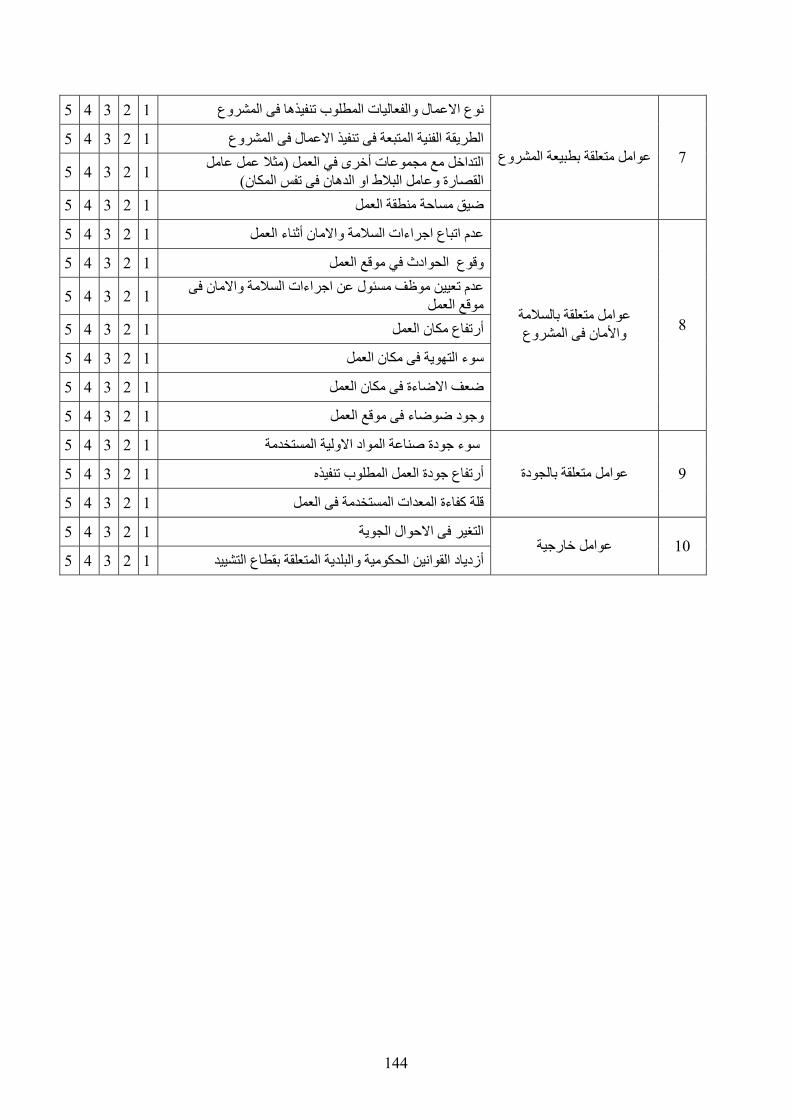
144
5 4 3 2 1 نوع االعمال والفعاليات المطلوب تنفيذها فى المشروع
5 4 3 2 1 الطريقة الفنية المتبعة فى تنفيذ االعمال فى المشروعمثال عمل عامل (التداخل مع مجموعات أخرى في العمل
5 4 3 2 1 )ط او الدهان فى تفس المكانالقصارة وعامل البال عوامل متعلقة بطبيعة المشروع 7
5 4 3 2 1 ضيق مساحة منطقة العمل
5 4 3 2 1 اتباع اجراءات السالمة واالمان أثناء العمل عدم
5 4 3 2 1 الحوادث في موقع العمل وقوع المة واالمان فى عدم تعيين موظف مسئول عن اجراءات الس
5 4 3 2 1 موقع العمل
5 4 3 2 1 أرتفاع مكان العمل
5 4 3 2 1 سوء التهوية فى مكان العمل
5 4 3 2 1 ضعف االضاءة فى مكان العمل
عوامل متعلقة بالسالمة 8 واألمان فى المشروع
5 4 3 2 1 فى موقع العمل وجود ضوضاء
5 4 3 2 1 سوء جودة صناعة المواد االولية المستخدمة
عوامل متعلقة بالجودة 9 5 4 3 2 1 أرتفاع جودة العمل المطلوب تنفيذه
5 4 3 2 1 المستخدمة فى العمل المعداتقلة آفاءة
5 4 3 2 1 االحوال الجوية التغير فى عوامل خارجية 10
5 4 3 2 1 القوانين الحكومية والبلدية المتعلقة بقطاع التشييد أزدياد


