Study into Surface Properties of
Plasma Nitrided and Laser Melted Workpieces
byMahmoud A. Mohammed, BSc. & MSc. in Petr. Eng.
Ph.D. 1998
Study into Surface Properties of
Plasma Nitrided and Laser Melted Workpieces
by
Mahmoud A. Mohammed, BSc. & MSc. in Petr. Eng.
This thesis is submitted to Dublin City University as the fulfilment of the requirement for the award of degree of
Doctor of Philosophy
Supervisors
Professor M.S.J. Hashmi
Professor B.S. Yilbas
School of Mechanical & Manufacturing Engineering Dublin City University
September 1998
DECLARATION
I hereby certify that this material, which I now submit
for assessment on the programme of study leading to
the award o f Doctor of Philosophy is my own work and
has not been taken from the work of others save and to
the extent that such work has been cited and
acknowledged within the text of my work.
rvSigned: I.D No.: 95971262
Date: 31st August, 1998

This thesis is dedicated to my beloved Mother
Wife, Teachers, Brothers, Sisters, Daughters and Son
ACKNOWLEDGMENT
First and foremost, all praise is to the Almighty, A L L A H Who gave me the
courage and patience to carry out this work.
M y deep appreciation goes to my Ph.D. thesis advisors Professor M.S.J. Hashmi
(Dublin City University, Ireland) and Professor B.S. Yilbas (King Fahd University of
Petroleum and Minerals, Saudi Arabia) for their valuable guidance throughout all
phases of this work; for checking and developing the research material; for offering
valuable suggestions and for their critical reading o f the manuscript. They were
always kind, understanding and sympathetic to me. Working with them were indeed a
wonderful and learning experience, which I thoroughly enjoyed.
Sincere and many words of thanks are due to my first teacher and father A .A . Abdul-
Nasser. Al-Hasni and his fellow students.
Last but not least, I owe my beloved family, an expression of gratitude for their
patience, encouragement, moral, and material support which made this work possible.
Title of Thesis: Study into Surface Properties of Plasma Nitridedand Laser Melted Workpieces.
Name of Student: Mahmoud A. Mohammed Student No: 95971262
ABSTRACT
The present work was carried out to study the surface properties of plasma
nitrided, T iN P VD coated and laser-melted Ti-6A1-4V workpieces. The work consists
of two phases. The first phase of the study was conducted to investigate the
tribological and mechanical properties of plasma nitriding and T iN PVD coating of
Ti-6A1-4V alloy. Specimens were nitrided in a N 2/H2 (8/2 ratio) plasma. Workpiece
temperature was varied from 450-520°C during the nitriding process. Pin-on-disc
wear tests were carried out to evaluate the wear properties of the resultant samples
and ball-on-disc experiments were conducted to measure the friction coefficient.
Micro-hardness tests, SEM, EDS and XR D were carried out to investigate the phases
developed in the nitrided zone. It was found that the wear resistance improved
considerably after the nitriding process. Three distinguished layers were identified.
These include an inner layer, where 5 -T iN + e -T ^ N phases formed, an intermediate
layer, where a -T iN with or without 8-phase developed and an outer layer, where
precipitation was dominant.
In the second phase, the surface properties of the Ti-6A1-4V alloy due to laser melting
after plasma nitriding process was investigated. A CO2 laser with nominal output
power of 1.6 kW was employed to melt the nitride layers. In order to achieve low and
high melting regions, the laser output power intensity was varied. It was found that
the laser melting altered the friction coefficient considerably as compared to untreated
samples. The microstructures were analyzed before and after the laser melting process
using SEM microphotography. It was found that the scratch developed at the
untreated surface was deeper than those compared to plasma nitrided and
nitrided/laser-melted surfaces. A mathematical model governing the laser melting
process was developed using a Fourier theory, which permitted the heating and
cooling rates to be predicted.
v
Table of Contents
Dedication (ii)
Acknowledgement (iii)
Abstract (iv)
Table of Contents (vi)
List of Tables ..................................................................................... (ix)
List of Figures (x)
Nomenclature (xiii)
CHAPTER - 1
1.1 Introduction ................................................................... 1
1.2 Literature Review ....................................................... 9
1.3 Scope of the Present Work 34
CHAPTER-II
Equipment and Procedure
2.1 Introduction 35
2.2 P V D T iN Coating 35
2.3 Plasma Nitriding 37
Declaration (i)
vi
2.4 Workpiece Material (Ti-6A1-4V alloy) 41
2.5 Material Characterization 43
2.5.1 SEM andEDS ..................................................................... 43
2.5.1.a Scanning Electron Microscopy .............................. 44
2.5.1.b Energy Dispersive Spectrometer .............................. 45
2.5.2 X-Ray Diffraction Analysis 46
2.6 CO 2 Laser Melting .......................................................... 48
2.7 Wear Testing 53
2.8 Micro-Hardness Tests 54
CHAPTER - III
Heat Transfer Modelling
3.1 Introduction 56
3.2 Mathematical Analysis ............................................................ 58
3.2.1 Step Input Intensity Laser Pulse without Convection
Boundary Conditions 59
3.2.1.a Conduction-Limited Heating 59
3.2.1.b Non-Conduction-Limited Heating 65
3.2.2 Step Input Intensity Laser Pulse with Convection
Boundary Conditions 73
CHAPTER - IV
Results and Discussions
4.1 Heat Transfer Analysis .......................................................... 80
vii
4.2 Plasma Nitriding Workpieces .......................................... 99
4.3 Microstructure ..................................................................... 102
4.4 Wear Tests 112
4.5 Micro-hardness Measurement ............................................... 120
4.6 P VD T iN Coating Samples 126
CHAPTER - V
Conclusions and Future Work
5.1 Conclusions 135
5.2 Future Work ............................................. 138
References 139
Papers in Conference & Journal ........................................... 148
viii
LIST OF TABLES
Table-2.1
Table-2.2
Table-2.3
Table-4.1
Nitriding process conditions ....................
Chemical composition o f Ti-6A1-4V alloy (% wt)
Laser parameters for surface melting process
Elemental distribution in laser melted regions
LIST OF FIGURES
Figure-2.1 Photograph of plasma nitriding unit 39
Figure-2.2 Schematic view of plasma nitriding unit 40
Figure-2.3 The base material microstructure 42
Figure-2.4 Experimental set-up 52
Figure-4.1 Variation of surface temperature predicted from the theory 82with time using Equation No. 3.11.
Figure-4.2 Variation of surface temperature predicted from the theory 83with time using Equation No. 3.40 when x=0.
Figure-4.3 Variation of surface temperature predicted from the theory 84with time using Equation No. 3.40 when x=0.
Figure-4.4 Temperature variation with dimensionless distance (x8) 86inside the material using Equation No. 3.11.
Figure-4.5 Temperature variation with dimensionless distance (x5) 87inside the material using Equation No. 3.40 when x >=0.
Figure-4.6 Temperature variation with dimensionless distance (x8) 88inside the material using Equation No. 3.40 when x >=0.
Figure-4.7 Temperature profiles inside the material predicted from 90
the theory using Equation No. 3.22 when x >=0.
x
Figure-4.8
Figure-4.9.
Figure-4.10
Figure-4.11
Figure-4.12
Figure-4.13
Figure-4.14
Figure-4.15
Figure-4.16
Figure-4.17
Variation of temperature gradient dT/dt with time predicted 92
from the theory using Equation No. 3.11.
Variation of temperature gradient dT/dt with time predicted 93
from the theory using Equation No. 3.40 when x=0.
Variation of temperature gradient dT/dt with time predicted 94
from the theory using Equation No. 3.40 when x=0.
Variation o f dT/dx with dimensionless distance (x5) predicted 96
from the theory using Equation No. 3.10 when x >=0.
Variation of dT/dx with dimensionless distance (x5) predicted 97
from the theory using Equation No. 3.40 when x >=0.
Variation of dT/dx with dimensionless distance (x8) predicted 98
from the theory using Equation No. 3.40 when x >=0.
SEM photographs of plasma nitrided cross-sectional 101
Temperature=520°C; pressure=0.5 kPa; time=65 ks.
SEM micrographs of initially plasma nitrided and later 103
laser melted of workpiece. Laser power intensity=1.2 kW;
traverse speed=0.6 m/min.
High melting region occurs close to surface (Region A 105
in figure 4.15). Laser power intensity=1.2 kW;
traverse speed-0.6 m/min.
Micro-cracks and micro-holes occur in high melting region. 107
(Region A in figure 4.15). Laser power intensity=1.2 kW;
traverse speed-0.6 m/min.
xi
Figure-4.18 Structure consists of transformed p-phase containing 109
acicular a-phase.
Figure-4.19 Structure containing transformed (3-phase comprised of 111
coarse phase.
Figure-4.20 Variation of friction coefficient with wear time. 113
Figure-4.21 Variation of wear scar depth with wear time. 115
Figure-4.22 Scar cross-section versus wear test time for plasma nitrided 117workpiece at two different temperature ranges.
Figure-4.23 SEM microphotograph of cross-section of T iN coated sample. 119
Figure-4.24 Variation of micro-hardness with distance below the surface 121for plasma nitrided and nitrided/laser-melted workpieces.
Figure-4.25 EDS spectrum of Ti-6A1-4V alloy. 123
Figure-4.26 X R D results for plasma nitrided sample. 125
Figure-4.27 SEM photograph of cross-section of T iN coated sample. 127
Figure-4.28 Wear depth with sliding time for a normal load of 50 N. 129
Figure-4.29 Wear scar width with sliding time for two normal load 130conditions for T iN coated workpieces.
Figure-4.30 Top view and cross sectional view of the workpiece. 132
Figure-4.31 Friction coefficient with sliding time. 134
NOMENCLATURE
Constants of integration
Absorption factor
V
2Va
b - ô - s / â
Specific heat capacity (J/kgK)
Heat transfer coefficient
Peak of power intensity of laser beam (W/m2)
Power intensity of laser beam (W/m2)
Thermal conductivity (W/mK)
Boltzmann’s constant
Latent heat of fusion (kJ/kg)
Inverse Laplace transformation
Laplace transform variable
q2a
Surface reflectance
Energy generation rate per unit volume
Time (s)
Temperature (K )
xiii
V : Instantaneous velocity of evaporating front (m/s)
x : Distance from the surface (m)
a : Thermal diffusivity (m2/s)
k
pcP
8 : Absorption coefficient (1/m)
p : Density (kg/m3)
0 : The temperature rises above the initial temperature = T - To
T s : Surface temperature (K )
x iv
CHAPTER- 1
1.1 INTRODUCTION
The surface treatment of engineering materials has developed rapidly in recent
years. Surface engineering technology is being used to reduce the cost arising due to
the deterioration of engineering components in service by providing acceptable
service life, reduced downtime costs and the opportunity, where possible, to repair the
part after use by re-surfacing. The cost to industry of any destructive forms of attack
is high and recognition lies behind the continuing development of the technology
known as surface engineering, which includes applications o f coatings to metal
surfaces to improve their performance in specific working conditions. A coating must
be selected according to the physical, chemical and biological characteristics of the
environment. It should also be free from defects, pinholes and mechanical damage. In
all cases, it is important to provide a good physical bond between a coating and the
surface. In many of these applications, surface coatings are used to enhance the
functional properties o f the surface. As a result, development is continuing and taking
place in all directions [1-3].
1
Surfacing technology includes welding, thermal spraying, surface treatments,
electro-deposition and vapour deposition. To begin with the first method for treating a
surface is by welding and a wide range of materials is available for welding coatings.
Welding provides the highest bond strength between the deposit and the substrate. It
is capable of applying deposits of considerable thickness, if required. In addition,
welding can be operated manually or be mechanized and programmed. Welding
processes involve application of some heat to the component, depending on the
material from which it is made and its condition. The coating material is raised to its
melting point during melt surfacing, which means that the metals and alloys used
must have a melting point less than, or equal to, that of the substrate.
Thermal spraying provides an excellent and reliable service in applications such as
aircraft gas turbine engines. Using this process both the weldable and non-weldable
materials, such as ceramics, can be deposited. In all thermal-spraying processes, the
consumable coating material fed to the spray gun is raised in temperature and
projected in a particular form to strike the workpiece. On arrival, the hot particles
form splats which interlock and gradually build up a coating of the desired thickness.
The consumables used are available as solid drawn wire for metallising processes and
in powder form for high-energy processes.
Electro-deposition is a well-established process for applying metallic coatings to
improve surface properties of materials used in engineering practice. In theory, there
is no limit to the thickness to which many metals and alloys can be electro-deposited.
Process economics is an important factor due to the cost and speed of the process
compared with other surfacing methods. The low temperature of deposition provides
2
advantages of low distortion, better access to internal surfaces and accurate control of
deposit thickness. The electro-deposition process can be successfully used to deposit
thinner engineering coatings, thus offering considerable scope and flexibility to the
designer. Electro-deposition is used extensively, not only to apply coatings to new
components, but also to restore the dimensions of parts, which have, either become
worn in service, or which have been over-machined and, therefore, are outside the
required tolerances.
Vapour deposition provides a limited range of coating material possibilities, but can
be used with materials difficult or impossible to apply by other techniques or to
produce thin coatings of controlled thickness. The involved methods are used for
producing overlay inorganic coatings, which are formed on the surface o f a substrate
by condensation or reaction from the vapour phase. The two techniques are Physical
Vapour Deposition (PVD ) and Chemical Vapour Deposition (C V D ) [14]. The
methods of PVD are vacuum deposition processes and gas sputtering processes. The
P V D coating techniques are almost wholly confined to the production of relatively
thin films (ranging from 10'7 to 10"4 m), whereas C V D is used for both thin films and
for coatings in excess o f 1 mm. The PVD techniques are many and varied and include
warm or hot treatment in vacuum, whereas C V D employs at least two highly reactive
gases, which generate the coating by high temperature reaction, either in the gas phase
or on the substrate. A ll vapour deposition processes involve treatment in a vacuum
chamber, or in one, which can withstand the high temperature, and corrosive gases.
This limits the size and shape of the object to be coated but this limitation is imposed
by the capital expenditure involved rather than by any fundamental characteristics of
the process [5].
3
P VD coating vapours are generated either by evaporation from a molten
source, or by ejection of atoms from a solid source which is undergoing bombardment
by an ionized gas (i.e., sputtering). The vapour may then be left as a stream of neutral
atoms in a vacuum evaporation, or it may be ionized to a greater or lesser extent. A
partially ionized stream is usually mixed with an ionized gas and deposits on an
earthed or biased substrate (ion plating and sputter coating), but a highly ionized
stream, which forms plasma, is attracted to a biased substrate (arc plasma
evaporation). Alternatively, a 100% ionized beam may be focused and accelerated to
sufficiently high energies to penetrate into the substrate (ion implantation) [6-11].
No vapour deposition method gives an adhesion acceptable for engineering
purposes, unless the substrate is truly clean. The standard of cleanliness involves
removal of contaminated layers. As such preparation is done in air, the most
appropriate technique is ion bombardment. The ion bombardment cleaning is
performed by a low-pressure gas discharge. The work chamber contains argon and the
workpiece is made negative with respect to earth. Positive argon ions generated in the
discharge are accelerated to the workpiece at high energies and eject surface atoms
when they impact. The substrate is thus cleaned by an erosion process which 'sputters'
contaminant and substrate atoms into the chamber. On the other hand, C V D processes
normally require that only the substrate be properly degreased and are free from
obvious oxide films. A cleaning cycle involving reducing gas at elevated temperatures
is required before the coating process begins [5,12].
Most metals, alloys, ceramics and some intermetallic compounds can be
applied as coatings either individually or as mixtures, but their characteristics often
4
limit the processes. The material/process relationship does not only identify where
they can be used together, but also determines their properties, which can be expected
from the coatings, such as density and adhesion to the substrate. It is important to
clearly define the area to be treated in order to obtain optimum results as actual
positioning of the coating. The surface treatments are, therefore, aimed to provide
resistance to various forms of wear and/or corrosion, possibly over a wide
temperature range [13-15].
The principal characteristics of the processes, which distinguish one method
from the other methods of the surface treatment, are the coating thickness, adhesion to
substrate, range of the processes and resurfacing. Although there is a lot of overlap
between the characteristics of the various processes in terms of the coating thickness,
coating rate, coating materials and the areas of application, it is difficult to make
direct comparisons because so much depends upon the applications involved.
Moreover, many of the processes are in an active stage of their evolution and the
suitability of a particular technique for any given application may change dramatically
with the advent of new development [16-18].
Coating thickness is often determined by the application and not by the process
capability. The thickness of the coating material is normally consistent with the
amount of destructive forms of attack, which can be permitted before the component
is no longer fit for use. Comparison of coating rates for a given material is
complicated by the fact that different processes use different source to substrate
distances. Virtually all process rates can be increased by a multitude of sources and by
an increase in the power input, but the coating quality may suffer if too high a rate is
5
attempted. Direct comparison of the coating cost is not generally possible, but a broad
generalization can be made. In addition, correctly selected materials and properly
operated processes provide a metallurgical bond to the substrate, which withstands
thermal and mechanical shock without detachment. Moreover, most processes are
used for the application of surface coatings, bringing the operation within the scope of
most engineering activities and enabling on-site work to be carried out in certain
circumstances. Furthermore, the opportunity to carry out repairs on worn parts,
whether previously coated or not, is a feature exploited in many industries [19-21].
Notwithstanding the continuous efforts in developing advanced processing
methods or new findings in surface modification, the basic understanding for the
appropriate assessment of surface layers still remains very challenging. In this regard,
plasma nitriding or ion nitriding has been a well-known technique for many years.
Although the process is well-developed, several scientific questions on the basic
understanding of the process and limits concerning its upscaling for industrial use still
remain to be investigated [22-24].
Plasma nitriding, plasma carburizing and plasma carbonitriding are the most
frequently used plasma diffusion techniques for the surface treatment of various
mechanical parts in industry [25]. The basic concept in using ion implantation to
improve the surface properties of a titanium alloy is the possibility of forming nitrides
or carbides below the surface by means of either nitrogen or carbon ions. Titanium
nitrides and carbides are hard materials, which can improve the tribological properties
of the surface, i.e., increase the wear resistance and surface hardness. It has been
demonstrated that when nitrogen forms a solid solution as a consequence of
6
implantation in titanium, it results in the hardening of dislocation-pinning effects
[26,27],
Titanium and steels with alloying elements are suitable for thermal and plasma
nitriding [28]. Two major methods are generally used for titanium nitride synthesis,
abbreviated for simplicity as TiN : (a) T iN molecules are formed in the gaseous phase
and then deposited on a substrate; (b) nitrogen atoms are allowed to diffuse into the
titanium matrix. With regard to T iN deposition, two techniques can be utilized, i.e.,
P V D and C VD . In both techniques titanium reacts with nitrogen in the gaseous phase
to form TiN . The formation of T iN molecules can occur either in the gaseous phase or
on the surface. The first process involves excited states of both titanium atoms and
nitrogen molecules, while the second mechanism involves a recombination reaction
between T i and N atoms on the surface [29,30].
Titanium and its alloys are widely used in industry owing to their outstanding
properties, which include light weight, excellent strength-to-weight ratio and high
corrosion resistance due to their electro-negative potential [31-33]. Consequently, Ti
and its alloys such as Ti-6A1-4V have been used in the aerospace industry as well as
in the chemical and automobile industries. Since the tribological properties of these
alloys are quite poor [26,34], they require some form of surface treatment in
engineering applications such as gears and bearings. In order to improve the
tribological properties, many surface engineering techniques (e.g. plasma nitriding
and ion implantation, thin film oxidation coating, laser and electron beam treatment)
have been applied to the surface of titanium and its alloys. Titanium, with alloying
elements such as aluminum, chromium, molybdenum, vanadium and tungsten, is
7
suitable for thermal and plasma nitriding [35-37], since these elements have a strong
affinity for nitrogen, which in turn plays an important role in surface hardening
[28,38].
Multiple treatment of a surface may introduce properties that are unobtainable
through any single surface treatment process [39-41]. The ferrous alloys can be
hardened to considerable depths through solid-state thermo-chemical diffusion
treatments. This technique however, is not yet available for titanium alloys with deep
penetrated layers. In this case, the use of a high-energy beam may appear to be the
most promising tool for deep penetration for surface melting or alloying. The need for
a deep case in components being in contact is due to the development of the
maximum shear stress in a substance at some depth below the surface [42]. Many
factors affect the shear stress distribution (including contact geometry, the elastic
moduli etc.). Consequently, changing the mechanical properties of the sub-surface
may influence the surface properties. Increasing the strength modulus of the sub
surface causes an increase in holding the maximum shear stress. Laser heating is,
therefore, a potential candidate to improve the load-bearing ability of the primary
treated surfaces [43,44]. The presence of an alloying substance alters the nucleation
conditions, but basically the experience gained in re-solidification processes can be
applied. The laser offers the possibility of various types of surface treatments. The
properties of a laser beam provide the formation of the micro-structures and hence the
desired characteristics can be achieved by alternative methods. Laser melting of a
surface, therefore, becomes necessary [45,46],
8
1.2 LITERATURE REVIEW
Field experience with TiN-coated cutting tools over the last few years
demonstrated their increased performance compared to non-coated tools. A large
number of laboratory pin-on-disk tests were performed by Malliet et al. [47] to
investigate the specific interaction between T iN and a chromium steel counter-body.
Based on an analysis o f the wear track appearance, the friction coefficient and the
wear debris, two wear modes were identified. The occurrence of these wear modes
and a transition between them were analyzed as a function of the surface roughness of
the T iN coating and the normal load applied. It appeared that two wear modes were
predominant in a load-roughness plane. An adhesive transfer of steel material onto the
T iN coating, resulting in a steel-steel wear system characterized wear mode-1. I f the
imposed normal load and/or the original roughness of the T iN coating is above a
critical value, a mainly abrasive wear mode-2 appears after a varying time interval,
and the actual wear is then a combination o f both wear modes.
The effects of nitrogen ion implantation on the mechanical properties of
metallic surfaces commonly encountered in machine building, such as electroplated
hard chromium, sacrificial phosphate coating on cast iron, and plasma-face-coated
hard molybdenum were studied by Fischer et al. [48]. It was found that ion
implantation is capable of improving substantially the tribological properties of
common mechanical parts without special pre-treatment. The standard production
samples, with no special surface preparation prior to the treatment, were investigated.
This made results immediately relevant to a production environment. In the parameter
range explored, the treatment resulted in up to 31% wear reduction and 79% friction
coefficient reduction for the chromium surface; and up to 24% wear reduction and
13% friction coefficient reduction for the phosphate coating; and up to 90% wear
reduction (to a tenth of the original value) and 84% surface hardness increase for the
molybdenum deposit. The mechanisms responsible for the observed effects were
discussed and the trends in the tribological properties as a function of ion energy and
dose were defined. These results demonstrated the potential of employing ion
implantation in industrial applications.
Friction tests were performed by Singer et al. [49] on TiN-coated substrates at
low speed (less than 0.1 m/s) in air. Optical and scanning electron microscopy, Auger
electron spectroscopy and transmission electron microscopy (TEM ) were used to
characterize the transferred films and debris generated during sliding against steel and
sapphire balls. Friction coefficients were correlated with the formation of transfer
layers, the accumulation of debris in wear tracks and the structure and composition of
transfer films and debris. In addition, friction coefficient of steel against rougher (Ra ~
60-100 nm) T iN coatings started and remained relatively high (0.5-0.7) owing to wear
and transfer o f the steel. After the T iN coating was polished (Ra ~ 4 nm), transfer was
reduced and the initial friction coefficients ranged from 0.15 to 0.2. The initial friction
coefficients with sapphire balls sliding against polished T iN were even lower.
However, friction coefficients with both types of balls increased as debris formed and
transferred to the wear track. Auger analysis showed that the steel balls accumulated
metallic iron and/or iron oxide as well as titanium oxide layers and debris, whereas
the sapphire balls acquired only titanium oxide transfer layers. TEM of debris stripped
from contact areas o f the steel and sapphire balls identified the phases o f debris as a
rhombohedral ternary oxide (FeTiOa/ a-Fe2Û 3) and rutile (T i0 2 ) respectively.
10
Chemical interaction between the transfer films led to an increase in the friction
coefficient. Wear o f T iN during low friction sliding took place in two stages. An air-
formed oxide layer on T iN was transferred to the ball. Then, oxide debris was
transferred back to the T iN surface. A thermo-chemical basis for oxide debris
formation was given and the friction behaviour was interpreted in terms of an oxide
wear mechanism.
The microstructure of Ti/TiN multilayer films deposited by hollow cathode
discharge ion plating was studied by Huang et al. [50] using transmission electron
microscopy and jx-^-diffraction in combination with X-ray diffraction. It was found
that the Ti/TiN multilayer films consisted of hexagonal a -T i, tetragonal s-Ti2N and
cubic 8-TiN. They had a clearly layered structure of Ti/Ti2N/TiN/Ti2N/Ti ..., with
single layer thickness of titanium and T iN ranging from several to several hundred
nanometers. Interfacial chemical reaction during deposition produced a T i2N
transition layer between every adjacent pair of titanium and T iN layers. A transition
layer o f FeTi between the film and the substrate was observed, which resulted in good
adhesion between the film and the substrate. Ti/TiN multilayer films had fibrous
crystallites. The grain size of both titanium and T iN decreases with decreasing
nominal single layer thickness of Ti/TiN films. The hardness of Ti/TiN films
increases at first with decreasing nominal single layer thickness and then decreases.
Nitrogen ion implantation into titanium and Ti-6A1-4V was conducted by
Mucha and Braun [51] at an acceleration voltage of 80 k V and with target
temperatures between 30°C and 450°C during irradiation. It was found that the
o p tim u m wear characteristics were obtained at a temperature of around 450°C using
ball-on-disc tests. Auger electron spectroscopic and Rutherford backscattering surface
analyses showed that there was a saturation dose above which no further nitrogen was
retained in the material of the ion-implanted samples. The improved wear
characteristics are attributed to precipitation of T iN , which is assumed to be promoted
by the higher temperature employed. No dependence of the wear properties on the ion
flux was observed within the range of ion beam current densities studies (i.e., 1-15
pA/cm2), experiments in which no temperature control exists may result in mistaken
interpretations since target temperatures rise with the increase in the ion beam flux.
The target temperature during nitrogen plasma source ion implantation of T i-
6A1-4V was estimated by Chen et al. [52], The diffusion coefficient was measured by
comparing measured nitrogen concentration profiles to Monte Carlo simulations. The
high-temperature nitrogen treatment can increase the thickness of the implantation-
affected zone from 2 0 0 0 A to approximately 5 0 0 0 A on Ti-6A1-4V. Auger electron
results indicated that the affected zone o f implantation was about 0.5 pm thick.
Surface Knoop hardness improved from 400 to 900 H K for one gram applied load.
The wear behaviour was studied using a pin-on-disk wear tester. The wear data
showed a factor of 30 increase in wear lifetime. The failure criterion was chosen to be
1 (j,m wear depth. After high-temperature nitrogen treatment, the wear behaviour of
Ti-6A1-4V was as good as that of cobalt-chromium alloy.
The effect o f ion implantation on the friction and wear behaviour of 304
stainless, A IS I 1010 and D2 tool steels was investigated by Mehrotra et al. [53]. The
stainless steel specimens were implanted with approximately 20% N, and those of
1010 and D2 tool steel with approximately 20% Ti and 14-20% C. The ion-implanted
12
specimens were characterized using XRD, optical microscopy, Auger electron
spectroscopy and wavelength dispersive X-ray spectroscopy. The friction and wear
tests were performed on ball-on-disk and pin-on-disk machines. In the pin-on-disk
tests, the ion-implanted pin specimens were rubbed against steel (heat treated to Rc
62-64) disks lubricated with tool and instrument oil. In the ball-on-disk method, the
disk specimens were rubbed against 440 C steel balls under dry conditions. Scanning
electron microscopy of the wear tracks on disk specimens was performed to
investigate the wear mechanism. The results indicated that wear rates of the T i + C
implanted specimens of 1010 and D2 tool steel were lower than those of the non
implanted specimens. Mixed results were obtained for the effect of nitrogen
implantation on the wear of 304 stainless steel.
Various potential surface treated materials paired with multiple cathodic arc
plasma deposition T iN coated specimens, to be used for screw and rollers, were tested
by Su et al. [54] on an oscillating wear machine under reciprocating wear conditions.
The processing parameters of the T iN coatings, including the bias voltage, arc current
and partial pressure of N 2 was optimized before the wear testing. The polishing pre
treatment of the substrate yielded the highest wear resistance. The indentation test
showed that adhesive strength decreased with increasing coating thickness. I f the
coating was too thin, it was easily worn through. The optimum coating thickness was
3 (xm. It was concluded that PVD coated T iN paired with surface treated specimens
possessed less wear resistance under HD 150 and base oil lubrication. Under water-
based cutting fluid, the self-mated T iN and TiN-surface treated specimen pairs
showed no measurable wear, only surface polishing on the T iN surface was noticed.
They were potential sliding pairs for T iN coating in machine element applications.
13
The wear mechanisms of T iN included local flaking of the coating layer at the edge of
the wear scar, surface polishing and surface pitting under oil-lubricated wear. The
wear mechanisms under dry wear resulted in a residual T iN unworn layer with or
without a transferred layer. The exposed substrate region covered with a transferred
layer in suitable sliding pairs were self-mated T iN and TiN-surface treated specimens
under cutting fluid lubrication, and carburized specimens paired with T iN coated
specimens under base oil lubrication.
Ball-on-disc experiments were performed by Vancoille et al. [55] under dry
sliding ambient conditions to characterize the tribological of T iN , (Ti, A l) N, and
Ti(C , N ) coatings. The coefficient of friction and the wear resistance against a
corundum counterbody were determined as a function of the coating composition and
the sliding speed. The wear of the (Ti, Nb)N coatings were found to be comparable to
that of the T iN coatings and this was related to the formation of a similar type of
oxide in the tribo-contact. In the case of the (Ti, A I)N coatings, the wear volume
increased markedly as the aluminum in the coating increased, and the tribo-oxide
formed was found to be A b T iO j. Ti(C , N ) coatings, which exhibited an extremely
low, wear because of the low coefficient of friction. A mild-oxidational wear model
was found to give a qualitative fit to the experiments. Measuring the coating wear as a
function of the sliding speed opened the possibility of calculating the activation
energy for the tribo-oxidation processes of thin coatings.
Su and Lin [56] investigated, through wear testing, the potential for carburized
and nitrided surface treated steels and the TiN , CrN and T iN + CrN physical vapor
deposited (PVD ) surface treatments to be used in the screw and rollers of the variable
14
lead screw transmission mechanism (VLSTM ). Indentation test results revealed that
the thicker the PVD CrN coating, the lower was its adhesive strength, with the desired
coating thickness being 10 urn. Surface treated steels (upper moving specimen)
paired with P VD coated parts possessed very poor wear resistance under base oil
lubrication, even worse than under dry wear. Suitable sliding pairs for V LS TM
applications included: surface treated steels paired with either SKH51 or PVD coated
specimens under cutting fluid lubrication; PVD coated specimens paired with SKH51
specimens under cutting fluid lubrication; and PVD coated specimens paired with
PVD coated specimens under base oil and cutting fluid lubrication.
The wear mechanism of high-speed steel coated with T iN by arc ion plating
during sliding against alumina and AISI 52100 steel under lubricated conditions was
experimentally investigated by Yoon et al. [57]. The results showed that a transition
in the wear behaviour occurred after a defined period of sliding time for both o f the
countermaterials. Examinations of samples showed that the wear transition
mechanism differs, however, depending on the countermaterials. When slid against
alumina, which was harder than the coating, the coating wore slowly by abrasion in
the initial stage until the substrate was exposed, this led to the onset of rapid substrate
abrasion in the following wear stage. The time required for this transition did not
relate to the substrate hardness but increased with increasing coating thickness and
decreasing applied load. On the other hand, when slid against A ISI 52100 steel, which
was softer than the coating, the coating did not wear significantly in the initial stage,
but delaminated abruptly after a definite sliding time only under heavy loads. The
time required for this delamination increased with increasing substrate hardness and
decreasing applied load, and there existed an optimal coating thickness for the
1 5
delayed coating delamination. It was suggested that severe plastic flow in the form of
twins observed in the substrate at the vicinity of the interface could play an important
role in this coating delamination.
Shehata et al. [58] used a 400 W pulsed N d :Y A G laser to alloy BN and Ti/BN
on A IS I M2 steel using hexagonal B N powder and T i foil (25 jam thickness). The
clearance (flank) faces of the single-point tool were lasers alloyed using BN and
Ti/BN. Optical metallography, scanning electron microscope, Vicker's microhardness
and X-ray diffraction were employed to characterize the alloyed layers. The depths of
the laser-alloyed zones of BN - and Ti/BN-alloyed tools were about 140 (am and 260
[am respectively. The hardness of the laser-alloyed layer with BN was about 640 H V
while that of the alloyed layer with Ti/BN was about 680 H V. The alloyed layers were
free from cracks and porosity. Both the alloyed and unalloyed tools were then tested
on a 14.7 kW engine lathe to turn AISI 1045 steel workpieces. The results indicated
that the tool life of BN-alloyed tools was about 200% higher than that of the
unalloyed tools, while the tool life of Ti/BN-alloyed tools was about 260% higher
when the tool life criterion was chosen as 0.3 mm flank wear. Also, about 30% and
50% for BN-and Ti/BN-alloyed tools reduced the tool wear rate, respectively. The
reduction in tool wear o f the alloyed tools was attributed to a reduction of the chip-
tool contact length and to the different chip formation mechanisms. Consequently, the
friction coefficient between the tool and the workpiece material was reduced.
Stappen et al. [59] pointed out that it is possible to optimize the adhesion of a
T iN coating on some pre-nitrided tool steel surfaces. Two industrial applications were
chosen to demonstrate the possibilities of tools treated by the duplex process. A steel
16
milling tool consisting of 14 high speed teeth and knives made o f M2 tool steel for
tube cutting were plasma nitrided and subsequently PVD coated. Applying different
intermediate steps between the nitriding and coating processes could obtain a good
coating adhesion. Scratch tests were used to evaluate the adhesion behaviour of both
coating systems. After producing a certain number of workpieces, the laboratory
performance of the duplex treatment was compared with tool wear and lifetime
evaluation data from industry. It was found that the duplex treatment gives a much
better wear resistance for both applications, resulting in a reduced cohesive failure
pattern. Extrapolation of laboratory performance to industrial conditions seems to be
possible if a close collaboration between industry and research groups is set up.
A test machine with a thrust-washer adapter was used to carry out experiments
by Lin and Homg [37]. A rotating upper specimen was pressed against a stationary
lower specimen. This setup was employed to simulate the surface contacts between
the steel (o f the ring) and the titanium nitride coating (on the washer). The existence
of an electroless nickel interlayer on the washer was also investigated. The effect of
the coating layers on the tribological behaviour was evaluated for different thickness
combination of the titanium nitride layer (top layer) and the electroless nickel layer
(interlayer). The interlayer was found to increase the wear volume, but was
advantageous for strengthening resistance against chemical corrosion. The wear
volume was controlled by the thickness of the two coating layers. A thicker T iN layer
in conjunction with a thinner interlayer constituted the appropriate combination for
two coating layers from the viewpoint of lowering the wear volume. The friction
coefficients arising from the T iN coating generally varied in the narrow range
between 0.5 and 0.55, regardless of the interlayer thickness. The applied load and the
17
sliding speed affected both the friction coefficient and the wear volume very much. In
the test operating conditions, the primary wear mechanisms of the coating layers, such
as micro-abrasion, semicircular or curved cracking, plucking and grooving,
characterized the surface failures. The surface failures due to friction and wear that
occurred within the top layer appeared to be nearly independent of the adhesive
strength of the interface.
A ball-on-disc testing machine was used by Huang et al. [60] to investigate the
sliding friction behaviour o f PVD TiN , CrN and (T iA l)N coatings against steel under
both dry and lubricated conditions. Different applied loads and sliding speeds were
employed. The initial transient state and the steady state characterized the curves of
friction coefficient versus sliding distance for the coatings was investigated, and the
friction behaviour during the initial transient state and the steady state could be
determined. The results showed that (T iA l)N coating which had the highest hardness
and surface roughness exhibited the highest friction coefficient under both dry and
lubricated conditions and vice versa. The friction coefficient of all investigated
coatings could be significantly reduced by lubrication.
Hogmark and Hedenqvist [61] presented the methods used for mechanical and
tribological characterization of thin, hard coatings. The tribological tests included dry
sliding wear, solid particle erosion and micro-abrasion. In addition to tribological
characterization, the thickness, hardness, adhesion, and residual stress state were
assessed. The survey showed that the tribological performance of a coating could not
be predicted by one single parameter. A general tribological characterization o f a
coated component had to encompass several reproducible lab tests to obtain a
18
tribology profile, The performance of the best combination for any given application
could be achieved.
Dingremont et al. [62] commented on multifunctional coatings combining a
nitriding treatment and physical vapour deposition to allow the performance of cutting
and forging tools to be boosted. The improved mechanical support of the coating
makes them withstand higher loads. This treatment was used for wear parts made
from construction steels to increase their fatigue and wear resistance. Hard coatings
applied on nitrided layers could replace or enhance the e or g' layers currently used.
These treatments were made in a discontinuous mode using dedicated equipment for
the nitriding and coating treatment or in a continuous mode, i.e. directly in the coating
reactor. These treatments were applied and optimized for construction steel 35NCD16
and hot working steel Z38CDV5-1. Coating conditions had a decisive impact on the
thermal stability of the iron nitride layers. This aspect was studied and several
technical solutions were identified. Finally, it was shown that in contradiction to
previous findings the coatings had only a negligible influence on the stress intensity in
the nitrided zone.
Muller et al. [63] studied the interface fracture toughness and the fracture
energy o f the coating systems of T iN on high speed steel (HSS), and titanium on
austenitic steel, copper and HSS that were measured by three-point bend test. The
interface fracture toughness and especially the fracture energy can be used to
characterize the adhesion strength of a coating system. The coatings were produced
by a magnetron sputtering process. The average thickness and a negative bias voltage
were chosen to show the effects o f the process parameters on the fracture energy. The
19
mechanical data were compared with micro-hardness and scratch test data obtained
from samples subjected to an identical treatment. The results demonstrated that the
trends of the experimental data observed with different testing methods differ
significantly, since the contribution of the interface and bulk properties of the coating
and the substrate material were different.
The oxidation behaviour of the CrN and T iN hard coatings prepared by
reactive sputtering at 200 °C was studied by Milosev et al. [64] using X-ray
photoelectron spectroscopy (XPS). The formation of thin surface over-layers on top of
the nitride coatings was observed even at room temperature. At elevated temperatures
the mechanism of nitride oxidation proceeds by a progressive displacement of
nitrogen by oxygen. At sufficiently high temperatures a tendency towards phase
separation between the nitride and oxide was observed, resulting in the formation of
& 2O 3 and TiC>2 layers, respectively.
Alonso et al. [65] investigated the effect of C+, N + and 0 + light ions
implantation on the properties of Ti-6A1-4V alloy. Energies from 50 to 180 keV and
doses o f the order o f 10 17 ion cm'2 were used by keeping the substrate temperature
below 500°C. Mechanical properties were evaluated by means of micro-indentation
tests with a loading and unloading cycle at loads up to 10 mN. An increase of more
than 100% in the surface hardness was observed in most of the implanted samples.
Pin-on-disc wear tests under lubricated conditions were carried out to evaluated and
compare the tribological behaviour of implanted samples against ultrahigh molecular
weight polyethlene. A decrease in the friction coefficient from 0.1 to 0.05 was
observed due to ion implantation. Unlubricated wear tests using an alumina ball on a
2 0
Ti-6A1-4V disc were also performed. Optical profilometry and scanning electron
microscopy showed that implantation can improve the abrasive wear resistance by
two orders of magnitude. X-ray photoelectron spectroscopy analyses showed the
presence of hard phases such as oxides or carbides in the implanted samples.
Larsson et al. [66] presented the development o f multilayered coatings with
increased fracture resistance, retained hardness and adhesion to the substrate. One
way o f obtaining this effect was to deposit multilayered coatings consisting of
alternating thin layers of hard and softer, more ductile materials. A modified
commercial P VD deposition process was used for the deposition of multilayered T i-
T iN coatings on both high speed steel (HSS) and cemented carbide (CC) substrates in
order to explore this idea. The multilayer coatings were evaluated with respect to
fundamental properties such as morphology, microstructure, hardness, adhesion and
fracture resistance. The deposition process was found to yield well-adhered coatings
with an increased fracture resistance due to the multilayered structure, on both HSS
and CC substrates.
Ma et al. [67] carried out a study to establish the mechanical properties of
single and multilayer hard coatings. However, the mechanisms of deformation,
cracking and delamination of coatings under ploughing and shear stress were not fully
understood. A fractured cross-sectional specimen preparation technique through
hardness indentation and scratch tests on hard coatings was used in conjunction with
high resolution SEM to observe the deformation and fracture behaviour occurring as a
result of these tests. T iN and T -T iN multilayer coatings were deposited on M2 high
speed steel and silicon substrates using an unbalanced magnetron sputtering system.
21
Hardness measurements and scratch tests were performed to monitor the mechanical
properties. X -ray diffraction was used for phase identification. Coatings comprising
fine columnar T iN behaved like closely congregated strong fibers: they were found to
accommodate a large amount of ploughing and shear stress through densification and
shear deformation. On increasing the load above a certain value, rupture of heavily
deformed T iN initiated at defect locations and the cracks propagated and coalesced
into macro-cracks. When the applied load was increased to near the critical load, the
close packed columns separated from each other and detached from the substrate,
resulting in total failure. For T i-T iN multilayers, hardness and critical load were
related to the different monolayer thickness of the Ti and TiN . The T i layers dissipate
most o f the energy by means of shear deformation during the scratch test. At higher
scratch loads, cracks occurred at T i-T iN interfaces or multilayer-substrate interfaces
depending on the relative interface strengths.
Bienk et al. [68] studied the tribological properties of physically vapour
deposited coating of T iN , T iA IN and CrN deposited on discs made o f two different
tool steels using different pin-on-disc test procedures. The wear resistance was
determined by using an A120 3 ball while the friction properties were studied by using
a flat steel pin under low load. By a step-load test using a steel ball, the seizing and
adhesive wear investigated. The results showed that all the tested P V D coatings
improved the performance of the samples, reducing seizing and wear considerably.
T iA IN exhibited the most stable friction and wear mode and best properties compared
with T iN , T iC N and CrN under conditions where unlubricated friction and severe
seizing against steel occur. This is attributed to a stable aluminium oxide surface
layer. The wear tests against A I2O 3 showed that the Ti-based coatings reduced the
2 2
severe wear of the uncoated hardened steel by about 4 times while the softer but more
ductile, CrN, reduced the wear by a factor of 2. In particular, the results for T iA IN
seem to be in very good accordance with practical results from field tests. I f proper
test procedures are applied, the pin-on-disc test can make up a relevant and
convenient test method for evaluating some of the fundamental tribological properties
o f P VD coatings.
The erosion-corrosion behaviour of TÌ-6A1-4V exposed to air environment up
to 800°C was studied by Zhou and Bahadur [69]. Erosion experiments were
performed in a sandblast type of test rig at seven different temperatures. The
specimens were heat treated by annealing and solution treating and aging. The target
specimens were eroded with 120 grit silicon carbide particles at impact velocities
from 55 to 110 m/s and impingement angles from 10 to 90°. The oxidation behaviour
and the morphological features of the eroded surfaces were studied by scanning
electron microscopy and the deformation characteristics of the oxide scales were
determined by static indentation tests. It was found that the erosion rate increased with
the temperature ranging from 200 to 800°C where the increase in erosion rate with
temperature was fairly rapid within the range of 650 to 800°C. Oxidation was also
fairly high in this temperature range and the interaction between the erosion and
corrosion was quite significant.
Robinson and Reed [70] reported the effect of laser surface treatments on the
water droplet erosion resistance of a commercial alloy of nominal composition T i-
6A1-4V. Use was made o f a continuous wave CO2 laser to melt the TÌ-6A1-4V in both
inert and dilute nitrogen atmospheres. The gas composition of the atmosphere was set
2 3
at either 100% Ar, 90 Ar + 10% N2 or 80% Ar + 20% N2 by volume. The successive
inter-track overlap was set at either 50% or 75% of the surface width of a single melt
track. The cumulative mass lost during water droplet erosion of the laser surface
melted material decreased substantially relative to the untreated material for all
processing conditions examined. The enhanced erosion resistance was attributed to
the increases in the surface layer micro-hardness as well as the resistance of the
martensitic microstructure to the hydraulic penetration mechanism of erosion. The
benefits of nitrogen alloying over surface melting in an inert environment were not
substantial, but this might be attributed to the pre-existing micro-cracks in the
nitrogen alloyed surface layers.
The ability of the laser nitriding process to improve the water droplet erosion
resistance of Ti-6A1-4V alloy was studied by Gerdes et al. [71]. Using a C02
continuous laser, a layer of about 400 (am thickness was nitrided and another layer of
400-500 (im was only heat affected. Electron microscopy observations showed that
the micro structure of nitrided layers consisted essentially of TiN compounds which
were embedded in Ti(a) matrix. Depending on the nitrogen concentrations within the
feeding gas, the titanium nitrides exhibited plate-like shape or dendritic morphologies.
Below the nitrided layer a thickness of 50-100 (am of samples underwent martensitic
structure which in turn gives rise progressively to bimodal (a+P) base material. Laser
nitriding increased micro-hardness from 370-400 to 650-800 HV, and enhanced
erosion resistance significantly compared with untreated Ti-6A1-4V and hardened
12% Cr stainless steel. The mechanism of material removal by erosion was changed
from work hardening and platelets detachment in untreated samples to brittle fracture
by formation of large flakes and spalling in nitrided layers. Advanced stages of
erosion were accompanied by the appearance of macro-creaks often in the nitrided
zone, but some of them propagate even into the heat-affected area. The annealing at
650 and 700°C of the laser-nitrided samples resulted in the precipitation of b phase
rich in vanadium.
The tribological properties of plasma nitrided hot-worked tool steel AISI HI 1
were examined by Yilbas et al. [72]. Different nitriding temperatures and duration
were considered. To characterize the composite structures, wear tests, XRD analysis,
SEM and micro-hardness tests were carried out. The nitride zone depth was measured
using the nuclear reaction analysis (NRA) technique. The micro-hardness, wear
properties and morphology were considerably affected by plasma nitriding. As the
process temperature increased, the depth profile of the nitrided zone was increased.
They also found that an increase in nitriding time and process temperature resulted in
the increase in the compound layer thickness. A microphotograph of nitride zone
showed that almost homogeneous precipitation occurred in the cross-sectional zone.
The surface nitridation of titanium was carried out by Kobayashi [73] at a low
pressure in nitrogen atmosphere using a gas tunnel type plasma jet. The TiN film
could be formed in 10 seconds (10 p.m thick and 2000 HV) The TiN ratio was 91% on
the surface of the TiN film and the structure was approximately homogeneous over
the irradiated surface. The structure of the TiN film was analyzed using XRD and the
surface of the film was measured by Vickers hardness testing machine to investigate
the effects of the deposition conditions on the properties of titanium nitride films. The
measured values of both the Vickers hardness and the TiN ratio were directly related
to the TiN film thickness.
25
Cold forging of spur gears from Ti-6A1-4V material was introduced by Yilbas
et al. [74]. Plasma nitriding was carried out to improve the surface properties of the
resulting gears. Nuclear reaction analysis was conducted to obtain the nitrogen
concentration whereas the micro-pixe technique was used to determine the elemental
distribution in the matrix after the forging and nitriding processes. Scanning electron
microscopy and XRD analysis were used to investigate the metallurgical properties
and the formation of nitride components in the surface region. Micro-hardness and
friction tests were carried out to measure the hardness depth profile and the friction
coefficient at the surface. Scoring failure tests were conducted to determine the
rotational speed at which the gears failed. Three distinct regions were obtained in the
nitride region, and at the initial stages of the scoring tests, failure in surface roughness
was observed in the vicinity of the tip of the gear tooth. This occurred at a particular
rotational speed and work input.
The tribological behaviour of specimens coated by two layers, titanium nitride
film as the top layer and titanium film as the under layer were studied by Guu et al.
[75]. The coating layers of the bottom specimens were deposited using the cathodic
arc ion plating process. Experiments were carried out on a wear test machine using a
thrust-washer adapter to simulate the surface contacts between the steel ring (the
upper specimen) and the titanium nitride coated washer (the bottom specimen). The
influence of the thickness of the two coating layers on the tribological behaviour,
wear mechanism, specimen hardness and adhesive strength were addressed. A thin
titanium nitride film in combination of a thick titanium film attenuates the adhesive
strength, resulting in a significant increase in the wear rate. The influence of the
titanium nitride on titanium film on the friction coefficient was quite limited at higher
26
sliding speeds. The specimen's hardness was increased by thickening the titanium
nitride layer, but it was lowered by increasing the titanium thickness. When the
specimen's sliding speed was increased, both the wear rate and the friction
coefficients showed significant reduction.
Guu and Lin [76] made comparison of some tribological parameters for
specimens coated with titanium nitride as the top layer but using different materials as
the underlayer. For the specimens coated by the cathodic arc plasma deposition
method, electroless nickel films of various thicknesses were deposited as the under
layer. For the specimens coated by the cathodic arc ion plating method, a titanium
film with various thicknesses was deposited as the under layer. The tribological
performance of the two kinds of coating specimens was compared for the following
parameters: wear rate, friction coefficient, adhesive strength, and specimen's hardness.
The role of the thickness of the two different coating layers, and of the material of the
underlayer on the friction and wear behaviour was investigated.
The pressure-distance scaling law for pulsed laser deposition was examined by
Kwok et al. [77] for several thin film systems. This scaling law was due to the plasma
dynamics occurring within the laser plasma plume near the location of the substrate.
Time-of-flight studies of both the ions and the neutrals confirmed the existence of an
optimal velocity distribution for optimal film deposition. Fast ions played a major role
in determining the quality of the films deposited. They might provide surface
activation of the film or induce damage to the film depending on their kinetic
energies.
27
Krebs et al. [78] characterized the pulsed laser deposited (PLD) metallic alloys
and multilayers by the formation of amorphous or metastable nano-crystalline phases
with the high solid solubilities, the unusually enlarged lattice spacing in growth
direction and the intermixed interfaces. The differences between the sputtered and the
evaporated samples were discussed with respect to the high instantaneous deposition
rate, which was about 10 5 times greater than that for the sputtering or thermal
evaporation processes. In addition, the high kinetic energy of the deposited particles
of up to more than 100 eV at high laser fluxes inducing atomic mixing produced a
large number of defects and a high stress in the deposited films.
Xingzhong et al. [79] investigated the wear behaviour of Ti (C, N) ceramic
when cutting the austenic stainless steel AISI 321. The wear tests were carried out on
a pin-on-disc tribo-meter, which could simulate frictional characteristic a real cutting
process. The selected load range was 58.8 - 235.2 N; the selected speed range was 0.8
- 3.2 m/s. The test results showed that the wear of Ti(C, N) ceramic was mainly
caused by adhesion between the rubbing surfaces; the wear increased with increasing
load and increasing speed. When oil was used for lubrication, the friction coefficient
of the sliding pairs and the wear rate of the ceramic were reduced. Scanning electron
microscopy, energy-dispersive X-ray analysis and X-ray diffraction analysis were
used to examine the worn surfaces.
Plasma spray coatings were evaluated by Davis et al. [80] as surface
treatments for aluminum, titanium and steel substrates prior to adhesive bonding.
These treatments were environmentally benign in that they involved no chromates and
emit no liquid or gaseous wastes. The coatings could be engineered for specific
28
applications and were better suited for localized repair than chemical processes. For
aluminum adherends, a polyester coating gave a performance equivalent to that of the
best chemical treatment (phosphoric acid anodization) for some epoxy adhesives.
With stronger, tougher adhesives, a Ti-6A1-4V coating provided improved
performance to match that of phosphoric acid anodization. A Ti-6A1-4V coating on
titanium substrates exhibited identical initial strength and durability to the best
chemical controls under moderate temperature conditions. At high temperatures, the
plasma spray coating continued to exhibit excellent durability while oxide-based
treatments readily failed due to oxygen dissolution into the metal. For steel adherends,
an Ni-Cr-Zn coating provided enhanced corrosion resistance and bondability even
after exposure to aggressive environments or ambient conditions over long periods of
time. Additionally, rubber bonds with the plasma spray coating were more tolerant to
surface contamination than those with grit-blasted surfaces. These investigations
indicated that the plasma spray process was more robust than conventional processes
and could give equivalent or (in some cases) superior performance.
The behaviour of PVD TiN on high-speed steel (HSS) under low stress
abrasion was examined by Scholl [81]. HSS bars were coated with TiN by a cathodic
arc process and by a magnetron sputtering process. The samples were then tested
using the dry-sand-rubber-wheel abrasive test. The phenomenon observed was
multiple cracks (i.e., micro fissuring) of the surface that were long, narrow and
parallel to each other. Coatings less than 1.5 pm exhibited a failure mode of
continuous coating removal by micro-fissuring and subsequent fracture and loss of the
TiN layer. Thicker coatings over 1.5 pm thick also failed only at free edges where a
macro-particle had been removed. The results indicated that as long as coating
29
integrity was maintained under the flow of abrasive material, the wear rate of the TiN
was small.
Molinari et al. [82] demonstrated that plasma nitriding had a positive effect on
the dry sliding behaviour of Ti-6A1-4V alloy based on the treatment temperature.
They carried out dry sliding tests under different load and sliding speed conditions at
three temperatures; 973, 1073 and 1137°K. The wear mechanisms was studied by
interpreting the results on the basis of the evolution of the friction coefficient and by
characterizing the wear debris and worn surfaces. The wear mechanisms were found
to be dependent on the nitriding percentage and nitriding temperature. When the wear
was determined by the resistance of the compound layer (low loads and low sliding
speeds), the nitriding treatment had to be carried out at 1073°K to obtain the proper
compromise between the thickness of the compound layer and the hardness of the
diffusion layer. When the material was exposed to delamination (high loads and high
sliding speeds), the compound layer tended to be destroyed rapidly. Under these
conditions, the strength of the diffusion layer had to be maximized by heating to
higher temperatures, e.g. 1137°K in order to enhance the hardness of the diffusion
layer.
Novak and Komac [83] studied the wear mechanisms of TiN (physically
vapour deposited) coated TiC-based cermets. The insert samples were characterized
in terms of mechanical properties and their tool life during machining of steel. Static
diffusion experiments were conducted to simulate the diffusion process across the
tool-workpiece interface at high temperature and pressure. The depth profiles of the
worn edges in both uncoated and TiN-coated cermets were analyzed and tested by
30
machining of steel. To identify the dominant wear mechanisms, the worn cutting tools
and the diffusion couples were analyzed by scanning electron microscopy, energy-
dispersive spectroscopy and Auger electron spectroscopy. The results of cutting tests
with the inserts confirmed the beneficial effect of TiN coating on the cutting tool life
of cermet leading to the effective suppression of carbide or carbonitride grain
decomposition in the cermet surface layers.
Khedkar et al. [84] investigated the influence of structural, as well as
operational, parameters on the sliding wear and friction behaviour of plasma sprayed
and subsequently laser alloyed coatings under dry and marginally lubricated
conditions. A pin-on-disc apparatus was used to characterize the adhesive and
abrasive wear resistance of two different steels, plasma sprayed and laser alloyed with
WC-Co, Mo, and Cr. They reported that the plasma-coated Mo was relatively soft and
was prone to failure. The lower coefficient of friction associated with Mo coatings
was attributed to the dominant role played by the thick, adherent oxide film at the
interface. The lower bond strength and the stress gradient associated with the plasma
sprayed coatings made them susceptible to fail along the interface, but the laser
alloying caused improvement.
The dry sliding behaviour of the Ti-6A1-4V alloy was studied by Molinari et
al. [85] to determine the responsible mechanisms for the poor wear resistance in
different load and sliding speed conditions. They also confirmed the low resistance to
plastic deformation of the alloy even at low loads and the poor protection provided by
the surface oxide. The maximum wear resistance was found at a decreasing sliding
speed as the load was increased, where a transition from oxidative wear to
31
delamination occurs. This point was found at a decreasing speed as the load was
increased. It was concluded that an increase in the mechanical properties of the
surface was necessary to avoid plastic deformation and to retard thermal softening
which promote delamination and cause mechanical instability of the surface. At the
lower sliding speeds, the chemical characteristics of the surface have to be modified
to avoid the formation of the scarcely protective oxide.
De Sousa and Alves [86] studied AISI 304 stainless steel workpieces with
cylindrical blind holes plasma nitrided in an atmosphere of H2-2 ON2 at 1000 Pa,
773°K, for 2 hours. The influence of the hole dimensions on the temperature
uniformity was investigated. The maximum temperature difference was found to be
45°C between the surface and the bottom of the cylindrical holes for a hole 10 mm in
diameter and 17 mm deep. This could be attributed to the effect of the ratio between
the surface area and the volume at different points in the samples. The effect of
overheating was observed at working pressure of 1000 Pa.
Novak et al. [87] discussed the results of a study to understand wear
mechanisms of a TiN (PVD) coated Ti(C,N)-based cermets. Static diffusion
experiments were carried out in order to simulate the diffusion process across the
tool-work piece interface at high temperature and pressure, thus permitting the wear
to be determined. Experimentally, coated and uncoated tool materials were tested in
machining CK45 steel under different cutting conditions. It was confirmed that the
coating can increase the tool life of cermets significantly. The diffusion couples and
the worn cutting tools were analyzed by SEM, EDS, and AES in order to identify the
dominant wear mechanisms. A TiN coating containing a high concentration of defects
32
is not as efficient a diffusion barrier as one would expect. The association of defects
into micropores can cause enhanced diffusion not only of carbon and nitrogen, but
also of metals through the apparently dense TiN layer.
Franco et al. [88] studied the microstructure and the electrochemical behaviour
of coated AISI 4340 steel substrates. Titanium, reactive titanium nitride (TiN) and
TiN film, obtained from a titanium film nitrided at 900°C, and were deposited on steel
substrates by magnetron sputtering. Also, a solid titanium sample was nitrided at
900°C. The potentiodynamic polarization technique was used to evaluate the samples
processed in a solution of 3% NaCl, for the corrosion resistance. In addition, the
samples were examined by SEM to determine the quality of the coated surface. They
found that from the potentiodynamic analysis the reactive TiN coatings and nitrided
titanium films were characterized by low porosity and pinhole concentration.
However, the low corrosion resistance of reactive TiN films indicated that the metal
substrate was not entirely coated, leaving large and deep pinholes. As a consequence
of the presence of microstructural defects such as surface roughness and porosity, the
reactive TiN coatings were more prone to corrosion attack than plasma-nitrided Ti
coatings (TiN). While plasma-nitrided Ti coatings showed intragranular, the reactive
Ti coatings showed intergranular corrosion. Galvanic corrosion between the coating
and substrate resulted in significant attack of the metal, allowed by the penetration of
small pinpoints into the substrate.
33
1.3. SCOPE OF THE PRESENT W ORK
The present study was conducted to determine the surface properties of TiN
coated, plasma nitrided and plasma nitrided/laser melted Ti-6A1-4V samples. A TiN
coating and plasma nitriding units were used to nitride the workpieces while a CO2
laser was used to coat and irradiate the nitrided surfaces. X-ray diffraction (XRD) was
utilized to determine the nitride compounds at the surface and in the nitride zone
before and after the laser melting process. The wear properties and friction coefficient
of untreated, TiN coated, plasma-nitrided and nitrided/laser-melted surfaces were
investigated through pin-on-disc experiments. The micro structure of the nitrided and
laser melted zones was studied using a scanning electron microscopy (SEM)
technique. The micro-hardness tests were conducted across the melted and unaffected
regions. A mathematical model governing the laser heating process was developed
using a Fourier theory and the heating and cooling rates were predicted. To achieve
this goal, the step input intensity of the laser pulse with and without convection
boundary conditions were considered.
34
C H A P T E R - 2
E q u i p m e n t a n d P r o c e d u r e
2.1 Introduction
In this chapter, experimental apparatus for TiN coating, plasma nitriding, laser
treatment and wear test of the Ti-6A1-4V samples are introduced. The topics will be
presented under the relevant sub-headings.
2.2 PVD TiN Coating
There are two major coating processes: Physical Vapor Deposition (PVD) and
Chemical Vapor Deposition (CVD). These techniques allow effective control of
coating composition, thickness and porosity. Three basic types of PVD processes are
available. These include vacuum or arc evaporation, sputtering, and ion plating. These
processes are, in general, carried out in a high vacuum at temperatures in the range of
35
200 - 500°C. In physical vapor deposition, the particles to be deposited are carried
physically to the workpiece [89-91].
In vacuum evaporation, the metal to be deposited is evaporated at high temperatures
in a vacuum and is deposited on the substrate, which is usually at room temperature or
slightly higher. Uniform coatings can be obtained on complex shapes. In arc
evaporation, on the other hand, the coating material i.e., cathode is evaporated by a
number of arc evaporators, using highly localized electric arcs, which produce highly
reactive plasma consisting of ionized vapor of the coating material. The vapor
condenses on the substrate i.e., anode and coats it. Applications for this process may
be functional or decorative.
In sputtering, an electric field ionizes an inert gas usually argon. The positive ions
bombard the coating material (cathode) and cause sputtering (ejecting) of its atoms.
These atoms then strike and condense on the workpiece, which is heated to improve
bonding. In reactive sputtering, the inert gas is replaced by a reactive gas, such as
oxygen, in which case the atoms are oxidized and the oxides are deposited.
The last type is ion plating which is a generic term describing the combined process
of sputtering and vacuum evaporation. An electric field causes a glow discharge,
generating plasma. The vaporized atoms in this process are only partially ionized.
The production of thin layers of TiN on TÍ-6A1-4V substrate surfaces was
carried out using the following method: TÍ-6A1-4V samples were ground, polished,
ultrasonically cleaned in chemical solvents and put into a PVD unit. A titanium film
36
was sputter deposited onto the substrate at 260°C by a d.c. magnetron source in an
argon atmosphere. It was then implanted with N+ ions at an acceleration potential of
50 keV. Vacuum annealing was carried out at 540°C, after the implantation process,
for one hour. A series of nominal constant thickness single layer of 400 nm film was
formed. Consequently, after a series of trials the total thickness of the multi-layer film
in the range 2-4 (j.m was obtained. The lattice parameters of the coat interface varied
between 4.22 A and 4.275 A. In the lattice, aluminium atoms have substituted some
titanium atoms, which decreases the lattice parameter. After examining SEM results,
it appears that the coverage area of defects is less than 1% of the surface.
2.3 Plasma Nitriding
Workpieces were placed in the nitriding unit as shown in figure (2.1), which
operated within the d.c. bias voltage range 400-700 V. The plasma nitriding unit used in
this study, consists of power supply, a computer control unit, a gas mixing device and
a stainless steel vacuum chamber as shown in figure (2.2). Prior to the nitriding
process, the samples were cleaned by surface sputtering in argon and hydrogen (3/1
ratio) plasma for 45 minutes. The nitriding was performed in an N2 /H2 (8/2 ratio)
plasma with the total volume flow rate varied between 40 and 120 crn /s. The
temperature of the samples during nitriding was varied in the range 450 - 520°C. A
plasma nitriding cycle was carried out by evacuation of the chamber and then
followed by initialization of the glow and the introduction of the treatment gas heating
up to the treatment temperature. Heating occurs as the colloiding particles give up
37
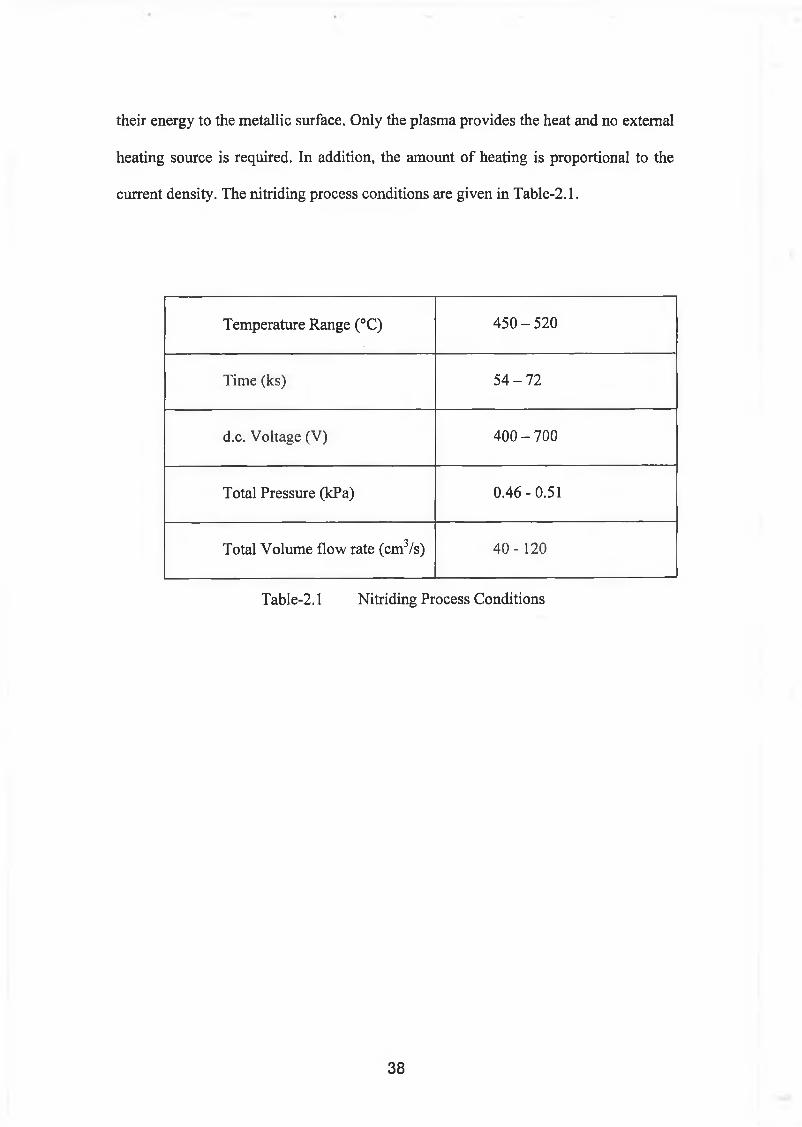
their energy to the metallic surface. Only the plasma provides the heat and no external
heating source is required. In addition, the amount of heating is proportional to the
current density. The nitriding process conditions are given in Table-2.1.
Temperature Range (°C) 450-520
Time (ks) 54-72
d.c. Voltage (V) 400-700
Total Pressure (kPa) 0.46-0.51
Total Volume flow rate (cm3/s) 40-120
Table-2.1 Nitriding Process Conditions
38
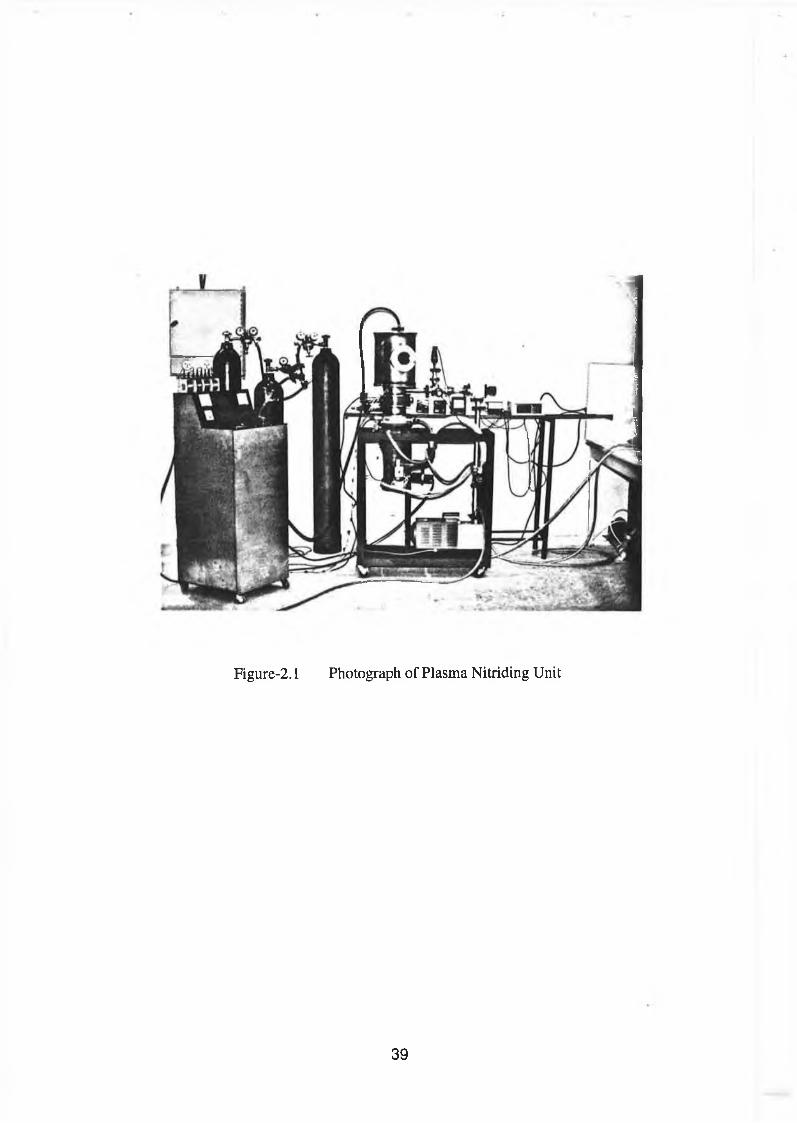
Figure-2.1 Photograph of Plasma Nitriding Unit
39
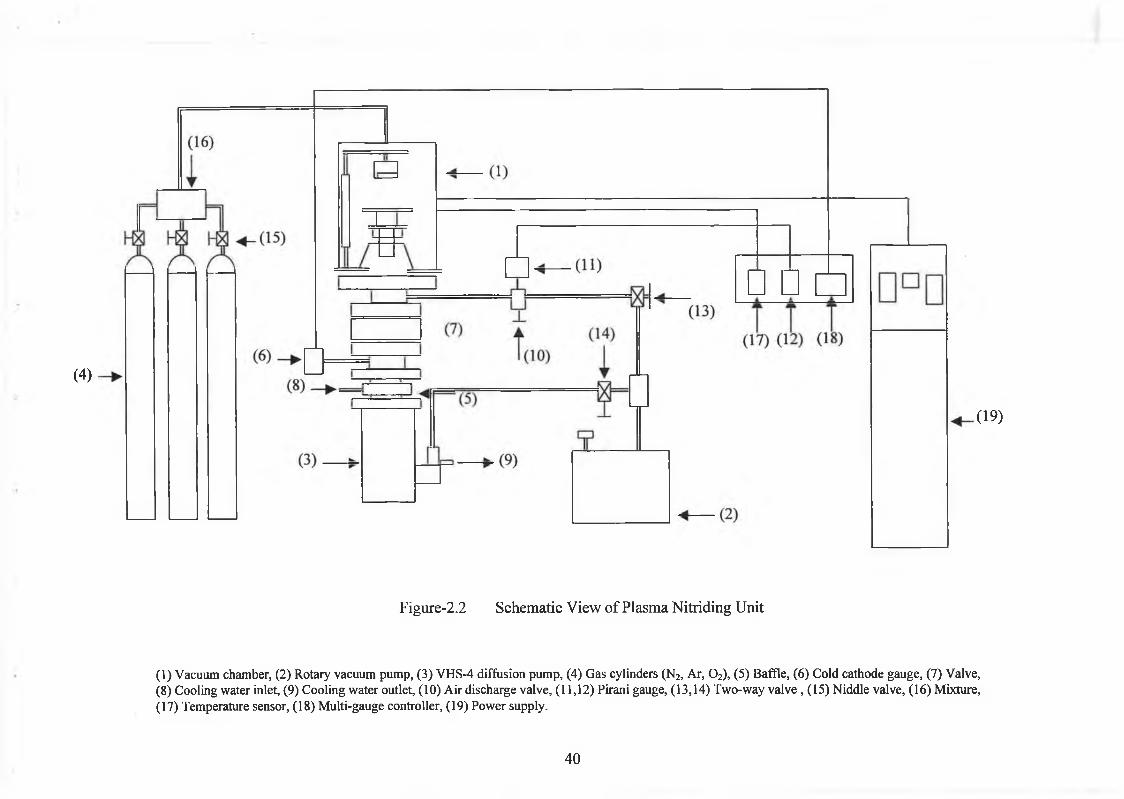
(4)
■ (19)
Figure-2.2 Schematic View of Plasma Nitriding Unit
(1) Vacuum chamber, (2) Rotary vacuum pump, (3) VHS-4 diffusion pump, (4) Gas cylinders (N2, Ar, 0 2), (5) Baffle, (6) Cold cathode gauge, (7) Valve, (8) Cooling water inlet, (9) Cooling water outlet, (10) Air discharge valve, (11,12) Pirani gauge, (13,14) Two-way valve , (15) Niddle valve, (16) Mixture, (17) Temperature sensor, (18) Multi-gauge controller, (19) Power supply.
40
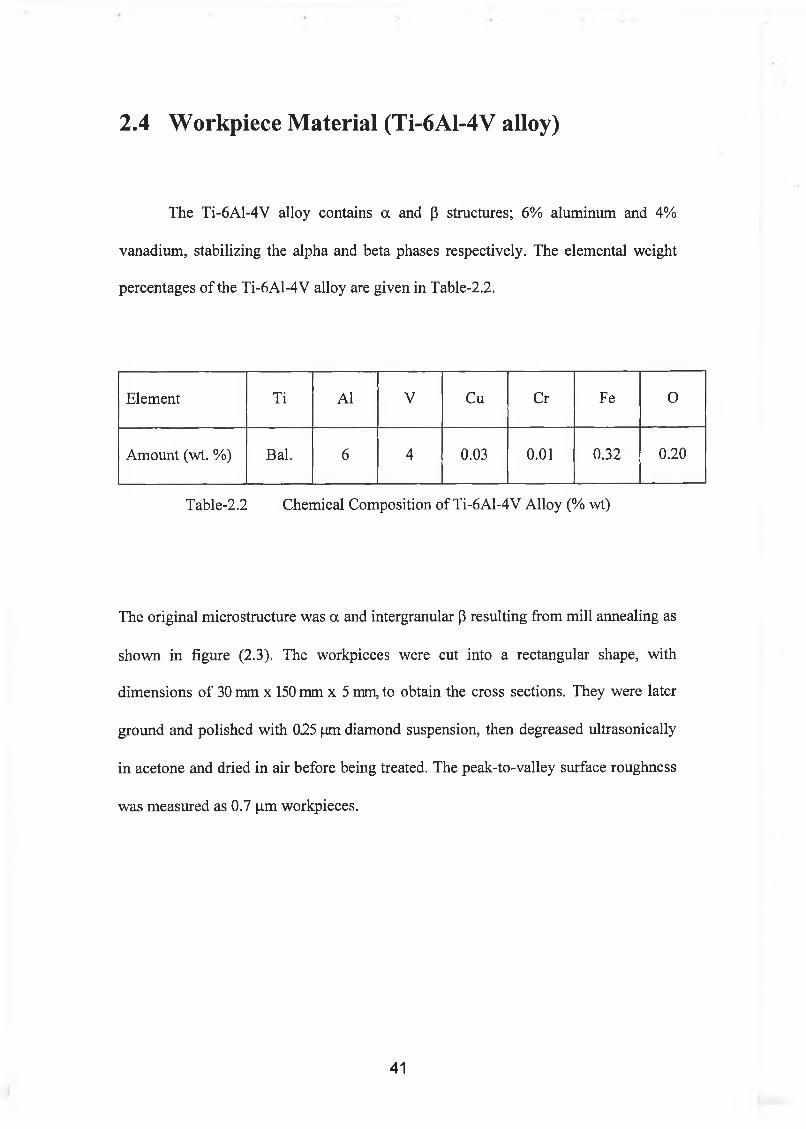
2.4 W orkpiece Material (Ti-6A1-4V alloy)
The Ti-6A1-4V alloy contains a and P structures; 6% aluminum and 4%
vanadium, stabilizing the alpha and beta phases respectively. The elemental weight
percentages of the Ti-6A1-4V alloy are given in Table-2.2.
Element Ti A1 V Cu Cr Fe O
Amount (wt. %) Bal. 6 4 0.03 0.01 0.32 0.20
Table-2.2 Chemical Composition of Ti-6A1-4V Alloy (% wt)
The original micro structure was a and intergranular p resulting from mill annealing as
shown in figure (2.3). The workpieces were cut into a rectangular shape, with
dimensions of 30 mm x 150 mm x 5 mm, to obtain the cross sections. They were later
ground and polished with 025 (am diamond suspension, then degreased ultrasonically
in acetone and dried in air before being treated. The peak-to-valley surface roughness
was measured as 0.7 (im workpieces.
41
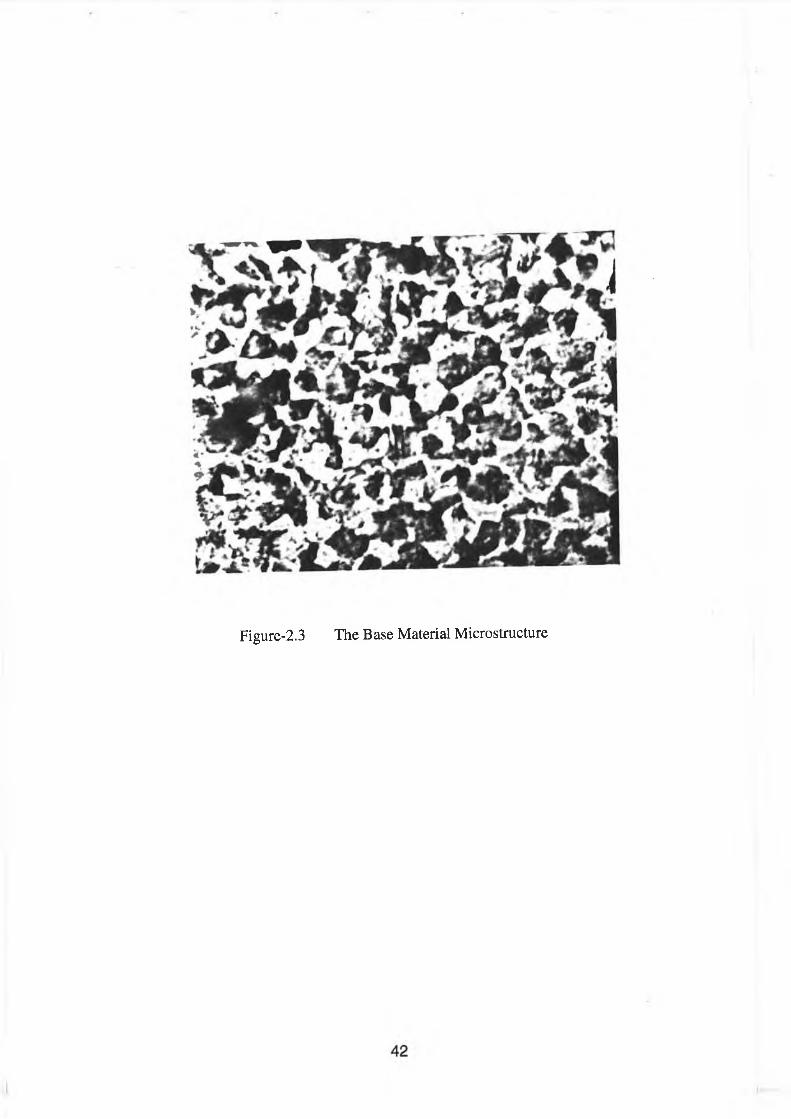
Figure-2.3 The Base Material Microstructure
2.5 M aterial Characterization
The specimens were prepared for the scanning electron microstructural
investigation by appropriate sectioning, mounting and mechanical polishing on
grinding papers. Etchants used to reveal the features of the treated regions were: -
[3 ml HF + 6 ml HNO3 + water] or
[20 ml HF + 20 ml HN03 + 40 ml Glycerol]
The polished and etched microstructures were studied and recorded using optical
microscopy and SEM for higher magnification. A sputtered layer of gold film was
needed to prevent charging of the sample surface during the SEM photography, and to
increase the contrast for higher resolutions.
2.5.1 S E M a n d E D S
The purposes of these techniques are: (1) to provide high resolution and high
magnification (up to 180,000X) images of solid samples to show surface structure by
SEM microphotography and optical microscopy, to investigate the metallographic
changes in the nitride and nitride/melted regions and (2) to give quantitative and
qualitative elemental analyses of the microscopic regions imaged, using the energy
dispersive spectrometer (EDS) to obtain the elemental distribution in respective
regions [92,93].
43
2.5.1.a Scanning Electron Microscopy
The scanning electron microscope may be regarded as a more powerful
version of the conventional optical microscope enabling the study of very small
objects. The optical microscope uses a beam of photons for imaging and has a
maximum magnification of ~l,000x, together with a point to point resolution of -2 0 0
nm. In comparison, the SEM uses a beam of electrons for imaging and has a
maximum magnification of ~200,000x, together with a resolution of ~6 nm. The SEM
not only permits observation of very fine details, e.g., high resolution, but also
exhibits good focus over a wide range of specimen surfaces, i.e., large depth of field.
The SEM consists of five main components. These are: (1) electron gun, fitted
into the column, produces a large and high intensity electron beam; (2) column
controls that shapes the beam into a size useable for scanning microscopy; (3)
scanning system scans the beam over the sample in a television type raster. The beam
scanning over the sample releases electrons from it; (4) electron collector and display
collects these electrons and converts them to an image, which can be viewed by the
operator and (5) control electronics contains all circuits necessary to control the
performance of SEM.
The principle of operation of the microscope is as follows. Electrons are
emitted from a heated filament and are then accelerated through the column by
applying a potential of -25 kV. The electron beam is de-magnified in the condenser
lens and then focused onto the sample by the objective lens. The surface of the
44
specimen is then scanned by the finely focussed electron beam, and the chosen signal
output is displayed on a cathode ray tube (CRT), which is scanned synchronously
with the electron probe. The interaction of the electron beam with the sample
produces a large number of emitted signals. The signal most frequently used for
imaging purposes is that of secondary electrons. These are low energy electrons
which have been absorbed by the sample and subsequently ejected for collection by a
positively biased detector, which consists of a scintillator / light pipe / photomultilier
tube assembly. The amplified signal is then used to modulate the brightness of the
viewing CRT. The emitted flux of secondary electrons is dependent upon the surface
topography and thus a recognizable image of the sample is formed. The magnification
factor is simply the ratio between the area of the sample scanned by the incident
electron beam and the fixed viewing area. Thus increased magnification is achieved
by simply decreasing the area of the specimen that is scanned.
2 .5 .1 .b E n e rg y D isp ers iv e S p e c tro m e te r
Qualitative and quantitative information can be obtained from the sample by
monitoring emitted X-rays. The incident electrons induce characteristic X-ray
emission from different elements in the sample. These X-rays may be analyzed either
by their wavelength or by their energy. Both approaches have their merits and
drawbacks and they are usually seen as complementary. For rapid qualitative and
semi-quantitative analysis, however, energy dispersive systems utilizing sophisticated
computer analysis routines are preferred. This type of spectrometer is currently being
45
operated with the SEM for elemental analysis or, alternatively, to show the
distribution of a particular element within the scanned area. The presence of the
beryllium window means those elements lighter than sodium can not be detected.
The electron probe micro-analyzer uses the characteristic peaks of the X-ray
spectrum resulting from the bombardment of the specimen by the beam of electrons.
The wavelengths and intensities of these peaks can yield valuable information about
the chemical composition of the specimen. An electron probe micro-analyzer is thus
basically a SEM equipped with X-ray detectors. Two basic types of detectors are
used. In the energy-dispersive X-ray spectrometer, a solid-state detector develops a
histogram showing the relative frequency of the X-ray photons as a function of their
energy. The wavelength-dispersive spectrometer uses X-ray diffraction to separate the
X-ray radiation into its component wavelengths.
2.5.2 X -ray D iffra c tio n A nalysis
The X-ray diffractometer (XRD) is a device, which measures the intensity of
the X-ray reflections from a crystal employing an electronic device such as a Geiger
countertube or an ionization chamber instead of a photographic film. The apparatus is
so arranged that both the crystal and the intensity measuring device (Geiger
countertube) rotate. The countertube, however, always moves at twice the speed of
the specimen, which keeps the intensity-recording device at the proper angle during
the rotation of the crystal, so that it can pick up each Bragg reflection as it occurs. In a
46
modem instrument of this type, the intensity-measuring device is connected through a
suitable amplification system to a chart recorder, where the intensity of the reflection
is recorded on a chart by a pen. In this manner, one obtains an accurate plot of
intensity against Bragg angles. As the X-ray diffractometer is capable of measuring
the intensity of Bragg reflections with greater accuracy, both qualitative and
quantitative chemical analyses can be made by this method [94].
The analysis of different phases present in the nitrided samples for their
structural information was performed by XRD. The vertical placement of the device
in a radiation protecting housing is controlled by computer and is thus capable of fully
automatic operation. A molybdenium tube, emitting Mo k-alpha radiation provided
the X-ray source. To suppress the k-beta reflections, a zirconia filter was used. The
selection of the X-ray tube and, hence, the penetration depth of the X-ray produces
many lines in the low angle range with high intensity. An XRD trace was obtained
between the 2 theta angles 14 and 44 degree, using in step scans mode with step-width
at a counting time of 15 seconds.
After the nitriding process, the layers were analyzed by XRD using CuKa and
MoKa radiations. XRD profiling of the treated cases were performed by periodic
removal of the surface by grinding with SiC abrasive papers. The lattice parameters of
the unit cell were calculated from the diffraction data obtained with CuKa radiation.
The error in determination of the lattice parameters was found to be ±0.6 A. An XRD
was carried out to analyze the nitride species in the melted and untreated regions.
47
2.6 C 0 2 Laser Melting
Laser machining belongs to the large family of material removing or
machining processes. It provides a feasible production method for hard-to-machine
materials and involves special applications such as micro-machining. However it does
have limitations in some applications in terms of material removal rate and surface
quality, when compared with traditional machining methods. Nevertheless, interest is
growing in the use of lasers in welding, soldering, surface modification, marking,
cutting, hole drilling and scribing.
The dominant lasers used in material processing are CO2, Nd-YAG and Nd-
Glass lasers, with CO2 lasers accounting for the largest percentage of sales. In this
section, a CO2 laser and its output characteristic are described.
CO2 lasers come in a variety of power range, sizes and designs. All use the
molecular vibration of CO2 as a “lasing” mechanism. Generally, a mixture of CO2,
nitrogen and helium are employed, the nitrogen is active in the excitation process and
helium acts as an internal heat sink. Sometimes a small amount of oxygen is added to
reduce contamination from CO and carbon. CO2 lasers emit radiation at 10.6 fj,m
wavelength, which is quite far into the infrared region. This causes problems with
respect to the reflectance in processing metals such as copper, silver and gold, but,
alternatively, these metals can be used as mirror materials internally or externally.
Some small sealed-off C02 lasers, such as the waveguide types, use RF excitation, but
most use DC electrical discharge excitation. The three major designs used in
industrial processing applications are the slow axial gas flow with axial discharge, the
48
fast axial gas flow with axial discharge and the fast transverse gas flow with
transverse discharge. The slow flow design relies on thermal conduction for cooling
of the gases and, consequently, the cross section area of the discharge region is
limited. Roughly 50 to 70 watts of power per meter tube length can be obtained from
this type of design. Beam quality is generally good, with near Gaussian output being
attainable because of the long narrow bore tube. The fast designs use convection
cooling, so that much larger discharge cross sections can be achieved. Hence, the
power per unit length is much higher, 600 watts per meter for fast axial flow and
2,500 watts per meter for transverse fast flow. In fast transverse flow designs the
beam is folded back and forth through the discharge region several times. Unstable
resonator configurations are frequently employed for multi kilowatt CO2 lasers to
eliminate transmissive optics. The efficiency of these CO2 lasers is approximately
10% (total input power divided into useful output power). This is about three times
the efficiency of the other two industrial lasers (i.e., Nd-YAG and Nd-Glass lasers)
[95,96].
The production of a uniform hardened layer can be achieved by scanning the laser
beam over an area. An overlapping array of tracks made by such means produces a
uniform depth of modified surface. During this procedure, short-cycle re-melting and
aging of adjacent tracks occurs. Re-melting or thermal cycling of one point may occur
several times, depending upon the degree of overlap.
In surface melting, the laser is successfully used to successively melt a
controlled area of the surface. The solidification occurs during the cooling cycle of the
process resulting in metallurgical properties different to conventionally cooled
49
surfaces. This may provide high strength and high ductility together with good
corrosion and wear properties of the substance [97,98]. Some of the alloys on surface
melting can not result in the optimum effect, although grain refinement is always
likely. The laser surface nitriding, particle injection, cladding and surface alloying
have also been introduced to improve the tribological properties of the surface
[3,33,99].
In general, there are two main factors, determining the structure resulting from
a laser melting process, there are: the composition of the melt, and the solidification
parameters. The parameters, which either directly or indirectly affect the structure, are
the power of the laser beam, the distance between focal points and the surface, and the
traverse speed. For any comparison between results from different sources, the
important parameters are the power density and the interaction or dwell time.
A CO2 laser delivering a maximum output power of 1.6 kW at the TEMoo
mode was used to melt the workpiece surface as depicted in figure (2.4). The laser
output power intensity attained was of the order of 1012 W/m2 with a nominal spot
radius of 0.2 mm. The focus diameter of the laser beam at the workpiece surface was,
however, altered by varying the focus setting of the focusing lens. A nozzle was
designed to introduce the shielding gas and to keep the gas pressure constant during
the melting process. Nitrogen was used as shielding gas in the melting environment.
The experiment was repeated for different shielding gas pressure levels. In order to
achieve low and high melting regions, the laser output power intensity was varied. It
should be noted that high melting corresponds to the melting occurring at a
temperature in between melting and evaporation temperatures, while low melting
50
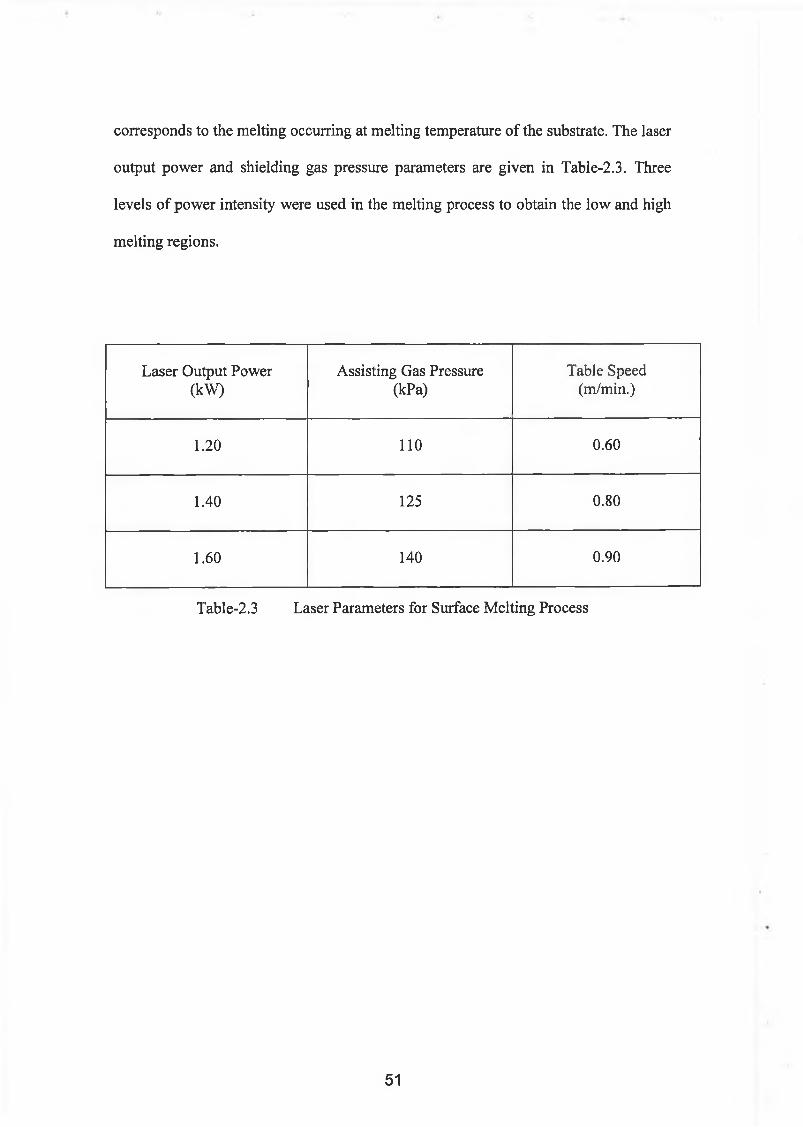
corresponds to the melting occurring at melting temperature of the substrate. The laser
output power and shielding gas pressure parameters are given in Table-2.3. Three
levels of power intensity were used in the melting process to obtain the low and high
melting regions.
Laser Output Power (kW)
Assisting Gas Pressure (kPa)
Table Speed (m/min.)
1.2 0 11 0 0.60
1.40 125 0.80
1.60 140 0.90
Table-2.3 Laser Parameters for Surface Melting Process
51
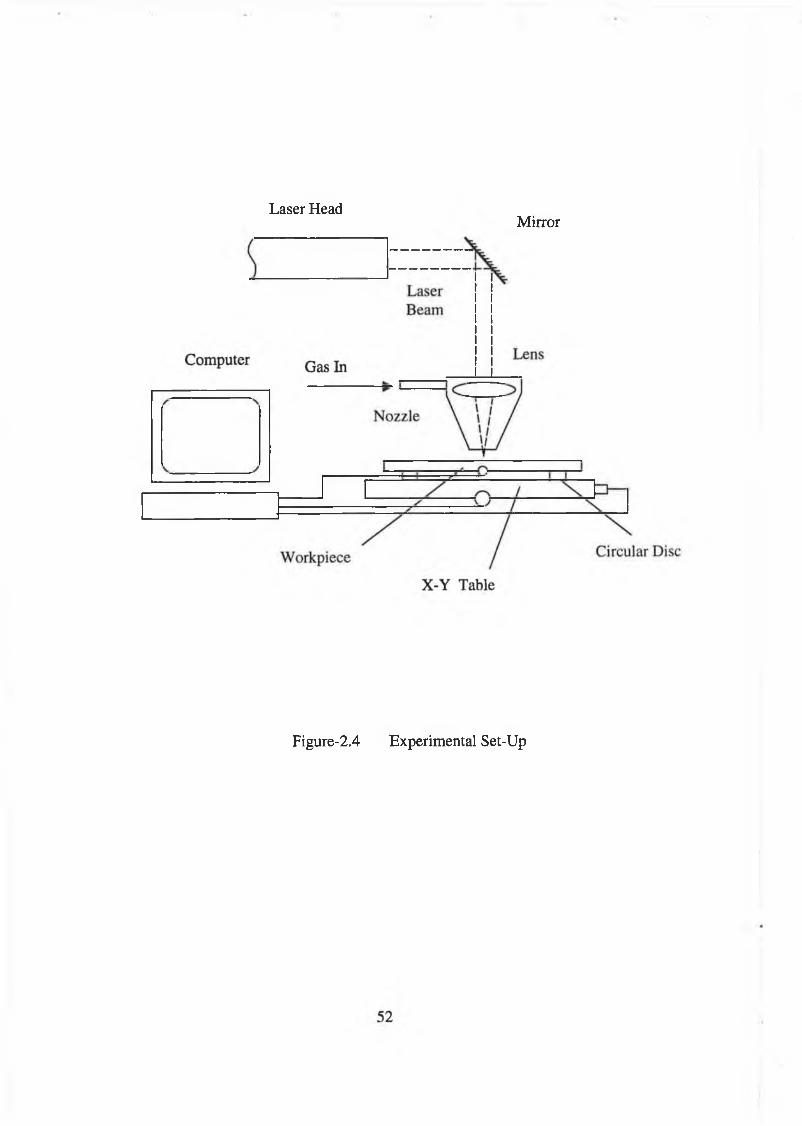
MirrorLaser Head
Figure-2.4 Experimental Set-Up
2 . 7 W e a r T e s t i n g
Wear may be defined as the progressive loss of substance from the operating
surface of a body, occurring as a result of relative motion of the surface with respect
to another body. The concept embraces metal to metal, metal to other solids and metal
to fluid contact. Traditionally, wear has been described in terms of adhesion and
abrasion [100,101]. The former occurs when two bodies slide over each other and the
surface forces cause the transfer of fragments of material. The latter occurs when
particles or protuberances cut fragments from a contacting softer surface in relative
motion. While abrasion and adhesion are regarded as the predominant wear processes,
it has become apparent that practically every material damage mechanism can
contribute to wear. Consequently, almost every physical, mechanical and chemical
characteristic of a material is liable to affect its wear performance [102-105].
Wear tests of untreated, plasma-nitrided, and laser-melted samples were
carried out using a pin-on-disc wear tester, with a hard ball 3 mm diameter equipment
with ET025 oil as lubricant. The rotational speed of the disc was 35 rpm, giving two
levels for the linear relative speed (pin relative to the disc). These include Vi=25
mm/s for a wear track with a diameter of 13.6 mm and V2=30 mm/s for a wear track
of 16.37 mm diameter. The scars developed during the wear operation were examined
using SEM. The friction coefficient was measured using a ball-on-disc machine for all
tests. The ball material was hardened AISI 52100 steel, which was allowed to slide
dry on the rotating sample at 100 rpm (corresponding to 120 mm/s) under a range of
load 1 to 100 N. The friction force was measured during sliding as a function of time.
53
At the time of break-through, the friction increased drastically and showed critical
behavior thereafter, indicating scuffing-like wear characteristics.
2.8 Hardness Tests
One of the most common tests for assessing the mechanical properties of
material is the hardness test. Hardness of a material is generally defined as its
resistance to permanent indentation or a measure of a material’s resistance to
localized plastic deformation. The depth or size of the resulting indentation is
measured, which in turn is related to a hardness number: the softer the material, the
larger and deeper the indentation and the lower the hardness index number. Less
commonly, hardness may also be defined as resistance to scratching or to wear.
Various techniques have been developed to measure the hardness of material using
different indenter materials and geometries. As resistance to indentation depends on
the shape of the indenter and the load applied, hardness is not a fundamental property.
Measured hardnesses are only relative (rather than absolute) and care should be
exercised when comparing values determined by different techniques. Among the
most common standardized hardness tests are the Brinell, Rockwell, Vickers, Knoop
and Scleroscope tests [89,93,106].
For each test, a very small diamond indenter having pyramidal geometry is
forced into the surface of the specimen. The resulting impression is observed under a
microscope and measured. This measurement is then converted into a hardness
number. Careful specimen surface preparation (grinding and polishing) may be
54
necessary to ensure a well-defined indentation that may be accurately measured. The
Vickers test is suitable for testing materials with a wide range of hardness, including
very hard steels.
Hardness tests are performed more frequently than any other mechanical test for
several reasons. These include (1) simple and inexpensive-ordinarily no special
specimen preparation is needed; (2) nondestructive-the specimen is neither fractured
nor excessively deformed, small indentation is the only deformation and (3) other
mechanical properties often may be estimated from hardness data, such as tensile
strength.
In this study, the micro-hardness of the workpiece cross-section was measured
using the Vickers tester. It uses a pyramid-shaped diamond indenter with loads
ranging from 100 to 500 gm. The Vickers hardness number is designated by HV and
referred to as micro-hardness testing method on the basis of load and indenter size.
The micro-hardness measurements were, therefore, carried out across the workpiece
cross-sections before and after the nitriding process.
55
C H A P T E R - 3
Heat Transfer Modelling
3.1 Introduction
Lasers are widely used as a tool to modify the surface of engineering
materials. This is due to a rapid precision heating process and the attainment of high
heating and cooling rates. Through laser surface melting process, fine-grained,
homogeneous microstructures can be obtained which exhibit a high degree of
metastability [107]. Subsequent consolidation and heat treatment promotes the
precipitation of extremely fine second phase particles which provide increased room
temperature strength and more importantly significant improvements in elevated
temperature strength and creep resistance [31]. The laser heating process is governed
by an absorption mechanism, which takes place through photon interaction with the
bound and free electrons in the material structure. These electrons are then raised to a
higher energy level [108]. The re-distribution of energy takes place through various
collision processes involving electrons, lattice phonons, ionized impurities and defect
structures. The average free collision time is in the order of 10'12 to 10'14 seconds
[109]. The absorbing electrons have, therefore, sufficient time to undergo many
56
collisions at the period of laser machining pulses (~ 10‘6 s) and Q-switched pulses (~
10'9 s) take place. This leads to the two assumptions to be considered. The laser
energy is instantaneously converted to heat at the point at which absorption takes
place. The other assumption of local equilibrium and the validity of the concept of
local temperature follow, thereby allowing a conventional heat transfer analysis to be
made.
The basic idea of laser heat-treating is to harden the surface of materials. The
laser irradiates the surface and cause very rapid heating of a thin layer of material near
the surface. When the laser beam is moved to a different area on the surface, the heat
gained by the thin layer will be quickly conducted away and the heated area will cool
rapidly. This can be regarded as quenching of the surface region. This yields an
increase in hardness of the surface layer [45], Lasers are not efficient for heating large
volumes of substances, but they can rapidly rise the temperature of the localized area.
Two regimes are of interest in laser machining of materials, which correspond
to low, and high intensity irradiation. The terms low and high are relative and apply
when the machining processes are conduction-limited and non-conduction limited
cases, respectively [108]. In low intensity irradiation, the heating mechanism takes
place in the solid phase of the material. Consequently, the phase change is avoided
and the process is limited with a small depth of operation. Thus, a few microns of
hardening depth may result. In general, laser heat treatment of material surfaces is a
conduction-limited process. However, in the case of high intensity irradiation,
material removal rates due to evaporation are considered. Consequently, the phase
change is considered including melting and heating occurs which in turn results in
57
considerable depth of hardening. Thus, the heat-affected zone can extend for a few
hundreds of microns.
On the other hand, the heat transfer mechanism governing the laser heating is
highly important. Laser processing is of commercial interest because of its ability to
accurately change the properties of a very localized surface region without affecting
the material as a whole. It is, however, this scale of the operation that makes accurate
predictions of the in-situ process variables so difficult. It is, consequently, the change
of the micro structures and the mechanical as well as chemical properties of the
treating subsurface. Therefore, modelling the physical process that can yield much
insight into the phenomena occurring within the region activated by the high-power
laser beam is useful. It should be noted that modelling could reduce substantially the
time required for process optimization, scale-up, and control [114].
3.2 M athematical Analysis
Heat transfer mechanism initiating the laser heating process may be outlined
as follow:
The energy supplied to a material in laser heating arrives in the form of photons.
Photon-electron interactions taking place results in a local increase in the electron
temperature. This is an absorption process, which takes place over a very short time
period [110] and is described by the Beer-Lambert’s law [111]:
58
I = I0exp(- 8x) (3.1)
After this initial absorption process, the free electron gas in the metal proceeds to
import its excess energy, through electron-molecule (phonon) collision process, to the
bulk of the material [112]. Where Io is the peak intensity of incident irradiance and the
absorption coefficient ‘8 ’ is, in general, a function of both wavelength and
temperature [109] and the negative sign indicates the reduction in beam irradiance due
to absorption as a ‘8’ is a positive quantity. The absorption of an incident laser beam
energy results in an increase of the internal energy of the substance, which in turn
initiates the conduction heat transfer [113]
The heat transfer mechanism governing the laser heating process is taken from
the previous studies [108-113] and will be given under the following subheadings:-
3.2.1 S tep I n p u t In te n s ity L a s e r P u lse w ith o u t C onvec tion
B o u n d a ry C o n d itio n s :
3.2.1.a. Conduction-Limited Heating
The Fourier heat conduction equation appropriate to conduction limited laser
heating can be written as [108,114]:
^ d 2T ^ + AbI0 8 exp(- 8x) = p Cp ^ (3.2)
59
For most of the engineering materials, the absorption factor ‘Ab‘ is almost unity for
the Nd:YAG laser wavelength [115], therefore, equation (3.2) reduces to:
a2T | I05 exp(-Sx) _ 1 err
d x 2 k a ô t
where a = ----P C p
with the initial and the boundary conditions:
£ T
dx= 0 ,T(oo,t)=0 and t(x,0)=0
x=0
The solution of equation (3.3) becomes visible in the Laplace domain, i.e.,
applying a Laplace transformation to equation (3.3) and the boundary conditions, with
respect to ‘t’ and introducing the Laplace transform variable ‘p’ yields the solution.
The mathematical arrangements of this transformation may be started by the
governing equation: -
ô2t ldx a kp
T(x,0) = 0 (3.5)
60
d T
dx= 0 and T(oo,p) = 0 (3.6)
x=0
where T = T(x,p)
Substitution of the initial condition (3.5) into equation (3.4) and setting q2 = — intoa
the transformed equation, it yields:
d T n 2 Td ? ‘ q T
I0S exp(-8x)k p
(3.7)
which has a solution:
T = A exp(qx) + B exp(-qx) + I0a8 exp(-8x)kp(p-aS2)
(3.8)
where ‘A’ and ‘B’ are constants and can be obtained using the boundary conditions.
dTTherefore, substituting of the boundary conditions —dx= 0 into equation (3.8)
x = 0
gives:
. „ I0a 8 2A = B +----- %-------7Tp k q ( p - a 8 )
61
and boundary condition T(oo5p) = 0 gives:
A = 0
and
kpq(q2 -Ô2)
Therefore, the transformed equation has a solution:
- = I0aô exp(-ôx) I0ô2 exp(-qx)kp(p-aô2) kpq(q2 - 5 2)
or
- = I0aÔexp(-5x) I08 exp(-qx)kp(p-aô‘) 2 kpq
1 1
q-Ô q + 8(3.9)
Performing an inverse Laplace transformation to equation (3.9) yields [108]:
62
T(x,t) = - | 4 fat- s l l T 1 exp|
1 - 8 x 1 + 8 x erfc
2 \x
4at>
2y[ax
4j-exp(a82t - 8xj erfc^-^= - 8 Vat
^-exp(a82t + 8xj erfc^^-^= + 8 V a t j
A
—exp(-8x) f 1 - exp(a82t)
w here:
erfc (x) = - t J x e n dr]\ T Z
know ing that
ierfc(x) = j " erfc£ d£, = -i=exp(-x2) - x erfc(x)\ K
Rearrangement of equation (3.10) gives:
T(x,t) - i e r f c ( ^ J - ^ exP(-8x>
+ 2 k8
+ 2 k8
exp(a8 2t - 8x) erfci 8 V at---- i = jiko \ 2 'yOCt^
^ e x p (a 82t + 8x) erfc^sVat + ^
(3.10)
(3.11)
63
Equation (3.11) gives the temperature profile inside the material for a step input in
beam intensity. It should be noted that, as the time tends to infinity,
lim T(x, t) = cot 00
Therefore, no steady state solution exists for the temperature distribution.
64
3.2.1.b. Non-Conduction Limited Heating
The Fourier equation governing the unsteady laser heating process may be
written as [116-119]:
\r d 2T, d x 2 , + pCp VS ‘ + I° ôexP (-ôx) =ox
' &T_ dt
p cf (3.12)
where:
V = ' k s T , ^'v 2 n m
exp ' L N v k B T s y
It is evident that the problem is non-linear, since the melting front velocity ‘V’ is
changing with temperature. Consequently, a complete solution to the heat transfer
equation is extremely difficult, but a quasi-steady solution is feasible. The set of
initial and boundary conditions relevant to equation (3.12) is: -
k "dx = pVL ; and T(oo,t) = 0 and T(x,0) = 0 (3.13)x=0
The solution of equation (3.12) with the appropriate initial and boundary
conditions can be obtained using a Laplace transformation with respect to time ‘t’, as
follows: -
The governing equation is: -
65
— + t - - T(x, p) = - -¡2- exp(-Sx)o k a o x a kp
5 2T (x ,p ) V 3 T (x ,p ) p ^ , I0Ô(3.14)
The inversion of the boundary conditions gives:
T(x,0) = 0 and 3T(x,p)ôx x = 0
pVLkp (3.15)
and
T(co,p) = 0 (3.16)
The solution to equation (3.14) gives the result: -
T(x,p) = A. expyfa
{ b - y jb 2 +p)\ r
+ B. exp - - ^ ( b + V b ^ T p )V a
I 0ô a
T 7ixp(- 5x) - ( b 2 + p ).
(3.17)
where b = , c = b-5Vcc ; and ‘A’ and ‘B’ are constants of integration.2 V a
Using the initial and the boundary conditions in equation (3.13), it yields:
A = 0
Furthermore, substitution of the boundary conditions in equation (3.13) gives: -
66
B =V a
b + /b2 +pI0S2a pVL
k.p(c2 - b2 - p) kp
Therefore, the complete solution to the transformed equation is: -
T (x ,p ) =y/a I0S2cc pVL r . “i
exp _ £ ( b + 1/b»+p)_Vb2 + p k.p(c2 - b 2 -p ) kp
In8 a
kpexp(-8x)
[c2 - b 2- p j
(3.18)
In inversion of the transformed solution, a difficulty arises because of the first term,
which is a rather complicated function of the subsidiary variable ‘p’. A more elegant
method is to make use of the observation that the first term may be written as the
indefinite integral, that is:
I08 a pVL
_kp(c2 - b 2 -p) kpexp - - j= (b + -Jb2 +p)ldx
. Va ' )
f(x,p) = -JQX g (x,p)dx
The inverse transformation of this function may be carried out in the following
manner: -
67
L' 1 f(x, p) = -L 1 J g (x,p) dx = - £ L 1 g (x,p) dx
where L' 1 is the inverse Laplace transformation. The function g(x,p) is easier to invert
than the function f(x,p), but involves indefinite integration after the inversion process.
The result of this procedure for inverting the solution is the same as that obtained in
the following method of expansion into partial fractions.
Using the relationship:
L '1 [<p(p + a)] = e -at L"1 [cp(p)]
It yields: -
w here q 2 = — , b = — and c = b - 8 V a a 2a
This expression may be expanded into partial fractions using the residual theorem:
68

. M lka exp bx
V a+ b t r-l aVa exp(-cx)
2b (»! - c2) l q + X
a 2 (5b2 - c2] exp(-qx) a 2 exp(-qx)
4b2 (b2 - c 2)’('1 + £ i 4b'
(b2 - c 2) ( q - _bjVa/
a 2 exp(-qx) a 2 exp(-qx)
2 c (b + c) (b2 - c2) j q - 2 c (b - c) (b2 - c2) q +
which gives on inversion and after much algebraic manipulations:
I n8 V a
2pCp(a8-V)4yft ierfc x + bJ~x\+- 3b! + c! erfcf *— + b>/t
2 Vat ) 2 b(b2 - c 2)
2 b2 bxN
errel 2 ^ i+— exp! — 7= | erfc| 7— - bV?
1
(b-c)1
(b + c)
exp
exp
- |8x + (b2 - c 2) t] j erfc f _ 2 L _v2Vctt
+ C41(3.19)
The second part of the term in the transformed solution may be inverted in a similar
manner:
69

■ -1 p V L V i +kP (b + V b1 + P
pVL— T exP4kb y
\ h + ^v V a >
L-1exp ( -q x )
q -V a
ex p (-q x ) 2b ex p (-q x )
b
q + v?V a f b
q +< V a>
w hich after transform ation gives: -
pVL4bk
( 4 b -s /a t ie r f c — 5 = + b V t - V a e r f c —i = + b V t ‘ V 2 v a t / V2vcct
+ V a e x p^ - 2 b x ^
e r f c f — 5 — bV t"v V a ' v 2 \ / a t
Finally the term:
-i I0a 8 e x p ( -8 x )
k p (p + b 2 - c 2)_
io S
P C Pexp(-8x)L 1
1 1
, ( c 2 - b 2)(p + b ! - c ! ) (cJ - b ’ )p_
or
j -i _ IgSV apCp (a8 - V)
e x p [ - ( 8 x + (b2 — c 2 ) t) ] e x p ( -8 x )
( b - c ) ( b - c ) _
where b - c = 8Va
(3.20)
(3.21)
70

Substitution of all these terms (equations 3.19, 3.20 and 3.21) into equation (3.18)
gives the complete solution of equation (3.12) yields:
T(x, t) = ----—r {4 Vt ierfci —j = + b Vt2pCp(a5 -V )l v2Vat3b2 +c2 erfc x
2 b(b2 - c 2) \ 2 Vat + b V f |+ 4 -2 b exp 2 bx erfc
Va) v2Vat
/ \ X - b f t
(b + c)exp - - ^ ( b + c) + (b2 — c2) t
V a verfci —j = - cVt
V2 Vat
- t———r exp(-8x) 1 - EYt | 4bVat ierfci —j = + bVt (b-c) n ’] 4bk 1 i,2Vat
—Va erfc — + bVt + Va expv2 Vat
2bx erfcVa / v2 Vat
-bVt
(3.22)
Setting x = 0 in equation (3.22) results in the surface temperature, that is:
T(0,t) = I0§ Va25C (a5-V)
4 Vt ierfc (b Vt) + ^ 2- C ] ■ erfc (b Vt) + b(b -c ) b
+e x p [(b 2 - c 2) t ] e rfc (_ c ^ _ exp[- ( b 2 - c 2 ) t ] e r f c ( < ^ _
( b - c ) (b + c) (b-c) j
- £LX_k [ 4b VoTt ierfc (b Vt) - Va erfc (b Vt) + Va (2 - erfc (b Vt))] 4bk
rearrangement gives: -
T(0 t) = V V a / ^ ierfc b ^ (b +c ) erfc(bVt)K ' 2 p Cp (a 8 - V) b(b -c )
2 cb2 - c 2
exp [ - ( b 2 - c 2 ) tje rfc ( - c Vt) - - - C.b (b - c) (3.23)
- £XJ±[2 b Vat ierfc (b Vt) + Va erfc(b Vt)] 2 b k
Equations (3.22) and (3.23) are the complete quasi-steady solution of the
governing equation and can be used to form the basis for a more accurate solution
which can be obtained by an iterative procedures. It is expected that this solution
would be obtained by developing the solution from time t = 0. In the initial stages, the
melting rates are small and thus the solution is for the pure conduction process. As the
surface temperature rises, the melting rate also rises. The values for the velocity and
surface temperature can be obtained by stepping forward in time using time steps that
are small enough such that the change in the surface velocity between steps is small
and therefore the velocity derived in the previous step can be used directly in equation
(3.23). With this new value of the surface temperature, an improved estimate of the
melting velocity ‘V’ can be obtained, and the iteration repeated to give a convergent
solution.
72
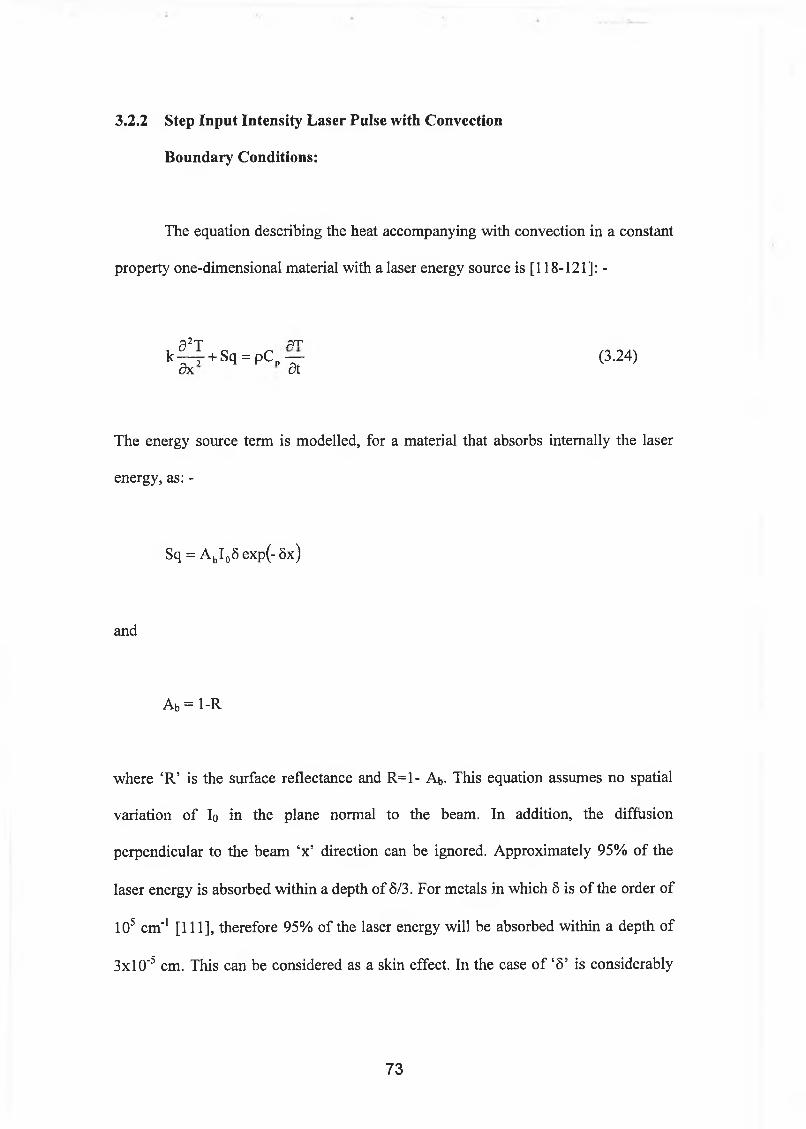
3.2 .2 S tep I n p u t In te n s ity L a s e r P u lse w ith C onvec tion
B o u n d a ry C o n d itio n s :
The equation describing the heat accompanying with convection in a constant
property one-dimensional material with a laser energy source is [118-121]: -
*s 2 ’T* p rv
k ^ 4 + Sq = pC„— (3.24)Sx St
The energy source term is modelled, for a material that absorbs internally the laser
energy, as: -
Sq = AbI08 exp(-8x)
and
Ab = 1-R
where ‘R’ is the surface reflectance and R=l- Ab. This equation assumes no spatial
variation of Io in the plane normal to the beam. In addition, the diffusion
perpendicular to the beam ‘x’ direction can be ignored. Approximately 95% of the
laser energy is absorbed within a depth of 8/3. For metals in which 8 is of the order of
105 cm'1 [111], therefore 95% of the laser energy will be absorbed within a depth of
3x1 O'5 cm. This can be considered as a skin effect. In the case of ‘8’ is considerably
73

smaller and energy is deposited over a greater thickness. The initial condition is
assumed to be a uniform temperature.
T(x,0) = T0 (3.25)
and the boundary conditions are: -
_ k aTÿ1t) = h[T _T(o!t)] (3.26)dx
and
(3.27)ax
The maximum temperature will occur, in this case, at the surface instead of in-depth.
The temperature rises above the initial temperature is defined as 0 = T - To
The laser energy equation and the boundary conditions can be written as: -
50 0 0 Sq— = a — T + — 2 - (3.28)dt dx pC
Now, the initial condition becomes: -
T(0,t) 0(x,O) = 0 (3.29)
74
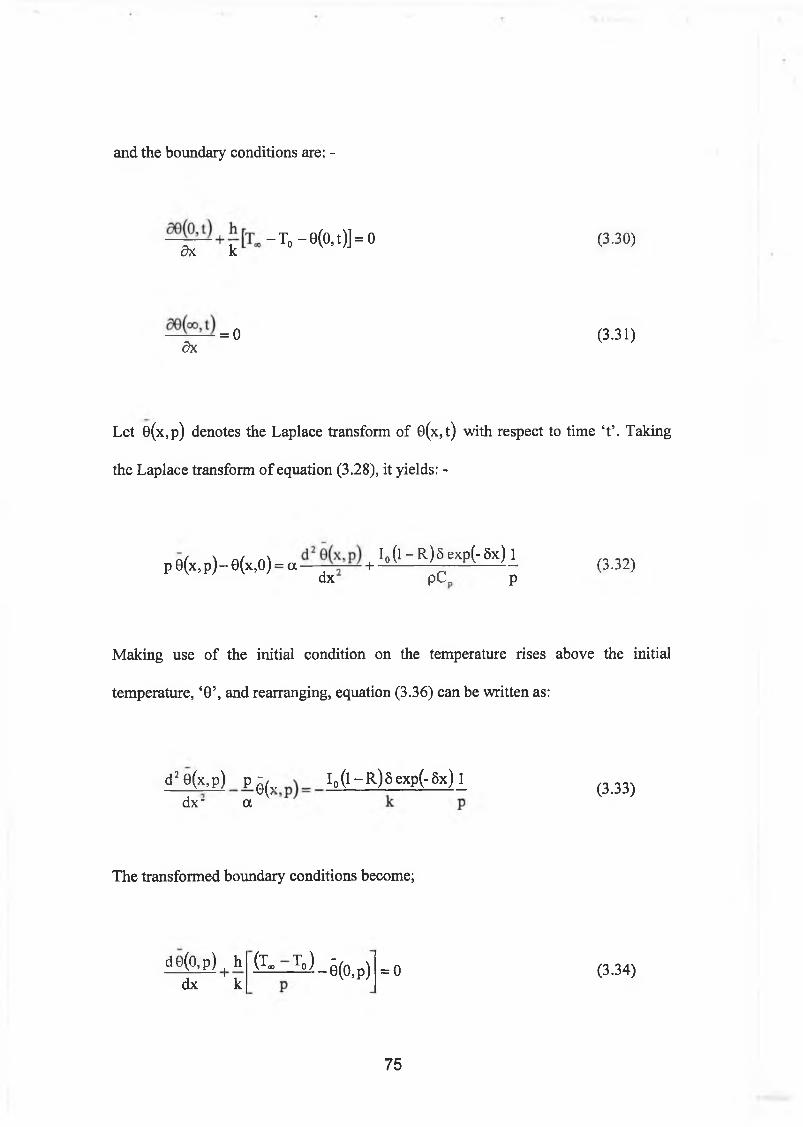
and the boundary conditions are: -
ÔK k- T o - e ( 0 , t ) ] = 0 (3.30)
= 0 (3.31)dx
Let 0(x,p) denotes the Laplace transform of 0(x,t) with respect to time ‘t’. Taking
the Laplace transform of equation (3.28), it yields: -
p 8(x,„)- 6(x,0) - a + I, (1 - R)5 exp(- 5x) 1 ^dx pC_ p
Making use of the initial condition on the temperature rises above the initial
temperature, ‘0’, and rearranging, equation (3.36) can be written as:
d; 0(x,p) p ^ ?, I0(l-R )8 exp(-8x )ldx* a
(3.33)
The transformed boundary conditions become;
d0(0,p) | h dx k
(T * . T q ) _ ê ( o ,p ) = 0 (3.34)
7 5
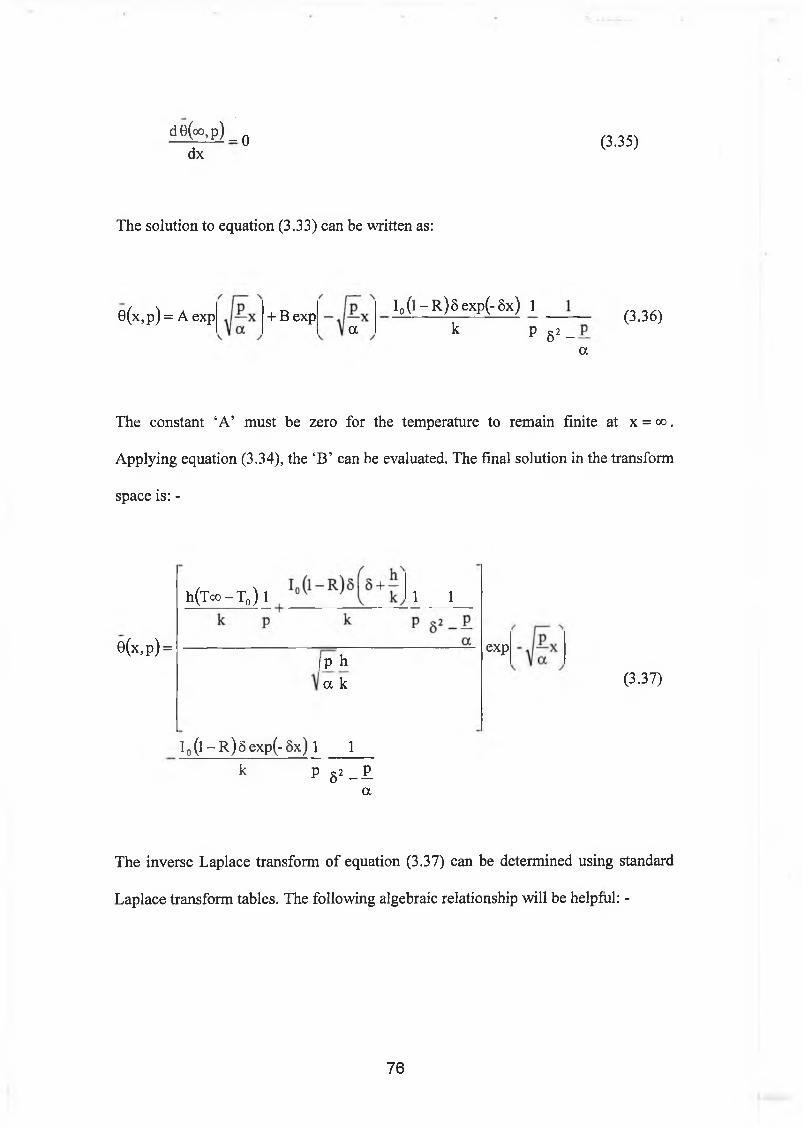
d 6(°o, p) _ q dx (3.35)
The solution to equation (3.33) can be written as:
0(x,p) = A exp + Bexpa
I0(l-R)8exp(-5x) 1 k p
(3.36)S2 -
a
The constant ‘A’ must be zero for the temperature to remain finite at x = o o .
Applying equation (3.34), the ‘B’ can be evaluated. The final solution in the transform
space is: -
h (T o o -T 0) l 1 1
e(x,p)=IP ^a k
exp
(3.37)
I 0( l - R ) 8 e x p ( - 8 x ) 1 1
k P 82_ 1a
The inverse Laplace transform of equation (3.37) can be determined using standard
Laplace transform tables. The following algebraic relationship will be helpful: -
76

+ bXV? + a) al)2 P a(a2 — b2)VpU/p +a)( a ~ b ) 1
2 b 2(a2 - b 2) V p ( V p - b )
, (a + b ) 1
2 b 2(a2 - b : )V p(V p + b)
1 1 1 1 1
(3.38)
The following inverse Laplace transform relationships will be used [120]: -
£■' (-Wp))(7 p + a ) _
a exp = - exp(a21 + ak) erfcz' 1
- V + aVTv 2 \ t y
+ erfcv 2 V ty
exp(~ k a/ p ) = erfc f k IP ^2> /t,
exp(- k /p)P W P + a
= exp(a2t + ak)erfc(^= + aVt
. p ( p - b).= r [exp(bt)-l] b
The inverse transform of equation (3.37) can be written, using the above Laplace
transform relationship, as: -
77
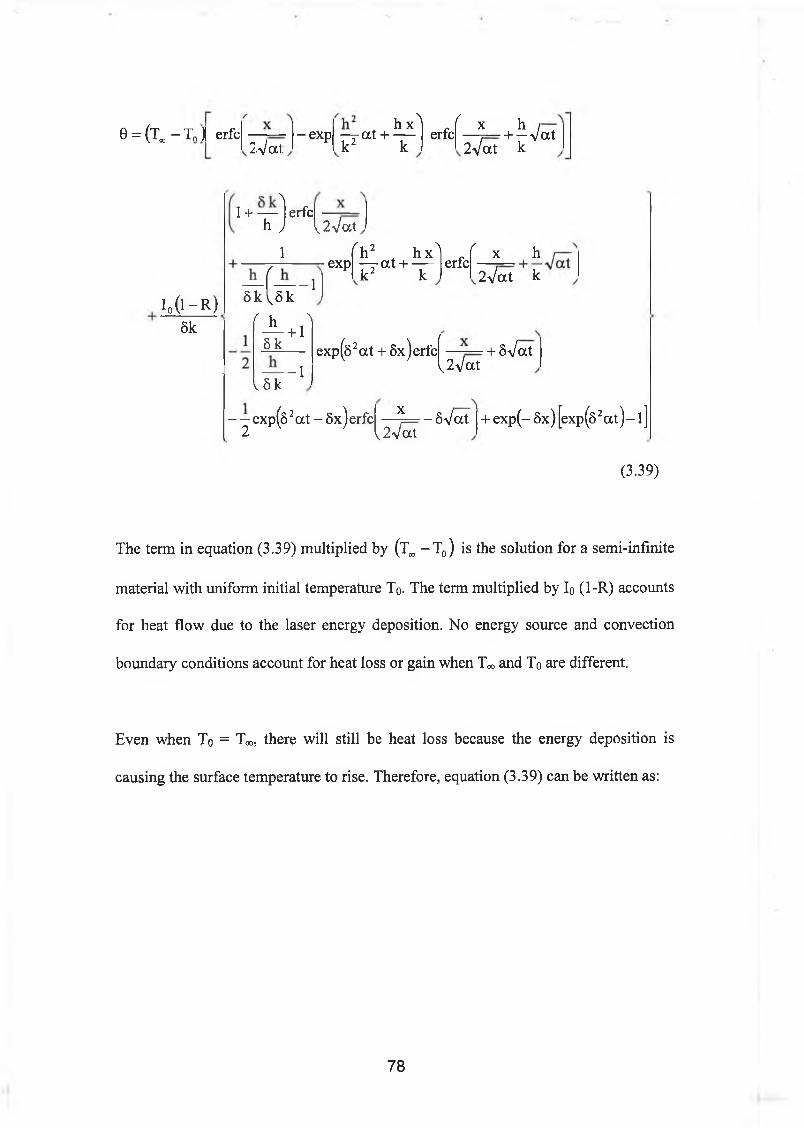
M t. - T J erfcI t/ oX
-exp hx —r a t + —k2 k
\ ferfc x
2 V a t
hk
+ —Vat
1.(1 - R )
1 + — 1 erfch ) 1^2Vat
1
— f — - 18 k U k
expV hx— at + —- k2 k
> ferfc x h
2 -\/at k
8k ' i +r8 k__— - I
1 8 k
exp (82 at + 8x)erfc( — + S-v/at { 2 Vat
--exp(8 2a t - 8x)erfc — = - 8Vat +exp(-8x)[exp(8 2at)-l] 2 l,2 V a t
(3.39)
The term in equation (3.39) multiplied by (Tm -T0) is the solution for a semi-infinite
material with uniform initial temperature To. The term multiplied by Io (1-R) accounts
for heat flow due to the laser energy deposition. No energy source and convection
boundary conditions account for heat loss or gain when T«, and To are different.
Even when To = T«,, there will still be heat loss because the energy deposition is
causing the surface temperature to rise. Therefore, equation (3.39) can be written as:
78
' f i 3 1I h j
erfcf x N
2 V a t
+
0 = 1 . 6 - R )— f — - l8k L 8k
exp
/
r h 2 hx— a t + — k 2 k
'n f erfc
/
x h /— — V a t
2 V a t k
8k8k___
— - 1 8k
exp(s2a t + 8x)erfc^ ^ Jr— + 8 V a t
^ exp(82 a t - Sx) erfc ~ 8V a t +exp(-8x)[exp(s 2a t ) - l ]
or
T -T
8k
1 + — I erfch J 2 V a t
+ ■1
h8k ,
exp
/
^h2 hx- ^ - a t + — k 2 k
A / erfc
v
x h [— ; + — vat
\
v2 V a t k j8k
f h8k
+ 1
A _ i8k .
exp(82a t + 8 x ) e r f c ^ ^ - j= + 8 \ /a t
- i exp (s2a t - 8x )erfc^- ^ r - - 8 V a t j
+ ex;p ( - 8x) [exp(s2a t ) - l ]
(3.40)
Equation (3.40) is used when computing the temperature profiles in the substrate due
to convective boundary condition.
79
C H A P T E R - 4
R E S U L T S A N D D I S C U S S I O N S
4.1 Heat Transfer Analysis
The temperature profiles obtained from the conduction-limited and non
conduction-limited heating are given below: -
The variations of surface temperature resulting from conduction-limited and
non-conduction-limited heating with time are shown in figures (4.1) to (4.3). For both
types of heating, the surface temperature rises rapidly in the beginning of the pulse.
This may be due to heat transfer taking place through electron-phonon collisions
inside the material, i.e., electrons close to the surface absorb the incident laser
radiation and transfer their excess energy to phonon through an increased rate of
collision. The higher the energy of the electron the higher the rate of collision. As the
melting temperature is approached, the probability of molecules forming the liquid
phase does not increase as much as the probability of collisions occurring at the
surface. Consequently, the energy gained due to laser beam irradiation enhances the
increase of internal energy of the melt, rather than increasing the number of
80
molecules, which exist in the liquid form [119]. Under these conditions, the internal
energy of the substrate increases due to increased phonon energy, which in turn gives
rise to high surface temperature. Figure (4.1) shows the results for two values of
power intensity ( I o ) for conduction-limited heating.
A comparison of figures (4.2) and (4.3) shows a similar trend of rise in
temperature for non-conduction limited case with convective boundary conditions. As
the intensity of the incident beam increases, however, the temperature rise also
increases. This increase is more pronounced as the heating progresses. In this case, the
energy transferred from the electrons to the lattice site atoms becomes considerable,
i.e. the lattice site atom temperature rises at a relatively faster rate. The effect of heat
transfer coefficient on the surface temperature profiles is negligible. This may occur
because of the fact that the energy absorbed by the substrate is converted into internal
energy rather than being transferred from the surface to the environment through the
convection. It is, therefore, expected that the loss of energy due to convection from
the surface is considerably smaller compared with the internal energy gain of the
substrate.
81
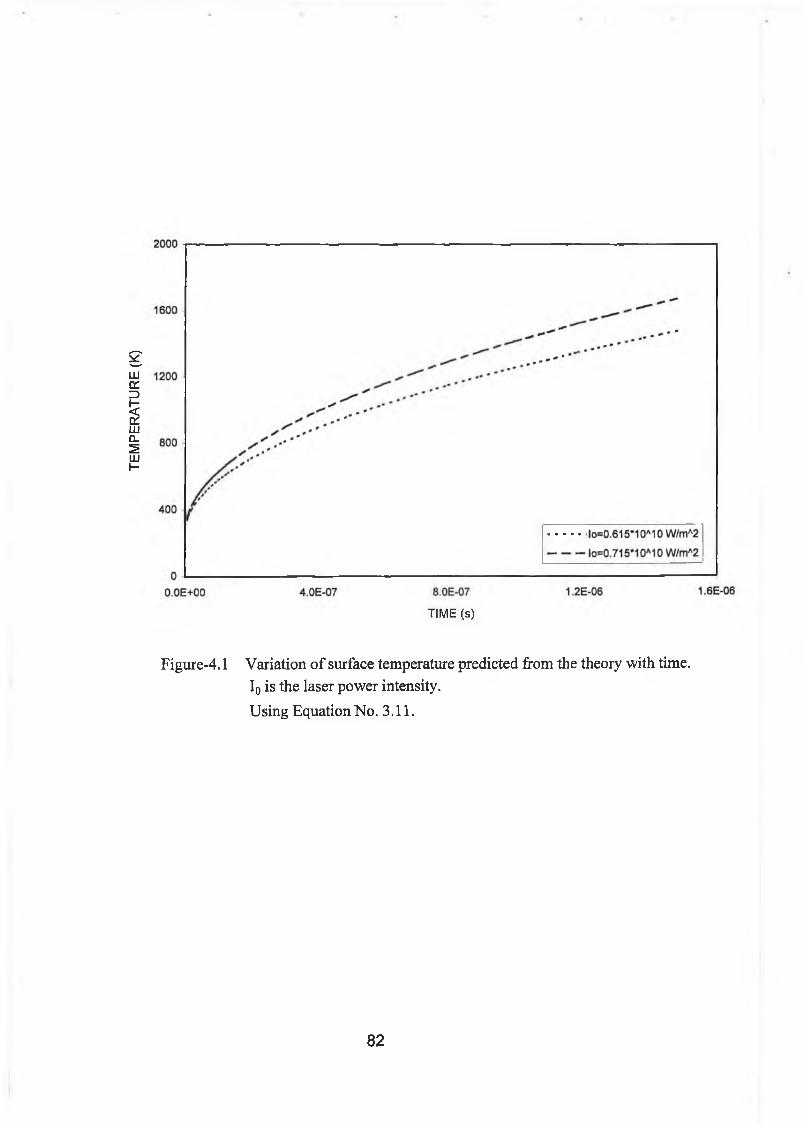
TEM
PERA
TURE
(K
)
TIME (s)
Figure-4.1 Variation of surface temperature predicted from the theory with time. I0 is the laser power intensity.Using Equation No. 3.11.
82
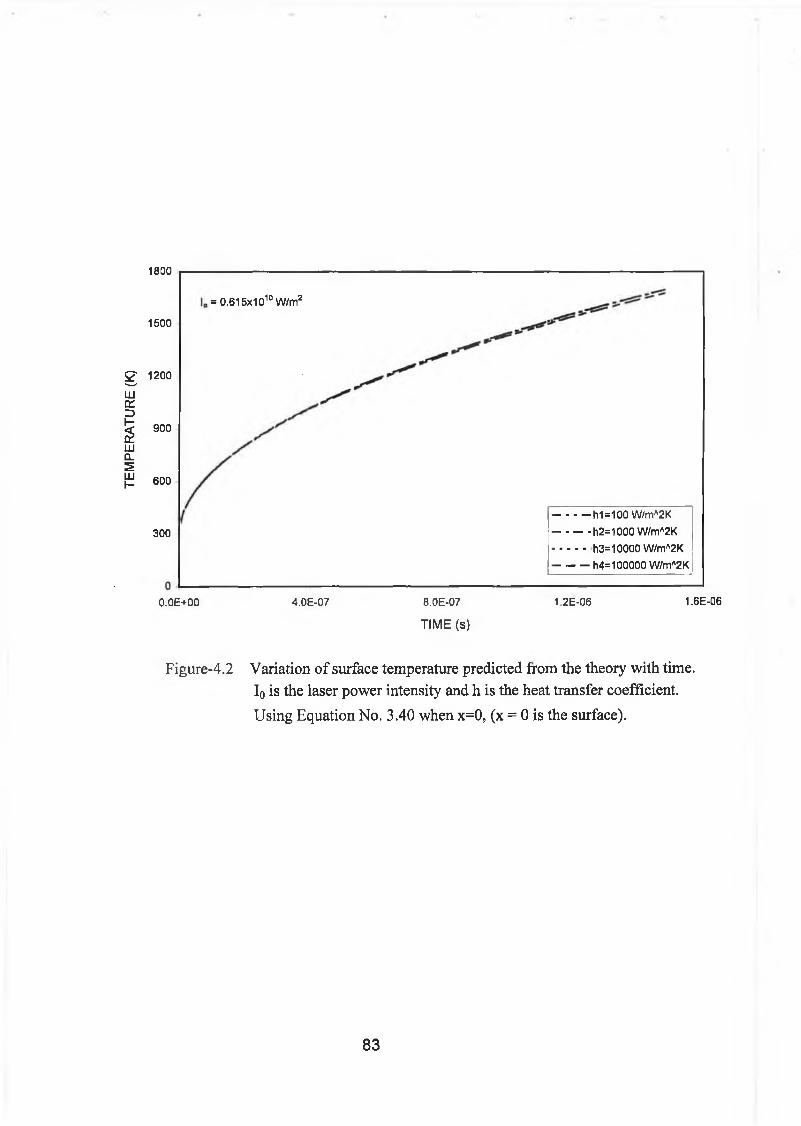
TEM
PERA
TURE
(K
)
1 8 0 0
1 5 0 0
1200
9 0 0
6 0 0
3 0 0
, = 0 . 6 1 5 x 1 0 1 0 W / m 2
h 1 = 1 0 0 W / m A2 K
---------------h 2 = 1 0 0 0 W / m A2 K
h 3 = 1 0 0 0 0 W / m A2 K
h 4 = 1 0 0 0 0 0 W / m A2 K
0 . 0 E + 0 0 4 . 0 E - 0 7 8 . 0 E - 0 7
TIME (s)
1 . 2 E - 0 6 1 . 6 E - 0 6
Figure-4.2 Variation of surface temperature predicted from the theory with time.I0 is the laser power intensity and h is the heat transfer coefficient. Using Equation No. 3.40 when x=0, (x = 0 is the surface).
83
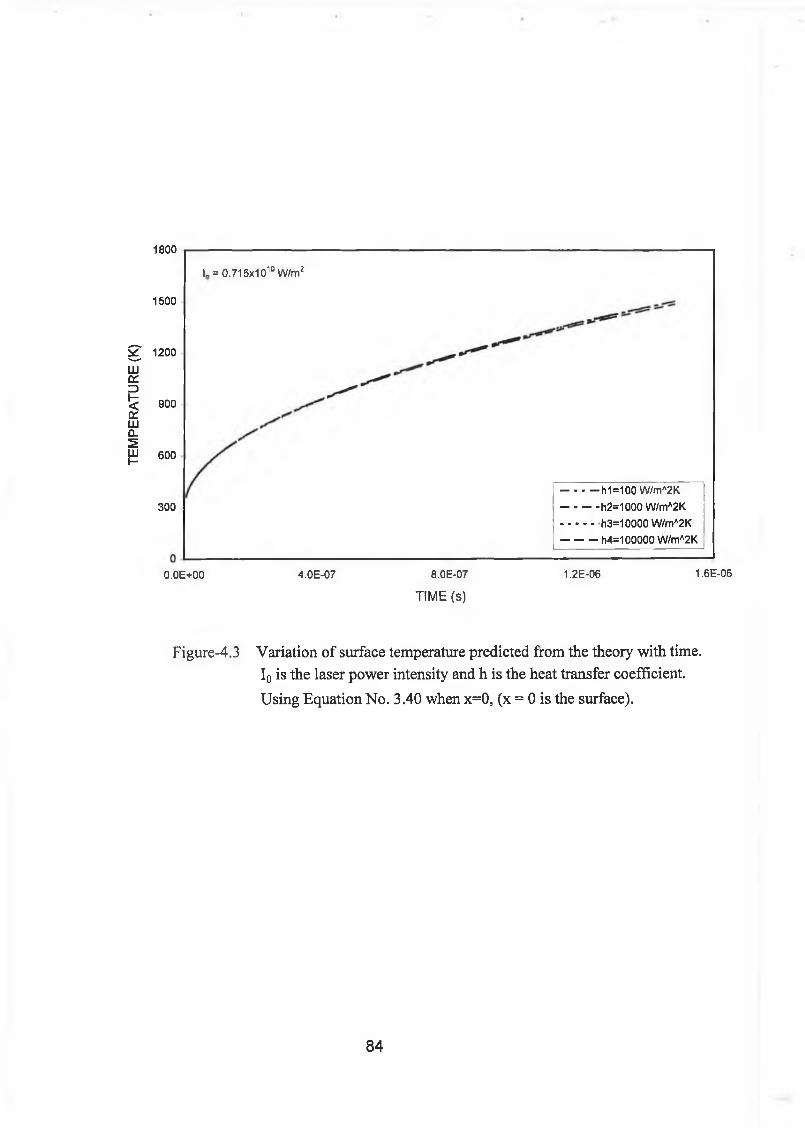
TEM
PERA
TURE
(K
)
1 8 0 0
1 5 0 0
1200
9 0 0
6 0 0
3 0 0
L = 0 . 7 1 5 x 1 0 1 0 W / m 2
h 1 = 1 0 0 W / m A2 K
---------------h 2 = 1 0 0 0 W / m A2 K
h 3 = 1 0 0 0 0 W / m A2 K
-------------- h 4 = 1 0 0 0 0 0 W / m A2 K
0 . 0 E + 0 0 4 . 0 E - 0 7 8 . 0 E - 0 7
TIME (s)
1 . 2 E - 0 6 1 . 6 E - 0 6
Figure-4.3 Variation of surface temperature predicted from the theory with time.I0 is the laser power intensity and h is the heat transfer coefficient. Using Equation No. 3.40 when x=0, (x = 0 is the surface).
84
Figures (4.4) to (4.6) show the temperature profiles inside the substrate. In
general, in the case of conduction-limited heating (figure 4.4), the temperature decays
smoothly with increasing dimensionless distance. As the intensity increases, the
resulting temperature profile is shifted towards higher values. In this case, the
temperature shift in the surface region becomes slightly higher than that
corresponding to some distance away from the surface. This may be due to the
absorption process, i.e., the absorption of the incident beam is considerably high in
the surface region, which in turn increases the internal energy gain in this region. The
net result is the increase in the temperature in the surface region.
85
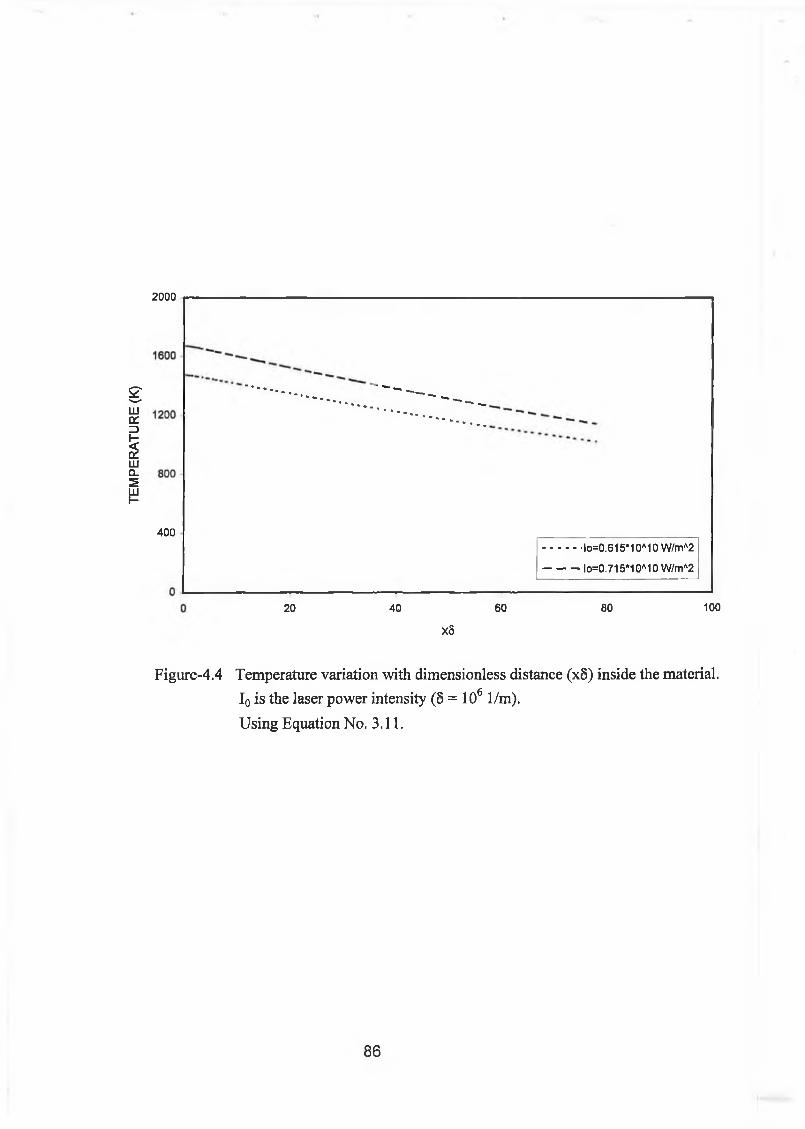
TE
MP
ER
AT
UR
E
(K)
2000
400 ■lo=0.615‘10A10 W/mA2
-----------lo=0.715*10A10 W/mA2
20 40 60 80 100
x5
Figure-4.4 Temperature variation with dimensionless distance (x8) inside the material. I0 is the laser power intensity (8 = 1061/m).Using Equation No. 3.11.
86
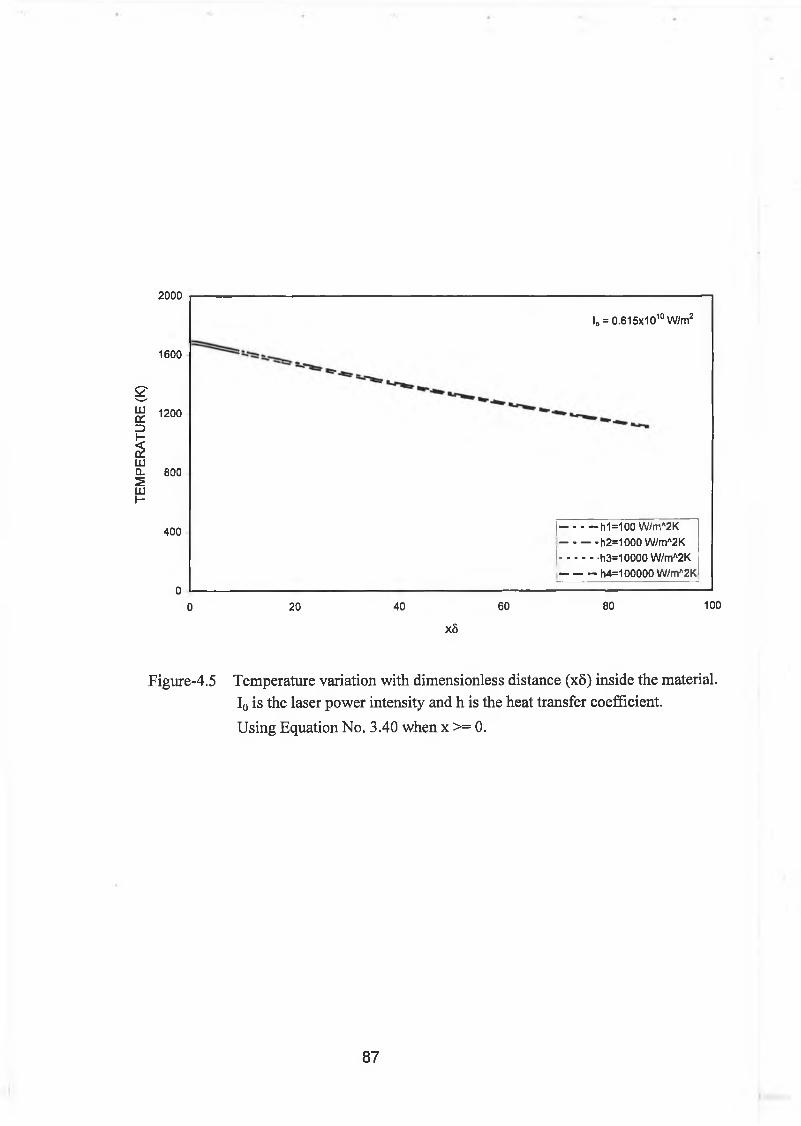
TE
MP
ER
AT
UR
E
(K)
2000
l0 = 0.615x10¹⁰W/m2
1600
1200
800
400 |----------h1=100 W/mA2K----------h2=1000 W/mA2Kj h3=10000W/mA2K'--------- h4=100000 W/mA2K
00 20 40 60 80 100
x8
Figure-4.5 Temperature variation with dimensionless distance (xS) inside the material. I0 is the laser power intensity and h is the heat transfer coefficient.Using Equation No. 3.40 when x >= 0.
87
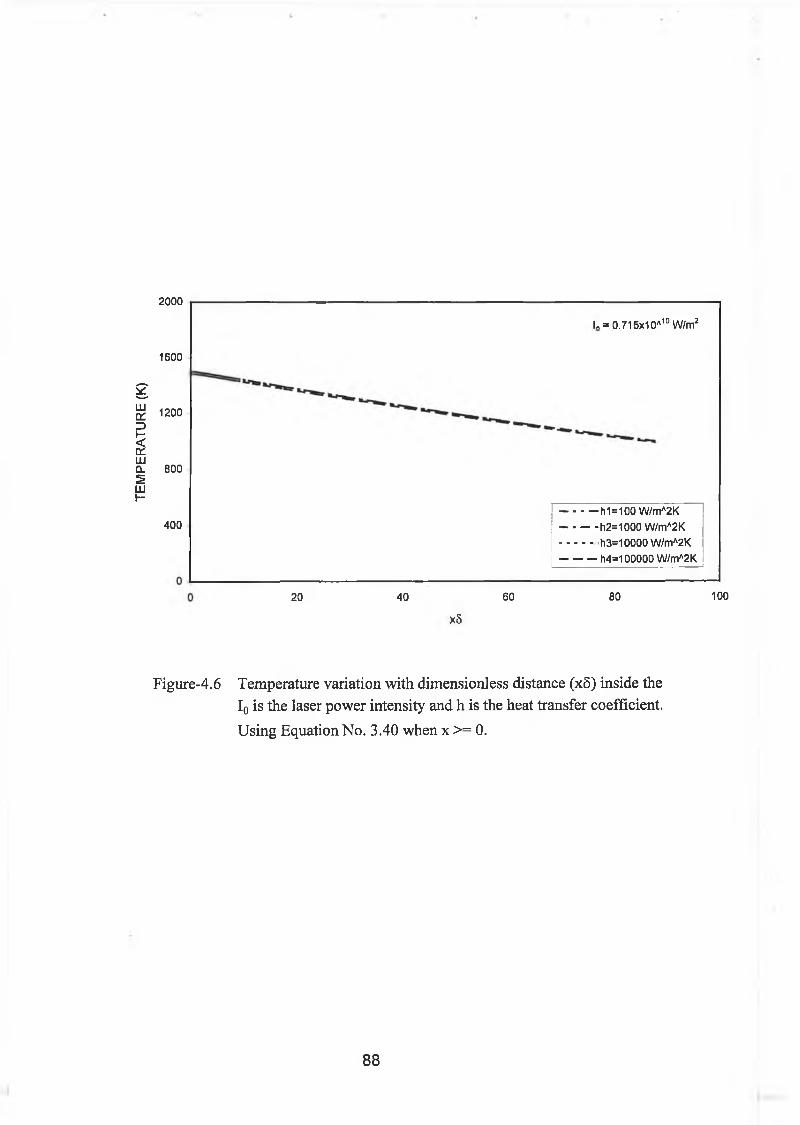
TE
MP
ER
AT
UR
E
(K)
2000
L = 0.715x10AloW/mz
1600
1200
800
400 h1=100 W/mA2K h2=1000 W/mA2K h3=10000 W/mA2K--------- h4=100000W/mA2K
20 40
x5
60 80 100
Figure-4.6 Temperature variation with dimensionless distance (x5) inside the I0 is the laser power intensity and h is the heat transfer coefficient. Using Equation No. 3.40 when x >= 0.
88
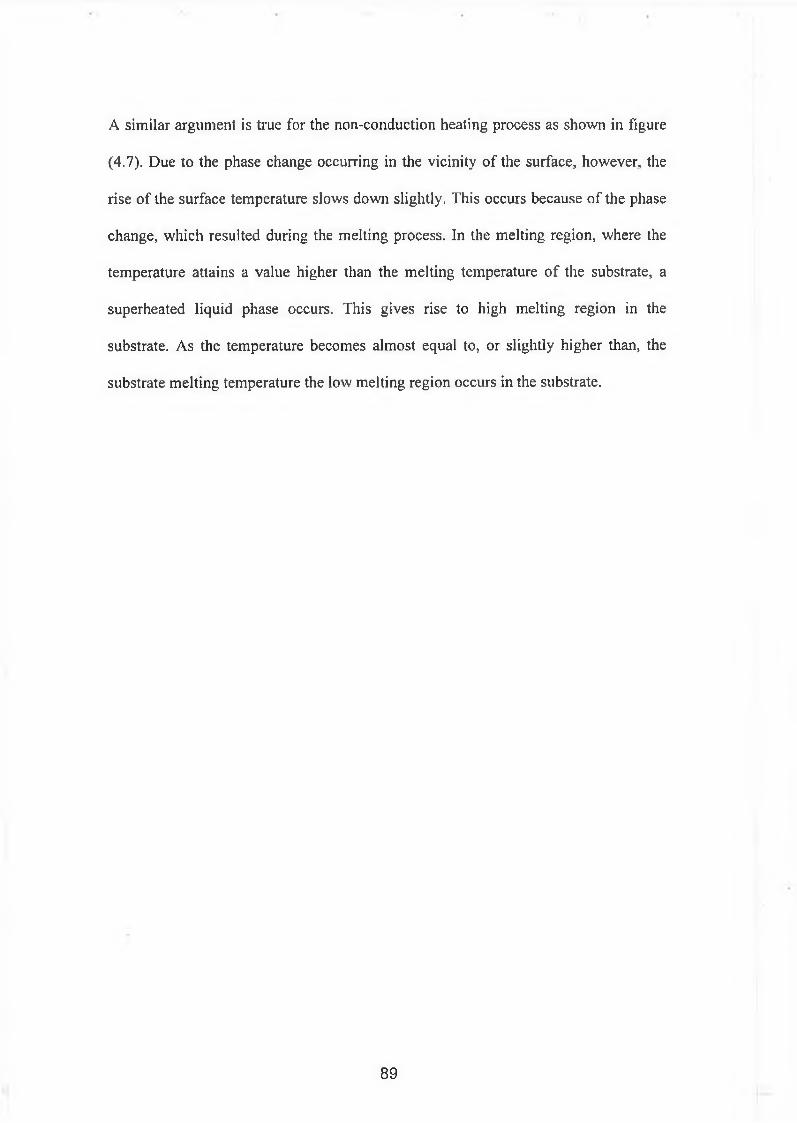
A similar argument is true for the non-conduction heating process as shown in figure
(4.7). Due to the phase change occurring in the vicinity of the surface, however, the
rise of the surface temperature slows down slightly. This occurs because of the phase
change, which resulted during the melting process. In the melting region, where the
temperature attains a value higher than the melting temperature of the substrate, a
superheated liquid phase occurs. This gives rise to high melting region in the
substrate. As the temperature becomes almost equal to, or slightly higher than, the
substrate melting temperature the low melting region occurs in the substrate.
89
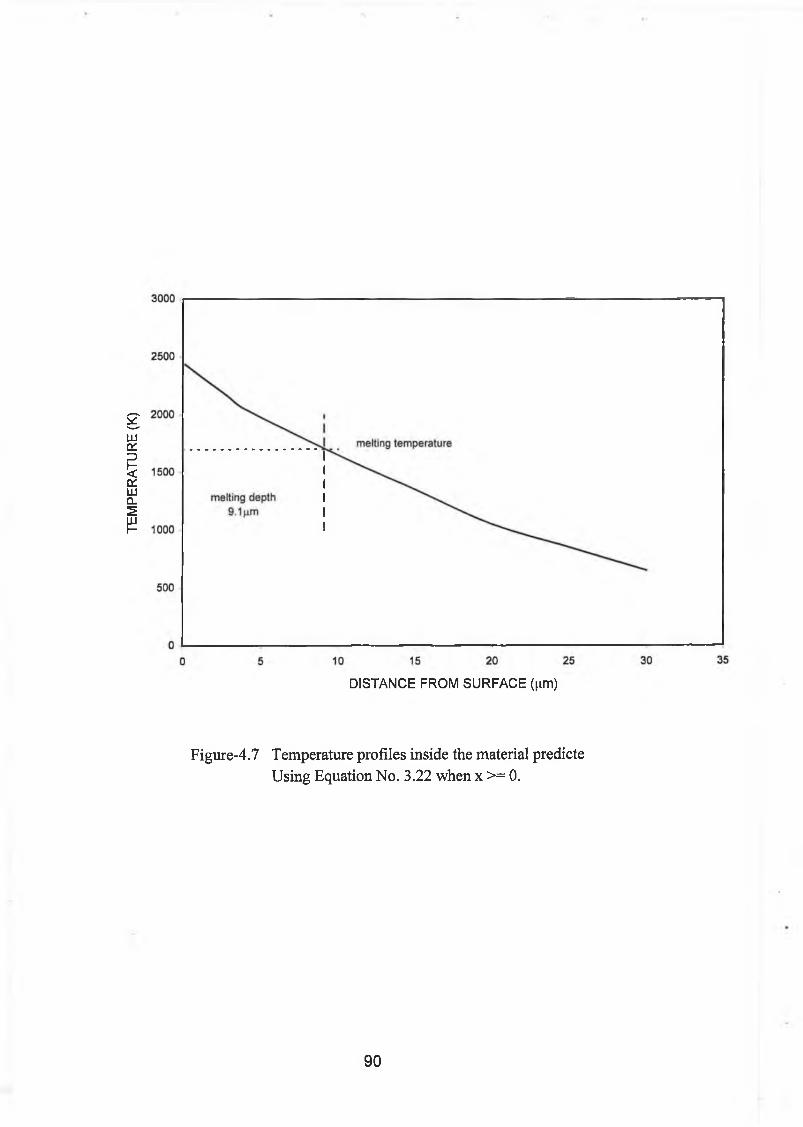
TE
MP
ER
AT
UR
E
(K)
DISTANCE FROM SURFACE (jim)
Figure-4.7 Temperature profiles inside the material predicte Using Equation No. 3.22 when x >= 0.
90
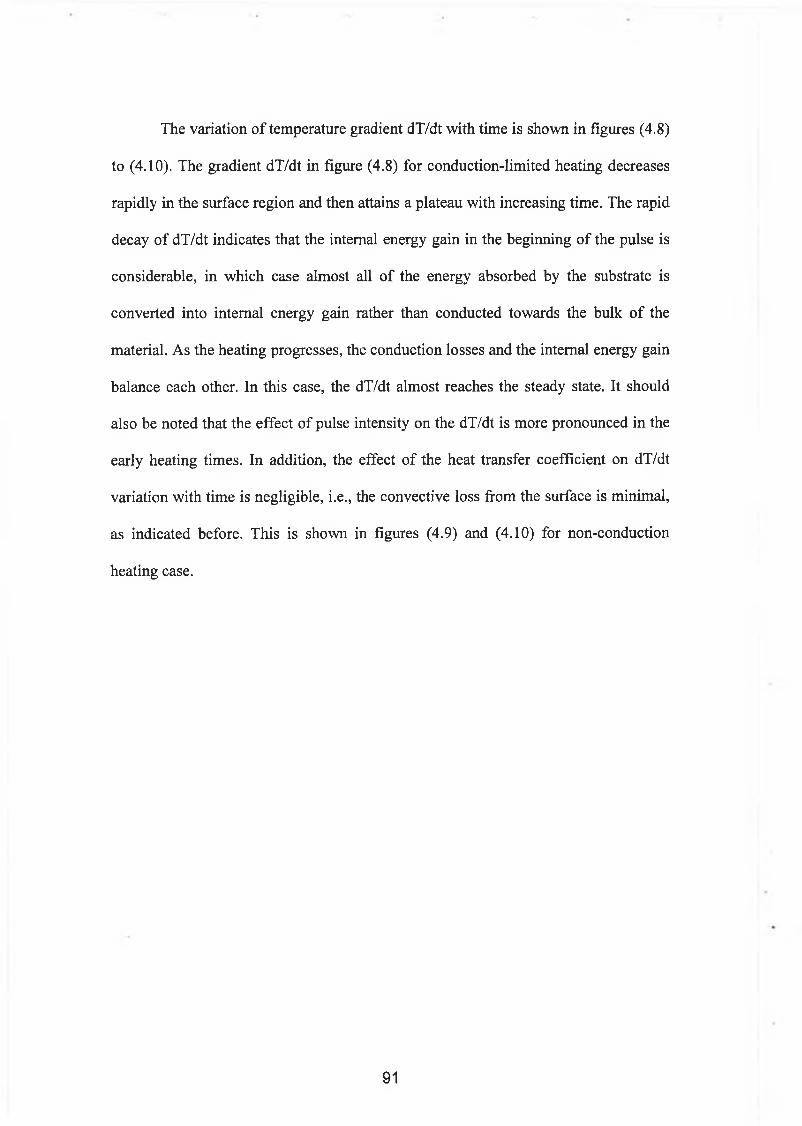
The variation of temperature gradient dT/dt with time is shown in figures (4.8)
to (4.10). The gradient dT/dt in figure (4.8) for conduction-limited heating decreases
rapidly in the surface region and then attains a plateau with increasing time. The rapid
decay of dT/dt indicates that the internal energy gain in the beginning of the pulse is
considerable, in which case almost all of the energy absorbed by the substrate is
converted into internal energy gain rather than conducted towards the bulk of the
material. As the heating progresses, the conduction losses and the internal energy gain
balance each other. In this case, the dT/dt almost reaches the steady state. It should
also be noted that the effect of pulse intensity on the dT/dt is more pronounced in the
early heating times. In addition, the effect of the heat transfer coefficient on dT/dt
variation with time is negligible, i.e., the convective loss from the surface is minimal,
as indicated before. This is shown in figures (4.9) and (4.10) for non-conduction
heating case.
91
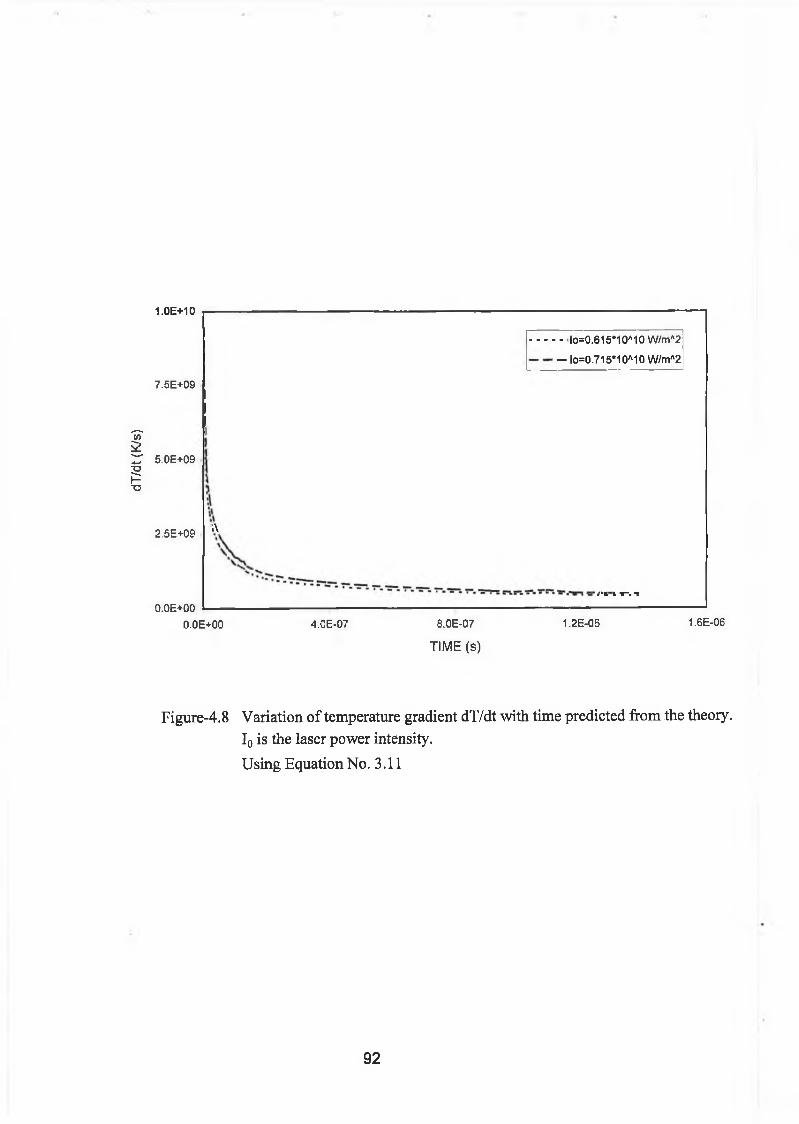
dT/dt
(K/
s)
1.0E+10
7.5E+09
5.0E+09
2.5E+09
O.OE+OO
■ - lo=0.615*10A10 W/mA2
— lo=0.715*10A10 W/mA2
A
1 t'J. L 1“ - T
O.OE+OO 4.0E-07 8.0E-07
TIME (S)
1.2E-06 1.6E-06
Figure-4.8 Variation of temperature gradient dT/dt with time predicted from the theory. I0 is the laser power intensity.Using Equation No. 3.11
92
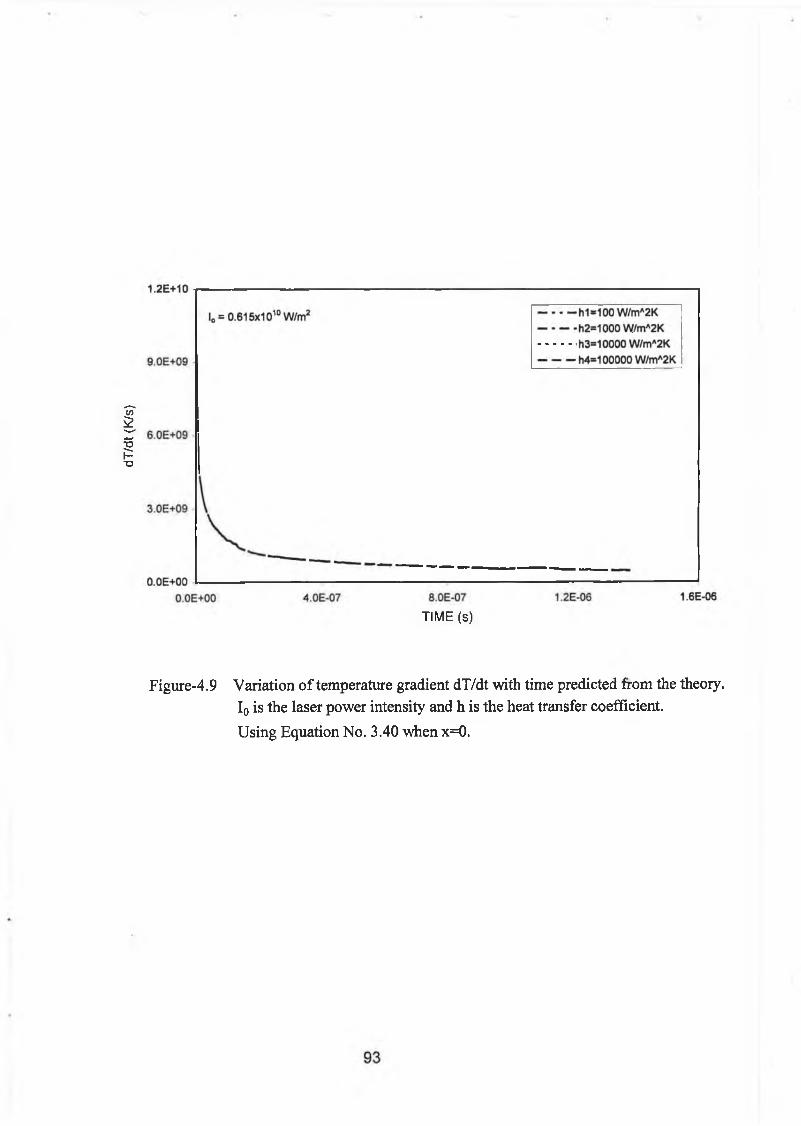
dT/dt
(K/
s)
TIME (s)
Figure-4.9 Variation of temperature gradient dT/dt with time predicted from the theory. I0 is the laser power intensity and h is the heat transfer coefficient.Using Equation No. 3.40 when x=0.
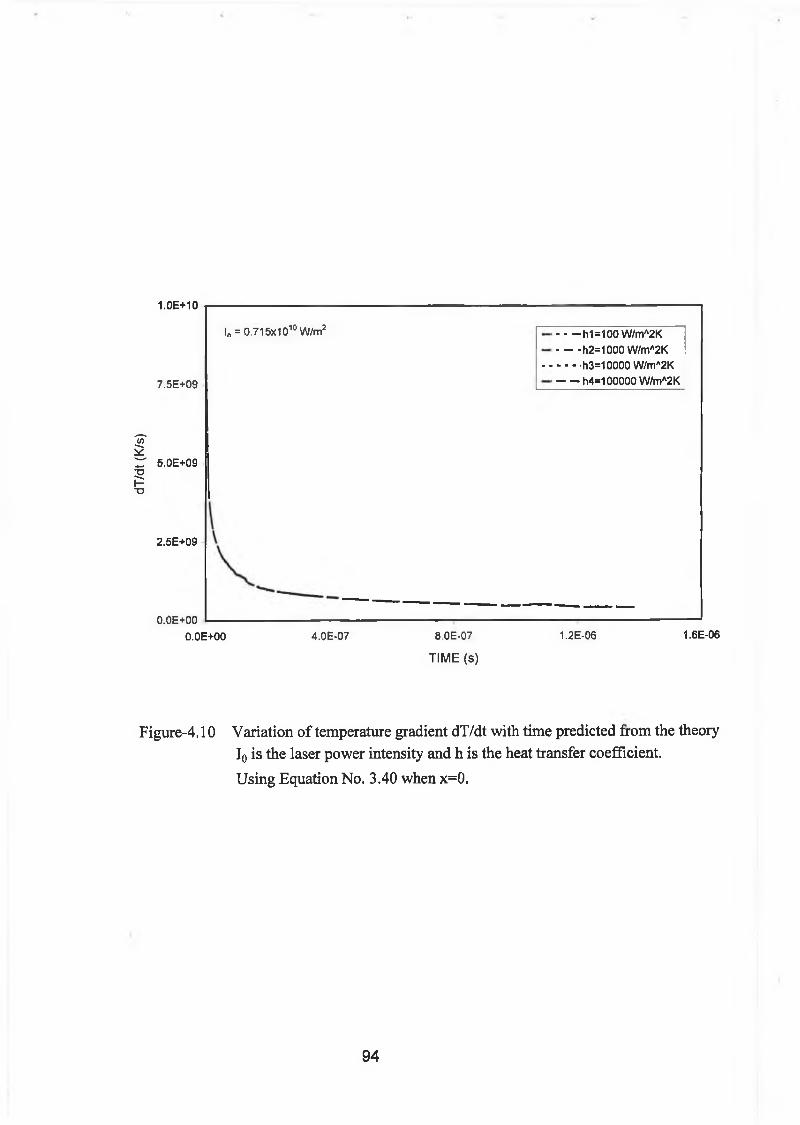
dT/dt
(K/
s)
1.0E+10
7.5E+09
5.0E+09
2.5E+09
O.OE+OO
lo = 0.715x101°W/m2
O.OE+OO
h1=100 W/mA2K h2=1000 W/mA2K h3=10000W/mA2K h4=1 OOOOO W/mA2K
4.0E-07 8.0E-07
TIME (S)
1.2E-06 1.6E-06
Figure-4.10 Variation of temperature gradient dT/dt with time predicted from the theory I0 is the laser power intensity and h is the heat transfer coefficient.Using Equation No. 3.40 when x=0.
94
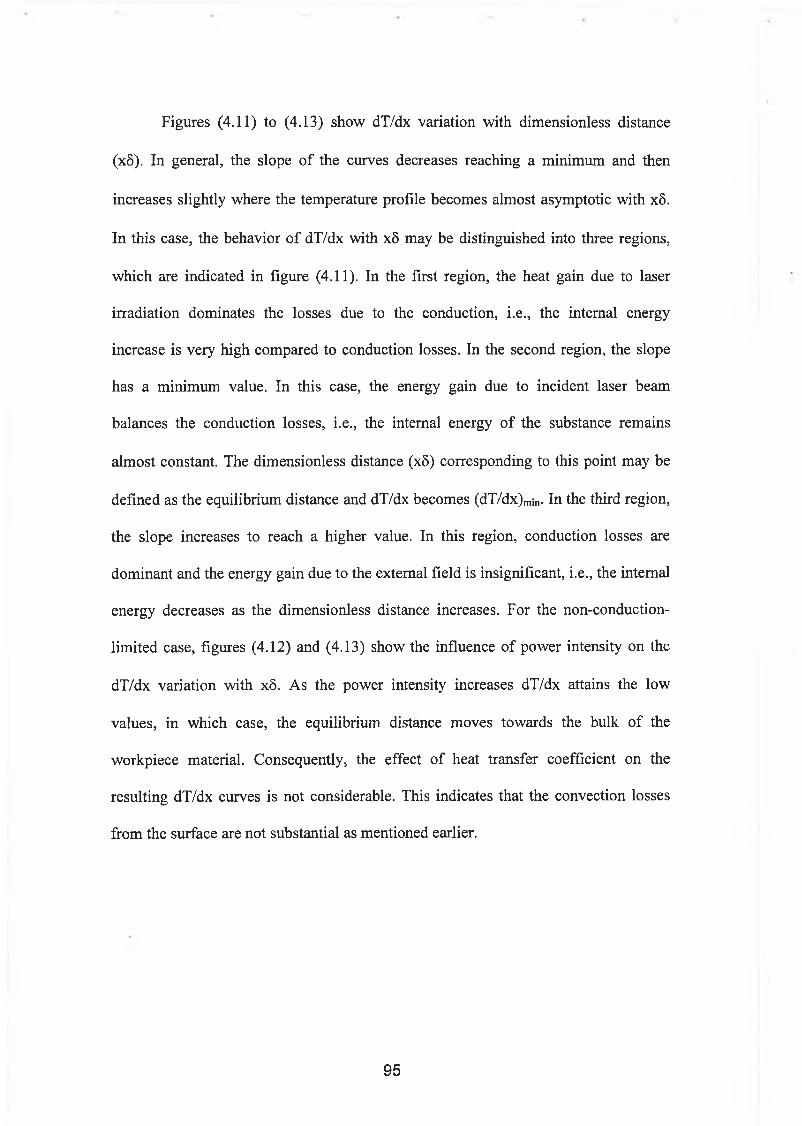
Figures (4.11) to (4.13) show dT/dx variation with dimensionless distance
(x8). In general, the slope of the curves decreases reaching a minimum and then
increases slightly where the temperature profile becomes almost asymptotic with x8.
In this case, the behavior of dT/dx with x8 may be distinguished into three regions,
which are indicated in figure (4.11). In the first region, the heat gain due to laser
irradiation dominates the losses due to the conduction, i.e., the internal energy
increase is very high compared to conduction losses. In the second region, the slope
has a minimum value. In this case, the energy gain due to incident laser beam
balances the conduction losses, i.e., the internal energy of the substance remains
almost constant. The dimensionless distance (x8) corresponding to this point may be
defined as the equilibrium distance and dT/dx becomes (dT/dx)mjn. In the third region,
the slope increases to reach a higher value. In this region, conduction losses are
dominant and the energy gain due to the external field is insignificant, i.e., the internal
energy decreases as the dimensionless distance increases. For the non-conduction-
limited case, figures (4.12) and (4.13) show the influence of power intensity on the
dT/dx variation with x8. As the power intensity increases dT/dx attains the low
values, in which case, the equilibrium distance moves towards the bulk of the
workpiece material. Consequently, the effect of heat transfer coefficient on the
resulting dT/dx curves is not considerable. This indicates that the convection losses
from the surface are not substantial as mentioned earlier.
95
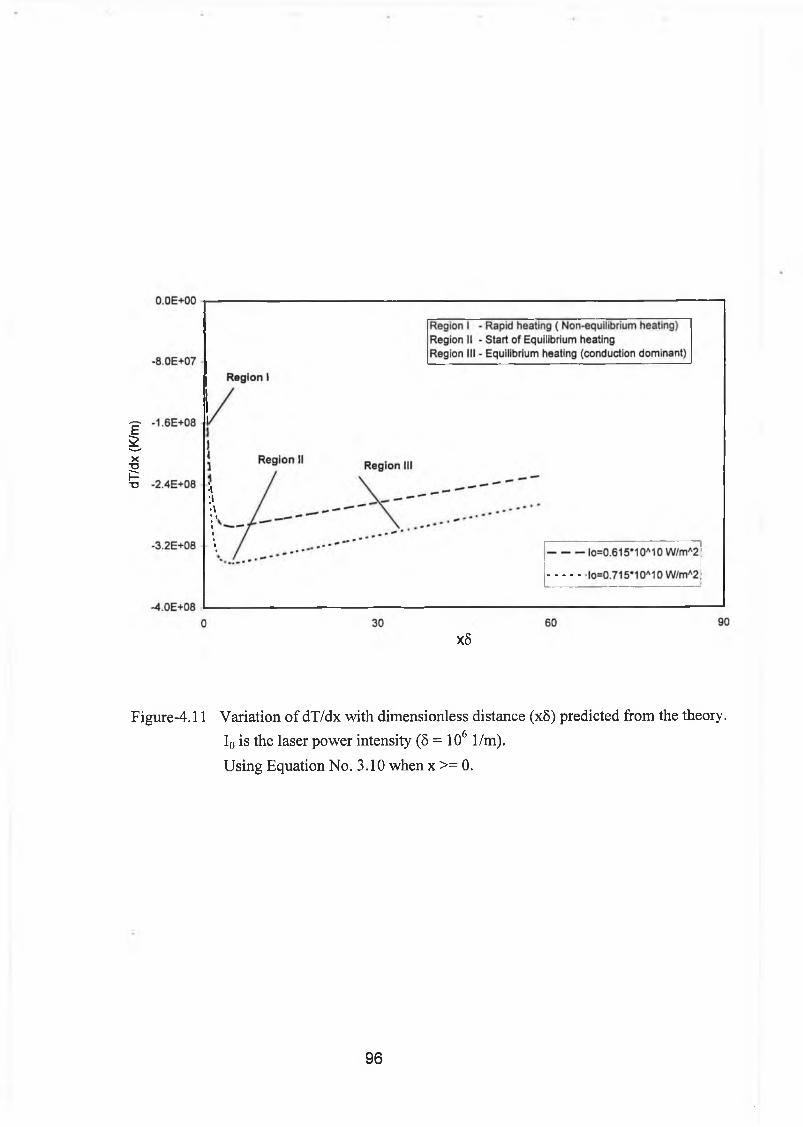
dT/dx
(K/
m)
x8
Figure-4.11 Variation of dT/dx with dimensionless distance (x5) predicted from the theory. I0 is the laser power intensity (8 = 106 1/m).Using Equation No. 3.10 when x >= 0.
96
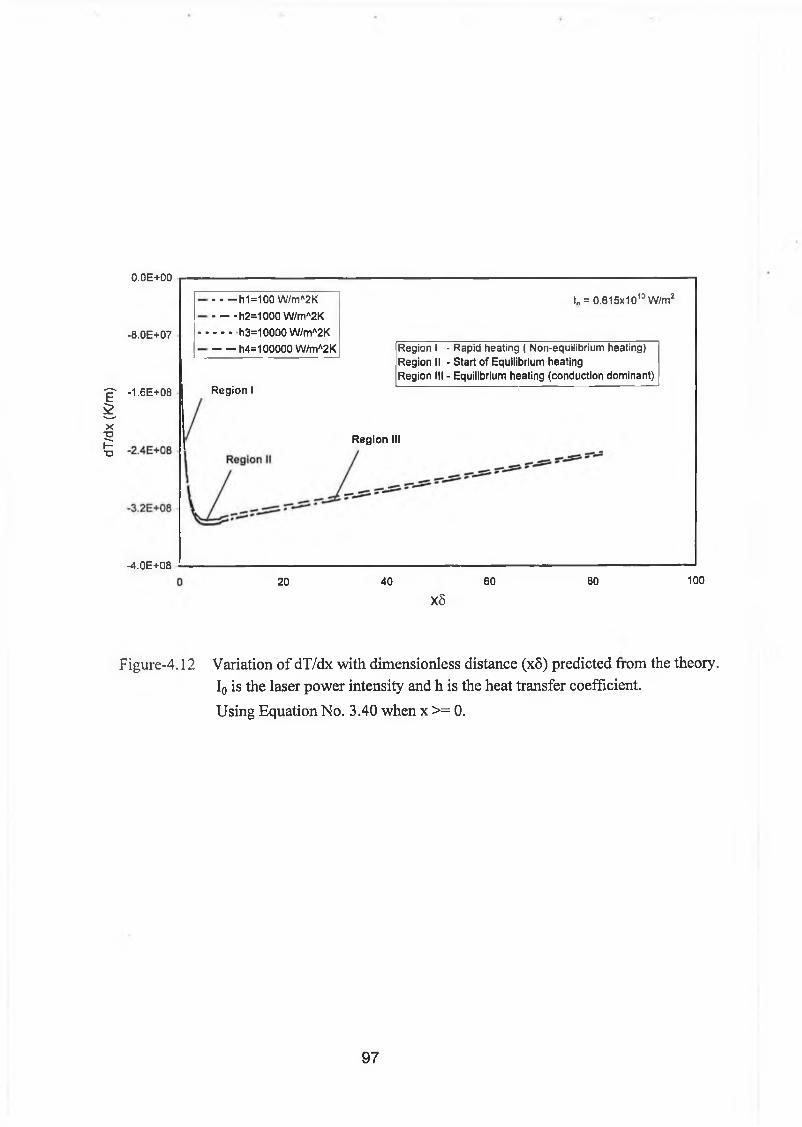
dT/dx
(K
/m)
O.OE+OO
-8.0E+07
-1.6E+08
-4.0E+08
h i=100 W/mA2K h2=1000 W/mA2K h3=10000 W/mA2K h4=100000 W/mA2K
t„ = 0.615x101t> W/m2
Region I
Region I - Rapid heating ( Non-equilibrium heating)Region II - Start of Equilibrium heatingRegion III - Equilibrium heating (conduction dominant)
Region III
20 40 60 80
x8
100
Figure-4.12 Variation of dT/dx with dimensionless distance (xô) predicted from the theory. I0 is the laser power intensity and h is the heat transfer coefficient.Using Equation No. 3.40 when x >= 0.
97
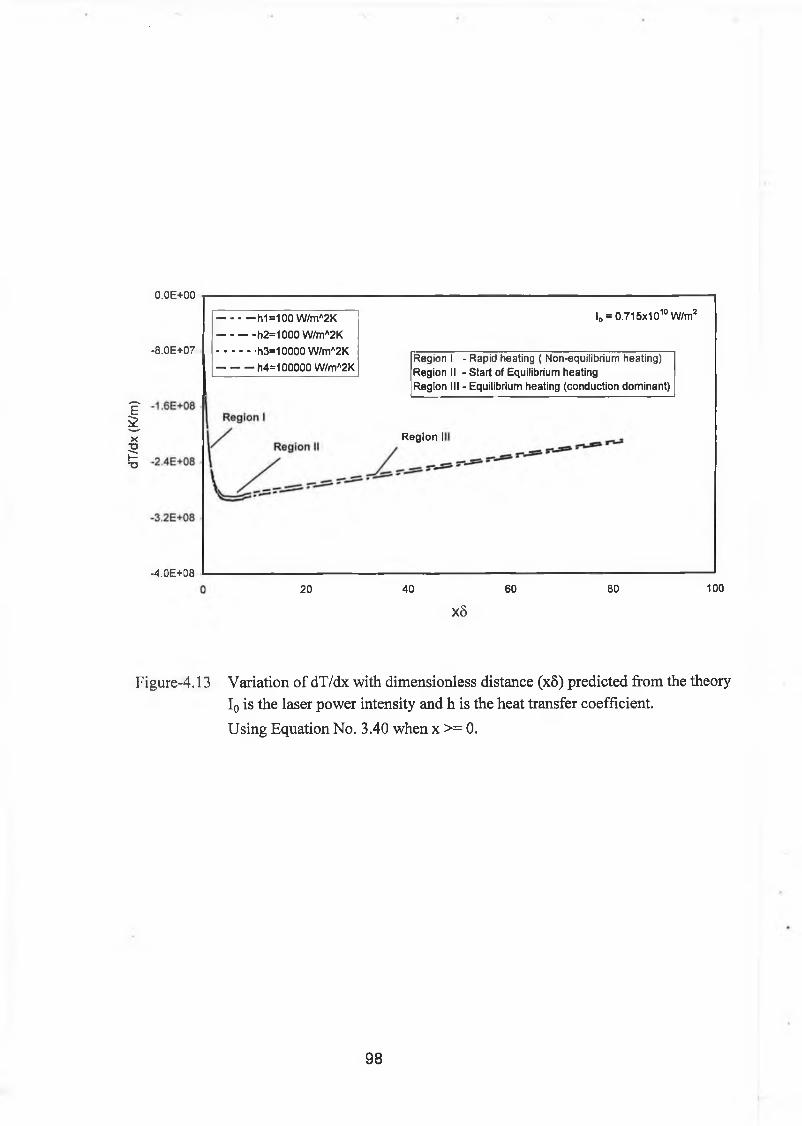
dT/dx
(K/
m)
O.OE+OO
-8.0E+07
-4.0E+08
h1=100W/mA2K h2=1000 W/mA2K 'h3=10000 W/mA2K--------- h4=100000 W/mA2K
l0 = 0.715x101oW/m2
Region I - Rapid heating ( Non-equilibrium heating)Region II - Start of Equilibrium heatingRegion III - Equilibrium heating (conduction dominant)
Region I
20 40 60 80
x8
100
Figure-4.13 Variation of dT/dx with dimensionless distance (x8) predicted from the theory I0 is the laser power intensity and h is the heat transfer coefficient.Using Equation No. 3.40 when x >= 0.
98
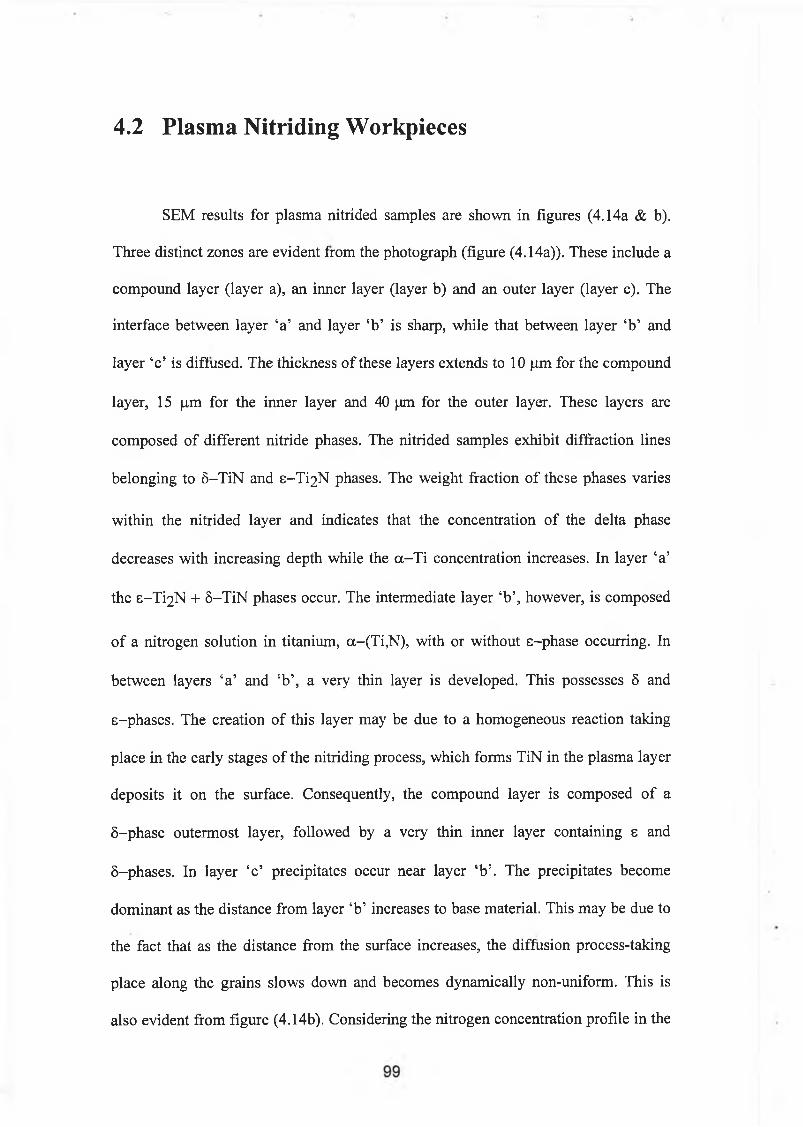
4 . 2 P l a s m a N i t r i d i n g W o r k p i e c e s
SEM results for plasma nitrided samples are shown in figures (4.14a & b).
Three distinct zones are evident from the photograph (figure (4.14a)). These include a
compound layer (layer a), an inner layer (layer b) and an outer layer (layer c). The
interface between layer ‘a’ and layer ‘b’ is sharp, while that between layer ‘b’ and
layer ‘c’ is diffused. The thickness of these layers extends to 10 |im for the compound
layer, 15 (im for the inner layer and 40 (jm for the outer layer. These layers are
composed of different nitride phases. The nitrided samples exhibit diffraction lines
belonging to 8-TiN and s-Ti2N phases. The weight fraction of these phases varies
within the nitrided layer and indicates that the concentration of the delta phase
decreases with increasing depth while the a-Ti concentration increases. In layer ‘a’
the s-Ti2N + 5-TiN phases occur. The intermediate layer ‘b \ however, is composed
of a nitrogen solution in titanium, a-(Ti,N), with or without e-phase occurring. In
between layers ‘a’ and ‘b’, a very thin layer is developed. This possesses 8 and
e-phases. The creation of this layer may be due to a homogeneous reaction taking
place in the early stages of the nitriding process, which forms TiN in the plasma layer
deposits it on the surface. Consequently, the compound layer is composed of a
8-phase outermost layer, followed by a very thin inner layer containing e and
8-phases. In layer ‘c’ precipitates occur near layer ‘b’. The precipitates become
dominant as the distance from layer ‘b’ increases to base material. This may be due to
the fact that as the distance from the surface increases, the diffusion process-taking
place along the grains slows down and becomes dynamically non-uniform. This is
also evident from figure (4.14b). Considering the nitrogen concentration profile in the

matrix, the nitride formation will first occur on the substrate surface, due to the
foremost encounter of the high nitrogen content. Once the maximum nitriding is
reached, the crystallites lattice stage changes towards the face- centered cubic (f.c.c.).
100
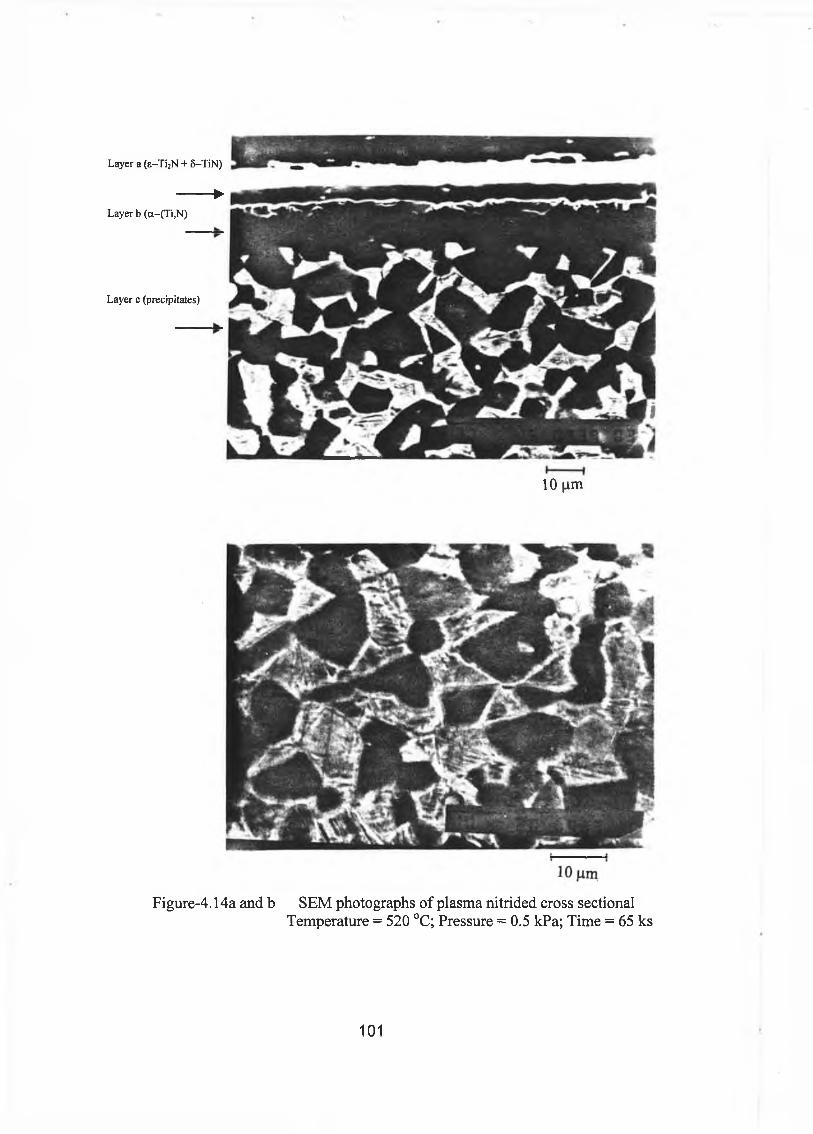
Layer a (e-T i2N + 5-TiN)
►Layer b (a-(T i,N )
Layer c (precipitates)
10 |im
Figure-4.14a and b SEM photographs of plasma nitrided cross sectionalTemperature = 520 °C; Pressure = 0.5 kPa; Time = 65 ks
101
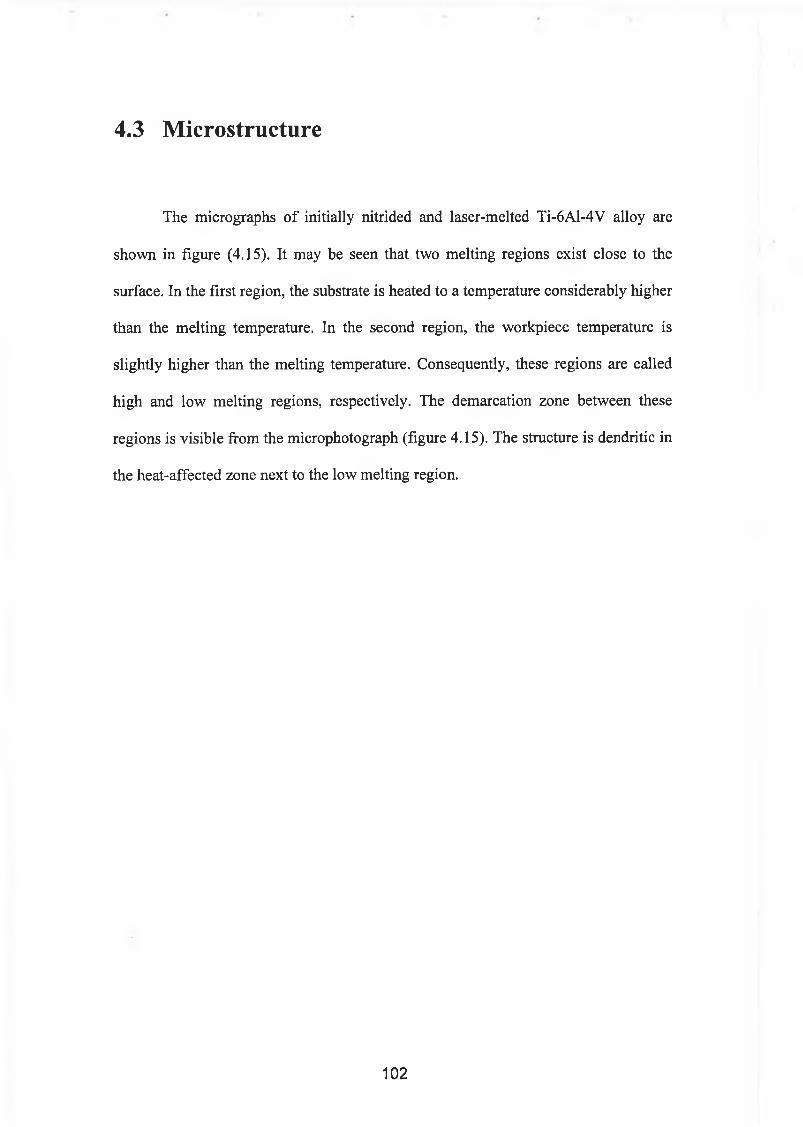
4 . 3 M i c r o s t r u c t u r e
The micrographs of initially nitrided and laser-melted Ti-6A1-4V alloy are
shown in figure (4.15). It may be seen that two melting regions exist close to the
surface. In the first region, the substrate is heated to a temperature considerably higher
than the melting temperature. In the second region, the workpiece temperature is
slightly higher than the melting temperature. Consequently, these regions are called
high and low melting regions, respectively. The demarcation zone between these
regions is visible from the microphotograph (figure 4.15). The structure is dendritic in
the heat-affected zone next to the low melting region.
102
Meltingregion
Region A
M ----------
Surface
Region B
Figure-4.15 SEM micrograph of initially plasma nitrided and later laser melted ofworkpieces. Laser power intensity =1.2 kW; Traverse speed = 0.6 m/min
103
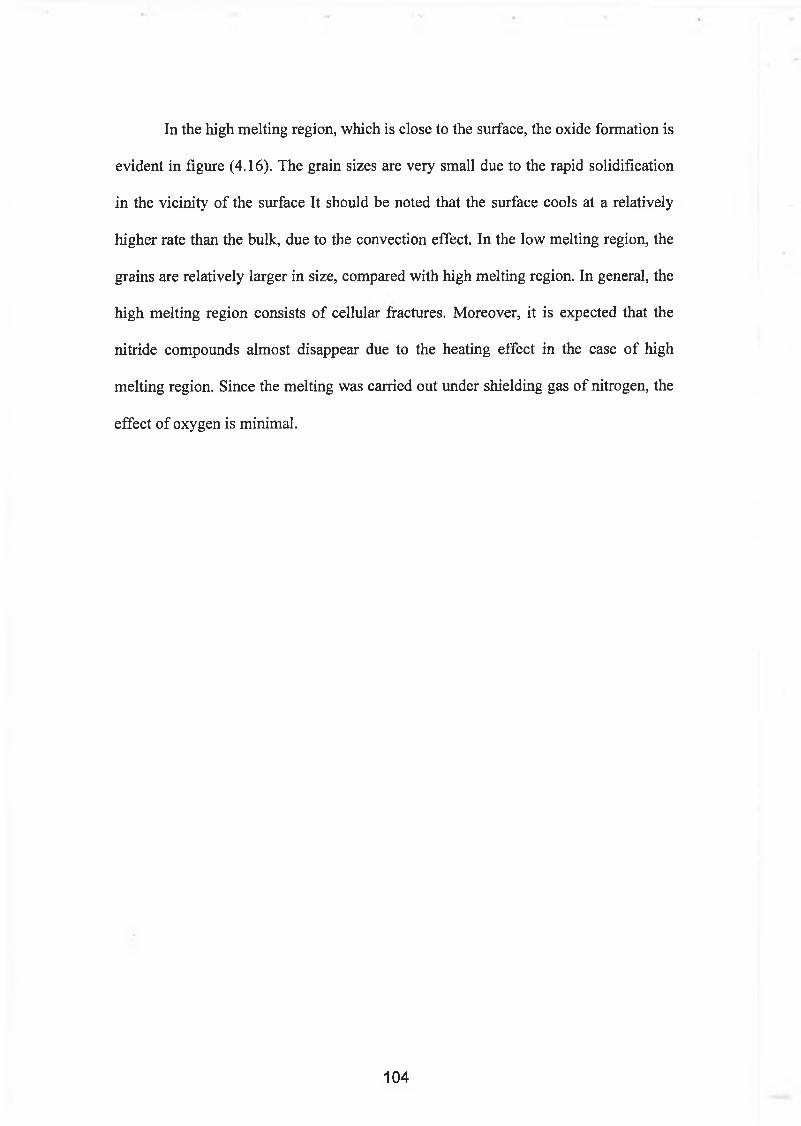
In the high melting region, which is close to the surface, the oxide formation is
evident in figure (4.16). The grain sizes are very small due to the rapid solidification
in the vicinity of the surface It should be noted that the surface cools at a relatively
higher rate than the bulk, due to the convection effect. In the low melting region, the
grains are relatively larger in size, compared with high melting region. In general, the
high melting region consists of cellular fractures. Moreover, it is expected that the
nitride compounds almost disappear due to the heating effect in the case of high
melting region. Since the melting was carried out under shielding gas of nitrogen, the
effect of oxygen is minimal.
104
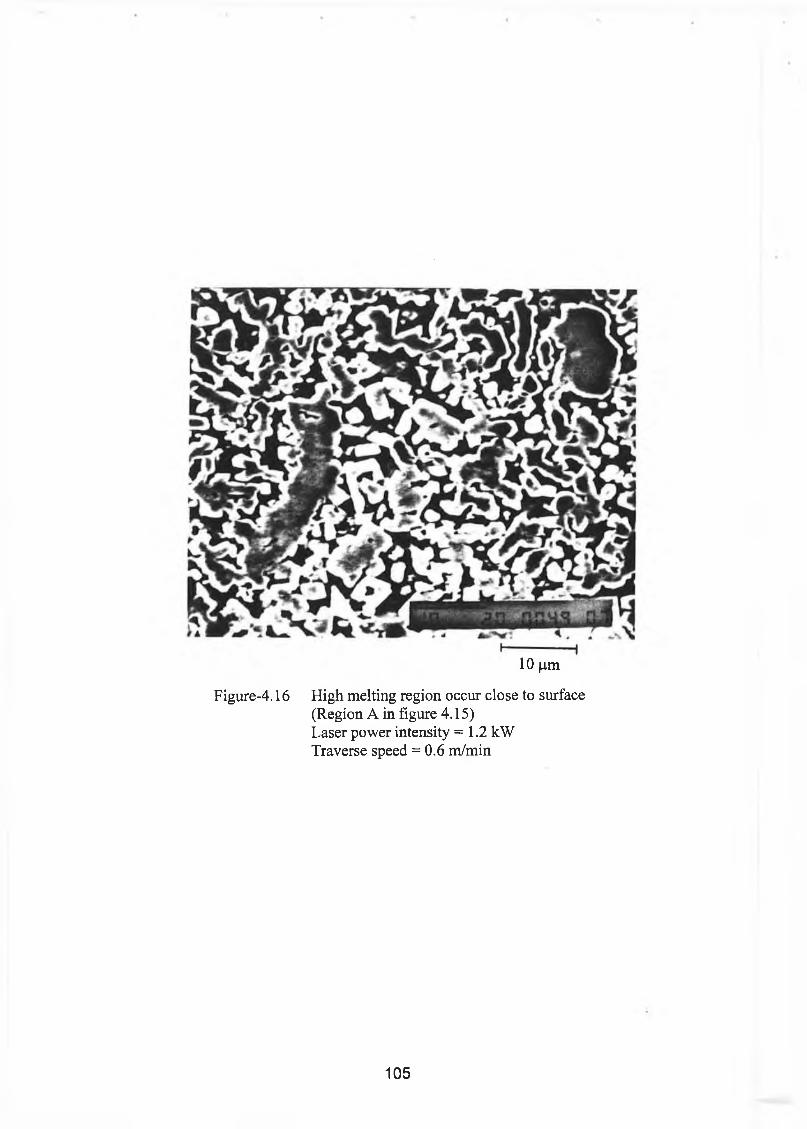
10 jam
Figure-4.16 High melting region occur close to surface(Region A in figure 4.15)Laser power intensity =1.2 kW Traverse speed = 0.6 m/min
105
The micro-cracks and some micro-holes, do however occur in the high melting
region (figure 4.17). This may be to due to the attainment of a high cooling rate
during the solidification, which in turn results in considerable stress development in
this region. In addition, rapid solidification, because of the high cooling rate, results in
the formation of an acicular a-phase, which is finer than the platelike a-phase. A
prior p-phase grain boundary may be observed. In the case of low melting region, the
cooling rate is lower than that corresponding to the high melting region.
106
1 |im
Figure-4.17 Micro-cracks and micro-holes occur in high melting region (Region B in figure 4.15). Laser power intensity = 1.2 kW Traverse speed = 0.6 m/min
107

The structure, therefore, consists of transformed P-phase containing acicular
a-phase (a-phase at prior P-phase grain boundaries), as observed in figure (4.18).
108
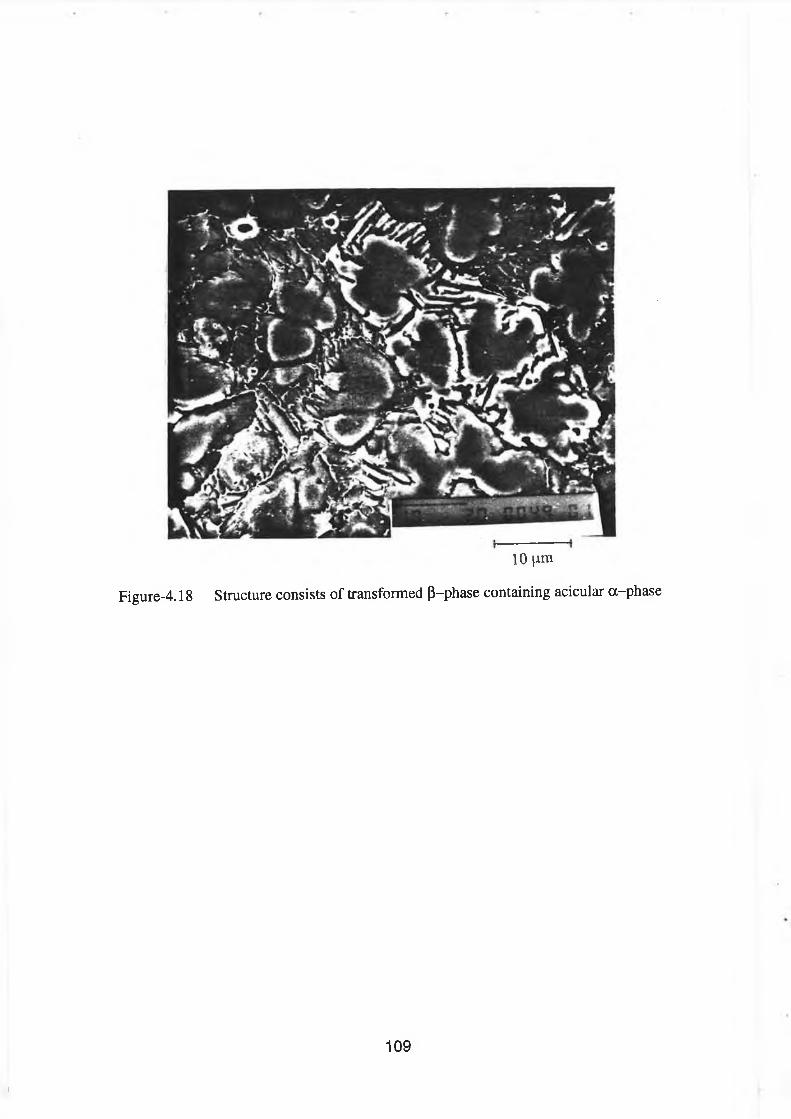
10 Jim
Figure-4.18 Structure consists of transformed 0-phase containing acicular a-phase
1
109
In the vicinity of the heat-affected zone, the structure containing transformed
P-phase comprised of coarse phase and a fíne acicular a-phase could be seen in
figure (4.19). In the heat-affected zone, however, primarily the a ‘ martensite is
formed. Moreover, a+P microstructure can be seen next to heat-affected zone, i.e., the
unaffected region consists of a+p microstructure. In general, laser treated surfaces
consists of cellular and dendritic structures, i.e. at high cooling rates cellular
structures are evident and being obscured by a - martensite.
110
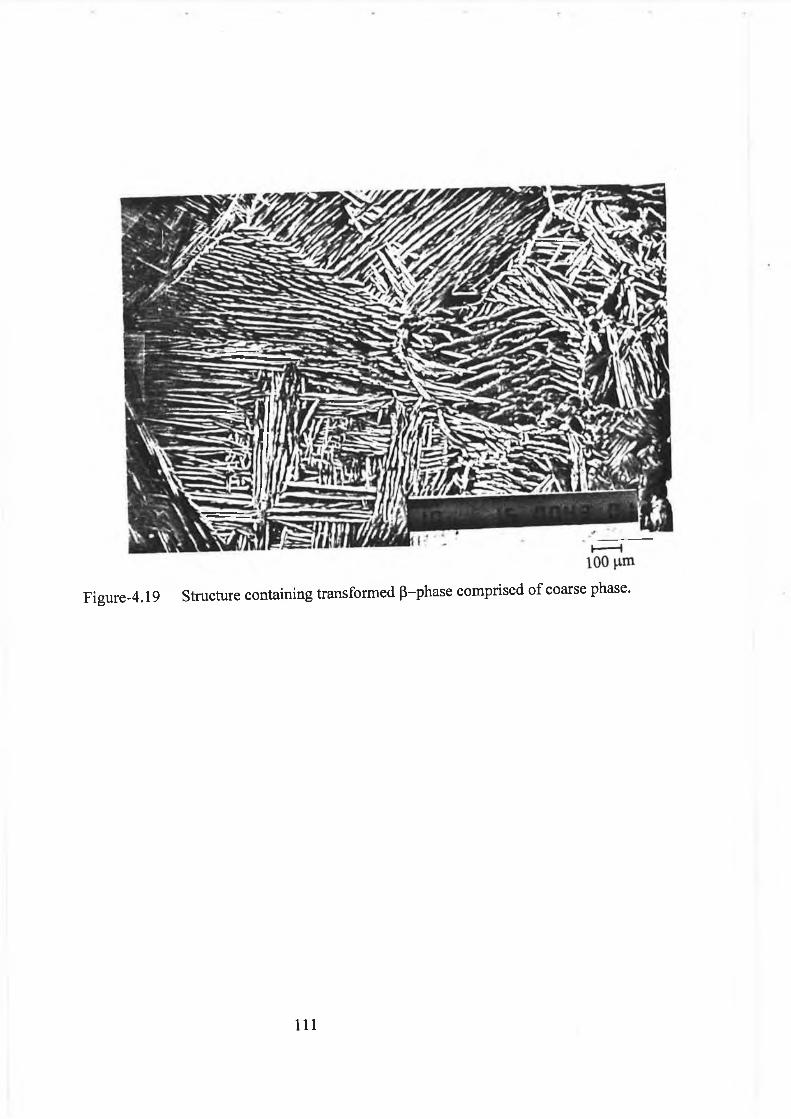
Figure-4.19 Structure containing transformed (3-phase comprised of coarse phase.
I l l
4.4 W ear Tests
A visual inspection of the test samples showed that, for short nitriding times,
the surface turns a bright yellow color. When the process time is increased, the
surface changes to a bright golden color. When the temperature and nitriding time is
increased, the sample surface turned to a darker color.
The friction coefficient test results are shown in figure (4.20). The results were
obtained from the ball-on-disk wear experiment described in section 2.7. The effect of
plasma nitriding can be clearly seen. For the untreated samples, severe scuffing-like
wear was observed to occur on the surface after only a few wear cycles, whereas the
nitrided samples displayed smooth wear characteristics for prolonged periods. It is
also evident that the friction coefficient, after being relatively constant for a period at
the start of the test, increases abruptly before breakthrough occurrs. The plasma
nitrided surfaces give the lowest friction coeffeicent, followed by nitrided/laser-
melted and untreated surfaces. Some scuffing-like wear occurred for the untreated
workpieces after only few wear cycles.
112
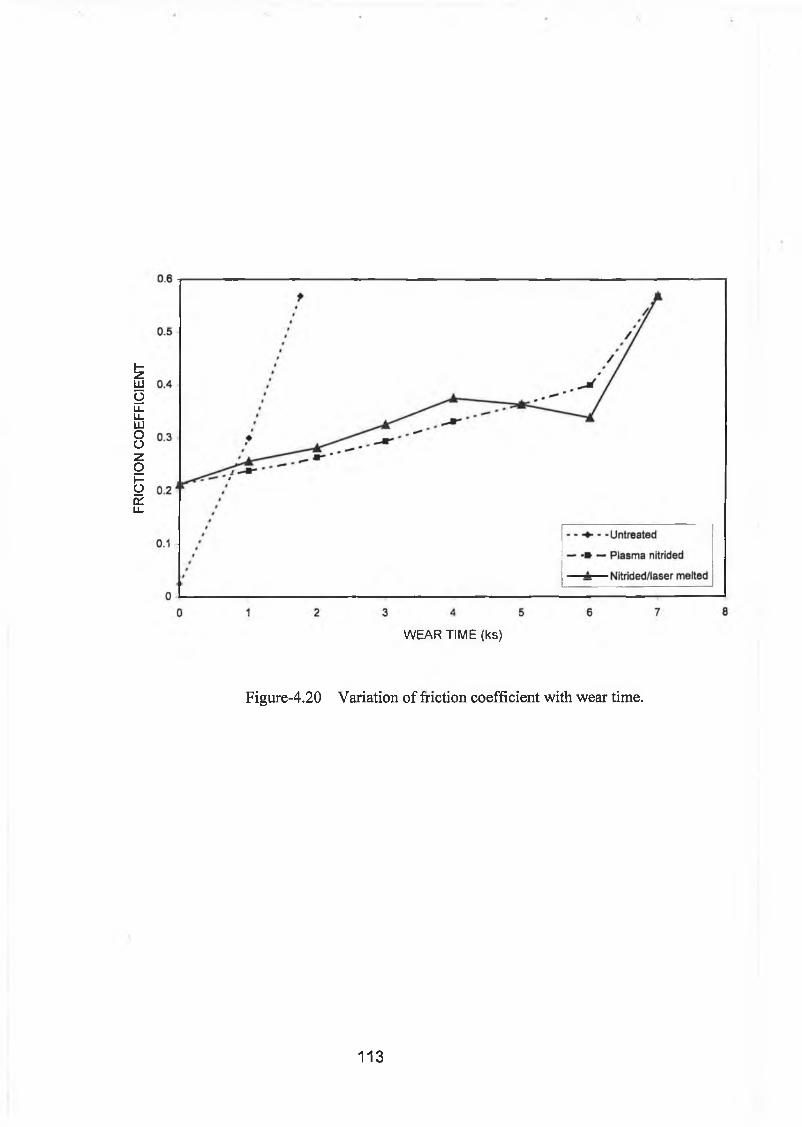
FRIC
TIO
N
CO
EF
FIC
IEN
T
WEAR TIME (ks)
Figure-4.20 Variation of friction coefficient with wear time.
113
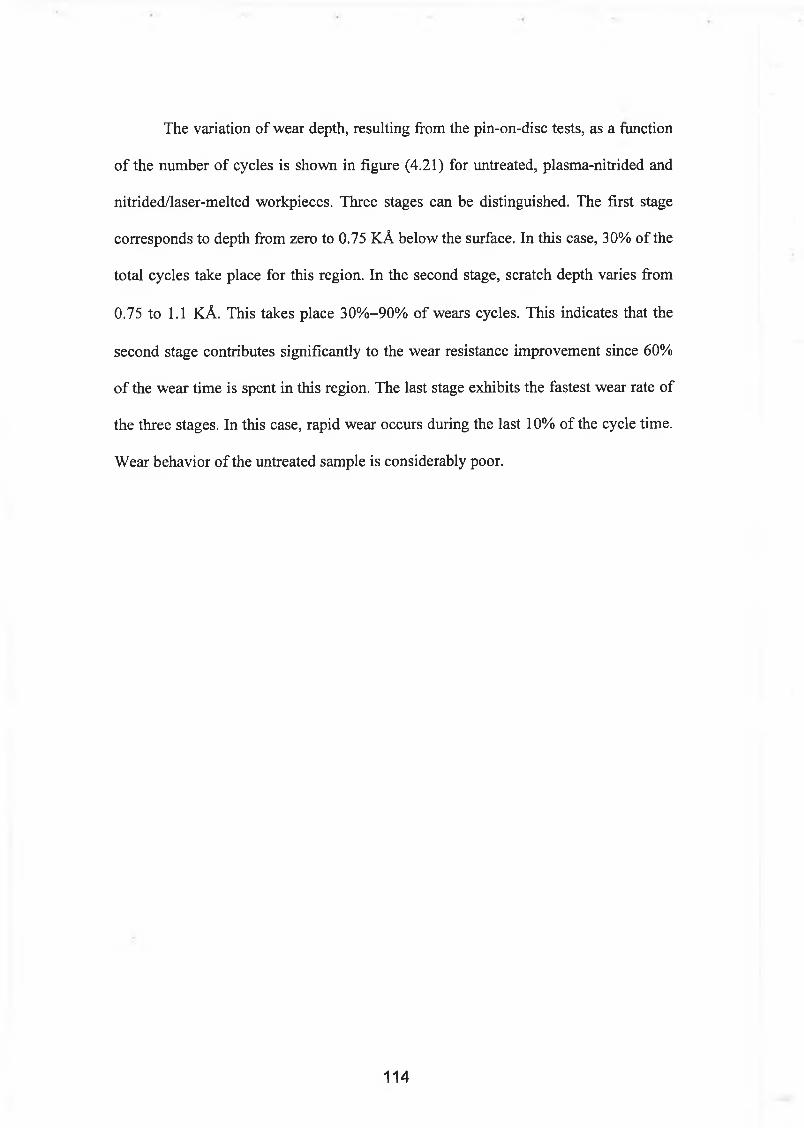
The variation of wear depth, resulting from the pin-on-disc tests, as a function
of the number of cycles is shown in figure (4.21) for untreated, plasma-nitrided and
nitrided/laser-melted workpieces. Three stages can be distinguished. The first stage
corresponds to depth from zero to 0.75 KA below the surface. In this case, 30% of the
total cycles take place for this region. In the second stage, scratch depth varies from
0.75 to 1.1 KA. This takes place 30%-90% of wears cycles. This indicates that the
second stage contributes significantly to the wear resistance improvement since 60%
of the wear time is spent in this region. The last stage exhibits the fastest wear rate of
the three stages. In this case, rapid wear occurs during the last 10% of the cycle time.
Wear behavior of the untreated sample is considerably poor.
114
WEAR
SC
AR
DEPT
H (n
m)
WEAR TIME (ks)
Figure-4.21 Variation of wear scar depth with wear time.
115
Figure (4.22) shows the variation of the cross sectional area of wear scars with
number of cycles. It is evident that high temperature nitriding gives a better wear
resistance than that corresponding to low temperature nitriding and untreated samples.
This may be due to the elevated sample temperature, which increases the diffusion
rate during nitriding process. High temperature nitriding results improved wear
resistance. This may be related to nitrogen concentration in the surface region. The
wear resistance of titanium nitride is much better than that of untreated sample and,
therefore, it is reasonable to expect that the peak in the nitrogen concentration profile
and minimum wear rate should coincide at the same depth. This difference may be
explained in terms of the geometrical configuration of pin-on-disc wear tester. In this
case, when the apex of the pin is at a given depth, the large area of the contact surface
is at small depths. When the majority of the wear, therefore, takes place at depths
around the nitrogen peak, the apex of the pin must pass the nitrogen peak and the
minimum wear rate exceeds the depth of the nitrogen concentration peak.
116
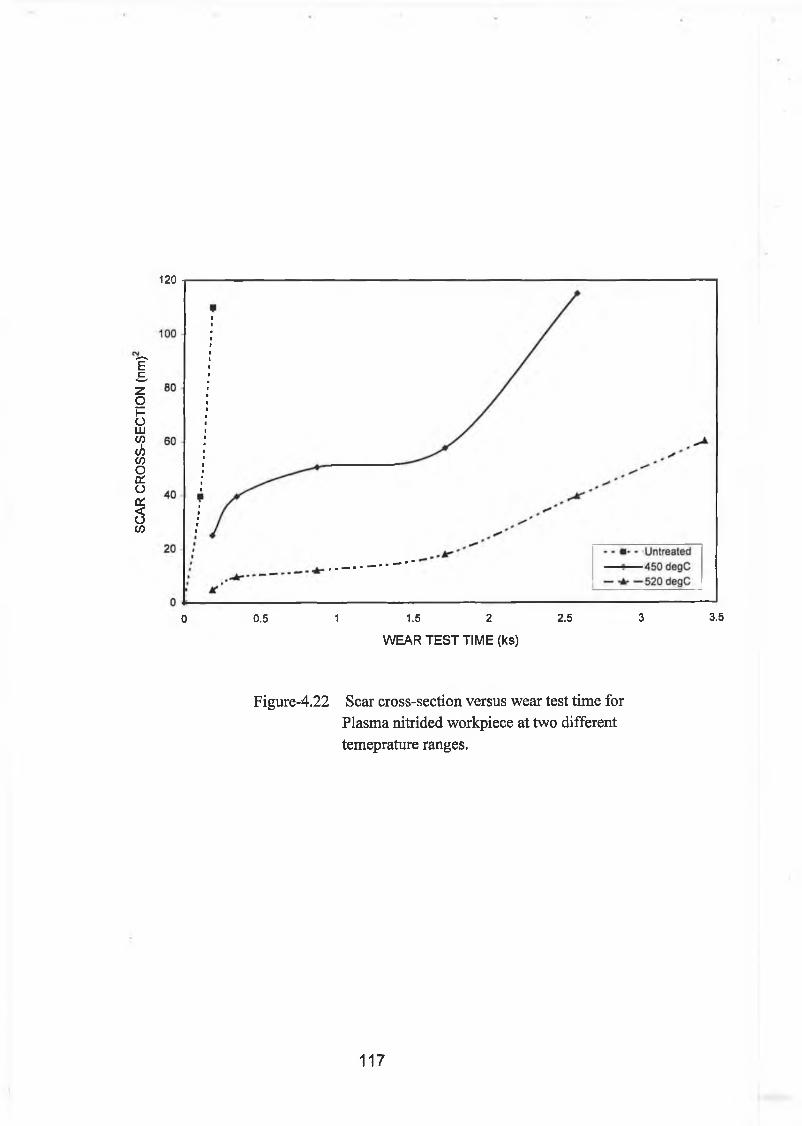
SCAR
CR
OSS-
SECT
ION
(nm)
120
0 0.5 1 1.5 2 2.5 3 3.5
WEAR TEST TIME (ks)
Figure-4.22 Scar cross-section versus wear test time for Plasma nitrided workpiece at two different temeprature ranges.
117
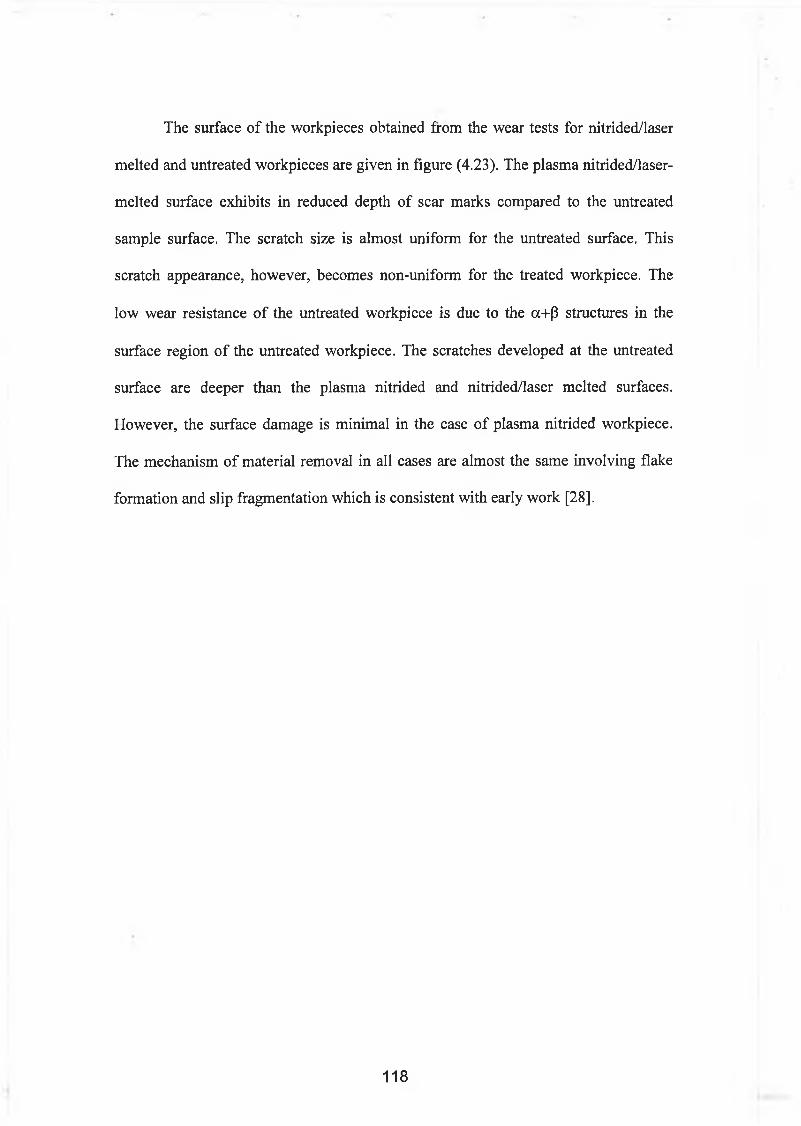
The surface of the workpieces obtained from the wear tests for nitrided/laser
melted and untreated workpieces are given in figure (4.23). The plasma nitrided/laser-
melted surface exhibits in reduced depth of scar marks compared to the untreated
sample surface. The scratch size is almost uniform for the untreated surface. This
scratch appearance, however, becomes non-uniform for the treated workpiece. The
low wear resistance of the untreated workpiece is due to the oc+p structures in the
surface region of the untreated workpiece. The scratches developed at the untreated
surface are deeper than the plasma nitrided and nitrided/laser melted surfaces.
However, the surface damage is minimal in the case of plasma nitrided workpiece.
The mechanism of material removal in all cases are almost the same involving flake
formation and slip fragmentation which is consistent with early work [28],
118
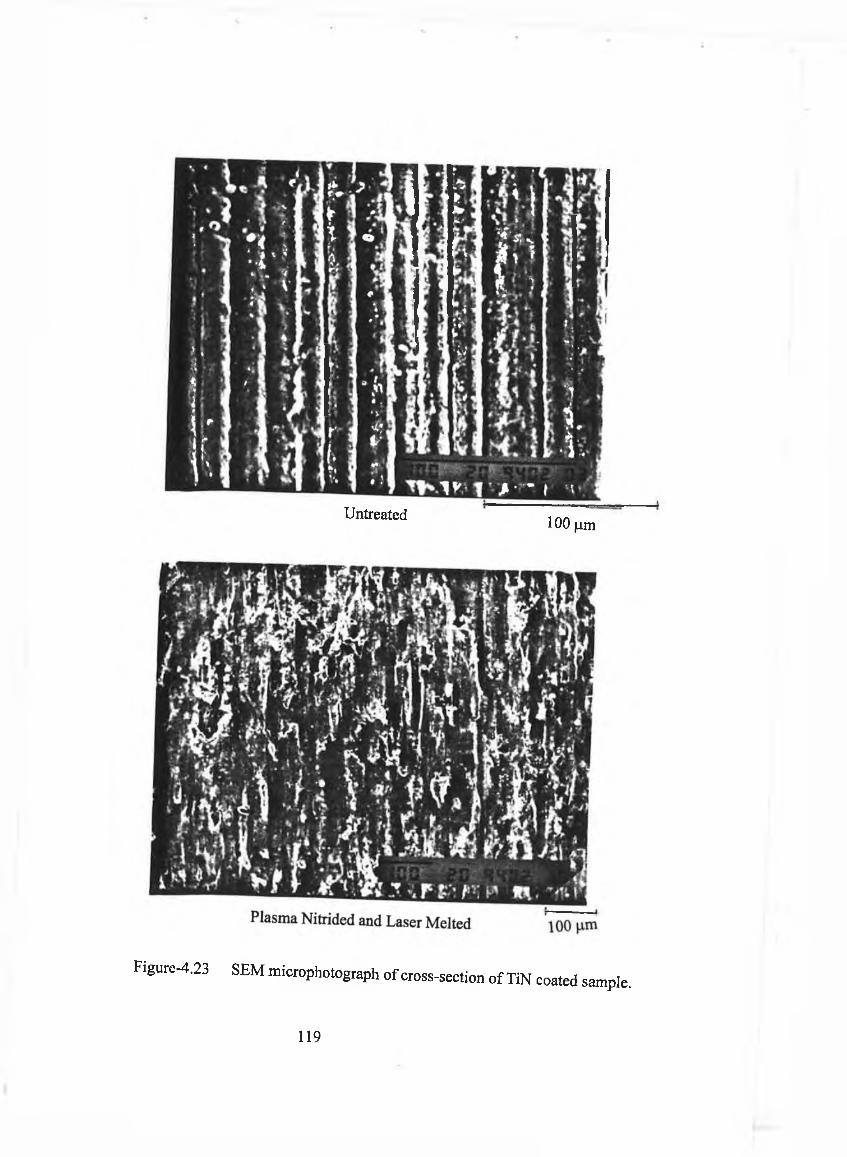
Untreated 100 |um
Figure-4.23 SEM microphotograph of cross-section of TiN coated sample.
119
4 . 5 M i c r o - h a r d n e s s M e a s u r e m e n t
The micro-hardness test results are shown in figure (4.24). The micro-hardness
results include plasma-nitrided and plasma nitrided/laser-melted workpieces. Micro
hardness decreases with increasing distance from the surface. It should be noted that
when nitrogen forms a solid solution as a consequence of nitriding in the alloy, it
results in hardening dislocation pinning effects. Consequently, this dislocation
pinning effect increases with increasing temperature. In addition, an increase in
temperature increases the nitrogen diffusion process [36].
As the distance from the surface increases (outermost region), the original
microstructure is dendritic, in which case the hardness increases slightly from the base
material. In the case of nitride/laser-melted workpieces, the hardness obtained across
the cross-section is slightly lower than that corresponding to the plasma-nitrided
workpieces. This indicates that the deficiencies in nitride species is expected to give
low hardness, but formation of a finer martensitic structures, due to laser-melting
overcomes this and increases the hardness. In the region close to the workpiece
surface the micro-hardness increases to a maximum, in which case, the laser-heated
surface produces a structure comprising of smaller prior P grains and the transferred P
changes from a ’ to the basket wave structure. In addition, the amount of a
precipitation on the prior p phase grains boundaries is increased. In the low melting
region, the micro-hardness reduces slightly. This is due to the fact that the structure
consists of large prior P grains, which have transformed to martesite, together with a
small amount of grain boundary a.
120
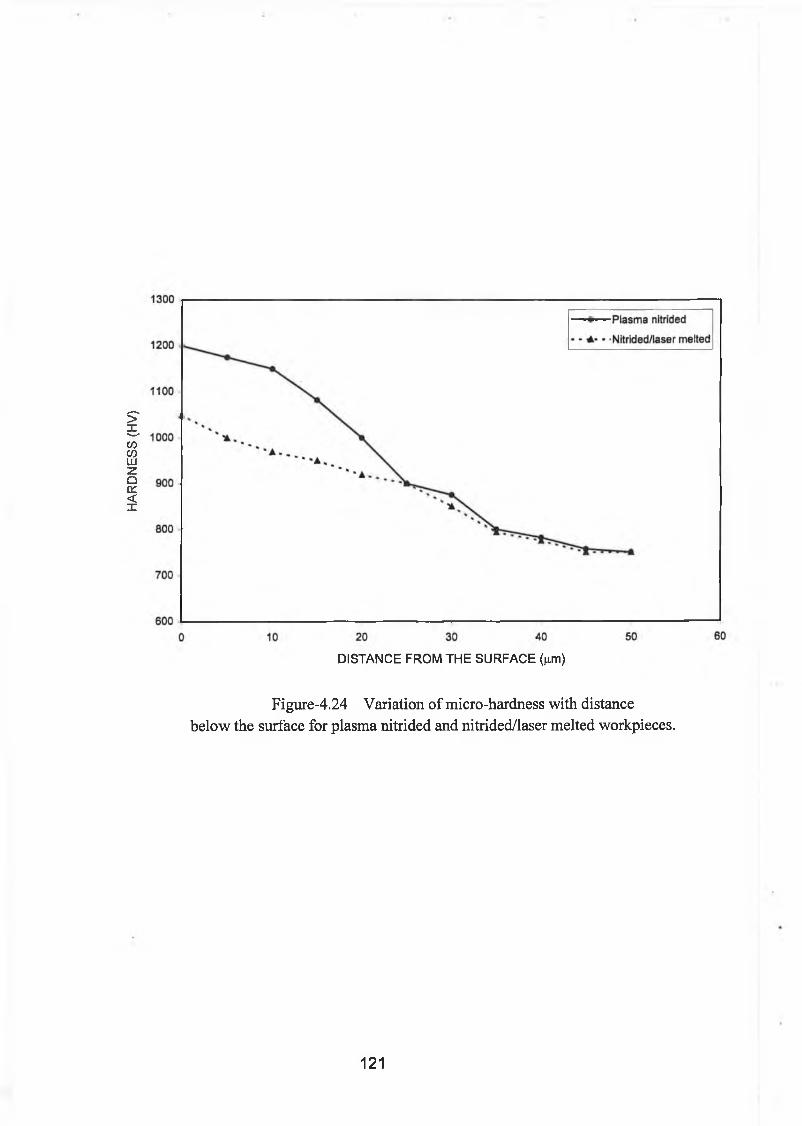
HAR
DNES
S (H
V)
DISTANCE FROM THE SURFACE fom)
Figure-4.24 Variation of micro-hardness with distance below the surface for plasma nitrided and nitrided/laser melted workpieces.
121
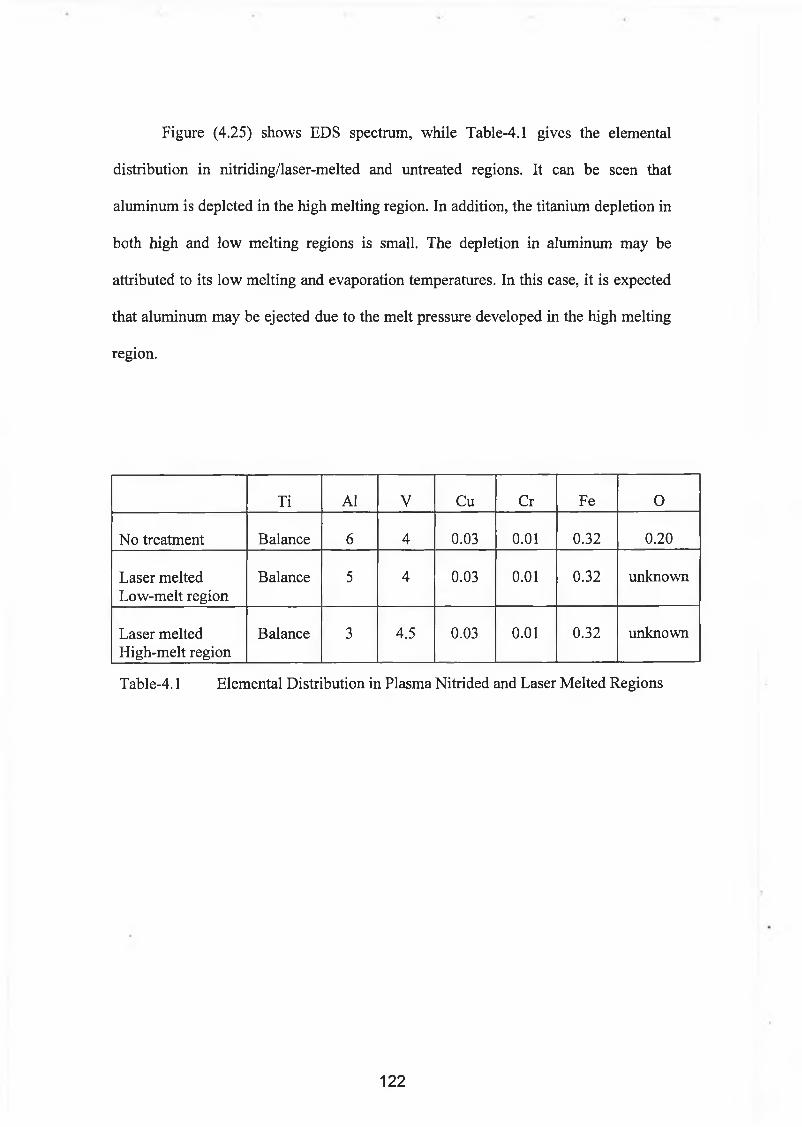
Figure (4.25) shows EDS spectrum, while Table-4.1 gives the elemental
distribution in nitriding/laser-melted and untreated regions. It can be seen that
aluminum is depleted in the high melting region. In addition, the titanium depletion in
both high and low melting regions is small. The depletion in aluminum may be
attributed to its low melting and evaporation temperatures. In this case, it is expected
that aluminum may be ejected due to the melt pressure developed in the high melting
region.
Ti Al V Cu Cr Fe O
No treatment Balance 6 4 0.03 0.01 0.32 0.20
Laser melted Low-melt region
Balance 5 4 0.03 0.01 0.32 unknown
Laser melted High-melt region
Balance 3 4.5 0.03 0.01 0.32 unknown
Table-4.1 Elemental Distribution in Plasma Nitrided and Laser Melted Regions
122
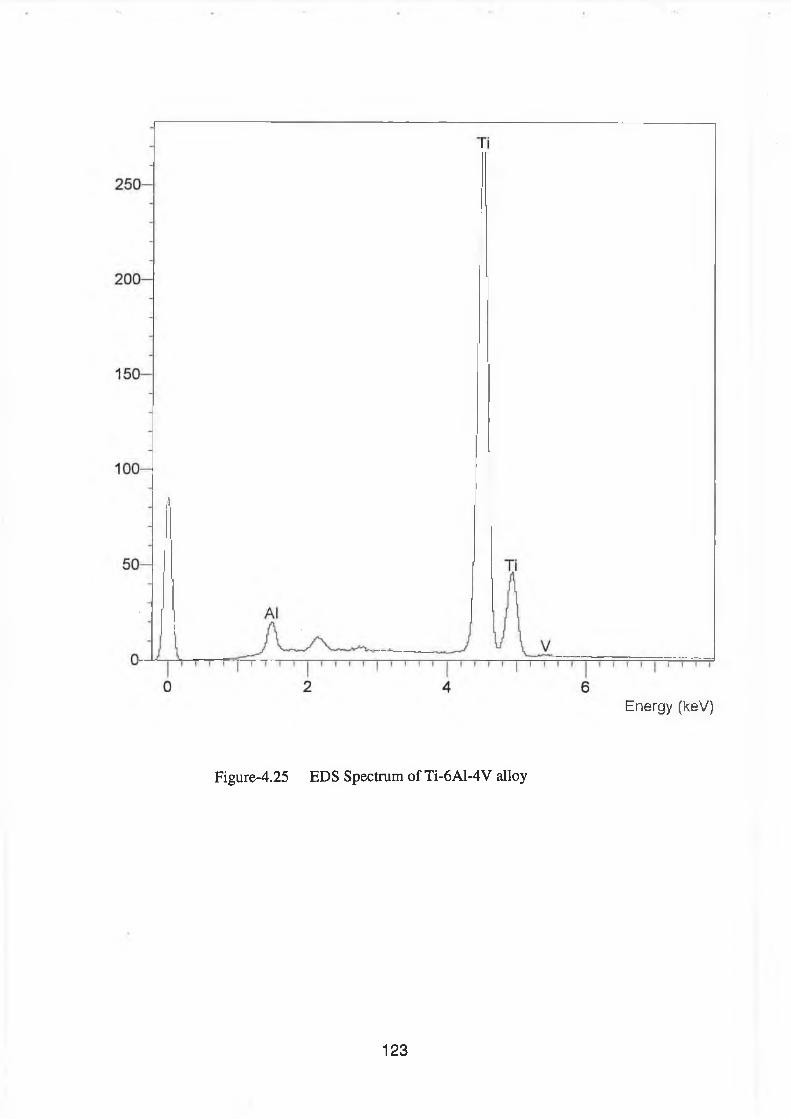
E n e r g y (keV )
Figure-4.25 EDS Spectrum of Ti-6A1-4V alloy
123
The XRD results as shown in figure (4.26) show that the structure of the
nitrided samples exhibited diffraction lines belonging to 5-TiN and e-Ti2N phases.
The weight fractions of these phases vary within the nitrided layer and indicate that
the concentration of the 8-phase decreases with increasing depth while the a-Ti
concentration increases.
124
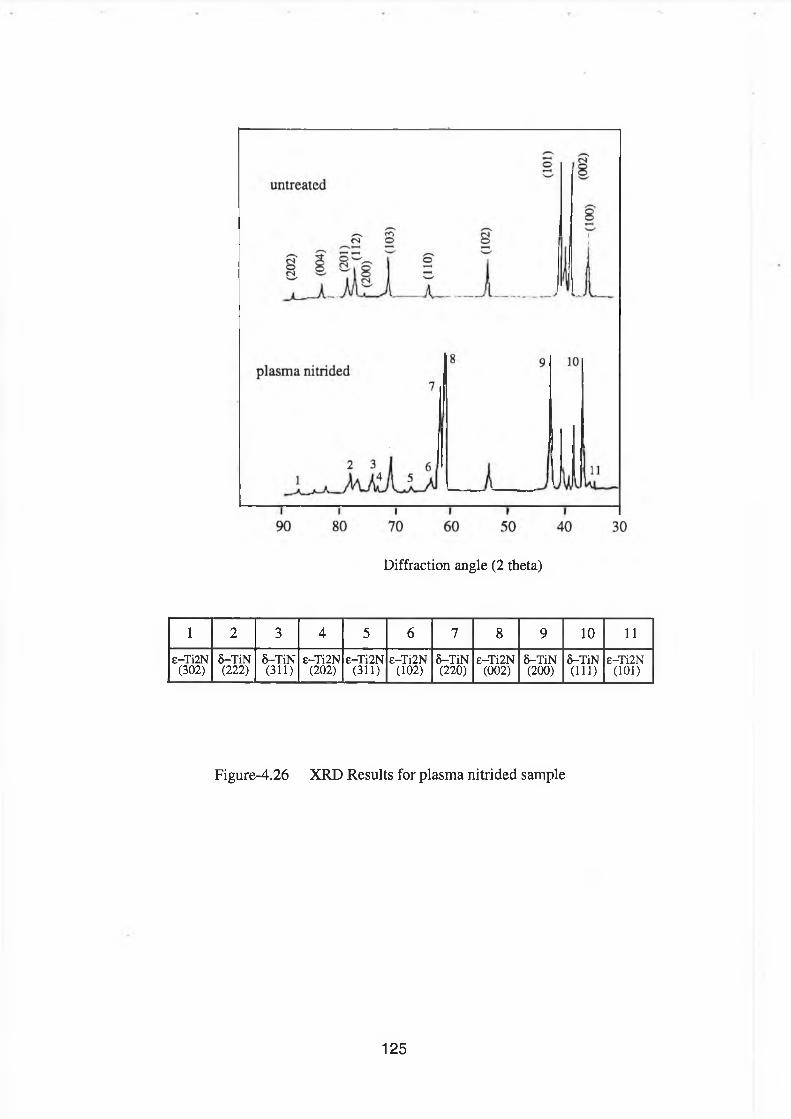
Diffraction angle (2 thêta)
1 2 3 4 5 6 7 8 9 10 11e-Ti2N
(302)5-TiN(222)
5-T iN(311)
e-Ti2N(202)
E-TÌ2N(311)
E-TÌ2N(102)
5-T iN(220)
E—Ti2N (002)
5-TiN(200)
5-TiN(111)
E-TÌ2N(101)
Figure-4.26 XRD Results for plasma nitrided sample
125
4 . 6 P V D C o a t i n g S a m p l e s
The SEM photograph of cross-sections of a TiN coated sample is shown in
figure (4.27). For the TiN coated samples a homogeneously distributed coat is
obtained and the coat thickness extends to 2 jim.
126
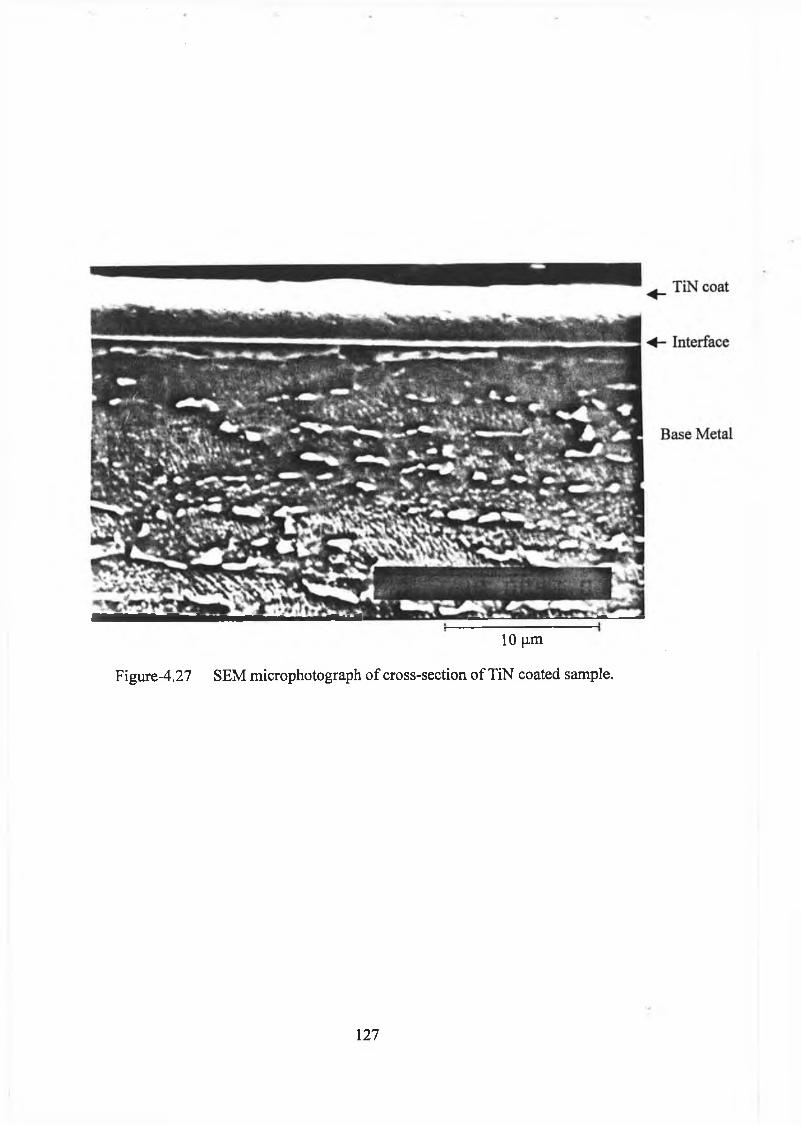
10 (im
Figure-4.27 SEM microphotograph of cross-section of TiN coated sample.
127
Figure (4.28) shows the wear test results obtained under different loading
conditions. The wear plots show that wear occurs more slowly in coated samples
compared to uncoated workpieces. For coated workpieces, an abrupt change in wear
depth occurs during the sliding tests. The wear depth, however, increases
continuously for uncoated workpieces. This may suggest a transition between two
distinct stages of wear in coated workpieces. Moreover, during the initial stage, the
measured wear depth shows relatively small increase with increasing sliding time.
However, as the sliding time increases, the initial wear stage changes to a second
stage in which case the wear scar size increases rapidly. The wear scar size is shown
in figure (4.29) for two normal loads. The wear scar size increases as the sliding time
increases, however, the rate of increase in scar size accelerates after a certain sliding
time. In this case, two distinct wear behavior patterns are possible as discussed for
figure (4.28).
128
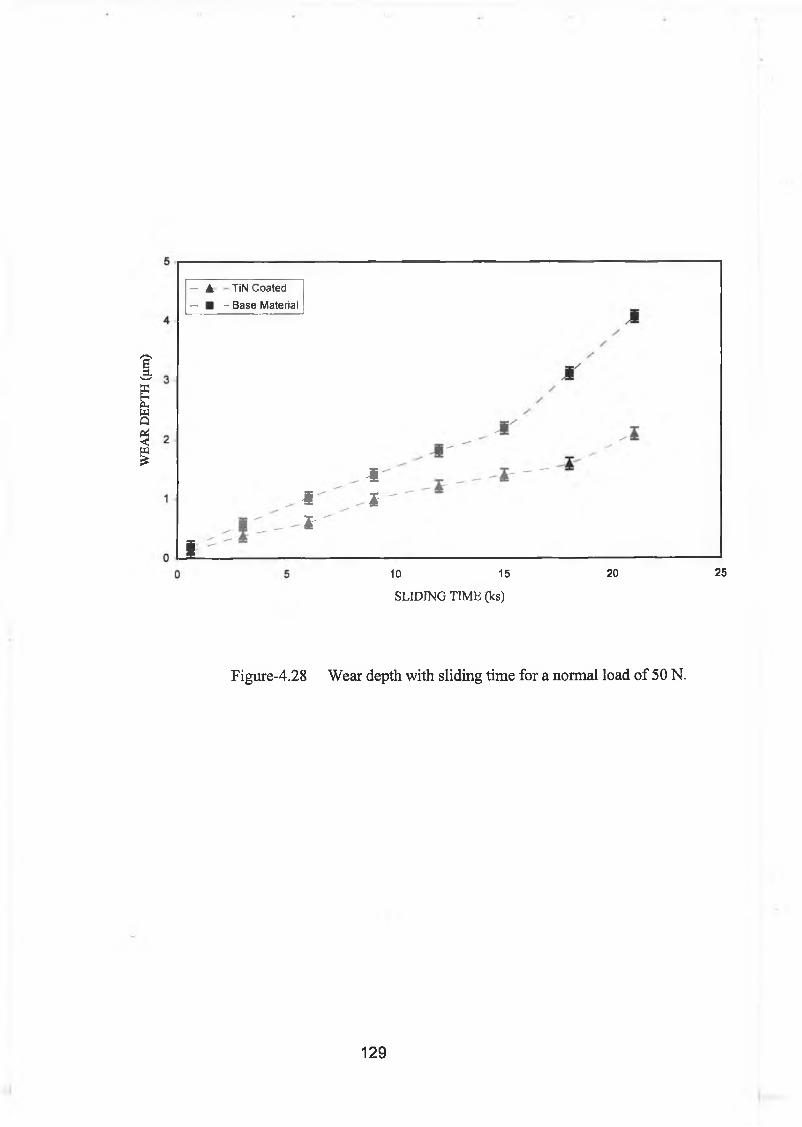
WEA
R DE
PTH
(nm
)
— A TiN Coated— ■ - Base Material
i
I
£
i
I
10 15
SLIDING TIM E (ks)
20 25
Figure-4.28 Wear depth with sliding time for a normal load of 50 N.
129
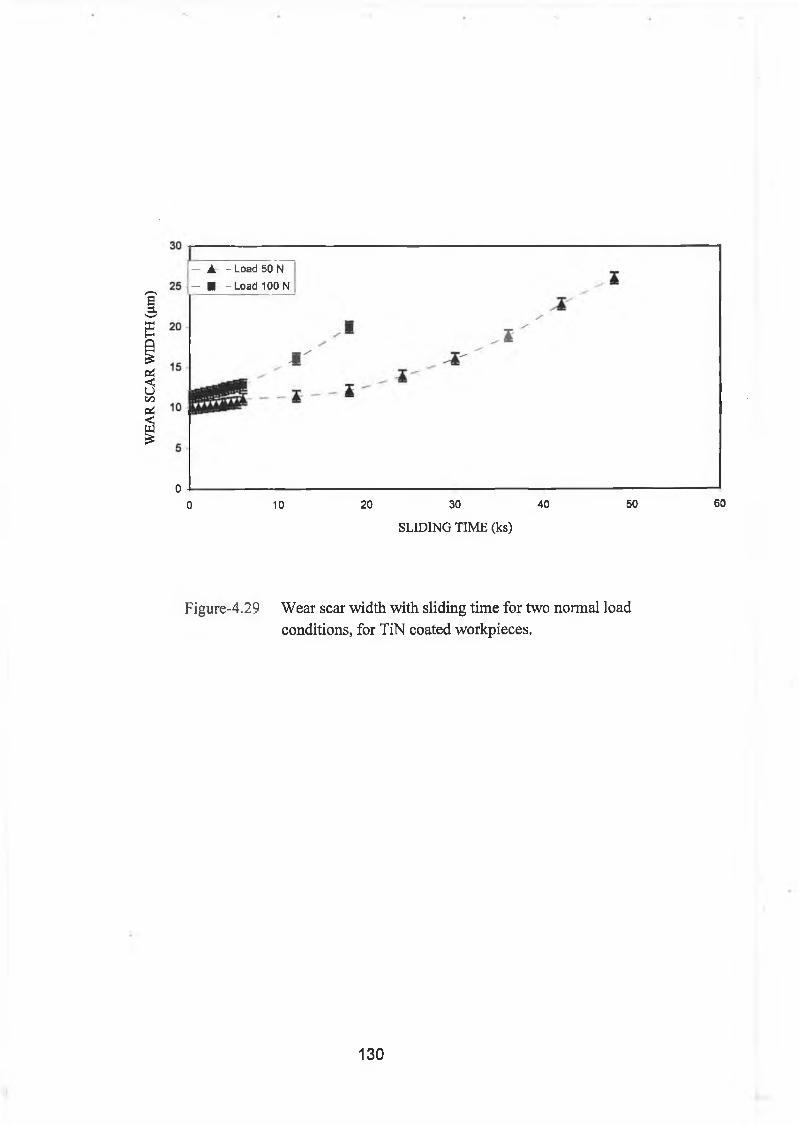
WEA
R SC
AR
WID
TH
(|im
)
00 10 20 30 40 50 60
SLIDING TIM E (ks)
Figure-4.29 Wear scar width with sliding time for two normal load conditions, for TiN coated workpieces.
- A - Load 50 N — ■ - Load 100 N
130
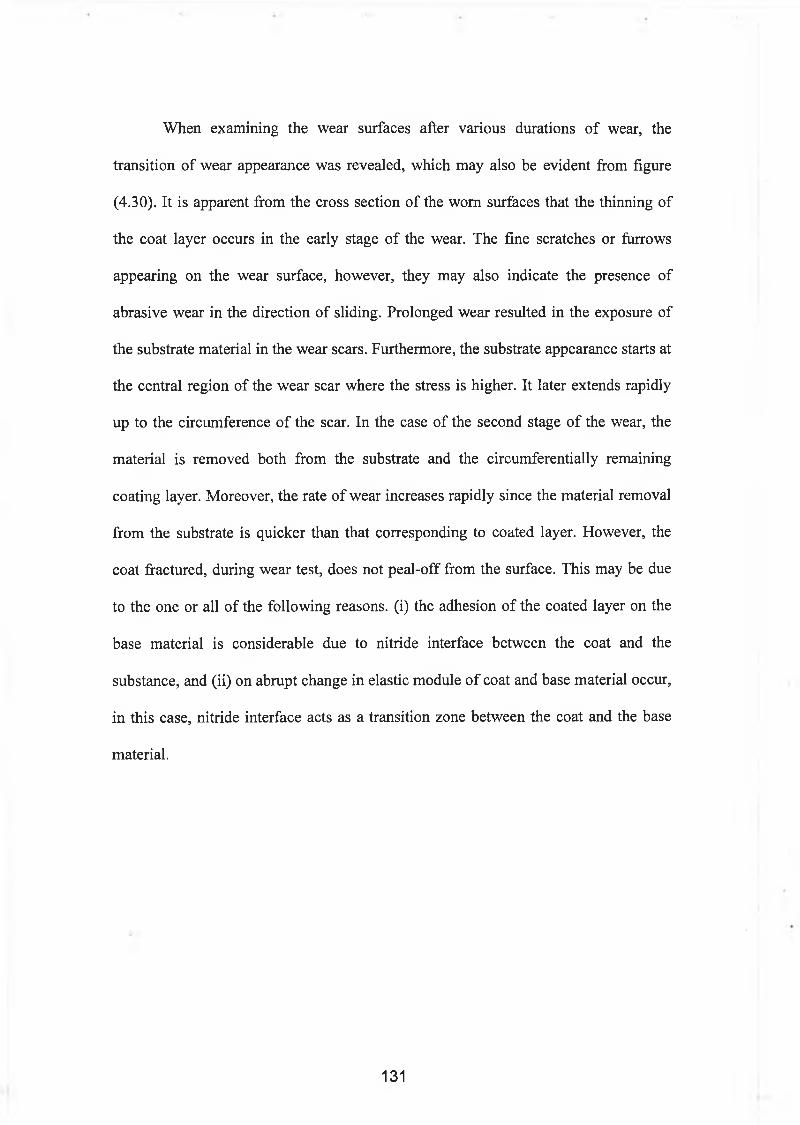
When examining the wear surfaces after various durations of wear, the
transition of wear appearance was revealed, which may also be evident from figure
(4.30). It is apparent from the cross section of the worn surfaces that the thinning of
the coat layer occurs in the early stage of the wear. The fine scratches or furrows
appearing on the wear surface, however, they may also indicate the presence of
abrasive wear in the direction of sliding. Prolonged wear resulted in the exposure of
the substrate material in the wear scars. Furthermore, the substrate appearance starts at
the central region of the wear scar where the stress is higher. It later extends rapidly
up to the circumference of the scar. In the case of the second stage of the wear, the
material is removed both from the substrate and the circumferentially remaining
coating layer. Moreover, the rate of wear increases rapidly since the material removal
from the substrate is quicker than that corresponding to coated layer. However, the
coat fractured, during wear test, does not peal-off from the surface. This may be due
to the one or all of the following reasons, (i) the adhesion of the coated layer on the
base material is considerable due to nitride interface between the coat and the
substance, and (ii) on abrupt change in elastic module of coat and base material occur,
in this case, nitride interface acts as a transition zone between the coat and the base
material.
131
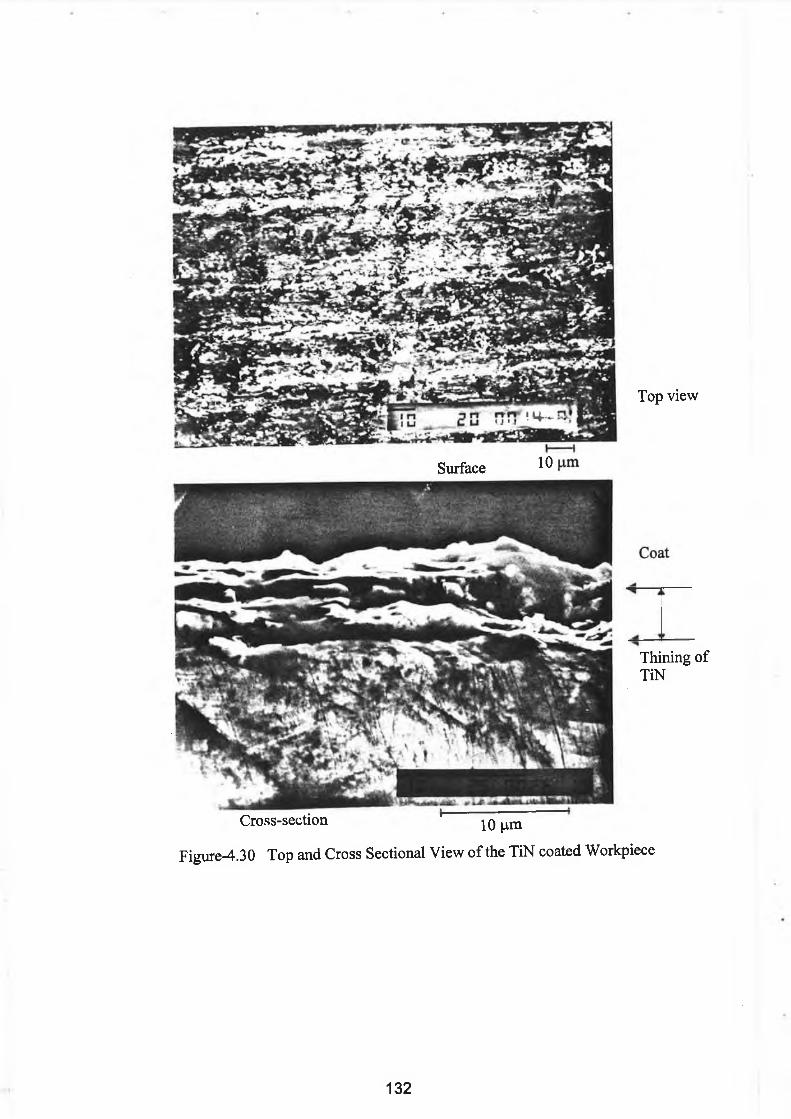
Top view
Surface ^
Thining of TiN
Cross-section ' lO^un
Figure-4.30 Top and Cross Sectional View of the TiN coated Workpiece
132
Figure (4.31) shows a typical change of friction coefficient with sliding time.
The friction coefficient remains almost constant for sometimes, however, an increase
in the friction coefficient occurs as the scars developed at the surface. It may be seen
from the friction coefficient curve that in the initial stage of the friction test the
friction coefficient appears to be the same for all workpiece surfaces. However, as the
test duration increases only the untreated surface show an increase in the friction
coefficient.
133
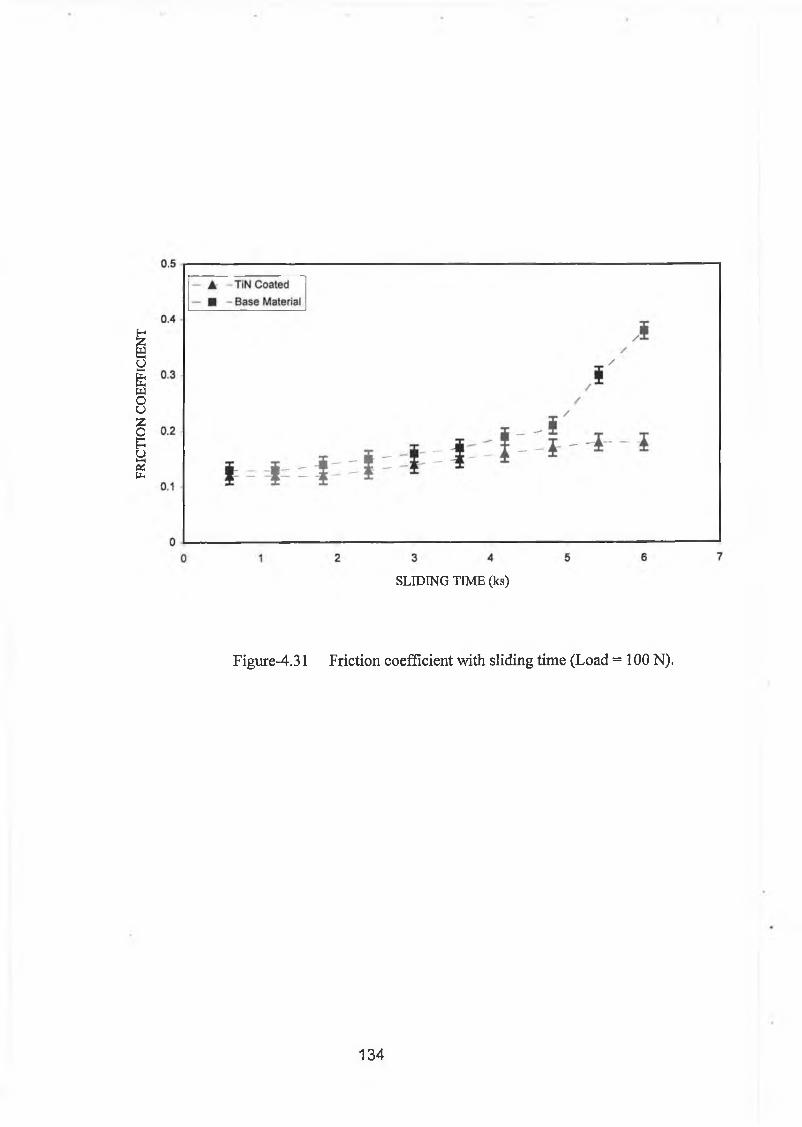
FRIC
TION
C
OE
FFIC
IEN
T
SLIDING TIME (ks)
Figure-4.31 Friction coefficient with sliding time (Load = 100 N).
134
C H A P T E R - 5
C o n c l u s i o n s a n d F u t u r e w o r k
5 . 1 C o n c l u s i o n s
The conclusions derived from the present study are given as follows: -
1. Theoretical predictions pointed out that when the melting temperature is
reached, the liquid temperature in the high melting region rises. The region in
which the melting occurs at the saturation liquid temperature, however, is
called the low melting region. Moreover, the equilibrium point may be
attained during the heating cycle. In this case, convective and conduction
losses balance the energy gain by the substance via laser radiation.
2. The laser power intensity has considerable influence on the resulting
temperature profile, i.e., temperature attains high values at high power
intensities.
135
3. The heat transfer coefficient on the resulting temperature profiles has
negligible effect. In this case, convective losses are minimal compared with
internal energy gain of the substrate.
4. The nitrided samples exhibit diffraction lines of 5-TiN and £-Ti2N phases. As
the depth increases, the concentrations of the s-Ti2N increases while the
concentration of the 5-phase decreases.
5. The results of plasma nitriding demonstrate that three distinct layers develop
in the nitrided zones in the vicinity of the surface, namely: inner, intermediate
and outer layers. The thickness of these layers extends to 10 (i.m for the
compound layer, 15 (am for the intermediate layer and 40 (j.m for the outer
layer. These include compound layer (s-Ti2N + 5-TiN phases occurring in the
inner layer) and a-(TiN) phases with or without s-Ti2N phases occurring in
the intermediate layer. In the outer layer, the nitride precipitates are dominant
and distributed evenly at a location close to the intermediate layer. Precipitates
occur at the lower end of this layer. After laser heating process, however, the
nitride species almost disappear, which are especially true for high melting
regions. The oxide compound is not seen since the laser melting process was
carried out at shielding ambient.
6. In general due to the high cooling rate, plasma nitrided/laser-melted
workpieces consist of cellular and dentritic structures. The cellular structures
are evident and are being obscured by a' martensite. At relatively low cooling
136
rates, however, the structure consists of transformed p containing acicular a: a
at prior p grain boundaries.
7. Due to the high cooling rate, the rapid solidification produces acicular a. In
the case of low melting regions, however, the structure consists of transformed
P containing acicular a: a at prior P grain boundaries can be observed. The
heat affected zone possesses primarily a' martensite. As it is expected, a+p
micro structure is evident in the unaffected region. Cellular and dentritic
structures occur in the nitriding/laser-melted regions. The dentiritic region of
the nitrided workpiece, however, consists of TiN.
8. The wear resistance depends mainly on the compounds formed at the surface
and their resistance to abrasion. It is clear from the photographic observations
that the scratches developed at the untreated surface are deeper than those
corresponding to the plasma nitriding and nitrided/laser-melted surfaces.
Furthermore, a sharp boundary exists between the high and low melting
regions. The surface damage is minimal, however, in the case of the plasma
nitrided workpiece. Plasma nitrided/laser-melted surfaces give a considerable
increase in the wear properties.
9. The lowest friction coefficient occurs at the surfaces of the plasma nitrided,
followed by plasma nitrided/laser-melted and untreated surfaces.
10. The resulting profiles from the micro-hardness test show that the trends of the
hardness obtained across the cross-section of the nitrided sample are slightly
137
lower than that for the plasma nitrided/laser-melted sample. This indicates that
the deficiency in nitride species is expected to give low hardness, but the
formation of finer martensitic structures, due to laser melting, overcomes this
and increases the hardness.
5 . 2 F u t u r e w o r k
The future work may be listed as follows: -
• The duplex treatment of the workpieces can be considered. In this case, pre
plasma nitriding before TiN PVD coating can be carried out. This may improve
the adhesion of the coat on to the substrate.
• Laser assisted nitriding can be taken into account. An experimental set-up can be
designed and realized in this regard. This may provide cost-effective nitriding of
the workpieces.
• Corrosion properties of the plasma nitrided and PVD coated workpieces can be
investigated.
138
R E F E R E N C E S
[1] E. Lang, Coatings for High Temperature Applications, Applied Science Publishers, 1983.
[2] S. Grainger, Engineering Coatings-Design and Application, Abington Publishing, 1989.
[3] B. L. Mordike, "State of the Art of Surface Engineering with High Energy Beams", Key Engineering Materials, Vol. 46 and 47, pp. 13-26, 1990.
[4] D.T. Quinto, G.J. Wolfe and P.C. Jindal, “High Temperature Micro-hardness of Hard Coatings Produced by Physical and Chemical Vapour Deposition”, Thin Solid Films, Vol. 153, pp. 19-36, 1987.
[5] H.K. Pulker, Wear and Corrosion Resistant by CVD and PVD, Ellis Horwood- Publishers, 1989.
[6] J. Musil, L. Bardos, A. Rajsky, J. Vyskocil, B. Dolezal, G. Loncar, K. Dadourek and V. Kubicek, “TiNx Coatings Prepared by D.C. Reactive Magnetron Sputtering”, Thin Solid Films, Vol. 136, pp. 229-239, 1986.
[7] S. Kanamori, “Investigation of Reactively Sputtered TiN Films for Diffusion Barriers”, Thin Solid Films, Vol. 136, pp. 229-239, 1986.
[8] B. Rauschenbach, “Formation of Compounds by High-Flux Nitrogen Ion Implantation in Titanium”, Journal of Materials Science, Vol. 21, pp. 395-404,1986.
[9] E. Erturk and H.J. Heuvel, “Adhesion and Structure of TiN Arc Coatings”, Thin Solid films, Vol. 153, pp. 135-147,1987.
[10] K. Ichii, K. Fujimura and T. Takase, “Sputtering, Deposition and Diffusion in Ion-Nitriding of an Austenitic Stainless Steel”, Materials Science and Engineering, A 140, pp. 442-447, 1991.
[11] R.A. Swady, H.A. Ja’fer and R.P. Howson, “The Reactive Sputtering of Thin Films of TiN at Low Target Voltages”, Vacuum, Vol. 44, No. 3-4, pp. 297- 301,1993.
[12] X. Huang J. Cuddy, N. Goel and N.L. Richards, “Effect of Heat Treatment on the Microstructure of a Metastable p-Titanium Ally”, Journal of Materials Engineering and Performance, Vol. 3, No. 4, pp. 560-566,1994.
139
[13] N.F. Mott and H. Jones, Theory of the Properties of Metals and Alloys, Dover Publication, London, 1978.
[14] M.Y. Al-Jaroudi, H.G.T. Hentzell and J. Valli, “The Influence of the TiN Deposition Temperature on the Critical Load and Hardness of Hardened Steels”, Thin Solid Films, Vol. 154, pp. 425-429, 1987.
[15] N. El-Tayeb, “The Variation of Hardness and Wear Coefficient in Sliding wear of Copper and Aluminium Alloys”, Wear, Vol. 174, pp. 63-69, 1994.
[16] M. V. Stappen, L.M. Stals, M. Kerkhofs and C. Quaeyhaegens, "State of the Art for the Industrial Use of Ceramic PVD Coatings", Surface and Coatings Technology, Vol. 74-75, pp. 629-633, 1995.
[17] T. Wierzchon, J. Rudnicki, M. Hering and R. Niedbala, “Formation and Properties of Nitrided Layers Produced in Pulsed Plasma at a Frequency Between 100 and 600 kHz”, Vacuum, Vol. 48, No. 6, 1997.
[18] P. Hedenqvist and S. Hogmark, “Experiences from Scratch Testing of Tribological PVD Coatings”, Tribology International, Vol. 30, No. 7, pp. 507- 516, 1997.
[19] O. Knotek, T. Leyendeclcer and F. Jungblut, “On the Properties of Physically Vapour-Deposited Ti-Al-V-N Coatings, Thin Solid Films, Vol. 153, pp. 83- 90, 1987.
[20] W. Mader, H.F. Fischmeister and E. Bergmann, “Defect Structure of Ion- Plated Titanium Nitride Coatings”, Thin Solid Film, Vol. 182, pp. 141-152, 1989.
[21] P. Stevenson and A. Matthews, "PVD Equipment Design: Concepts for Increased Production Throuhput", Surface and Coatings Technology, Vol. 74- 75, pp. 770-780, 1995.
[22] M.M. Tosic, I. Terzic and R. Gligorijevic, “Plasma Nitriding of Powder Metal Steel”, Vacuum, Vol. 40, No. 14, pp. 131-134, 1990.
[23] Y. Sun and T. Bell, “Plasma Surface Engineering of Low Alloy Steel”, Materials Science and Engineering, A140, pp. 419-434, 1991.
[24] M.M. Tosic and R. Gligorijevic, “Plasma nitriding Improvements of Fatigue Properties of Nodular Cast Iron Crankshafts”, Materials Science and Engineering, AMO, pp. 469-473,1991.
[25] M.B. Karamis and R. Ipek, “An Evaluation of the Using Possibilities of the Carbonitrided Simple Steels Instead of Carburized Low Alloy Steels (Wear properties)”, Applied Surface Science, Vol. 119, pp. 25-33,1997.
140
[26] S. Yerramareddy and S. Bahadur, “Effect of Operational Variables, Microstructure and Mechanical Properties on the Erosion of Ti-6A1-4V”, Wear, 142, pp. 253-263, 1991.
[27] M.V. Stappen, B. Malliet, L. Stals, L. D. Schepper, J.R. Roos and J.P. Celis, “Characterization of TiN Coatings Deposited on Plasma Nitrided Tool Steel Surfaces”, Materials Science and Engineering, A140, pp. 554-562,1991.
[28] M. Ignatiev, E. Kovalev and I. Melekhin, “Investigation of the Hardening of a Titanium Alloy by Laser Nitriding”, Wear, 166, pp. 233-236, 1993.
[29] A. Schulz, H.R. Stock and P. Mayr, “Physical Vapour Deposition of TiN Hard Coatings with Additional Electron Beam Heat Treatment”, Materials Science and Engineering, A140, pp. 639-646, 1991.
[30] M. Zlatanovic, T. Gredic, N. Popovic and Z. Bogdanov, "Matching of TiN Coating Structures by Plasma Nitriding of Substrates", Vacuum, Vol. 44, No. 2, pp.83-88,1993.
[31] D. G. Konitzer, B. C. Muddle, H. L. Fraser and R. Kircheim, "Titanium, Science and Technology", Vol. 1, Ed. By G. Lutgering, U. Zwicker and W. Burak (DGM, Oberusel, West Germany), pp. 405-410, 1985.
[32] J.C. Wiliams, “Titanium Technology: Present Status and Future Trends”, Eds. F.H. Froes, T. Eylon and H.B. Bomberger, Titanium Development Association, pp. 75-86, 1985.
[33] K.G. Budinski, “Tribological Properties of Titanium Alloys”, Wear, Vol. 151, pp. 203-217, 1991.
[34] R. Grun and H. Gunther, “Plasma Nitriding in Industry Problems, New Solutions and Limits”, Materials Science Engineering, Vol. 140, pp. 435-441, 1991.
[35] N. Laidani, J. Perriere, D. Lincot, A. Gicquel and J. Amauroux, "Nitriding of Bulk Titanium and Thin Titanium Films in a NH3 Low Pressure Plasma", Appl. Surface Science, Vol. 36, pp. 520-529,1989.
[36] A. Gicquel, N. Laidani, P. Saillard and I. Amauroux, "Plasma and Nitrides: Application to the Nitriding of Titanium", Pure and Appl. Chem., Vol. 62, No. 9, pp. 1743-1750, 1990.
[37] J.F. Lin and J.H. Homg, "Analysis of the Tribological Behaviour and Wear Mechanisms of Titanium Nitride Coating", Wear 171, pp. 59-69, 1994.
[38] J. Kourtev, R. Pascova and E. Weibmantel, “A Modified Method for Arc Deposition of Ti-N Thin Films”, Vacuum, Vol. 48, No. 1, pp. 7-12, 1997.
[39] J. Folhers, D.R.F. West and W.M. Steen, “Laser Surface Melting and Alloying of Titanium”, Laser Surface Treatment of Metals, pp. 451-460, 1986.
141
[40] O.V. Akgun and O.T. Inal, “Laser Surface Modification of Ti-6A1-4V Alloy”, Journal of Materials Science, Vol. 29, pp. 1159-1168, 1994.
[41] B.S. Yilbas and M. Sami, “Laser Melting of Ti-15Al-20Nb Alloy”, Journal of Materials Engineering and Performance, Vol. 5, No. 1, pp. 124-128, 1996.
[42] T. Bell, M.H. Sohi, J.R. Betz and A. Bloyce, "Energy Beams in Second Generation Surface Engineering of Aluminum and Titanium Alloys", Key Engineering Materials, Vols. 46 and 47, pp. 69-84, 1990.
[43] B.S. Yilbas, A.Z. Sahin, M. Sami, A. Goban and R. Bozdogan, “Study into Laser Heating of Ti-14Al-21Nb Alloy to Improve Properties”, Optics and Laser in Engineering, Vol. 23, pp. 53-64, 1995.
[44] H. Xin, S. Mridha and T.N. Baker, “The Effect of Laser Surface Nitriding with a Spinning Laser Beam on the Wear Resistance of Commercial Purity Titanium”, Journal of Materials Science, Vol. 31, pp. 22-30, 1996.
[45] M. Toyal and K. Mukherjee, "Thermal and Microstructural Analysis for Laser Surface Hardening of Steel", J.of Appl. Phys., V. 75, N. 8, pp.3855-3861, 1994.
[46] M. Osawa, “Improving the Corrosion Resistance of Cast Iron by Laser Surface Melting”, Corrosion Engineering, Vol. 45, pp. 25-34, 1996.
[47] B. Malliet, J.P. Celis, J.R. Roose, L.M. Stals and M. V. Stappen, "Wear Phenomena in the System TiN-Coated High Speed Steel Disk Against a Chromium Steel Pin", Wear, Vol. 142, pp. 151-170, 1991.
[48] G. Fischer, G.E. Welsch, M-C. Kim and R.D. Schieman, "Effect of Nitrogen Ion Implantation on Tribological Properties of Metallic Surfaces", Wear, Vol. 146, pp. 1-23, 1991.
[49] I.L. Singer, S. Fayeulle and P.O. Ehni, "Friction and Wear Behavior of TiN in Air: The Chemistry of Transfer Films and Debris Formation", Wear, Vol. 149, pp. 375-394, 1991.
[50] R.F. Huang, L.S. Wen, L.P. Guo, J. Gong B.H. Yu and H. Bangert, "Micro- Structural and Indentation Characterization of Ti/TiN Multilayer Films”, Surface and Coatings Technology, Vol. 50, pp. 97-101,1992.
[51] A. Mucha and M. Braun, “Requisite Parameters for Optimal Wear Performance of Nitrogen-Implantted Titanium and Ti-6A1-4V”, Surface and Coatings Technology, Vol. 50, pp. 135-139, 1992.
[52] A. Chen, J. Blanchard, S.H. Han, J.R. Conrad, R.A. Dodd, P. Fetherston and F.J. Worzala, "A Study of Nitrogen Ion-Implanted Ti-6A1-4V ELI by Plasma Source Ion Implantation at High Temperature", Journal of Materials Engineering and Performance, pp. 845-848,1992.
142
[53] G.M. Mehrotra, V.K. Jain, H.M. Urdianyk and B.D. Barton, "Effect of Ion Implantation on Friction and Wear Behavior of Steels", Wear, Vol. 159, pp. 47-55,1992.
[54] Y.L. Su, J.S. Lin, L.I. Shiau and J.D. Wu, "A Tribological Investigation of Physical Vapour Deposition TiN Coatings Paired with Surface Treated Steels for Machine Element Applications", Wear, Vol. 167, pp. 73-83, 1993.
[55] E. Vancoille, J.P. Celis and J.R. Roos, "Dry Sliding Wear of TiN Based Ternary PVD Coatings", Wear, Vol. 165, pp. 41-49, 1993.
[56] Y.L. Su and J.S. Lin, "An Investigation of the Tribological Potential of TiN, CrN and TiN+CrN Physical Vapor Deposited Coatings in Machine Element Applications", Wear 170, pp, 45-53, 1993.
[57] K.J. Yoon, S.J. Cho, S.S. Kim, M.S. Yoon and S.H. Yang, "Wear Mechanism of TiN-Coated High-Speed Steel During Sliding", Wear 170, pp. 101-108, 1993.
[58] G.H. Shehata and A.M.A. Moussa, "Nd: YAG Laser Alloying of High-Speed Steel Tools with BN and Ti/BN and the Effects on Turning Performance", Wear 170, pp. 199-210, 1993.
[59] M.V. Stappen, M. Kerkhofs, C. Quaeyhaegens and L. Stals, “Introduction in Industry of a Duplex Treatment Consisting of Plasam Nitriding and PVD Deposition of TiN”, Surface and Coatings Technology, Vol. 62, pp. 655-661, 1993.
[60] Z.P. Huang, Y. Sun and T. Bell, "Friction Behaviour of TiN, CrN and (TiAl)N Coatings", Wear 173, pp. 13-20,1994.
[61] S. Hogmark and P. Hedenqvist, "Tribological Characterization of Thin, Hard Coatings", Wear 179, pp. 147-154, 1994.
[62] N. Dingremont, E. Bergmann, P. Collignon and H. Michel, "Optimization of Duplex Coatings Built from Nitriding and Ion Plating with Continuous and Discontinuous Operation for Construction and Hot Working Steels", Surface and Coatings Technology, Vol. 72, pp. 163-168, 1995.
[63] D. Muller, Y.R. Cho and E. Fromm, "Adhesion Strength of Ductile Aluminium and Brittle TiN Coatings on Steel, Aluminium and Copper, Measured by Fracture Mechanics Tests", Surface and Coatings Technology, Vol. 74-75, pp. 849-856, 1995.
[64] I. Milosev, H.-H. Strehblow and B. Navinsek, "XPS in the Study of High- Temperature Oxidation of CrN and TiN Hard Coatings", Surface and Coatings Technology, Vol. 74-75, pp. 897-902, 1995.
[65] F. Alonso, A. Arizaga, S. Quainton, J.J. Ugarte, J.L. Viviente and J.I. Onate, "Mechanical Properties and Structure of Ti-6A1-4V Alloy Implanted with
143
Different Light Ions", Surface and Coatings Technology, Vol. 74-75, pp. 986- 992, 1995.
[66] M. Larsson, M. Bromark, P. Hedenqvist and S. Hogmark, "Deposition and Mechanical Properties of Multilayered PVD Ti-TiN Coatings", Surface and Coatings Technology, Vol. 76-77, pp. 202-205, 1995.
[67] K.J. Ma, A. Bloyce and T. Bell, "Examination of Mechanical Properties and Failure Mechanisms of TiN and T-TiN multilayer Coatings", Surface and Coatings Technology, Vol. 76-77, pp. 297-302, 1995.
[68] E.J. Bienk, H. Reitz and N.J. Mikkelsen, "Wear and Friction Properties of Hard PVD Coatings", Surface and Coatings Technology, Vol. 76-77, pp. 475- 480, 1995.
[69] J. Zhou and S. Bahadur, "Erosion-Corrosion of Ti-6A1-4V in Elevated Temperature Air Environment", Wear 186-187, pp. 332-339, 1995.
[70] J.M. Robinson and R.C. Reed, "Water Droplet Erosion of Laser Surface Treated Ti-6A1-4V", Wear 186-187, pp. 360-367,1995.
[71] C. Gerdes, A. Karimi and H.W. Bieler, "Water Droplet Erosion and Microstructure of Laser-Nitrided T-6A1-4V", Wear 186-187, pp. 368-374,1995.
[72] B.S. Yilbas, A.Z. Sahin, S.A.M. Said, J. Nickel and A Goban, "Investigation into Some Tribological Properties of Plasma Nitrided Hot-Worked tool Steel AISI Hll", Journal of Materials Engineering and Performance, Vol. 5(2), pp. 220-224, 1996.
[73] A. Kobayashi, " Surface Nitridation of Titanium Metal By Means of a Gas Tunnel Type plasma Jet", Journal of Materials Engineering and Performance, Vol. 5(3), pp. 373-382, 1996.
[74] B.S. Yilbas, A. Coban, J. Nickel, M. Sunar, M. Sami and B.J. Abdul-Aleem, "Investigation into Nitrided Spur Gears", Journal of Materials Engineering and Performance, 5, pp. 728-733, 1996.
[75] Y. Y. Guu, J.F. Lin and C-F. Ai, "The Tribological Characteristics of Titanium Nitride Coatings, Part-I, Coating Thickness Effects", Wear 194, pp. 12-21,1996.
[76] Y.Y. Guu and J.F. Lin, "The Tribological Characteristics of Titanium Nitride Coatings, Part-II, Comparisons of Two Deposition Processes", Wear 194, pp. 22-29, 1996.
[77] H.S. Kwok, H.S. Kim, D.H. Kim, W.P. Shen, X.W. Sun and R.F. Xiao, "Correlation Between Plasma Dynamics and Thin Film Properties in Pulsed Laser Deposition", Applied Surface Science 109/110, pp.595-600, 1997.
144
[78] H.U. Krebs, M. Stormer, S. Fahler, O. Bremert, M. Hamp, A. Pundt, H.Teichler, W. Blum and T.H. Metzger, "Structural Properties of LaserDeposited Metallic Alloys and Multilayers", Applied Surface Science 109/110, pp.563-569, 1997.
[79] Z. Xingzhong, L. Jiajun, Z. Baoliang, M. Hezhuo and L. Zhenbi, "WearMechanisms of Ti (C,N) Ceramic in Sliding Contact with Stainless Steel", Journal of Materials Science 32, pp.2963-2968, 1997.
[80] G.D. Davis, G.B. Groff and R.A. Zatorski, "Plasma Spray Coatings as Treatments for Aluminum, Titanium and Steel Adherends", Surface and Interface Analysis, Vol.25, pp.366-373,1997.
[81] M. Scholl, "Abrasive wear of Titanium Nitride Coating", Wear 203-204, pp. 57-64, 1997.
[82] A. Molinari, G. Straffelini, B. Tesi, T. Bacci and G. Pradelli, "Effects of Load and Sliding Speed on the Tribological Behaviour of Ti-6A1-4V plasma Nitrided at Different Temperatures", Wear 203-204, pp. 447-454, 1997.
[83] S. Novak and M. Komac, "Wear of Cermet Cutting Tools Coated with Physically Vapour Deposited TiN", Wear 205, pp. 160-168, 1997.
[84] J. Khedkar, A. S. Khanna and K. M. Gupt," Tribological Behaviour of Plasma and Laser Coated Steels", Wear 205, pp. 220-227, 1997.
[85] A. Molinari, G. Straffelini, B. Tesi and T. Bacci, "Dry Sliding WearMechanisms of the Ti-6A1-4V Alloy", Wear 208, pp. 105-112,1997.
[86] R. S. De Sousa and C. Alves, "Overheating of Plasma-Nitrided Workpieceswith Cylindrical Blind holes", Journal of Materials Engineering andPerformance, Vol. 6(3), pp. 300-302, 1997.
[87] S. Novak, M. Sokovic, B. Navinsek, M. Komac and B. Pracek, “On the Wear of TiN (PVD) Coated Cermet Cutting Tools”, Vacuum, Vol. 48, No. 2, pp. 107-112, 1997.
[88] C.V. Franco, L.C. Fontana, D. Bechi, A.E. Martinelli and J.L.R. Muzrt, “An Electrochemical Study of Magnetron-Sputtered Ti- and TiN-Coated Steel”, Corrosion Science, Vol. 40, No. l,pp. 103-112,1998.
[89] S. Kalpakjian, Manufacturing Process for Engineering Materials, 3rd ed., Addison-Welsley Publ. Company, 1997.
[90] S.C. Lee, W.Y. Ho and T.M. Chen, “Prevention of Hydrogen Degradation in Titanium by Deposition of TiN Thin Film”, Journal of Materials Engineering and Performance, Vol. 3, No. 6, pp. 740-743, 1994.
145
[91] K. D. Bruyn, J.P. Celis, J.R. Roos, L.M. Stals and M.V. Stappen, “Coating Thickness and Surface Roughness o f TiN-Coated High Speed Steel in Relation to Coating Functionality”, Wear, Vol. 166, pp. 127-129,1993.
[92] R. E. Reed-Hill and R. Abbaschian, Physical Metallurgy Principles, 3rd ed., PWS Publ. Company, 1994.
[93] W. D. Callister, Material Science and Engineering, 3rd ed., John Wiley Sons, Inc., 1994.
[94] N. Zhang, W. Zhai, Y. Wang and A. Wagendristel, “X-ray Studies of Ti-N Coatings”, Vacuum, Vol. 44, No. 1, pp. 51-53, 1993.
[95] G. Chryssolouris, Laser Machining, Theory and Practice, Springer-Verlag, 1991.
[96] M. Sami, Heat Transfer Mechanisms Governing Laser Metal Interactions, M.Sc., Mech. Eng. Dept., King Fahd University of Petroleum and Minerals, 1993.
[97] W.M. Steen, “Surface Coating Using a Laser”, International Conference of Advances in Surface Coating Technology, London, Vol. 1, 1978.
[98] M.K. El-Adawi, M.A. Abdel-Naby and S.A. Shalaby, “Laser Heating of a Two-Layer System with Constant Surface Absorption: An Exact Solution”, Int. J. Heat and Mass Trans., Vol. 38, pp. 947-952, 1995.
[99] D. Whitesed, R.E. Goffeith and M.N. Srinivdson, “The Effect o f Laser Trimming on Properties o f Ti-6A1-4V Sheet”, Materials and Manufacturing Process, Vol. 10, No. 6, pp. 1201-1214, 1995.
[100] H. Czichos, Tribology, Elsevier Scientific Publishing Company, 1978.
[101] Y. Sun, T. Bell and G. Wood, “Wear Behaviour o f Plasma-Nitrided Martensitic Stainless Steel”, Wear, Vol. 178, pp. 131-138, 1994.
[102] R.T. Guiva, A.A. Levchenko, I.A. Tananko, V.A. Guiva and E.Y. Sittsevaya, “Enhancement o f the Wear Resistance o f Pieces Made o f 30KhGSN2A and 38KhS Steels by Laser Treatment”, Materials Science, Vol. 31, No. 5, pp. 105-109, 1195.
[103] D.A. Rigney, “Comments on the Sliding Wear o f Metals”, Tribology International, Vol. 30, No. 5, pp. 361-367, 1997.
[104] G.W. Critchlow, J. Hampshire, R. Kingdon, Z. Naeem, A.B. Smith and D.G. Teer, “Adhesion of Wear Resistant Hard Coatings to Steel Substrates”, Tribology International, Vol. 30, No. 7, pp. 499-506, 1997.
146
[105] E-S. Yoon, H. Kong, O-K. Kwon and J-E. Oh, “Evaluation o f Frictional Characteristics for a Pin-on-Disc Apparatus with Different Dynamic Parameters”, Wear, Vol. 203-204, pp. 341-349,1997.
[106] D.A. Rigney, “The Roles o f Hardness in the Sliding Behaviour o f Materials”, Wear, Vol. 175, pp. 63-69, 1994.
[107] B.S. Yilbas, R. Davies and Z. Yilbas, “Surface Line and Plug Flow Models Governing Laser Produced Vapor from Metallic Surface”, Pamana J. o f Phys., Vol. 38, pp. 195-209,1992.
[108] B. S. Yilbas and A. Z. Al-Gami, “Some Aspects o f Laser Heating of Engineering Materials”, Journal o f Laser Applications, Vol. 8, pp. 197-204,1996.
[109] C. Kittel, Introduction to Solid State Physics, 4th Ed. Wiley, New York, 1971.
[110] B.S. Yilbas, “Heating of Metals at a Free Surface by Laser Irradiation - an Electron Kinetic Theory Approach”, Int. J. Engg. Sci., Vol. 24, No. 8, pp. 1325-1334, 1986.
[111] J.F. Ready, Industrial Applications o f Lasers, Academic Press, New York, 1978.
[112] B.S. Yilbas and K. Apalak, “The Basic Concepts of Heat Transfer Mechanism During Laser Drilling of Metals”, Egypt J. Phys., Vol. 18, No. 2, pp. 133-156,1987.
[113] B.S. Yilbas and A.Z. Sahin, “Laser Heating Mechanism Including Evaporation Process”, Int. Comm. In. Heat and Mass Trans., Vol. 21, pp. 509-518, 1994.
[114] B. S. Yilbas, A. Z. Sahin and R. Davier, “Laser Heating Mechanism Including Evaporation Process Initiating Laser Drilling”, Int. J. Mech. Tools Manufact., Vol. 35, No. 7, pp. 1047-1062,1995.
[115] B.S. Yilbas, PhD Thesis, Mech. Eng. Dept., University o f Birmingham, 1980.
[116] H. Mingli, P.J. Bishop and A. Minardi, “Prediction o f Cavity Shape and Material Removal Rates Using a Two-Dimensional Axisymmetric Heat Conduction Model for Fibrous Ceramic Insulation and Comparison with Experiment”, J. o f Laser Applications, Vol. 5, pp. 33-40,1993.
[117] G. Simon, U. Gratzke and J. Kross, “Analysis of Heat Conduction in Deep Penetration Welding with a Time-Modulated Laser Pulse”, J. Phys. D.: Appl. Phys., Vol. 26, pp. 862-869, 1993.
[118] B.S. Yilbas, "Analytical Solution for the Heat Conduction Mechanism Appropriate to the Laser Heating Process", Int. Comm, in Heat and Mass Transfer, V. 20, N. 4, pp. 545-555,1993.
147
[119] B.S. Yilbas and M. Sami, “Heating Mechanism Including Evaporation Process-Semiclassical and Kinetic Theory Approaches”, Jap. J. Appl. Phys., Vol. 34, pp. 6391-6400,1995.
[120] B.F. Blackwell, “Temperature Profile in Semi-Infinite Body with Exponential Source and Convective Conditions, ASME J. o f Heat Transfer, Vol. 112, pp. 567-571, 1990.
[121] P. Archambault and A. Azim, “Inverse Resolution of Heat-Transfer Equation: Application Steel and Aluminum Alloy Quenching”, Journal o f Materials Engineering and Performance, Vol. 4, pp. 730-736,1995.
P A P E R S I N C O N F E R E N C E A N D J O U R N A L :
1. M.A. Mohammed, B.S. Yilbas and M.S.J. Hashmi, “Wear Properties o f Plasma Nitrided and Laser Melted Ti-6A1-4V Alloy”, International Conference of Advances in Materials & Processing Technologies -APMT’97.
2. M.A. Mohammed, M.S.J. Hashmi and B.S. Yilbas, “A Study Into Effects o f CO2 Laser Melting o f Nitrided Ti-6A1-4V Alloy”, ASM Journal o f Materials Engineering and Performance, Vol. 6, No. 5, pp. 642-648, 1997.
148


