Download - Student Laboratory Manual

1
“Development of Teaching Kit on Chemical Testing for New Senior
Secondary Curriculum”
Student Laboratory Manual
Department of Chemistry Hong Kong Baptist University
A Project commissioned by
the Innovation and Technology Commission and Hong Kong Council for Testing and Certification
Content
Page
Experiment 1 – Determination of NO2 in Air: Air Pollutant 4 Analysis
Experiment 2 – Analysis of Copper in Wastewater 13 Experiment 3 – Determination of Sulphur Dioxide (SO2) in 22
Dried Food Using Optimized Monier-Williams Method
Experiment 4 – Is The Dairy Product Safe? Gold 30 Nanoparticles As A Visual Detection Tool of Melamine
Experiment 5 – Differentiation of Chinese Herb Danshen 40 (丹參) from Other Similar Herbs Using Facile Test-Tube Scale Chemical Test Method
Experiment 6 – Determination of Vitamin C in Commercial 47 Sample and Fresh Fruit Juice by Iodometric Titration
2
Important Note Students must read the safety precaution of each experiment in this Manual carefully beforehand and take all necessary safety
precautions in conducting the experiments carefully. Advice and information offered in this Manual are by no means exhaustive and do not preclude the need for exercising care and good judgement at
all times in safeguarding against accidents. When in doubts, please seek instructions from your teachers immediately.
3
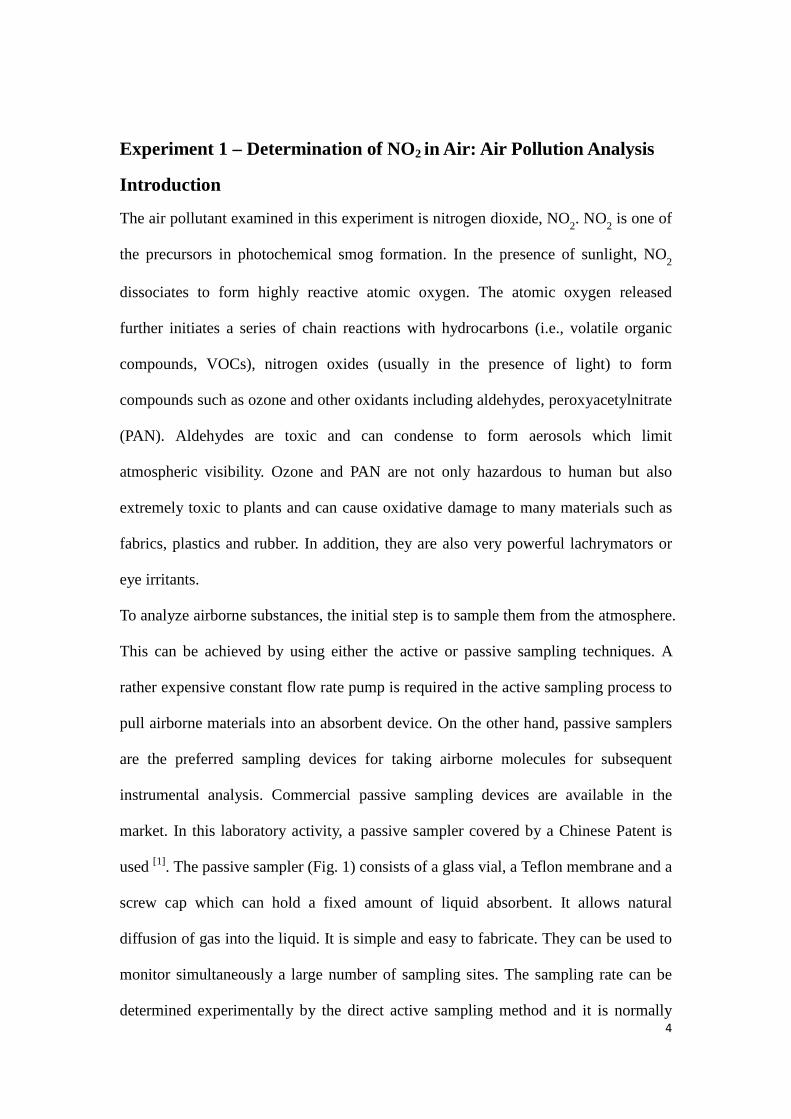
Experiment 1 – Determination of NO2 in Air: Air Pollution Analysis
Introduction
The air pollutant examined in this experiment is nitrogen dioxide, NO2. NO2 is one of
the precursors in photochemical smog formation. In the presence of sunlight, NO2
dissociates to form highly reactive atomic oxygen. The atomic oxygen released
further initiates a series of chain reactions with hydrocarbons (i.e., volatile organic
compounds, VOCs), nitrogen oxides (usually in the presence of light) to form
compounds such as ozone and other oxidants including aldehydes, peroxyacetylnitrate
(PAN). Aldehydes are toxic and can condense to form aerosols which limit
atmospheric visibility. Ozone and PAN are not only hazardous to human but also
extremely toxic to plants and can cause oxidative damage to many materials such as
fabrics, plastics and rubber. In addition, they are also very powerful lachrymators or
eye irritants.
To analyze airborne substances, the initial step is to sample them from the atmosphere.
This can be achieved by using either the active or passive sampling techniques. A
rather expensive constant flow rate pump is required in the active sampling process to
pull airborne materials into an absorbent device. On the other hand, passive samplers
are the preferred sampling devices for taking airborne molecules for subsequent
instrumental analysis. Commercial passive sampling devices are available in the
market. In this laboratory activity, a passive sampler covered by a Chinese Patent is
used [1]. The passive sampler (Fig. 1) consists of a glass vial, a Teflon membrane and a
screw cap which can hold a fixed amount of liquid absorbent. It allows natural
diffusion of gas into the liquid. It is simple and easy to fabricate. They can be used to
monitor simultaneously a large number of sampling sites. The sampling rate can be
determined experimentally by the direct active sampling method and it is normally 4

provided by the supplier.
NO2 on the other hand can be generated indoors from the flue gas of burning stove
and tobacco smoking. Thus, it has been identified as one of the indoor pollutants.
High concentration of NO2 in the indoor environment may cause eye, nose and throat
irritation and could also impair lung functions and increase the risk of respiratory
infections. For promoting health, the Environmental Protection Department (EPD) has
launched an Indoor Air Quality Certification Scheme (www.iaq.gov.hk). Through the
Hong Kong Laboratory Accreditation Scheme (HOKLAS) [2], a number of local
commercial testing laboratories have been accredited for measuring the indoor NO2
level. Most accredited laboratories are testing indoor air samples collected by the
passive sampling method. NO2 trapped in the sampler will be extracted by water and
converted to nitrite ion for quantification with different instrumental analytical
methods such as “flow injection method” or “ion chromatographic method”. However,
the instruments used in the commercial laboratories are not available in secondary
schools. On the basis of a literature procedure, a colorimetric method for the
determination of NO2 is used in both the indoor and outdoor environments.
In this laboratory work, NO2 in air (either indoor or outdoor environment) is collected
by a passive sampler. When NO2 and the colourless absorbent reagent are brought
together, a pink-colour solution is developed. The colour is due to the formation of an
azo dye complex. Fig. 2 shows the absorption spectrum of the azo dye. Since the
complex is the only coloured species in the system, the concentration of NO2 can be
determined by colorimetry. The absorbance is directly proportional to the
concentration of the coloured constituent as governed by the Beer’s Law [3].
5

Fig. 1. Passive samplers.
Fig. 2. Visible absorption spectrum of the azo dye.
Intended Learning Outcomes
After the activity, the student is expected to be able to
1. understand the operation of the testing and certification industry in Hong Kong;
2. isolate NO2 in the air samples using passive sampling techniques;
3. analyze NO2 quantitatively using colorimetry;
4. acquire the basic concepts of accuracy, precision, and detection limit of
analytical methods.
Experimental
Apparatus
1x 4-LED photometer
2x passive sampler with stand
1x membrane
1x glass cuvette
4x volumetric flask of 25 mL
1x pipette of 5 mL
1x 100 – 1000 μL auto-pipette with pipette tubes or 1 mL graduated pipette
1x 50 – 200 μL auto-pipette with pipette tubes or 0.2 mL graduated pipette
6
1x scissors
1x beaker of 100 mL
1x beaker of 250 mL
2x dropper
Reagents and chemicals
2.5 g sulphanilic acid
0.025 g N-(1-naphthyl)-ethylenediamine dichlorohydrate
5 mL 1-propanol
0.75 g sodium nitrite
2 L Deionized water
Sample pretreatment method
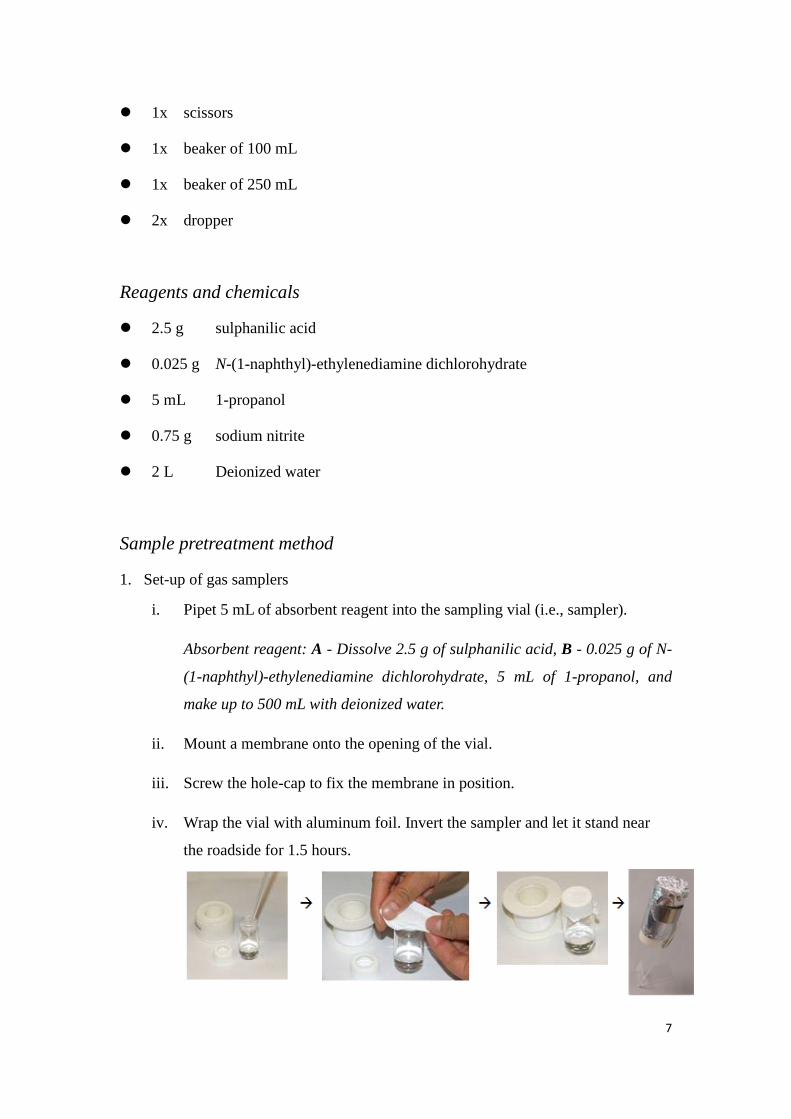
1. Set-up of gas samplers
i. Pipet 5 mL of absorbent reagent into the sampling vial (i.e., sampler).
Absorbent reagent: A - Dissolve 2.5 g of sulphanilic acid, B - 0.025 g of N-
(1-naphthyl)-ethylenediamine dichlorohydrate, 5 mL of 1-propanol, and
make up to 500 mL with deionized water.
ii. Mount a membrane onto the opening of the vial.
iii. Screw the hole-cap to fix the membrane in position.
iv. Wrap the vial with aluminum foil. Invert the sampler and let it stand near
the roadside for 1.5 hours.
7

v. When time is up, replace the membrane cover with a septum cap and let it
stand for 10 min.
vi. Repeat the above set-up steps on the other two sample vials and use the vial
with a solid cap as control.
2. Preparation of a series of NO2 standard solution in 25 mL volumetric flask as
follows:
Standard Solution 1 2 3 4 Concentration of NO2 (ppm) 0.02 0.04 0.08 0.12
Volume of 10 ppm NO2 added (mL) 0.05 0.1 0.2 0.3 Then all the solutions are filled up to the mark with the absorbent reagent.
10 ppm NO2: Dilute 5 mL of 1000 mg/L (ppm) NO2 solution to 500 mL in a
volumetric flask with deionized water.
1000 ppm NO2: Dissolve 0.7499 g NaNO2 in a 500 mL volumetric flask and
dilute to the mark with deionized water.
Analytical method
Let the colour develop for 10 min and then measure the
absorbance of the blank (absorbent reagent), sample and
standard solution using the photometer with a green
LED light source (or other types of colorimeter).
Safety precaution
Observe the standard safety procedures for laboratory activity;
Put on the safety goggles, laboratory coats, and gloves;
Be careful when cutting the membrane with a pair of scissor;
Material Safety Data Sheet (MSDS) of chemicals are available online on the
website of MSDSonline.com.
8

Data Sheet
I. Analysis of NO2 content near road side
E A = Absorbance, E oo = Detected potential of the blank ∴ A = log
E
EAbsorbance = log o using green LED measurement, Eo = ______________V
ESampling time: ___________________min
Sampling location: __________________
Sampling rate (provided): 2.3 x 10⁻⁵ m3/min
Descriptions E (V)
Blank Eo =
0.02 ppm NO2 standard
0.04 ppm NO2 standard
0.08 ppm NO2 standard
0.12 ppm NO2 standard
Sample 1st trial
Sample 2nd trial
Sample 3rd trial
Control
Data Treatment 1. Calculate the absorbance (A) for the standards, sample solutions and control.
Descriptions E (V) Absorbance
Blank Eo = 0
0.02 ppm NO2 standard
0.04 ppm NO2 standard
0.08 ppm NO2 standard
0.12 ppm NO2 standard
Sample 1st trial
Sample 2nd trial
Sample 3rd trial
9

Sample Mean -----------------
Control
2. Plot a calibration curve {absorbance vs. concentration of NO2 (ppm)} and find
out the concentration of NO2 (mg/L) in the samplers and the control.
The concentration of NO2 (mg/L) in the sampler: _____________________
The concentration of NO2 (mg/L) in the control: ______________________
10
3. Calculate the weight of NO2 collected in the samplers and the control:
Weight of NO2 in sampler (μg):
Conc. of NO mg 2 ( /L) in sampler × 103 μg/mg ×5 mL × 10-3 L/mL
Weight of NO2 in control (μg):
Conc. of NO (mg/L) in control × 103 μg/mg × 5 mL × 10-32 L/mL
Net weight of NO2 collected (μg):
Weight of NO2 in sampler (μg) - Weight of NO2 in control (μg)
4. Calculate the volume of air sample (m3):
Volume of air sample (m3): Diffusion rate (m3/min) x sampling time (min)
= 2.3 x 10⁻⁵ m3/min x sampling time (min)
5. Calculate the concentration of NO2 in atmosphere with unit μg/m3.
3 Weight of NO (2 g/ m ) = 2 µ g) NO (µ
Volume of Air Sampled in m3
11

Questions and Answer
1. What is the colour change of absorbent reagent after standing near roadside for
1.5 hours?
2. Green light source is used for taking measurements in the experiment. Suggest
the reasons.
3. What are the major differences between passive and active samplers for NO2
analysis?
4. Why must the sampler be wrapped with aluminum foil?
5. Find out about the “flow injection method” or “ion chromatographic method”
that the testing and certification industry uses to measure NO2 in IAQ. What are
the advantages of using these methods?
References [1] 陳永康,肖丹,王柯敏,<快速簡便氣體採集和測定裝置> 中國專利<ZL 00 2
25023.3>, 22/04/2001. The Intellectual Property holder (i.e., Wing Hong Chan)
of this Patent agrees to permit the use of the Patent for education purpose in
Hong Kong.
[2] http://www.hkas.gov.hk/
[3] D. Xiao, L. Lin, H. Yuan, M. F. Choi, W. H. Chan, J. Chem. Educ. 2005, 82,
1231-1233.
12

Experiment 2 – Analysis of Copper in Wastewater
Introduction
Industrial effluents and wastewater may pose potential risks and hazards to human
beings and the environment. In general, effluents from electroplating plants may
contain toxic metal ions such as copper (II) ions. Repeated or prolonged exposure to
Cu (II) species such as copper sulfate can cause kidney and liver damage [1]. To
comply with the local legislation, companies can engage testing laboratories in Hong
Kong which are capable of analysing the copper content to ensure that the effluents do
not exceed the upper limit of 0.2 mg/L [2] before discharging into the environment.
The concentration of Cu (II) in industrial effluents can be determined by
“colorimetric” method.
Cu (II) reacts with oxalic acid bis(cyclohexylidene hydrazide) (cuprizone) to form a
complex with a broad band absorption in the visible light range (Fig. 1) [3]. The
absorbance of this complex is insensitive to pH change and is therefore commonly
used for the determination of copper. Classically, the concentration of Cu (II) can be
determined by comparing visibly the intensity of the orange colouration with Cu (II)
standards. For a more accurate quantitative result, colorimetric method can be used.
O O
N NH C C NH N
Oxalic acid bis(cyclohexylidenehydrazide) – (Cuprizone)
The deepness of the colour, usually measured as the absorbance (A) of the solution
containing the absorbing analyte, is proportional to the extent of the absorption of
13

characteristic light by the coloured compound. The absorbance of a coloured species
can be correlated with the concentration of the species according to the Beer’s Law,
which states that: A = εbc where A is the absorbance, ε is the molar extinction
coefficient, c is the concentration of the species and b is the path length of the optical
cuvette. The absorbance of a solution is defined by A = log(Io/I) where Io and I are the
initial and final light intensity detected after passing through the analyte solution,
respectively. The deepness of the colour of the copper-cuprizone complex is
proportional to the copper contents. The absorbance of the analyte solution will be
measured by a colorimeter or a spectrophotometer and compared with those obtained
from standard copper solutions.
In this experiment a yellow Light Emitting Diode (LED) is used as the radiation
source (Fig. 2). The radiation after passing through the absorbing analyte is allowed to
fall on a photo-transistor which converts light energy into an electric signal. The
signal is proportional to the irradiation intensity and can be amplified and measured.
Fig. 1. Visible spectrum of Cu (II)-Cuprizone.
14
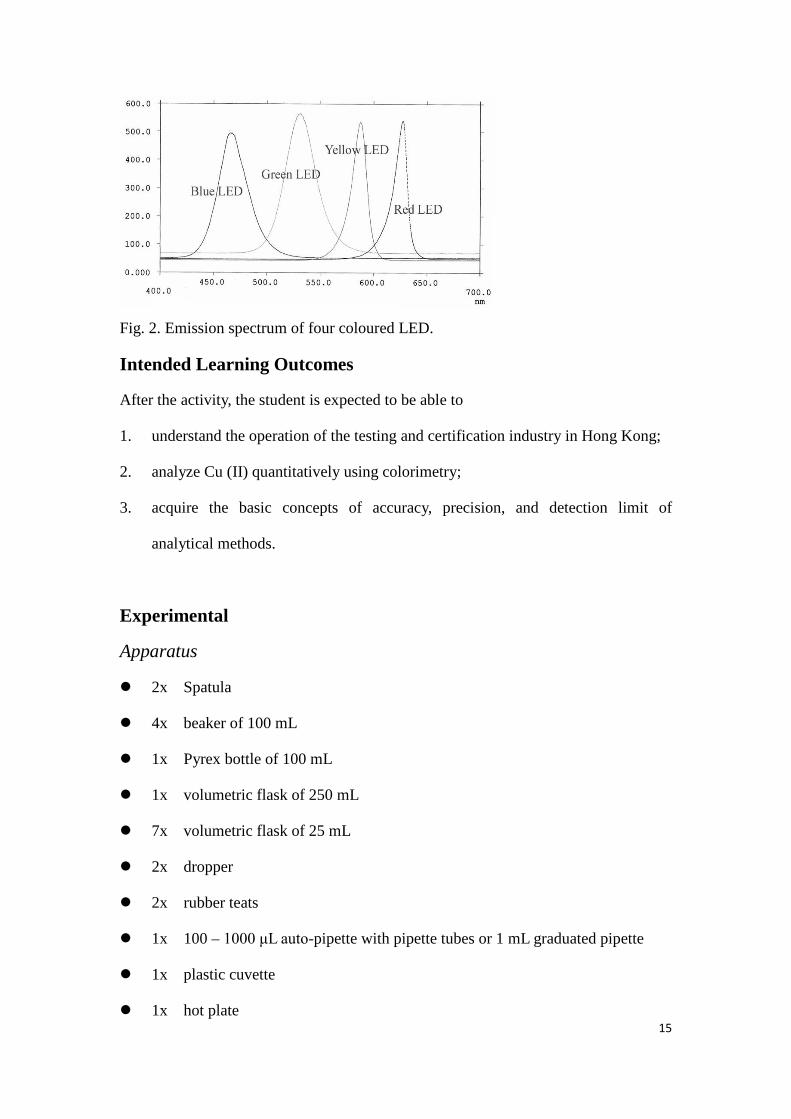
Fig. 2. Emission spectrum of four coloured LED.
Intended Learning Outcomes
After the activity, the student is expected to be able to
1. understand the operation of the testing and certification industry in Hong Kong;
2. analyze Cu (II) quantitatively using colorimetry;
3. acquire the basic concepts of accuracy, precision, and detection limit of
analytical methods.
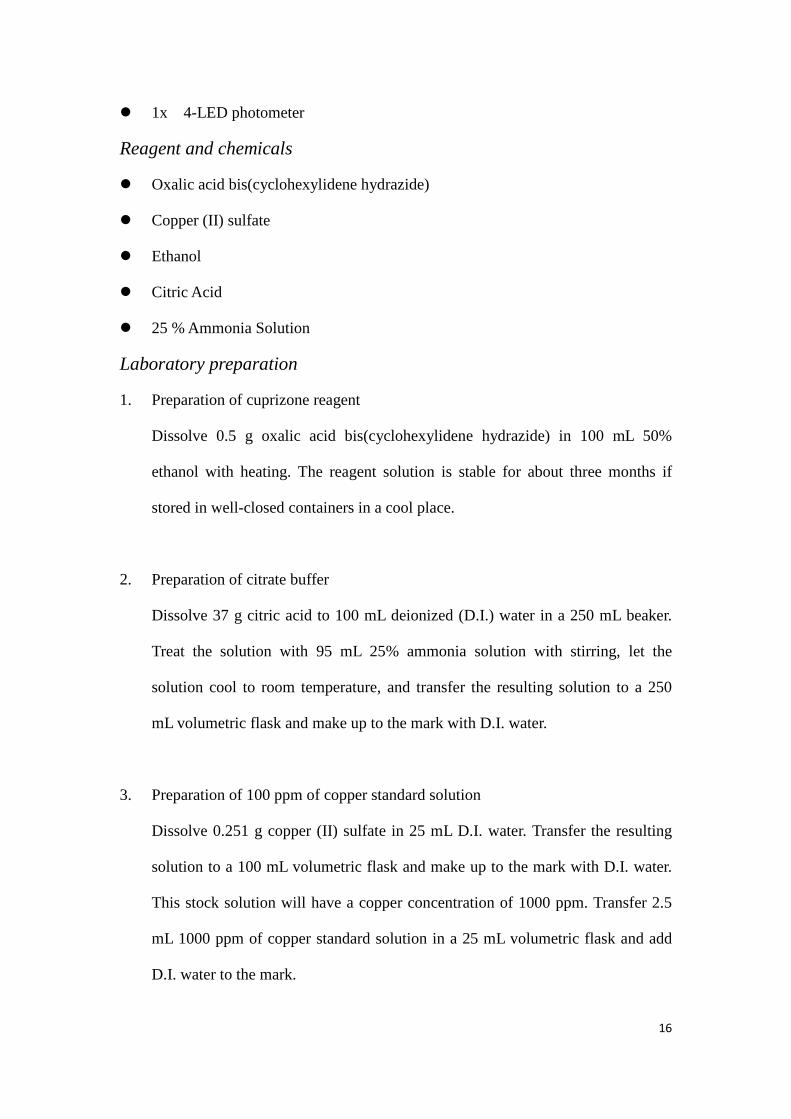
Experimental
Apparatus
2x Spatula
4x beaker of 100 mL
1x Pyrex bottle of 100 mL
1x volumetric flask of 250 mL
7x volumetric flask of 25 mL
2x dropper
2x rubber teats
1x 100 – 1000 μL auto-pipette with pipette tubes or 1 mL graduated pipette
1x plastic cuvette
1x hot plate
15
1x 4-LED photometer
Reagent and chemicals
Oxalic acid bis(cyclohexylidene hydrazide)
Copper (II) sulfate
Ethanol
Citric Acid
25 % Ammonia Solution
Laboratory preparation
1. Preparation of cuprizone reagent
Dissolve 0.5 g oxalic acid bis(cyclohexylidene hydrazide) in 100 mL 50%
ethanol with heating. The reagent solution is stable for about three months if
stored in well-closed containers in a cool place.
2. Preparation of citrate buffer
Dissolve 37 g citric acid to 100 mL deionized (D.I.) water in a 250 mL beaker.
Treat the solution with 95 mL 25% ammonia solution with stirring, let the
solution cool to room temperature, and transfer the resulting solution to a 250
mL volumetric flask and make up to the mark with D.I. water.
3. Preparation of 100 ppm of copper standard solution
Dissolve 0.251 g copper (II) sulfate in 25 mL D.I. water. Transfer the resulting
solution to a 100 mL volumetric flask and make up to the mark with D.I. water.
This stock solution will have a copper concentration of 1000 ppm. Transfer 2.5
mL 1000 ppm of copper standard solution in a 25 mL volumetric flask and add
D.I. water to the mark.
16
Analytical method
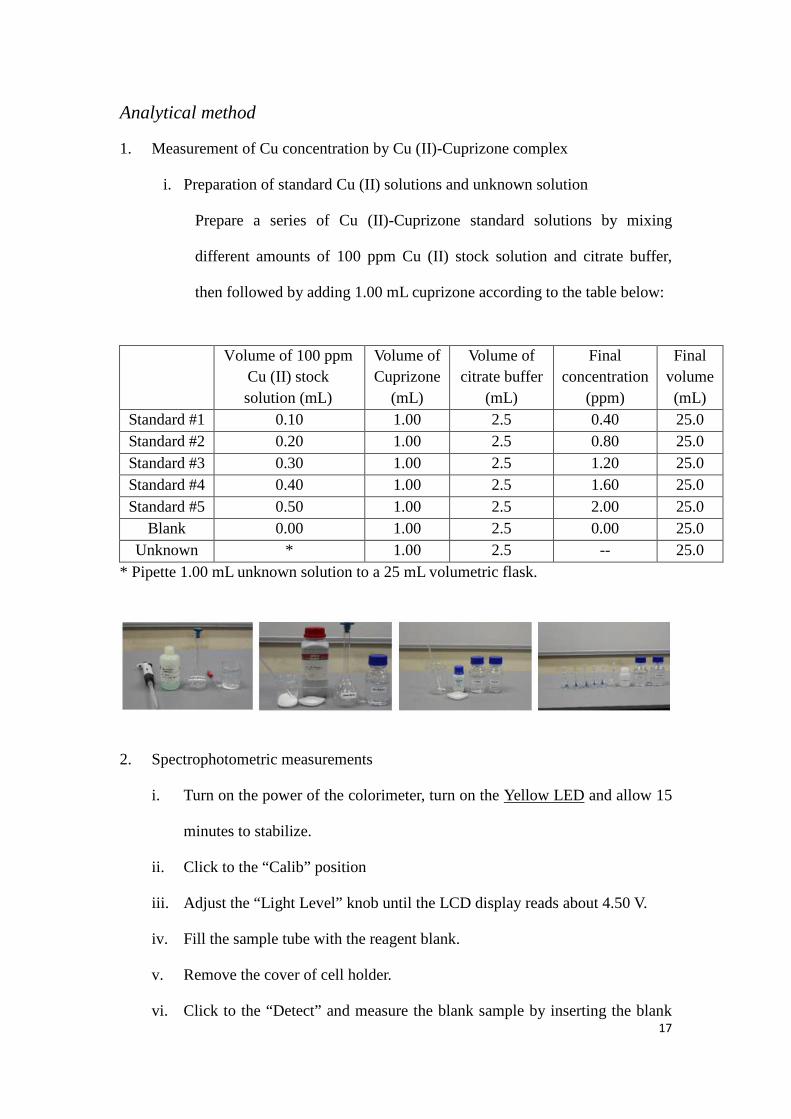
1. Measurement of Cu concentration by Cu (II)-Cuprizone complex
i. Preparation of standard Cu (II) solutions and unknown solution
Prepare a series of Cu (II)-Cuprizone standard solutions by mixing
different amounts of 100 ppm Cu (II) stock solution and citrate buffer,
then followed by adding 1.00 mL cuprizone according to the table below:
Volume of 100 ppm
Cu (II) stock solution (mL)
Volume of Cuprizone
(mL)
Volume of citrate buffer
(mL)
Final concentration
(ppm)
Final volume (mL)
Standard #1 0.10 1.00 2.5 0.40 25.0 Standard #2 0.20 1.00 2.5 0.80 25.0 Standard #3 0.30 1.00 2.5 1.20 25.0 Standard #4 0.40 1.00 2.5 1.60 25.0 Standard #5 0.50 1.00 2.5 2.00 25.0
Blank 0.00 1.00 2.5 0.00 25.0 Unknown * 1.00 2.5 -- 25.0
* Pipette 1.00 mL unknown solution to a 25 mL volumetric flask.
2. Spectrophotometric measurements
i. Turn on the power of the colorimeter, turn on the Yellow LED and allow 15
minutes to stabilize.
ii. Click to the “Calib” position
iii. Adjust the “Light Level” knob until the LCD display reads about 4.50 V.
iv. Fill the sample tube with the reagent blank.
v. Remove the cover of cell holder.
vi. Click to the “Detect” and measure the blank sample by inserting the blank 17

into the cell compartment.
vii. Record the reading (Eo) shown on the LCD display.
viii. Rinse the cuvette and then fill it with the standard solution and record the
reading (E) again.
ix. Repeat the procedure with series of standard solutions and sample solution.
(Caution: Do not adjust the “Light Level” knob while taking the standard
and sample measurements)
VR2 VR3
Detect/Calib switch
Light Level knob
Wavelength Selector knob
LCD display
3. Data treatment
EPlot a calibration graph of the standards using A = log ( o ) . Determine the E
concentration of the sample solution from the calibration curve using
EA log ( osample = )
Esample
18

E EA log ( o −= ∞ )
E − E∞
where E is the potential measured with the sample placed in the sample holder,
A is Absorbance
Eo is the potential measured with the blank solution, and
E∞ is the potential in the absence of light (dark current) (assuming = 0 V)
E ∴A = log ( o )
E
Data Sheet Photometer ( Yellow LED )
Calibration Voltage =
(E) Elog
E
[Cu] /ppm
Blank Eo = 0.000 0.000
Standard #1
Standard #2
Standard #3
Standard #4
Standard #5
19

Sample
Linear coefficient (R2) =
Safety precaution
Observe the standard safety procedures for laboratory activity
Put on the safety goggles, laboratory coats, and gloves
Material Safety Data Sheet (MSDS) of chemicals are available online on the
website of MSDSonline.com
20

Questions and Answer
1. In the electroplating industry, metals other than copper may be released into the
surrounding water. State the names of the metals.
2. Cuprizone is used to form complex with Cu2+ before measurement. Do you think
that Cu2+ can be determined directly without addition of cuprizone? Why?
3. Will the calibration curve change if a Green LED (wavelength of roughly
520–570 nm) is used instead of the yellow one?
References
[1] Canadian Centre for Occupational Health and Safety, Material Safety Data
Sheets: Copper Sulfate Pentahydrate, Hamilton, 2013.
[2] Environmental Protection Department, HKSAR, Water Pollution Control
Ordinance, Chapter 358 Proposed Amendments to the Technical Memorandum
on Effluent Standards, HKSAR, 2001.
[3] E. B. Sandekk, Photometric Determination of Traces Metals, 4th edition; Wiley:
New York, 1989.
21
Experiment 3 – Determination of Sulphur Dioxide (SO2) in Dried
Food Using Optimized Monier-Williams Method
Introduction
Fresh and raw food are limited in supply. Moreover, food is not always consumed
immediately after harvest or slaughter. Food has to be transported from where it is
produced to the consumer. Food spoilage and corresponding prevention is, therefore, a
global concern of human health and economy. Food scientists and technologists are
working hard to find ways to preserve food, so that the food can be stored and
transported without deterioration in quality over a period of time. There are many
preservation techniques, such as heat treatment, irradiation, drying, chilling or
freezing, sugaring, and salting, the use of chemical preservatives is so far the most
common method adopted in the food industry. The basic principle of using chemical
preservatives is to kill microorganisms and to inhibit microbial growth on food items.
One of the common chemical preservatives is sulphur dioxide. Sulphur dioxide is
commonly used to dehydrate and preserve food items because it can also prevent
browning of food and help to preserve the natural colour and flavor during the drying
process. Trace amount of sulphur dioxide is, therefore, found in dried fruits and
vegetables; and the fruit juices and alcoholic beverages made from dried fruits.
Sulphur dioxide (SO2) is a gas produced by the combustion of elemental sulphur. The
gas gives an unpleasant smell similar to rotten eggs. The gas is water soluble resulting
in sulfurous acid (H2SO3). Exposure to high level of sulphur dioxide through
inhalation and ingestion can cause breathing problems, emphysema, and chronic
bronchitis over time. Although the amount of sulphur dioxide in food is not high
enough to give rise to any of these respiratory diseases, individuals who are
hypersensitive to sulphur dioxide may have allergic problems after ingestion. 22

Symptoms include shortness of breath, headache, and nausea. Serious allergic
reactions may even result in death. It is, therefore, necessary to determine the amount
of sulphur dioxide in food.
The determination is one of the important aspects in food analysis of the testing and
certification industry. Standard methods of AOAC Official Method 990.28 and 990.29
are widely used in local commercial testing laboratories. According to the Food and
Drugs (Composition and Labelling) Regulations of the Laws of Hong Kong (Cap
132W), the functional class of sulphur dioxide and the corresponding name shall be
specified in the list of ingredients if a food consists of or contains sulphur dioxide in a
concentration of 10 mg/kg or more. The public, who are concerned with potential
health risks associated with sulphur dioxide in food, should read the food label
carefully prior to consumption of the food.
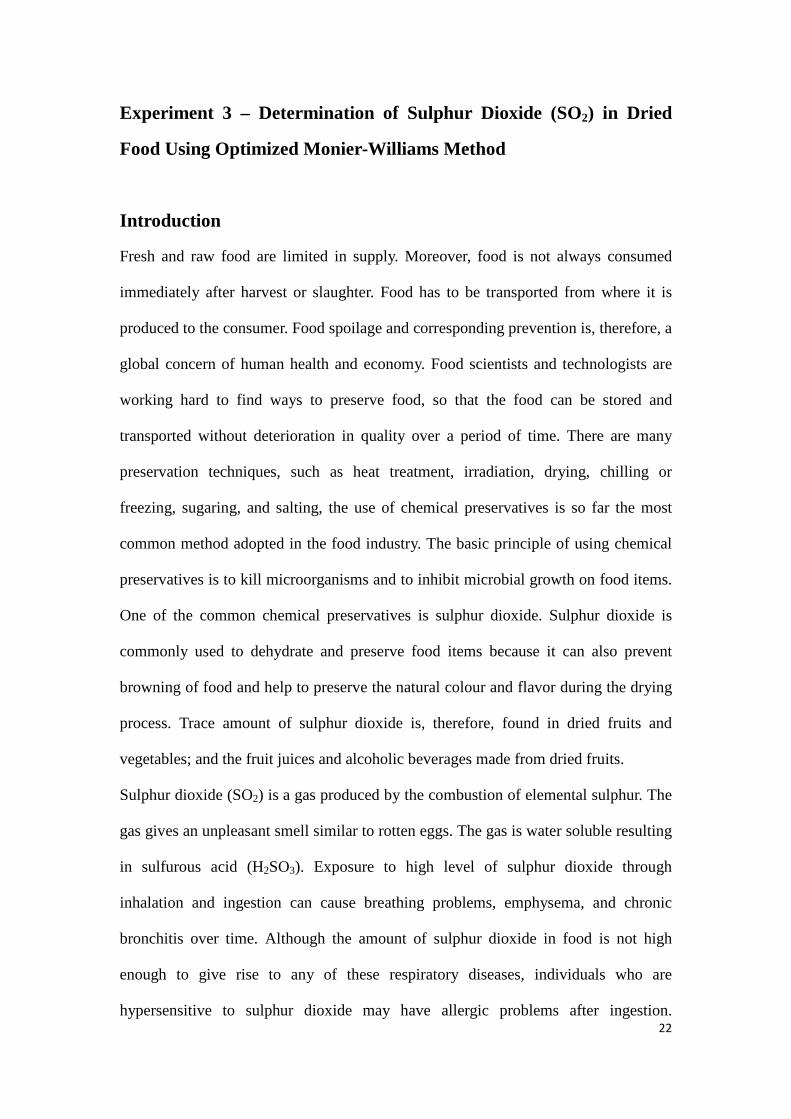
In this experiment, the optimized Monier-Williams method will be used for
quantitative determination of the sulphur dioxide content in dried food. The
determination follows the standard method of AOAC Official Method 990.28. Dried
food is purchased from the local market and is used as real-life sample. The sample is
heated with reflux in a water-ethanol mixture. A stream of air is used to sweep sulphur
dioxide through a condenser via bubbler to the receiver with hydrogen peroxide
solution (H2O2), where sulphur dioxide is oxidized to sulfuric acid. The amount of
sulfuric acid produced is directly proportional to the sulphur dioxide content in the
sample and is determined by titration with pre-standardized sodium hydroxide
solution (NaOH). The principle and the content of this experiment could confer
students with the importance of analytical technique of acid-base titration and
knowledge of sampling and quantifying the sulfur dioxide in real-life sample of dried 23
food using appropriate tests.
Intended Learning Outcomes
After the activity, the student is expected to be able to
1. understand the operation of the testing and certification industry in Hong Kong;
2. isolate sulphur dioxide from dried food using reflux distillation;
3. analyze sulphur dioxide quantitatively using acid-base titration method;
4. acquire the basic concepts of accuracy and precision of analytical methods.
Experimental
Apparatus
1x two necked round bottom flask of 500 mL
1x water condenser
1x still head
1x screw adapter
3x dropper
3x 1 meter long rubber tubing
1x air pump
1x heater
4x conical flask of 250 mL
2x beaker of 250 mL
1x measuring cylinder of 100 mL
1x burette of 50 mL
1x scissors
Reagents and chemicals
20 g dried food sample
Fig. 1. Glass apparatus and air pump.
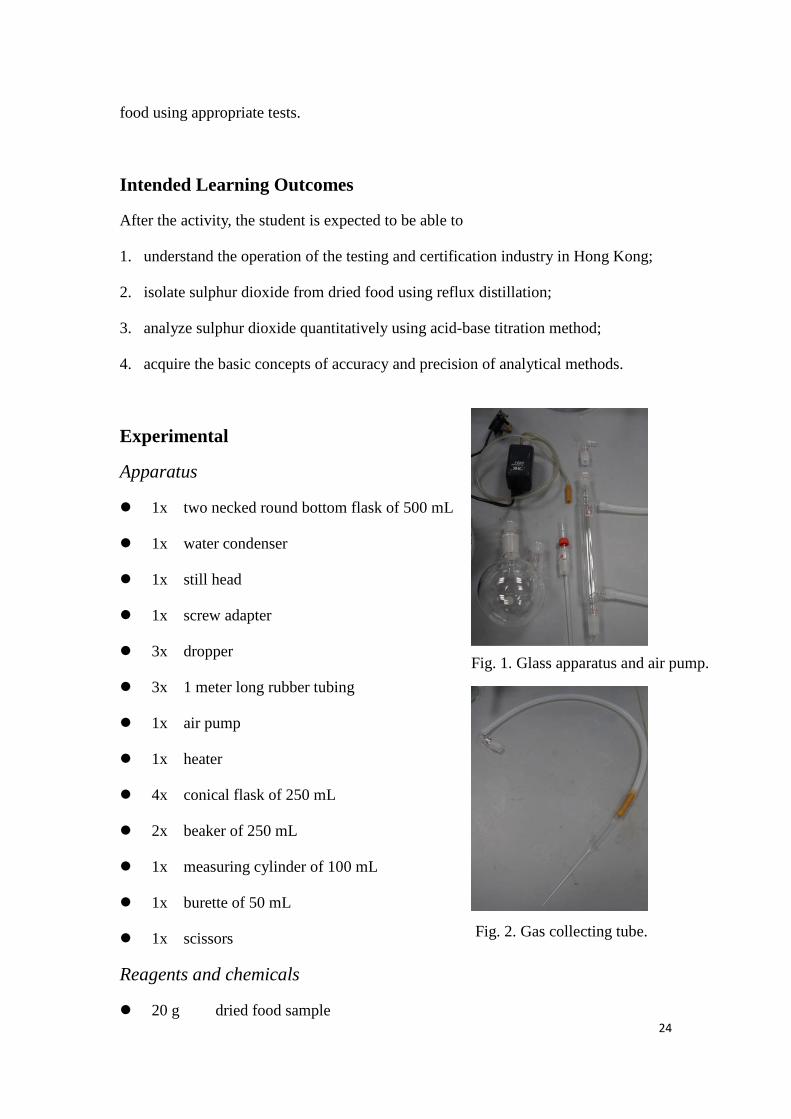
Fig. 2. Gas collecting tube.
24
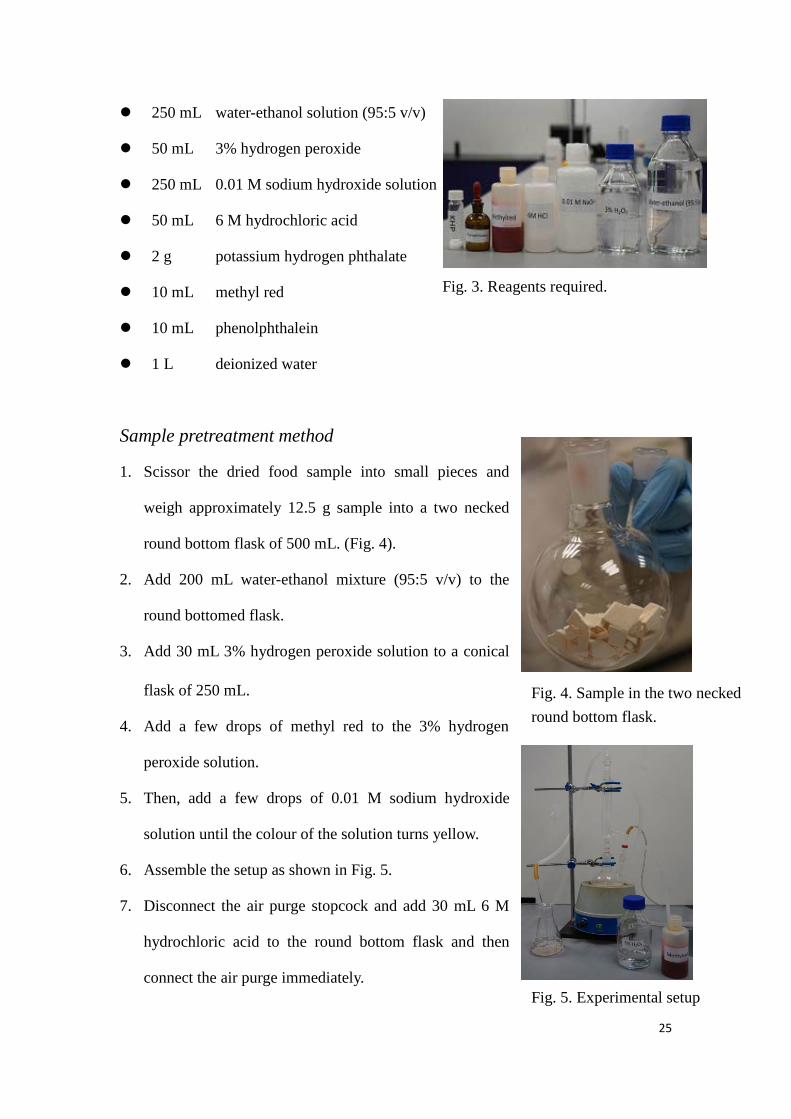
250 mL water-ethanol solution (95:5 v/v)
50 mL 3% hydrogen peroxide
250 mL 0.01 M sodium hydroxide solutio
50 mL 6 M hydrochloric acid
2 g potassium hydrogen phthalate
10 mL methyl red
10 mL phenolphthalein
1 L deionized water
n
Fig. 3. Reagents required.
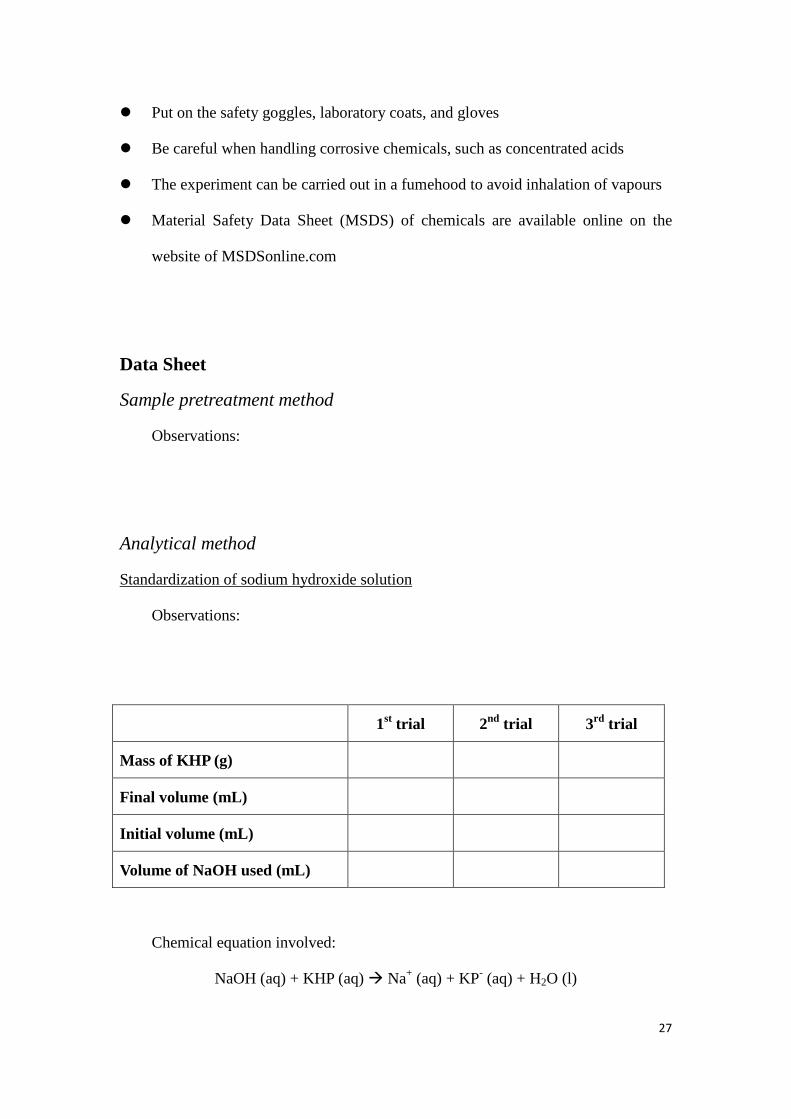
Sample pretreatment method
1. Scissor the dried food sample into small pieces and
weigh approximately 12.5 g sample into a two necked
round bottom flask of 500 mL. (Fig. 4).
2. Add 200 mL water-ethanol mixture (95:5 v/v) to the
round bottomed flask.
3. Add 30 mL 3% hydrogen peroxide solution to a conical
flask of 250 mL.
4. Add a few drops of methyl red to the 3% hydrogen
peroxide solution.
5. Then, add a few drops of 0.01 M sodium hydroxide
solution until the colour of the solution turns yellow.
6. Assemble the setup as shown in Fig. 5.
7. Disconnect the air purge stopcock and add 30 mL 6 M
hydrochloric acid to the round bottom flask and then
connect the air purge immediately.
Fig. 4. Sample in the two necked round bottom flask.
Fig. 5. Experimental setup
25

8. Heat the solution for 100 minutes.
Analytical method
Standardization of sodium hydroxide solution
1. Weigh approximately 0.05 g potassium hydrogen phthalate into a conical flask of
250 mL.
2. Dissolve the potassium hydrogen phthalate using 50 mL deionized water and add
several drops of phenolphthalein.
3. Titrate the solution with 0.01 M sodium hydroxide solution until the solution
changes to permanent faint pink colour.
4. Record the volume of sodium hydroxide solution used and calculate the real
concentration of the sodium hydroxide solution (standardization).
5. Repeat the steps of 1 – 4 two times more in order to obtain the mean and standard
deviation of the real concentration of sodium hydroxide.
Determination of sulphur dioxide content by titration
1. After heating of 45-60 minutes, titrate the 3% hydrogen peroxide solution with the
standardized sodium hydroxide solution until the solution changes to yellow
colour.
2. Record the volume of sodium hydroxide solution used and calculate the sulphur
dioxide content (mg/kg) in the dried food sample.
Safety precaution
Observe the standard safety procedures for laboratory activity 26
Put on the safety goggles, laboratory coats, and gloves
Be careful when handling corrosive chemicals, such as concentrated acids
The experiment can be carried out in a fumehood to avoid inhalation of vapours
Material Safety Data Sheet (MSDS) of chemicals are available online on the
website of MSDSonline.com
Data Sheet
Sample pretreatment method
Observations:
Analytical method
Standardization of sodium hydroxide solution
Observations:
1st trial 2nd trial 3rd trial
Mass of KHP (g)
Final volume (mL)
Initial volume (mL)
Volume of NaOH used (mL)
Chemical equation involved:
NaOH (aq) + KHP (aq) Na+ (aq) + KP- (aq) + H2O (l)
27
1st trial 2nd trial 3rd trial
Number of mole of KHP (mol)
Number of mole of NaOH (mol)
Concentration of NaOH (M)
∴ The real concentration of the sodium hydroxide solution = ± M
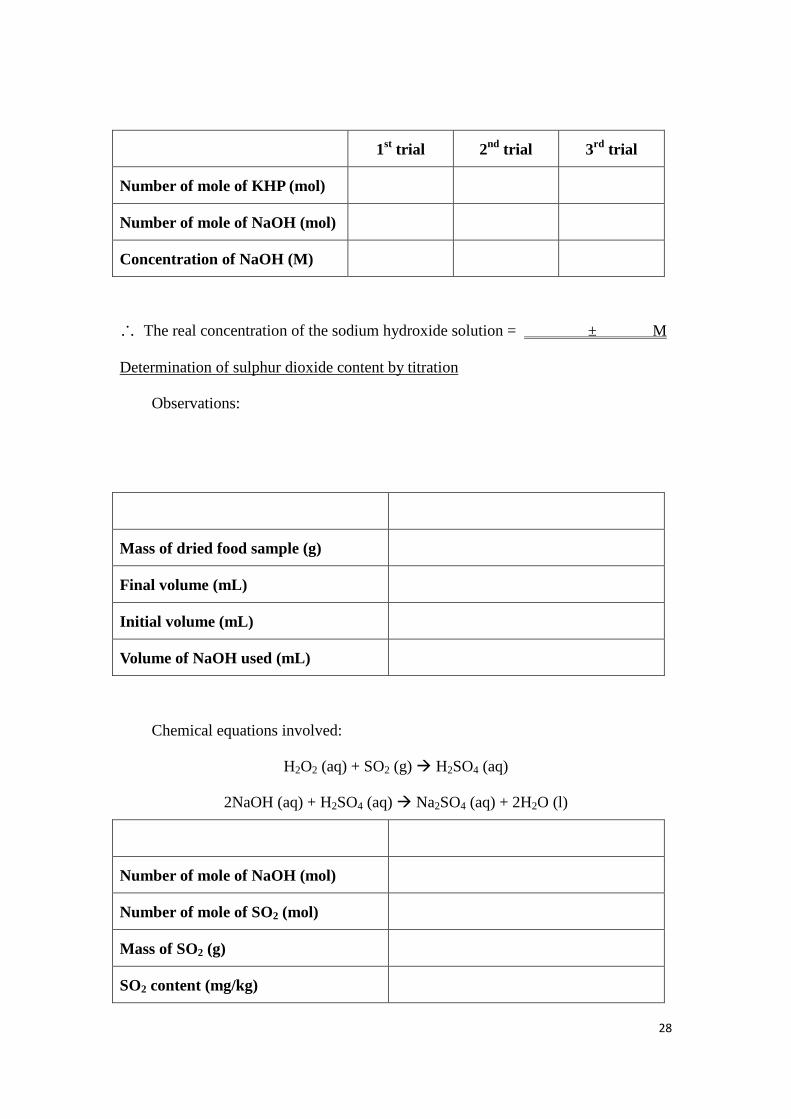
Determination of sulphur dioxide content by titration
Observations:
Mass of dried food sample (g)
Final volume (mL)
Initial volume (mL)
Volume of NaOH used (mL)
Chemical equations involved:
H2O2 (aq) + SO2 (g) H2SO4 (aq)
2NaOH (aq) + H2SO4 (aq) Na2SO4 (aq) + 2H2O (l)
Number of mole of NaOH (mol)
Number of mole of SO2 (mol)
Mass of SO2 (g)
SO2 content (mg/kg)
28

∴ The sulphur dioxide content of = mg/kg
Questions and Answer
1. Sulphur dioxide can act as a preservative in food, but Sulphur dioxide gas itself is
an air pollutant. Suggest an instrumentation method to monitor and measure the
sulphur dioxide content in air.
2. In addition to sulphur dioxide, suggest another chemical that can act as a
preservative in food and state the corresponding harmful effect to human.
3. Propose a method to reduce the amount of sulphur dioxide in food prior to
consume.
4. Name some other chemical preservatives that the testing laboratories can test.
References
[1] AOAC International: Official Methods of Analysis of AOAC (2005), 18th Edition.,
ed. Horwitz W., Gaithersburg: MD, Method 990.28.
[2] AOAC International: Official Methods of Analysis of AOAC (2005), 18th Edition.,
ed. Horwitz W., Gaithersburg: MD, Method 990.29.
[3] The European Standard EN 1988-1: 1998, Foodstuffs – Determination of Sulfite –
Part 1: Optimized Monier-Williams method, British Standards Institution, London.
29

Experiment 4 – Is This Dairy Product Safe? Gold Nanoparticles As A
Visual Detection Tool of Melamine
Introduction
Nanotechnology is the utility of nano-sized materials. We can
nowadays easily find the daily applications of nanotechnolog
in areas such as textiles, food packaging, and sewage treatment
for their unique advantages. Many researches are being carried
out for their potential uses in the biomedical and clinical field.
y
TEM (Transmission Electron Microscopy) image of 13 nm gold nanoparticles. The chemical and physical properties of nanoparticles are very
different from their respective elements in bulk. The physical properties of
nanoparticles, in particular their optical (light absorption and emission) properties, are
highly dependent of their chemical compositions, size, and shape. By controlling the
reaction conditions, nanoparticles can be made into different sizes and morphology
for their unique applications.
Food safety has been gaining substantial attention from the public for years including
those products imported from the surrounding regions. One of the incidents was that
melamine, a non-protein chemical rich in nitrogen, was illegally added into infant
formula to increase its apparent protein content as the dairy industry normally checks
the protein level through tests measuring nitrogen content e.g. the Kjeldahl method.
Excessive intake of melamine causes adverse effects in babies including the formation
of kidney stones. The identification and quantification of melamine then drew
considerable attention in food industry. Dairy products, including pasteurized milk,
formula milk, and chocolates, are monitored for melamine contamination in testing 30

laboratories by chromatographic methods. The quantification of melamine can be
performed by liquid chromatography-mass spectrometry/mass spectrometry
(LC-MS/MS) with the detection limit of several parts-per-million (ppm).
To suit the school environment, here we will adopt a simple and sensitive approach to
detect melamine in milk samples using gold nanoparticles. In this experiment, you
will learn about nanomaterial chemistry and food analysis. Gold nanoparticles of the
size of 13 nm will be prepared by citrate reduction of Au (III) to Au (0). The
as-prepared gold nanoparticle is well-dispersed in water and it gives a clear crimson
colour solution. It will be used as a probe to detect the content of melamine in milk
samples. Prior to the test, the milk samples will be pre-treated to remove the protein
and fat contents. Students will thus learn about precipitation chemistry and will gain
hands-on experience of solid-phase extraction, an important technique widely used in
the testing sector of the testing and certification industry.
In the presence of melamine, the individual gold nanoparticles will be “cross-linked”
by the melamine molecules via hydrogen bonding (each melamine molecule offers
three sites of hydrogen bonding) to form a cluster. This results in an observable colour
change from crimson to purple blue because the solution colour is nanoparticle-size
dependent. The higher the content of melamine the higher the extent of the
aggregation cascade and thus a more significant change in visible colour is expected.
31

Intended Learning Outcomes
After the activity, the student is expected to be able to
1. understand the operation of the testing and certification industry in Hong Kong
and its contribution to food safety;
2. isolate melamine in milk and milk powder using suitable sample pretreatment
methods;
3. acquire the basic concepts of preparation and applications of nanomaterials;
4. understand the development of fast, low-cost, simple yet sensitive technique in
analytical testing.
Experimental
Apparatus
1x 100-1000 μL auto pipette with pipette tubes or 1 mL graduated pipette
1x 10-100 μL auto pipette with pipette tubes or 0.2 mL graduated pipette
1x top pan balance
1x bench top centrifuge of at least 4000 rpm
4x PP centrifuge tube of 10 mL
5x PS cuvette
1x conical flask of 100 mL
1x stirrer hot plate
1x watch glass of 5 cm
1x volumetric flask of 25 mL
2x volumetric flask of 1 L
1x beaker of 100 mL
1x measuring cylinder of 100 mL
1x reagent bottle of 1 L
4x C18 SPE tube 32

Reagents and chemicals
Description Amount
0.1 M HAuCl4 1 mL
38.8 mM sodium citrate 10 mL
10% TCA 10 mL
SPE elution solvent 20 mL
5 mL Chloroform
Procedures
Part 1. Preparation of 13-nm Spherical Gold Nanoparticles (AuNPs)
1. All glassware used are washed with aqua regia (3 parts HCl, 1 part
HNO3) and rinsed with filter Millipore water. The presence of dirt
and grease affects the size of shape of the resulted nanoparticles.
2. The glassware to be used is oven-dried prior to use.
3. Prepare 50.0 mL of 1 mM HAuCl4 by diluting of 500 μL of 0.10 M
HAuCl4 solution in water and boil in a 100 mL conical flask
which is covered with a watch glass (see Fig. 1).
4. When the solution boils, rapidly add 5.0 mL of 38.8 mM sodium
citrate to the stirring solution. Put some ice on the top of the watch
glass to condense hot vapour.
5. Turn off the heater and continue stirring for 15 min., then cool down to room
temperature.
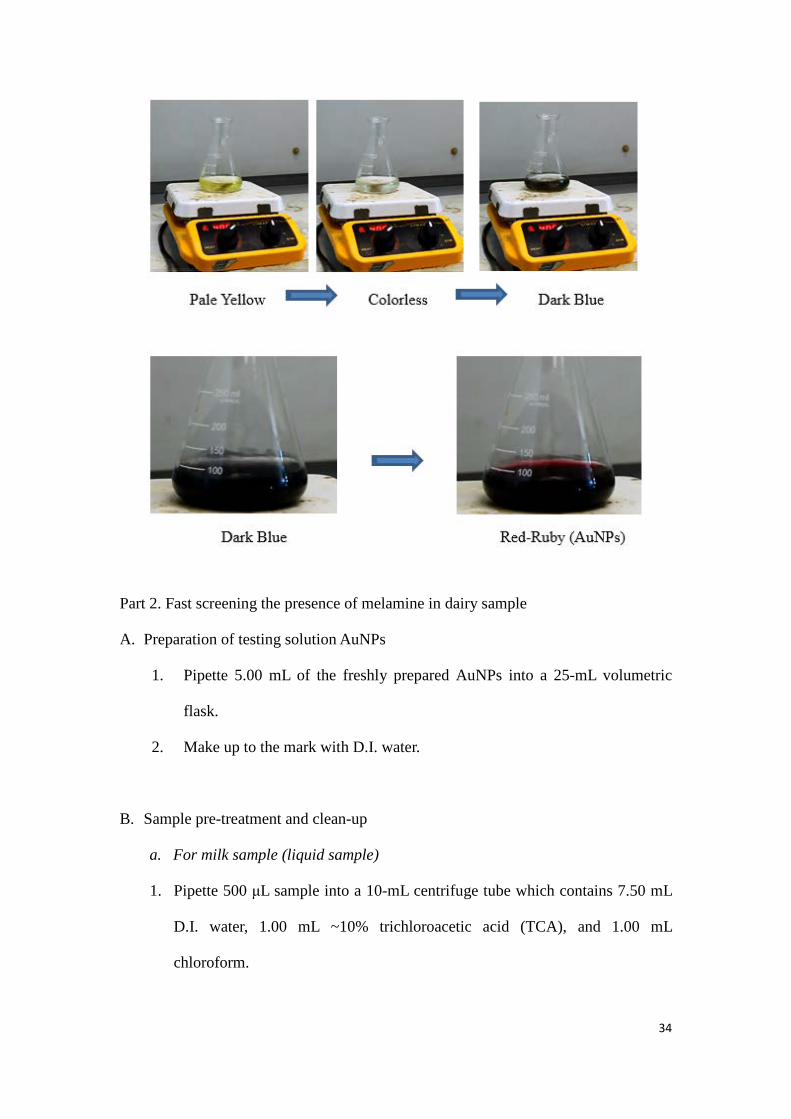
6. This solution of gold nanoparticles will be used in the following experiments as
the probe to melamine in samples. The following colour changes will happen
within one minute.
Fig. 1. Set up for synthesizing 13 nm gold nanoparticles.
33
Part 2. Fast screening the presence of melamine in dairy sample
A. Preparation of testing solution AuNPs
1. Pipette 5.00 mL of the freshly prepared AuNPs into a 25-mL volumetric
flask.
2. Make up to the mark with D.I. water.
B. Sample pre-treatment and clean-up
a. For milk sample (liquid sample)
1. Pipette 500 μL sample into a 10-mL centrifuge tube which contains 7.50 mL
D.I. water, 1.00 mL ~10% trichloroacetic acid (TCA), and 1.00 mL
chloroform.
34

2. The function of TCA and chloroform is to precipitate the proteins and
dissolve the fat existing in the milk sample, respectively.
3. Screw the cap and shake the tube vigorously to ensure the completeness of
the extraction.
4. Repeat step 1.1 & 1.2 for a control sample (free of melamine).
5. Centrifuge the samples and set 4000 rpm for 10 mins. (see Fig. 2).
6. Label the centrifuge tubes according to the data sheet.
Fig. 2. Centrifuge tubes are placed diagonally so that mass is well-balanced.
b. For Milk powder (formula)
1. Mix 0.1 gram milk powder with 1.00 mL D.I. water. Pipette 500 μL sample
into a 10-mL centrifuge tube which contains 7.50 mL D.I. water , 1.00 mL
~10% trichloroacetic acid (TCA), and 1.00 mL chloroform.
2. Screw the cap and shake the vial vigorously.
3. Repeat step 1.1 & 1.2 for a control sample (free of melamine).
4. Centrifuge the samples and set 4000 rpm for 10 mins.
5. Label the centrifuge tubes according to the data sheet.
35

Fig. 3. After the centrifuge treatment, protein is precipitated out from the aqueous
solution.
c. To clean up the supernatant using C18 SPE tube
1. Put a four C18 Solid Phase Extraction (SPE) tubes on the vacuum manifold
and label properly.
2. C18 SPE tube is wetted with 2 mL x 3 acetonitrile and then conditioned with
2 mL x 2 (1:1 acetonitrile/water). 36

3. Supernatant (aqueous portion) is transferred from the centrifuge tube to the
C18 SPE tube.
4. A clean vial is put under the SPE as shown in the above photo.
5. Start the vacuum and open the tap.
6. Collect the filtrate at the clean vial.
7. Step #1 to #4 are repeated for sample # 1 to sample # 3.
In the absence of vacuum manifold, a disposal plastic syringe can be used to
rinse the SPE tube (on the left) and push the supernatant solution through the
SPE tube to be used in subsequent step shown below.
37
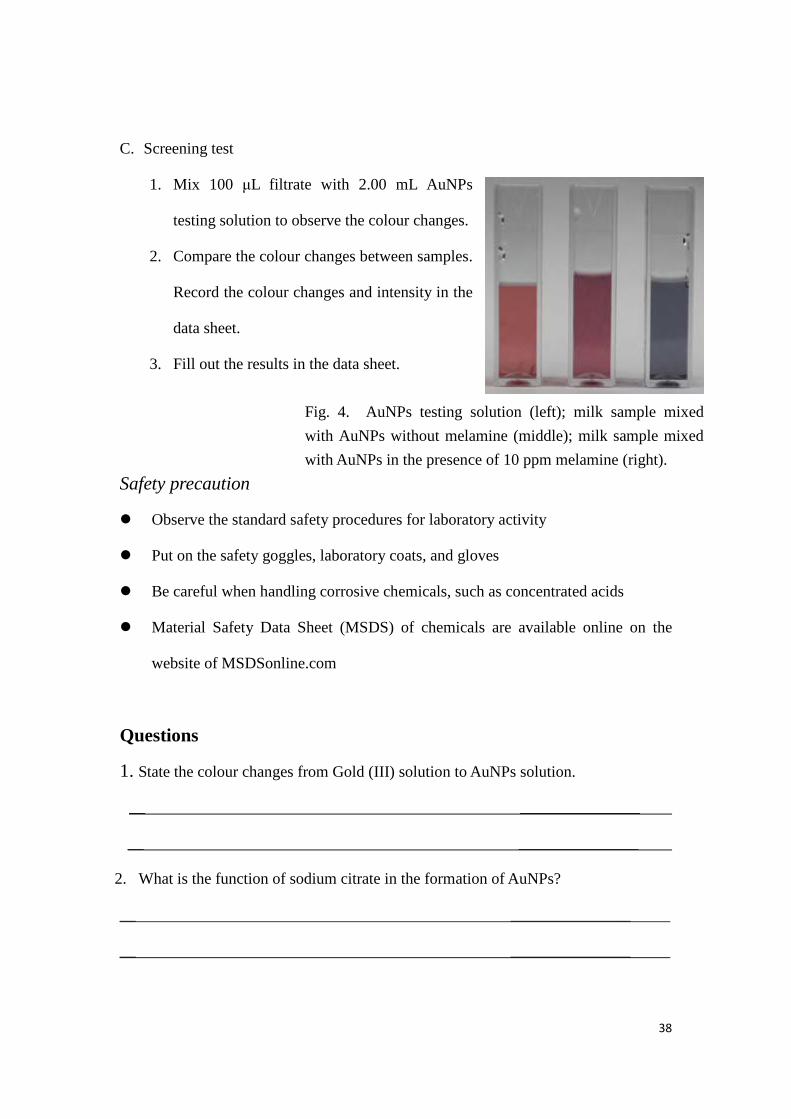
C. Screening test
1. Mix 100 μL filtrate with 2.00 mL AuNPs
testing solution to observe the colour changes.
2. Compare the colour changes between samples.
Record the colour changes and intensity in the
data sheet.
3. Fill out the results in the data sheet.
Fig. 4. AuNPs testing solution (left); milk sample mixed with AuNPs without melamine (middle); milk sample mixed with AuNPs in the presence of 10 ppm melamine (right).
Safety precaution
Observe the standard safety procedures for laboratory activity
Put on the safety goggles, laboratory coats, and gloves
Be careful when handling corrosive chemicals, such as concentrated acids
Material Safety Data Sheet (MSDS) of chemicals are available online on the
website of MSDSonline.com
Questions
1. State the colour changes from Gold (III) solution to AuNPs solution.
__ _______________
__ _______________
2. What is the function of sodium citrate in the formation of AuNPs?
__ _______________
__ _______________
38

3. What is the function of C18 SPE tube?
__ _______________
__ _______________
__ _______________
4. Do you think the use of AuNPs as a probe for melamine in milk samples would
be a good method for melamine analysis?
__ _______________
__ _______________
__ _______________
__ _______________
__ _______________
Sample
#
Name
of
sample
(if any)
Nature
of
sample
Vol. of
sample
added
(mL)
Vol. of
D.I. added
(mL)
Vol. of
10%
TCA
(mL)
Vol. of
CHCl3
(mL)
Colour
Changes/
Positive
Result
positive
or
negative
1 Liquid 0.5 7.50 1.00 1.00
2 Liquid 0.5 7.50 1.00 1.00
3 Solid 0.5* 7.50 1.00 1.00
4 Solid 0.5* 7.50 1.00 1.00
* weigh 0.1 g milk powder with 1.00 mL D.I. water
References
[1] http://www.sgs.com/en/Agriculture-Food/Food/Primary-Production/Testing-
and- Analytical-Services/Melamine-Contamination-Testing.aspx
39
Experiment 5 – Differentiation of Chinese Herb Danshen (丹參) from
Other Similar Herbs Using Facile Test-Tube Scale Chemical Test
Method
Introduction
Every day there are tons of Traditional Chinese Medicine (TCM) materials imported
to Hong Kong. These herbal materials are distributed to thousands of Chinese
medicine stores and sold in different ways. In order to identify these TCMs, a quick
and facile scientific based chemical test has been developed. The approach is based on
the identification of selected characteristic chemical constituents in TCM by test tube
scale chemical reaction. Since a single herb may contain over tens or even hundreds
of chemical components, the chemical functional groups of these compounds may
react with certain specified reagents and produce various colours, precipitates, or
crystals. By making use of the result of reactions, preliminary identification can be
achieved. Facile chemical test involves mainly the observation of test-tube reaction. It
refers to the observation of the expected chemical reactions between the extracted
chemical components in TCM with the appropriate reagents in test tubes.
In our developed identification approach, the first step is to convert solid form TCM
into powder form by blending. Powder form has a larger total surface area which will
reduce the extraction time and increase the extraction efficiency. Then, a suitable
solvent is used to extract the target chemicals like organic chemical components from
the sample, e.g., diethyl ether. In general, the extraction efficiency can also be
increased by increasing the temperature using hot water bath. If the chemicals are
thermally unstable, ultrasonication can be used to improve the extraction yield. After
extraction, centrifuge is used to separate the suspended solid from the solution. By 40

spinning down the solid, the aqueous portion can be transferred to another clean and
empty new tube for further analysis. The changed colour and/or the presence of
particles can be more easily observed.
In order to confirm the results, duplicate analysis for each sample is required. In
addition, a positive control is also required in the experiment. It is used for comparing
any colour or observational changes.
Radix Salviae Maltiorrhizae (Danshen), is an example to illustrate this technique for
differentiation from closely-related herbs. Danshen is the dried root of Salvia
miltiorrhiza, which is listed in the Pharmacopoeia of the People's Republic of China .
It is commonly used for treatingmenstrual disorder and blood circulation problems,
such as cardiovascular diseases. The chemical constituents of Danshen include both
lipophilic and hydrophilic components. The major hydrophilic components are
phenolic acids including danshensu (DSS), protocatechuic aldehyde (PA), rosmarinic
acid (RA), and salvianolic acids, which are also the major pharmacologically active
constituents [1].
Fig. 1. Chemical Structure of Danshensu.
In general, the qualities and quantities of these compounds are analyzed with High
Performance Liquid Chromatography (HPLC) with ultraviolet detector. However, it
will take several hours to even days for the analysis to complete. 41

For the structure of Danshensu as shown in Fig. 1, it contains typical phenolic
functional group. This characteristic group will react with iron (III) to form a green
complex. Since these substances are water soluble, a hot water bath is used to extract
it first and then tested by iron (III) chloride solution [2]. The formation of the dark
green complex indicates the presence of phenolic functionality. This approach has
been widely used in the TCM industry to test products claimed to be Danshen.
Intended Learning Outcomes
After the activity, the student is expected to be able to
1. understand the operation of the testing and certification industry in Hong Kong
and how it contributes to TCM development;
2. understand that modern techniques can be applied to TCM analysis;
3. isolate the chemical component in TCM using solvent extraction;
4. analyze the chosen analytes qualitatively using colour test.
Experimental
Apparatus
1x beaker of 50 mL
1x beaker of 1000 mL
1x beaker of 250 mL
1x volumetric flask of 100 mL
8x test tube
8x centrifuge tube of 15 mL
1x 100 – 1000 μL auto-pipette with pipette tubes or 1 mL graduated pipette
1x hot plate
1x centrifuge 42
1x spatula
1x balance
Reagents and chemicals 1,2-dihydroxybenzene
Iron (III) chloride
Deionized water
Lab preparation
1. Dissolve 0.33 g of iron (III) chloride hexahydrate (FeCl3 .6H2O) in 10 mL of D.I.
water in a 50 mL beaker.
2. Dissolve 0.05 g of 1,2-dihydroxybenzene in 50 mL D.I. water and then dilute to
the mark of a 100 mL volumetric flask as 500 ppm standard solution.
3. Purchase a Danshen sample (around 30 g) from a local store. Use a blender to
breakdown the solid samples into powder form.
Sample pretreatment and Analytical methods
1. Compare the appearance of the samples.
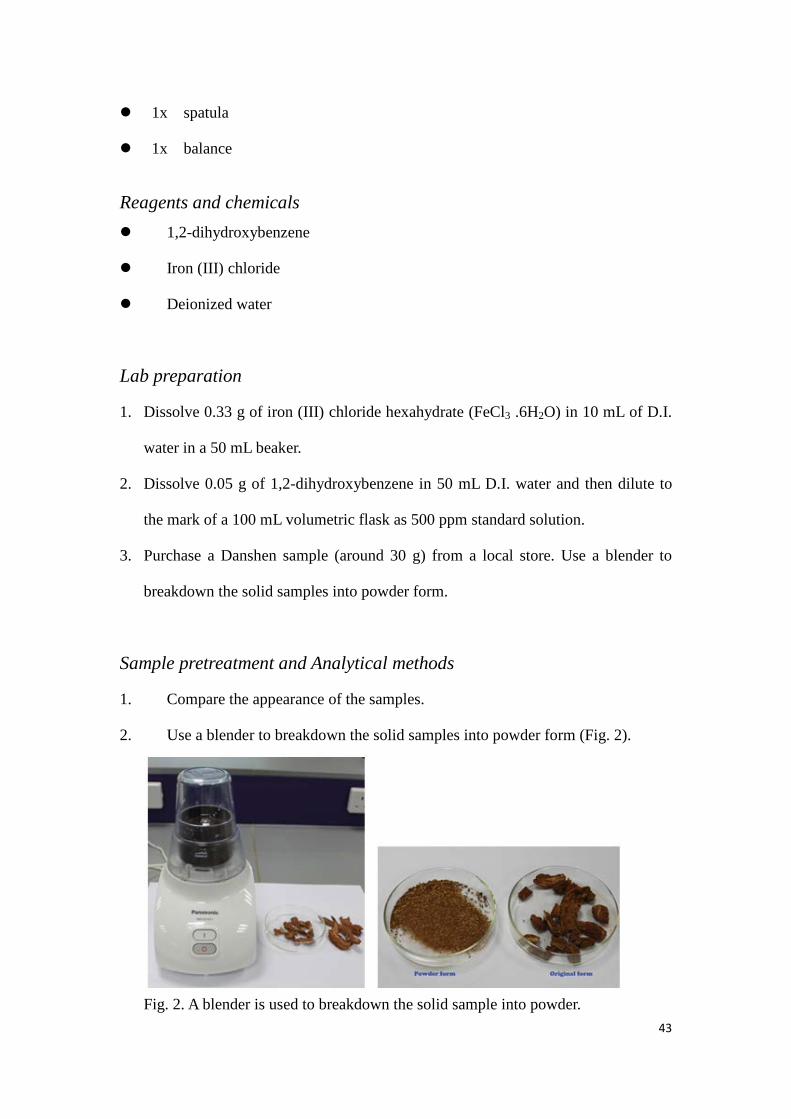
2. Use a blender to breakdown the solid samples into powder form (Fig. 2).
Fig. 2. A blender is used to breakdown the solid sample into powder.
43
3. 0.1 g of powdered sample is mixed with 4 mL of D.I. water in centrifuge
tubes.
4. Heat the mixture in a water bath for 15 min and then cool down.
5. Use centrifuge to spin down the solid sample.
6. Transfer 1 mL of the supernatant to a new test tube.
7. Add 0.1 mL of FeCl3 indicator solution to each test tube.
8. Record the colour change of each test tube.
Safety precaution
Observe the standard safety procedures for laboratory activity
Put on the safety goggles, laboratory coats, and gloves
Be careful when handling hot water and hot plate
Material Safety Data Sheet (MSDS) of chemicals are available online on the
website of MSDSonline.com
44

Data Sheet
Morphological appearance
Sample A Sample B Sample C
Shape
Colour
Colour of
powder form
Color of the extracted solution
Test tube Content Colour
1 D.I. water
2 Sample A (trial 1)
3 Sample A (trial 2)
4 Sample B (trial 1)
5 Sample B (trial 2)
6 Sample C (trial 1)
7 Sample C (trial 2)
8 Chemical standard
Colour of the extracted solution mixed with 0.1 mL FeCl3 solution
Test tube Content Colour
1 D.I. water
2 Sample A (trial 1)
3 Sample A (trial 2)
4 Sample B (trial 1)
5 Sample B (trial 2)
6 Sample C (trial 1)
7 Sample C (trial 2)
8 Chemical standard
45

Questions and Answer
1. Why is a blender used to pretreat the sample?
2. Suggest another method to extract the water soluble chemicals from Danshen.
3. Why do we need a control test (D.I. water only)?
4. Why do we need to duplicate the experiment?
5. After mixing with FeCl3 solution, explain the difference in observed colour
change between samples and chemical standard.
6. Does Hong Kong has official standards of TCM (中藥材)? Can the standards
serve the purpose of identifying whether a TCM is Danshen? (Hint : Find out
about "Chinese Materia Medica" on the website of the Department of Health)
References
[1] Jin-zhong XU, Jie SHEN, Yi-yu CHENG, Hai-bin QU, Journal of Zhejiang
University SCIENCE B, ISSN 1673-1581 (Print); ISSN 1862-1783 (Online).
[2] www.cmd.gov.hk/hkcmms/vol1/Docs/radix_salviae_miltiorrhizae.pdf
46
Experiment 6 – Determination of Vitamin C in Commercial Sample
of Fresh Fruit Juice by Iodometric Titration
Introduction
Vitamin C (L-ascorbic acid) is essential to our health. A high level of vitamin C is
naturally found in citrus fruits and berries; while vegetables and edible animal internal
organs such as liver and kidney contain lower levels of vitamin C. The human body is
unable to synthesize vitamin C on its own and must depend on diet intake for an
adequate supply. Nowadays, caplets, tablets, capsules, drink mix packets containing
vitamin C as dietary supplement are available in the market. It is recommended from
The National Academy of Sciences for a daily consumption of 60 mg vitamin C in
order to meet the nutritional requirements of a healthy individual.
Vitamin C plays an important role in immune function. Insufficient vitamin C causes
muscles weakness, swollen and bleeding of gums, loss of teeth and bleeding under the
skin as well as tiredness and depression.
There are many methods that can be applied to determine vitamin C in fruits or
vitamin supplement. Herein iodometric titration is applied to determine the amount of
vitamin C in either fresh fruits or dietary supplement in tablet form. Since iodine is
not a primary standard, it can be generated by mixing acidified iodate solution with
iodide ions (1). The solubility of iodine is increased by complexation with iodide to
form triiodide (2). Triiodide then oxidizes vitamin C to dehydroascorbic acid (3). The
fast reaction reconverts iodine to iodide immediately when it is generated. When the
limiting agent vitamin C is exhausted, the remaining iodine forms a dark blue
complex with starch.
47

Intended Learning Outcomes
After the activity, the student is expected to be able to
1. understand the operation of the testing and certification industry in Hong Kong;
2. isolate vitamin C from fresh fruit samples using suitable sampling techniques;
3. analyze vitamin C quantitatively using iodometric titration method;
4. acquire the basic concepts of accuracy and precision of analytical methods.
Experimental
Apparatus
1x burette of 50 mL
1x burette clamp
1x stand
2x pipettes of 25 mL
1x measuring cylinder of 100 mL
2x beakers of 600 mL
1x beaker of 1 L
2x conical flasks of 250 mL
2x volumetric flasks of 250 mL
48
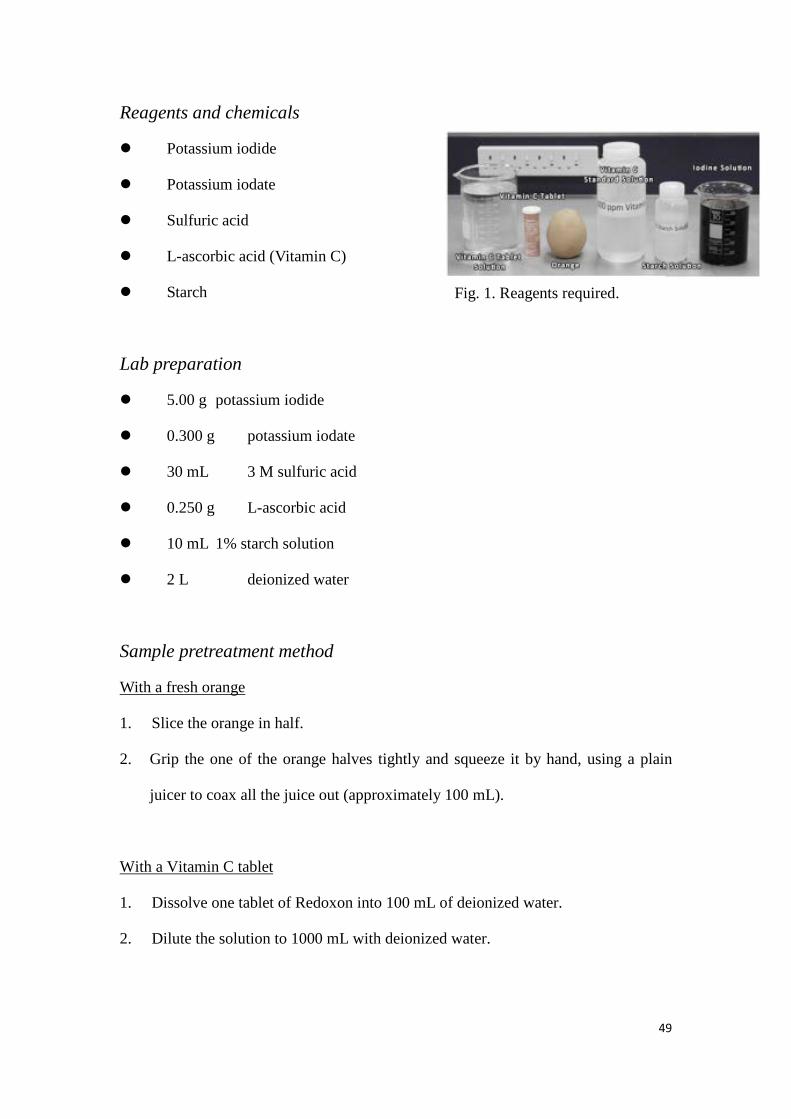
Reagents and chemicals
Potassium iodide
Potassium iodate
Sulfuric acid
L-ascorbic acid (Vitamin C)
Starch
Fig. 1. Reagents required.
Lab preparation
5.00 g potassium iodide
0.300 g potassium iodate
30 mL 3 M sulfuric acid
0.250 g L-ascorbic acid
10 mL 1% starch solution
2 L deionized water
Sample pretreatment method
With a fresh orange
1. Slice the orange in half.
2. Grip the one of the orange halves tightly and squeeze it by hand, using a plain
juicer to coax all the juice out (approximately 100 mL).
With a Vitamin C tablet
1. Dissolve one tablet of Redoxon into 100 mL of deionized water.
2. Dilute the solution to 1000 mL with deionized water.
49

Analytical method
Preparation of 0.01 M iodine solution
1. Weight approximately 5.00 g potassium iodide and 290 mg potassium iodate into
a 600 mL beaker.
2. Add 200 mL deionized water to dissolve the mixture.
3. Add 30 mL of 3 M sulfuric acid.
4. Add 270 mL deionized water to the mixture.
Preparation of 1000 ppm vitamin C standard solution
1. Dissolve 0.250 g vitamin C in 100 mL deionized water.
2. Dilute to volume in a 250 mL volumetric flask.
Standardization of the iodine solution with the vitamin C standard solution
1. Pipette 25.00 mL of vitamin C solution into a conical flask of 250 mL and add
several drops of 1 % starch solution.
2. Titrate the solution with iodine solution until the solution mixture changes to
permanent blue colour.
3. Record the volume of iodine solution used and calculate the real concentration of
the iodine solution (standardization).
4. Repeat the steps of 1 – 3 two times more in order to obtain the mean and
standard deviation of the real concentration of iodine solution.
50

Determination of vitamin C content in tablet by titration
1. Dissolve one vitamin C tablet into 1000 mL deionized water in a 1 L beaker.
2. Pipette 25 mL of the resulted vitamin C solution into a conical flask of 250 mL
and several drops of 1 % starch solution.
3. Titrate the solution with the standardized iodine solution until the solution
mixture changes to permanent blue colour.
4. Repeat the steps of 1 – 3 two times more.
Determination of vitamin C content in fresh fruits by titration
1. Measure 25 mL freshly squeezed juice by a measuring cylinder of 100 mL and
transfer it to a conical flask of 250 mL.
2. Add several drops of 1 % starch solution and titrate the solution with iodine
solution until the endpoint is reached.
3. Repeat the steps of 1 – 2 two times more.
Safety precaution
Observe the standard safety procedures for laboratory activity
Put on the safety goggles, laboratory coats, and gloves
Be careful when handling corrosive chemicals, such as concentrated acids
Be careful when cutting the fruit with a knife
Material Safety Data Sheet (MSDS) of chemicals are available online on the
website of MSDSonline.com
51

Data Sheet
Weight of potassium iodide = g
Weight of potassium iodate = g
Weight of pure vitamin C = g
Total volume of the freshly squeezed juice = mL
Standardization of the iodine solution with the vitamin C standard solution.
Trial 1 Trial 2 Trial 3
Initial burette reading (mL)
Final burette reading (mL)
Volume of iodine solution used (mL)
The number of moles of ascorbic acid used in each trial = mol
The average volume of iodine solution used = mL
∴The real concentration of the iodine solution = M
Titration of vitamin C tablet solution.
Trial 1 Trial 2 Trial 3
Initial burette reading (mL)
Final burette reading (mL)
Volume of iodine solution used (mL)
The average volume of iodine solution used = mL
The average number of moles of iodine used = mol
52

The average number of moles of vitamin C = mol
The mass of vitamin C content determined (mg) = mg
∴ The vitamin C content of tablet (ppm) = ppm per tablet
Titration of fresh fruit juice.
Trial 1 Trial 2 Trial 3
Initial burette reading (mL)
Final burette reading (mL)
Volume of iodine solution used (mL)
The average volume of iodine solution used = mL
The average number of moles of iodine used = mol
The average number of moles of vitamin C = mol
The mass of vitamin C content (mg) = mg
∴ The vitamin C content of fresh fruit juice (mg) = mg
Questions and Answer
1. How much vitamin C is there in a vitamin C tablet (mg)? Does the value agree
with the label?
2. Is the selected fruit a good source of vitamin C? Explain.
3. Suggest another method that can be used to determine vitamin C.
4. Is vitamin C required to be identified on the nutrition labels for foods sold in
53

Hong Kong? Do you think Hong Kong's commercial testing laboratories can test
for all the items on the nutrition label?
References
[1] AOAC international: Official Methods of Analysis of AOAC (2005), 18th Edition.,
ed. Horwitz W., Gaithersburg: MD, Method 967.21.
[2] AOAC international: Official Methods of Analysis of AOAC (2005), 18th Edition.,
ed. Horwitz W., Gaithersburg: MD, Method 967.22.
[3] The European Standard EN 14130: 2003, Foodstuffs - Determination of vitamin
C by HPLC, British Standards Institution, London.
[4] GL-CO-33 method accessed from
http://www.itc.gov.hk/en/quality/hkas/doc/scopes/001.pdf
54


