Structure and Dynamics of Discotic Liquid Crystals in the Bulk and in the Confined State
vorgelegt vonDipl.-Phys.
Christina Krausegeboren in Bergen/Rügen
Von der Fakultät II - Mathematik und Naturwissenschaftender Technischen Universität Berlin
zur Erlangung des akademischen GradesDoktor der Naturwissenschaften
Dr. rer. nat.
genehmigte Dissertation
Promotionsauschuss:
Vorsitzender: Prof. Dr. Reinhard Schomäcker Gutachter: Prof. Dr. Andreas SchönhalsGutachter: Prof. Dr. Regine v. KlitzingGutachter: Prof. Dr. Mario Beiner
Tag der wissenschaftlichen Aussprache: 01. Juni 2015
Berlin 2016

Contents
Contents
1 Abstract 5
2 Inhaltsübersicht 9
3 Motivation 13
4 Introduction 154.1 Rod-like Liquid Crystals and Discotic Liquid Crystals (DLCs) . . . . . . 154.2 The Glass Transition . . . . . . . . . . . . . . . . . . . . . . . . . . . . . . 194.3 The Boson Peak . . . . . . . . . . . . . . . . . . . . . . . . . . . . . . . . . 244.4 The Effect of Confinement on Arrangement and Phase Transitions . . . 27
5 Experimental Part 295.1 Materials . . . . . . . . . . . . . . . . . . . . . . . . . . . . . . . . . . . . . . 29
5.1.1 Discotic Liquid Crystals . . . . . . . . . . . . . . . . . . . . . . . . 295.1.2 Confining Hosts . . . . . . . . . . . . . . . . . . . . . . . . . . . . . 31
5.2 Preparation of the Confined Samples . . . . . . . . . . . . . . . . . . . . . 325.3 Experimental Techniques . . . . . . . . . . . . . . . . . . . . . . . . . . . . 36
5.3.1 Conventional Differential Scanning Calorimetry . . . . . . . . . . 365.3.2 Dielectric Relaxation Spectroscopy . . . . . . . . . . . . . . . . . . 365.3.3 Specific Heat Spectroscopy . . . . . . . . . . . . . . . . . . . . . . . 415.3.4 X-ray Scattering . . . . . . . . . . . . . . . . . . . . . . . . . . . . . 425.3.5 Neutron Scattering . . . . . . . . . . . . . . . . . . . . . . . . . . . 45
6 Results and Discussion 516.1 Py4CEH-a Pyrene-based Discotic Liquid Crystal . . . . . . . . . . . . . . 51
6.1.1 Thermal behaviour . . . . . . . . . . . . . . . . . . . . . . . . . . . 516.1.2 Molecular Dynamics in the Bulk . . . . . . . . . . . . . . . . . . . 536.1.3 Phase Transitions under Confinement . . . . . . . . . . . . . . . . 636.1.4 Molecular Dynamics under Confinement . . . . . . . . . . . . . . 70
6.2 Triphenylene-based Discotic Liquid Crystals-Hexakis(n-alkyloxy)triphenylene(HATn) . . . . . . . . . . . . . . . . . . . . . . . . . . . . . . . . . . . . . . . 756.2.1 Phase Transitions in the Bulk . . . . . . . . . . . . . . . . . . . . . 756.2.2 Structure in the Different Phases . . . . . . . . . . . . . . . . . . . 776.2.3 Influence of Confinement on the Phase Behavior . . . . . . . . . . 836.2.4 Molecular Dynamics in Dependence of the Chain Length . . . . 966.2.5 Vibrational Density of States (VDOS) in Dependence on the
Chain Length . . . . . . . . . . . . . . . . . . . . . . . . . . . . . . 1056.2.6 Vibrational Density of States (VDOS) under Confinement . . . . 110
1
Nomenclature
6.2.7 Mean Squared Displacement in Dependence on the Chain Length 1156.2.8 Mean Squared Displacement in the Bulk and in the Confined State118
6.3 Triphenylenebased Discotic Liquid Crystals-Hexakis(n-alkanoyloxy)triphenylene(HOTn) . . . . . . . . . . . . . . . . . . . . . . . . . . . . . . . . . . . . . . 1226.3.1 Structure and Phase Transistions in the bulk . . . . . . . . . . . . 1226.3.2 Structure in the Different phases . . . . . . . . . . . . . . . . . . . 1266.3.3 Molecular Dynamics in Dependence on the Chain Length . . . . 1296.3.4 Vibrational density (VDOS) in Dependence on the Chain Length 1346.3.5 Mean Squared Displacement in Dependence on the Chain Length 136
7 Summary 139
8 Publications 1438.1 List of Peer-Reviewed Publications . . . . . . . . . . . . . . . . . . . . . . 1438.2 List of Talks . . . . . . . . . . . . . . . . . . . . . . . . . . . . . . . . . . . . 1448.3 List of Posters . . . . . . . . . . . . . . . . . . . . . . . . . . . . . . . . . . 144
9 List of Abbreviations, Symbols and Constants 145
References 147
List of Figures 156
2
Nomenclature
Acknowledgements
First and foremost, I would like to express my sincere gratitude to Prof. Dr. Andreas
Schönhals for giving me the opportunity to carry out my Ph.D. study on this challeng-
ing and fascinating research topic. His encouragement, support, guidance and patience
throughout these few years, helped me not only to successfully complete this thesis but
also to develop my scientific knowledge, skills and attitude. I also want to acknowledge
the financial support from the German Science Foundation (DFG SCHO-470/20-1).
I would like to thank Prof. Dr. Regine von Klitzing (Technische Universität Berlin) for
being my supervisor at the university and many valuable comments and suggestions.
Furthermore I would like to thank Dr. Bernhard Frick (Institut Laue-Langevin Greno-
ble) and especially PD Dr. Reiner Zorn (Forschungszentrum Jülich) for the extensive
help with the Neutron Scattering experiments, analyis of the hereby obtained data
and many fruitful discussions. Also I would like to thank the Institute Laue-Langevin
Grenoble and the Heinz Maier-Leibnitz Centre for enabling the Neutron Scattering
measurements.
Moreover I would like to thank Prof. Dr. Christoph Schick (Universität Rostock)
and Dr. Andreas Wurm (Universität Rostock) for the experimental assistance in the
TMDSC measurements and discussion on the results.
I would like to thank Dr. Huajie Yin for his help with the AC measurements.
I would also like to thank Dr. Franziska Emmerling and Simone Rolf for the assistance
with X-ray Scattering.
Dietmar Neubert is thanked for his help in the DSC measurements. Furthermore I
would like to thank Christiane Weimann and Sigrid Benemann for the REM pictures
and Dr. Jana Falkenhagen for the MALDI-TOF measurements.
I would also like to thank Professor Dr. Patrick Huber (Universität Hamburg Harburg)
and Dr. Denis Morineau (Université de Rennes) for many inspiring discussions within
the TEMPLDISCO-Project. Furthermore I want to thank Prof. Dr. Mario Beiner
(Universität Halle) for taking over the duty to review my thesis.
I would like to thank all my fellow colleagues at BAM. I appreciate the scientific
help and support from Purv Purohit, Jing Leng, Sherif Madkour, Shereena Said, Alaa
Fahmy Mohamed, Farooq Muhammad and Marieke Füllbrandt. I also would like to
thank Korinna Altmann, Anne Bartel and Frank Milcewski for laughter, breaks as well
as for coffee or green tea whenever I needed it.
I would like to thank my friends, especially Susanne Scholz, Isabelle Fischer and Miriam
Burgauner, for encouragement and moral support.
Most importantly I am extremely grateful to my mother Martina Steger for always
3

Nomenclature
believing in me and her encouragement throughout my life. Her patience, support and
love helped me achieve my goals.
4
1 Abstract
In the course of this work, in order to gain more insight into the structure and dynamics
of discotic liquid crystals (DLCs), selected DLCs in the bulk were investigated in detail:
It was decided to concentrate on the following materials:
1. Pyrene-based discotic liquid crystal (DLC) pyrene-1,3,6,8-tetracarboxylic tetra(2-
ethylhexyl)ester (Py4CEH)
2. Several Hexakis(n-alkoxy)triphenylene (HATn, n=5,6,8,10,12)
3. Several Hexakis(n-alkanoyloxy)triphenylene (HOTn, n=6,8,10,12)
Different techniques were applied such as Differential Scanning Calorimetry, X-ray
Scattering, Dielectric Relaxation Spectroscopy and Neutron Scattering. Furthermore
the impact of confinement on the phase transitions and dynamics for DLCs, Py4CEH
and several HATn (n=5, 6, 10, 12), as an example were studied.
The structure of the HATn and HOTn materials was investigated by differential scan-
ning calorimetry and X-ray Scattering dependent on the length of the aliphatic side
chain. All studied HATn materials have a plastic crystalline phase at low temperatures,
followed by a hexagonally ordered liquid crystalline phase at higher temperatures and
a quasi isotropic phase at even higher temperatures. The X-ray Scattering pattern
in the liquid crystalline phase for all HATn materials showed a sharp Bragg reflection
corresponding to the intracolumnar distance in the lower q-range. Moreover a peak at
higher q-values, linked to the intracolumnar distances between the cores perpendicular
to the columns as well as a broad amorphous halo, related to the disordered structure
of the methylene groups in the side chains in the higher q-range were seen. The in-
tercolumnar distance increases linearly with increasing chain length for the hexagonal
columnar ordered liquid crystalline phase. A similar behaviour is assumed for the plas-
tic crystalline phase.
A comparable structure is obtained for the HOTn materials where the intercolumnar
distance increases linearly with increasing n. However the data obtained by differential
scanning calorimetry revealed several plastic crystalline as well as liquid crystalline
phases indicated by additional peaks in the heat flow.
The phase transitions of HATn (n=5, 6, 10, 12) and Py4CEH embedded to nanoporous
5
1 Abstract
aluminum membranes with different pore sizes were studied by differential scanning
calorimetry. In confinement the two phase transitions of the bulk were also observed
down to the smallest pore size. In addition two different phase structures close to the
wall and in the pore center were identified by two peaks in the heat flow for the phase
transition for the first time. Whereas the temperature of the former is more or less
independent of the pore size, the linear decrease of the latter with decreasing pore
size can be described by means of the Gibbs-Thomson equation. The decrease in the
transition enthalpies for both phase transitions with decreasing pore size implies an
increase in the amount of disordered material inside the pores. A critical pore size for
phase transformations was estimated from the pore size dependence of the transition
enthalpies. This procedure was applied to the phase transition of the material in the
pore center as well as to the phase transition of the complete material inside the pores.
Therefore one can estimate the thickness of the surface layer close to the wall. Alter-
natively, the thickness of the surface layer can be approximated in the framework of a
surface layer model.
The molecular dynamics of Py4CEH was investigated by dielectric relaxation and spe-
cific heat spectroscopy. Dielectric spectroscopy shows three processes, a β-relaxation at
low temperatures, an α-relaxation in the temperature range of the mesophases followed
by conductivity. The dielectric α-relaxation is attributed to a restricted glassy dynam-
ics in the plastic crystal as well as in the liquid crystalline phase. The observed different
Vogel-Fulcher-Tammann laws (different Vogel temperature and fragility) are linked to
the different restrictions of the dipolar fluctuations in the corresponding phases. By
specific heat spectroscopy glassy dynamics was detected also in the plastic crystalline
phase but with a quite different temperature dependence of the relaxation times in
comparison to the results from dielectric spectroscopy. This is discussed considering
the different aspects of the glass transition sensed by the different methods. In the
frame of the fluctuation approach, a correlation length of glassy dynamics is calcu-
lated, which corresponds to the core-core distance estimated by X-ray Scattering.
For Py4CEH an α-relaxation was also investigated in confinement. At the phase transi-
tion the temperature dependence of the relaxation rates changes from which a dielectric
phase transition temperature can be extracted. For temperatures above and below the
phase transition the temperature of the relaxation rate can be approximated by an
Arrhenius equation. The pore size dependence of the estimated apparent activation
energies is ascribed to the interplay between pore size and interaction effects. The co-
operative nature of the underlying molecular dynamics is indicated by the occurrence
of the well-known compensation law.
For all HATn materials three processes can be identified, a β-relaxation at low tem-
peratures, an α-relaxation at higher temperatures and a conductivity process in the
6
“isotropic” phase. The activation energy for the β-relaxation first decreases with in-
creasing n until it increases again and approaches the value found for polyethylene. The
temperature dependence of the α-relaxation changes with increasing chain length from
an Arrhenius type temperature dependence to a polyethylene-like behaviour. Both
results are explained in the framework of a self-organized confinement of the columns
with respect to the alkyl chains. With increasing chain length and therefore increasing
intercolumbar distance the confinement is weakened and released.
Conductivity and β-relaxation were observed for all HOTn under study, however an
α-relaxation was found only for HOT6. The former are described by means of the
Arrhenius equation yielding similar results to HATn, while for the later the curvature
changes from an Arrhenius to a VFT-like behavior with decreasing temperature. This
behavior is characteristic for molecular dynamics under nanoscale confinement. This is
discussed considering the structure of HOT6 and the Cooparativity Approach to glassy
dynamics.
Neutron scattering was employed to investigate the vibrational density of states (VDOS)
for all HATn and all HOTn DLCs. All HATn materials with the exception of HAT8
and all HOTn materials under study exhibit excess contributions to the VDOS which
are called Boson peak. For the HATn materials with increasing chain length, the fre-
quency of the Boson peak decreases and its intensity increases. This can be explained
by a self-organized confinement model. For the HOTn materials, the behavior appears
similar to the HATn materials, however they show an additional fine structure.
For HAT6 confined to the pores of alumina oxide membranes with different pore sizes,
a Boson Peak was observed similar to the bulk. The Boson Peak gains in intensity
and shifts to lower frequencies with decreasing pore diameter. This is discussed in the
framework of a softening of HAT6 induced by the confinement due to a less developed
plastic crystalline state inside the pores compared to the bulk.
Elastic scans were carried out for all HATn and HOTn materials in the bulk as well as
for HAT6 confined to three different pore sizes to monitor the molecular dynamics on
a time scale of nanoseconds. For all HAT materials a comparable molecular dynam-
ics is detected in the plastic crystalline phase whereas the mean-squared displacement
is small compared to the intercolumnar distance. In the liquid crystalline phase the
mean-squared displacement is in the order of the intercolumnar distance and increases
with increasing length of the side chain, because of the release of the self-organized
confinement. The HOT materials show a similar behavior. For HAT6 in confinement
the mean-squared displacement increases in the plastic crystalline phase with decreas-
ing pore size implying a boundary layer. In the liquid crystalline and isotropic phase
the mean-squared displacement is reduced.
7

1 Abstract
8
2 Inhaltsübersicht
Um mehr Einblick in die Struktur und Dynamik von diskotischen Flüssigkristallen
zu erlangen, wurden im Verlauf dieser Arbeit ausgewählte Diskoten im Detail unter-
sucht:
1. Pyrene-1,3,6,8-tetracarboxylic tetra(2-ethylhexyl)ester (Py4CEH)
2. Hexakis(n-alkoxy)triphenylene (HATn, n=5,6,8,10,12)
3. Hexakis(n-alkanoyloxy)triphenylene (HOTn, n=6,8,10,12)
Hierfür wurden unterschiedliche experimentelle Methoden wie Differential Scanning
Calorimetry (DSC), Röntgenstreuung, dielektrische Spektroskopie und Neutronenstreu-
ung angewandt.
Darüber hinaus wurden die Auswirkungen eines Nanoconfinements in Hinblick auf die
Dynamik und Phasenübergänge für ausgewählte Beispiele, Py4CEH und verschiedene
HATn (n=5, 6, 10, 12) Materialien betrachtet.
Die Struktur der HATn und HOTn Flüssigkristalle wurde in Abhängigkeit von der
Länge der aliphatischen Seitenketten durch DSC und Röntgenstreuung ermittelt. Alle
untersuchten HATn Materialien weisen eine plastisch-kristalline Phase bei niedrigen
Temperaturen, gefolgt von einer hexagonal geordneten flüssigkristallinen Phase bei
höheren Temperaturen, sowie einer “isotropen” Phase bei noch höheren Tempera-
turen auf. Das Diffraktogramm der flüssigkristallinen Phase zeigt für alle Materialien
eine scharfe Bragg-Reflexion im unteren q-Bereich, die dem interkolumnaren Abstand
zwischen den Molekülen entspricht, sowie einen Peak bei höheren q-Werten, der im
Zusammenhang mit dem interkolumnaren Abstand senkrecht zu den Säulen steht und
einen breiten amorphen Halo als Resultat der ungeordneten Methyl-Gruppen. Der in-
terkolumnare Abstand nimmt linear mit n zu.
Die HOT-Materialen weisen eine ähnliche Struktur auf. Die DSC-Daten zeigen zusät-
zliche Maxima im Heizfluss, die auf mehrere plastisch-kristalline sowie mehrere flüs-
sigkristalline Phasen hindeuten.
Die Phasenübergänge von HAT5, HAT6, HAT10, HAT12 und Py4CEH, welche in
nanoporöse Aluminium-Membranen mit verschiedenen Porendurchmessern (180 nm,
9
2 Inhaltsübersicht
80 nm, 40 nm, 25 nm) eingebettet wurden, wurden mit DSC untersucht. Auch im Con-
finement sind die im Bulkmaterial auftretenden Phasenübergänge sichtbar. Zum ersten
Mal konnten durch zwei Maxima im Heizfluss zwei unterschiedliche Phasenstrukturen
am Rand und in der Mitte der Pore identifiziert werden. Die Phasenübergangstem-
peratur am Rand ist mehr oder weniger unabhängig vom Porendurchmesser. Hinge-
gen nimmt die Phasenübergangstemperatur des Materials in der Mitte der Pore mit
kleinerer Porengröße linear ab, was durch die Gibbs-Thomson-Gleichung beschrieben
werden kann. Die Abnahme der Phasenübergangsenthalpie mit abnehmendem Poren-
durchmesser deutet auf einen Anstieg ungeordneten Materials innerhalb der Pore hin.
Hieraus wurde eine kritische Porengröße für das Auftreten der Phasenübergänge be-
stimmt. Dieses Verfahren wurde für das sich sowohl in der Mitte der Pore als auch
das sich in der gesamten Pore befindliche Material angewandt um hieraus die Dicke
der Randschicht abschätzen zu können. Alternativ kann diese Dicke auch im Rahmen
eines Randschicht-Modells angenähert werden.
Die molekulare Dynamik von Py4CEH im Volumen wurde mit Hilfe von dielektrischer
und spezifischer Wärme-Spektroskopie untersucht. Im dielektrischen Spektrum wur-
den drei Prozesse beobachtet: eine β-Relaxation bei niedrigen Temperaturen, eine
α-Relaxation im Temperaturbereich der Mesophasen gefolgt von Leitfähigkeit bei ho-
hen Temperaturen. Die dielektrische α-Relaxation wurde auf eine eingeschränkte
glasige Dynamik sowohl im plastisch-kristallinen als auch im flüssigkristallinen Zu-
stand zurückgeführt. Die ermittelten verschiedenen Vogel-Fulcher-Tammann Gesetze
(mit unterschiedlichen Vogel-Temperaturen und Fragility-Parametern) wurden durch
die verschiedenen Beschränkungen der dipolaren Fluktuationen in den entsprechen-
den Phasen erklärt. Mit der spezifischen Wärme-Spektroskopie wurde die glasige Dy-
namik auch in der plastisch-kristallinen Phase beobachtet, aber mit einer veränderten
Temperaturabhängigkeit. Dies wurde unter Berücksichtigung der unterschiedlichen
Aspekte des Glasübergangs, die von den verschiedenen Methoden detektiert werden,
erörtert. Im Rahmen des Fluktuations-Ansatzes des Glasübergangs wurde eine Kor-
relationslänge für die glasige Dynamik berechnet, welche dem aus den Röntgenstreu-
ungsdaten geschätzten interkolumnaren Abstand entspricht.
Für Py4CEH wurde auch im Confinement eine α-Relaxation festgestellt. Am Phasenüber-
gang ändert sich die Temperaturabhängigkeit der Relaxationsrate. Hieraus lässt sich
eine dielektrische Phasenübergangstemperatur abschätzen. Bei Temperaturen ober-
halb und unterhalb des Phasenübergangs kann die Temperaturabhängigkeit der Relax-
ationsrate durch eine Arrhenius-Gleichung angenähert werden. Die Abhängigkeit der
geschätzten scheinbaren Aktivierungsenergien von den Porengrößen wurde durch das
Zusammenspiel zwischen Porengröße und Interaktionseffekten erklärt. Das Auftreten
des bekannten Kompensationsgesetzes deutet auf eine kooperative Natur der zugrunde
10
liegenden molekularen Dynamik hin.
Für alle HATn Materialien wurden drei Prozesse beobachtet: eine β-Relaxation bei
niedrigen Temperaturen, eine α-Relaxation bei höheren Temperaturen und Leitfähigkeit
in der “isotropen” Phase. Die Aktivierungsenergie der β-Relaxation nimmt zunächst
mit n zu um wieder abzunehmen und sich an den Wert von Polyethylene anzunä-
hern. Die Temperaturabhängigkeit der α-Relaxation ändert sich mit zunehmender
Kettenlänge von einer Temperaturabhängigkeit, die der Arrhenius-Gleichung folgt,
zu einer Annährung an das Verhalten, das für Polyethylene beobachtet wird. Beide
Ergebnisse wurden im Rahmen eines selbstorganisierten Confinement der Säulen in
Bezug auf die Alkylketten erörtert. Mit zunehmender Kettenlänge und daraus resul-
tierendem interkolumnaren Abstand wird das Confinement geschwächt. Leitfähigkeit
und β-Relaxation werden für alle HOTn Materialien beobachtet, eine α-Relaxation
hingegen nur für HOT6. Die Temperaturabhängigkeit der Relaxationsrate von Leit-
fähigkeit und β-Relaxation wurden durch die Arrhenius-Gleichung mit ähnlichen Ak-
tivierungsenergien wie für die HATn Materialien beschrieben, die von α-Relaxation
durch eine Arrhenius-Gleichung bei höheren Temperaturen und eine VFT-Gleichung
bei niedrigeren Temperaturen. Dieses Verhalten ist typisch für molekulare Dynamiken
in einem nanoskaligen Confinement. Dies wurde erörtert unter Berücksichtigung der
Struktur von HOT6 sowie eines Kooperativitätsansatzes für glasige Dynamik.
Neutronenstreuung wurde eingesetzt, um die Schwingungszustandsdichte (VDOS) für
alle HATn und alle HOTn Diskoten zu ermitteln. Mit Ausnahme von HAT8 zeigen
alle untersuchten HAT und HOTn Materialien zusätzliche Beiträge im VDOS, welche
Boson-Peak genannt werden. Für die HATn Materialien verringert sich die Frequenz
des Boson Peaks mit zunehmender Kettenlänge, wobei sich seine Intensität erhöht.
Dies kann durch ein Modell des selbstorganisierten Confinements erklärt werden. Das
Verhalten der HOTn Materialien ähnelt dem der HATn-Materialien, sie zeigen jedoch
eine zusätzliche Feinstruktur.
Für HAT6 eingebettet in Aluminiumoxidmembranen mit verschiedenen Porengrößen
(80 nm, 40 nm, 25 nm) wurde ein Boson-Peak ähnlich wie im Bulkmaterial beobachtet.
Der Boson-Peak gewinnt an Intensität und verschiebt sich mit abnehmendem Poren-
durchmesser zu niedrigeren Frequenzen. Dies wurde im Rahmen eines Aufweichens des
plastisch kristallinen Zustandes von HAT6 in den Poren durch das Confinement im
Vergleich zum Bulkmaterial diskutiert.
Elastische Scans wurden für alle HATn und HOTn Materialien im Volumen sowie für
HAT6 im Confinement durchgeführt, um die verschiedenen molekularen Prozesse auf
einer Zeitskala von Nanosekunden zu identifizieren. In der plastisch kristallinen Phase
wurde für alle HAT Materialien eine vergleichbare molekulare Dynamik beobachtet.
Hier ist das mittlere Verschiebungsquadrat klein im Vergleich zum interkolumnaren
11

2 Inhaltsübersicht
Abstand. In der flüssigkristallinen Phase ist das mittlere Verschiebungsquadrat in
der gleichen Größenordnung wie der interkolumnare Abstand und nimmt durch die
Aufweichung des selbstorganisierten Confinements mit größerer Kettenlänge zu. Die
HOT Materialien zeigen ein ähnliches Verhalten. Für HAT6 im Confinement nimmt
das mittlere Verschiebungsquadrat in der plastisch-kristallinen Phase mit abnehmender
Porengröße zu, was auf eine Grenzschicht hindeutet. In der flüssigkristallinen sowie in
der isotropen Phase ist das mittlere Verschiebungsquadrat reduziert.
12
3 Motivation
Discotic liquid crystals appear very promising in the field of organic electronics, which
can meet today’s dire need for effective, low-cost, portable and disposable elements
such as tunable organic light-emitting diodes (OLEDS), thin film field-effect transis-
tors (OTFTs) or photovoltaic chips (OVPs). These unique soft matter materials exhibit
aspects both of a solid crystal and of a conventional fluid. Due to their highly ordered
columnar structures these materials outperform many photoconductive polymers (e.
g. in terms of charge transport or short-lived excitonic response) thereby giving them
highful potential for the use in molecular electronic devices.
The structure of discotic liquid crystals has been extensively studied by many different
methods (X-ray diffraction, calorimetry and polarized optical microscopy).[1] However
when aiming at applications such as advanced electronic devices a fundamental un-
derstanding of their molecuclar mobility is indespensable. Furthermore, as a result
of their inherent counterplay between order and mobility, discotic liquid crystals can
be interesting materials when adressing fundamental questions, e.g. about the glass
transition, which is a controversially discussed problem of soft matter physics or the
Boson Peak exhibited by many glasses which is not fully understood yet. Moreover for
both pursuits, designing efficent electronic elements and understanding the underlying
processes, studying the influence of spatial nanoscale confinement on the properties
and dynamics of these materials, is essential.
In this thesis differential scanning spectroscopy, X-ray and neutron scattering, dielectric
relaxation and specific heat spectroscopy are employed to elucidate the structure as
well as the dynamics of one pyrene-based and two series of triphenylene-based discotic
liquid crystals in the bulk and when confined to self-ordered alumina membranes.
Structure and phase behavior of all samples were determined and confirmed by X-ray
scattering and differential scanning calorimetry. The molecular dynamics of the bulk
materials was investigated by means of dielectric relaxation spectroscopy. The impact
of confinement on the phase behavior on several selected liquid crystals was studied by
differential scanning calorimtery. Neutron scattering experiments were carried out on
both bulk and confined samples by two different techniques, (1) time of flight neutron
13
3 Motivation
scattering to measure the vibrational density of states and (2) backscattering to gain
an overview about the molecular dynamics on a time scale of nanoseconds.
14
4 Introduction
4.1 Rod-like Liquid Crystals and Discotic Liquid
Crystals (DLCs)
Liquid crystals are unique soft matter materials which exhibit aspects both of a solid
crystal and of a conventional fluid. Since the introduction of liquid crystalline states of
matter into science by Otto Lehmann, Friedrich Reinitzer and others, the relationship
between the formation of liquid crystalline phases and the structure of the correspond-
ing molecules has been under discussion.[2, 3]
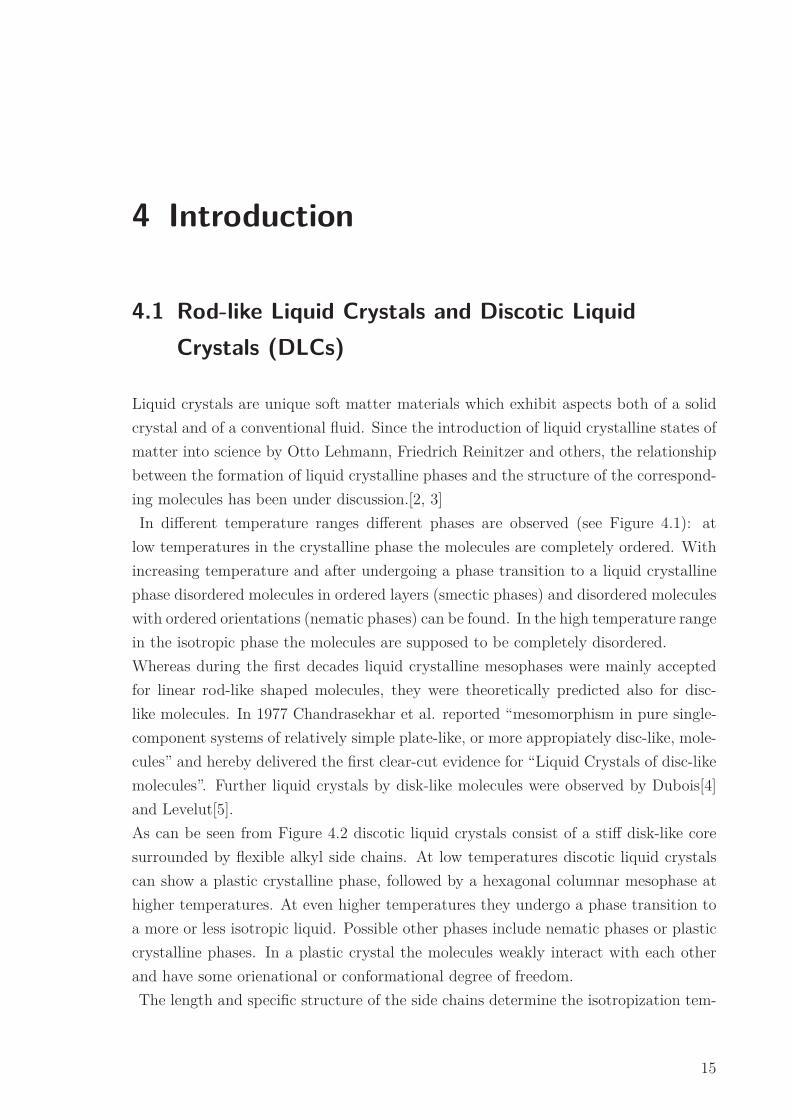
In different temperature ranges different phases are observed (see Figure 4.1): at
low temperatures in the crystalline phase the molecules are completely ordered. With
increasing temperature and after undergoing a phase transition to a liquid crystalline
phase disordered molecules in ordered layers (smectic phases) and disordered molecules
with ordered orientations (nematic phases) can be found. In the high temperature range
in the isotropic phase the molecules are supposed to be completely disordered.
Whereas during the first decades liquid crystalline mesophases were mainly accepted
for linear rod-like shaped molecules, they were theoretically predicted also for disc-
like molecules. In 1977 Chandrasekhar et al. reported “mesomorphism in pure single-
component systems of relatively simple plate-like, or more appropiately disc-like, mole-
cules” and hereby delivered the first clear-cut evidence for “Liquid Crystals of disc-like
molecules”. Further liquid crystals by disk-like molecules were observed by Dubois[4]
and Levelut[5].
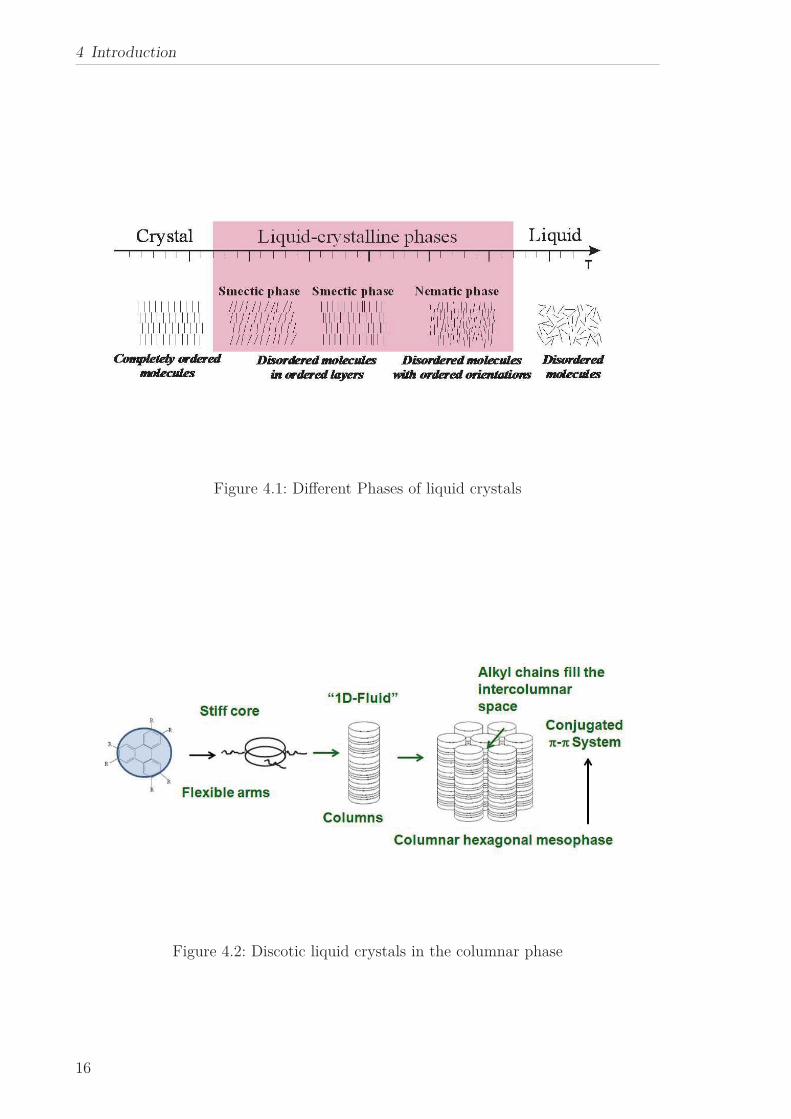
As can be seen from Figure 4.2 discotic liquid crystals consist of a stiff disk-like core
surrounded by flexible alkyl side chains. At low temperatures discotic liquid crystals
can show a plastic crystalline phase, followed by a hexagonal columnar mesophase at
higher temperatures. At even higher temperatures they undergo a phase transition to
a more or less isotropic liquid. Possible other phases include nematic phases or plastic
crystalline phases. In a plastic crystal the molecules weakly interact with each other
and have some orienational or conformational degree of freedom.
The length and specific structure of the side chains determine the isotropization tem-
15
4 Introduction
Figure 4.1: Different Phases of liquid crystals
Figure 4.2: Discotic liquid crystals in the columnar phase
16
4.1 Rod-like Liquid Crystals and Discotic Liquid Crystals (DLCs)
perature and the temperature range of the hexagonal columnar mesophase. Columnar
phases ocurr in pyrene and triphenylene systems which are in the focus of this work
as well as in many others (perylenes, triphenyltriazines, benzoperylenes, coronenes,
ovalenes etc.). The self-assembly of these materials is directed through non-covalent
molecular interactions: the disc-shaped molecules arrange themselves into columns
which further assemble into two-dimensional arrays with a hexagonal mesophase. The
side chains fill the intercolumnar space giving rise to a nanophase separated state.
The formation of the disc-shaped molecules into columns is inherent to the different
columnar phases: there are different types of stacking in dependence on the corre-
sponding irregular interactions:
1. “disordered columns” (irregular stacking of the disks)
2. “ordered columns” (cores are stacked in a regular ordered (equidistant) fashion
while the flexible tails are still disordered)
3. “tilted columns” (cores of the disks are tilted with respect to the columns)
whereas none of these types has translational order. Therefore they can generally be
regarded as 1D fluids. These columns arrange in a 2D lattice while their axes are
parellel to each other. As a result the different columnar phases can be considered as a
1D fluid along the columns and 2D crystalline structures along the 2 D lattice vectors.
Their molecular oder can be disordered, ordered or tilted and their symmetry of the
2D intercolumnar lattice can be hexagonal, rectangular or oblique.
In liquid crystals and especially in discotic liquid crystals order and mobility compete,
providing the possibilty to investigate fundamental problems like the glass transition
or the boson peak. Moreover they look promising for applications in the field of organic
electronics. However for applications such as advanced electronic materials, the intrin-
sic disc mobility as well as the mobility of the alkyl chains can influence the charge
carrier mobility. Therefore the molecular mobility has to be explored in detail.
By covering an extensive frequency and temperature range, dielectric relaxation spec-
troscopy is a powerful tool to investigate the molecular dynamics in different soft matter
systems including discotic liquid crystals.[6] A detailed theory for dielectric relaxation
of calamitic (rod-like) liquid crystals was developed by by Nordio et al.[7] Based on
these considerations Araki et al.[8] developed an approach without prior specifications
of the character of the involved molecular fluctuations. Different relaxation processes
are predicted which are assigned to specified molecular motions. An overview is given
in reference [6]. However, for discotic liquid crystals such a general theoretical approach
does not exist and so a detailed assignement of the observed relaxation processes to a
molecular mechanism is not possible. The nomenclature of the processes follows more
17
4 Introduction
or less that of glass forming materials, e. g. one relaxation process in the hexagonal
columnar mesophase is assigned to glassy dynamics.[9] A study of the dynamics of three
dipole functionalized hexa-peri-hexabenzocoronenes by means of NMR techniques and
dielectric spectroscopy elucidated the origin of two dielectric processes with different
glass transition temperatures and delivered the first phase diagram for this kind of
materials.[10]
The design of applicable devices requires columnar formation over rather large length
scales (monodomains) at room temperature as well as the control and adjustment of
the parameters that influence the alignment when the discotic liquid crystals interact
with solid interfaces (nanostructures, contacts).
18
4.2 The Glass Transition
4.2 The Glass Transition
Man has been producing and using glassy materials since prehistoric times. Nowa-
days, glasses have become indispensable in modern technology as well as in daily life.
However, a quantitative physical understanding of their nature and formation remains
controversial and an open problem of condensed matter physics.[11, 12, 13, 14, 15]
The glass transistion is characterized for instance by the glass transition temperature
Tg where step-like changes in material properties, e. g. the specfic heat cp or the
thermal expansion coefficient, are detected by thermal methods such as Differential
Scannning Calorimetry (see section 5.3). Tg can also be defined as the temperature
where the relaxation time is 100 s. On microscopic level, upon continously cooling
down, the molecular mobility gradually decreases until the cooling rate does not al-
low sufficient time for configural sampling and the material appears "frozen" on the
experimental time scale. Hence, whether the material under study exhibits solid-like
or liquid-like behaviour depends on the time-scale of the experiment. With increasing
cooling rate the material under study loses time to attain equilibrium condition and the
glass transition temperature Tg increases by 10 Kelvin or higher.[16, 17, 18] Therefore,
the glass transition temperature is not a well-defined property.
The structural relaxation time is the key to understanding the dynamic glass transi-
tion. According to Maxwell the solid-like behaviour of an elastic liquid can be described
by:[19]
γ = σ
η+ σ
G(4.1)
where γ is the time derivative of the shear displacement, η the viscosity, G the shear
modulus and σ the shear stress. Assuming a sudden shear displacement beginning
from equilibrium conditions, γ = γ0δ(t), and integrating equation (4.1) delivers a link
between the relaxation time and the viscosity:
τ = η
G∞(4.2)
where G∞ is the “instantaneous” shear modulus. With decreasing temperature the
shear modulus increases from a liquid-like behaviour first to a rubbery plateau (G ∼ 106
Pa) followed by a strong increase below the glass transition temperature Tg to 109 to
1010 Pa.
Numerous experimental methods including Dynamical Mechanical spectroscopy (DMS),
Nuclear Magnetic Spectroscopy (NMR), Neutron Scattering, Dynamic Light Scat-
tering, Ultrasonic Attenuation, Photon Correlation Spectroscopy (PCS), Differential
Scanning Calorimetry (DCS), AC Calorimetry, and especially Broadband Dielectric
Spectroscopy [11] have been employed to study the glass transition.
19
4 Introduction
Glassy dynamics have been detected for manifold materials such as organic small
molecules, synthetic as well as side chain liquid crystalline polymers, metallic com-
pounds, biomaterials but also inorganic substances of different constitution. Seki and
Suga observed a glass transition in plastic crystals for the first time.[20] The glassy dy-
namics of a nematic mixture were investigated by by broadband dielectric and specific
heat spectroscopy.[21]
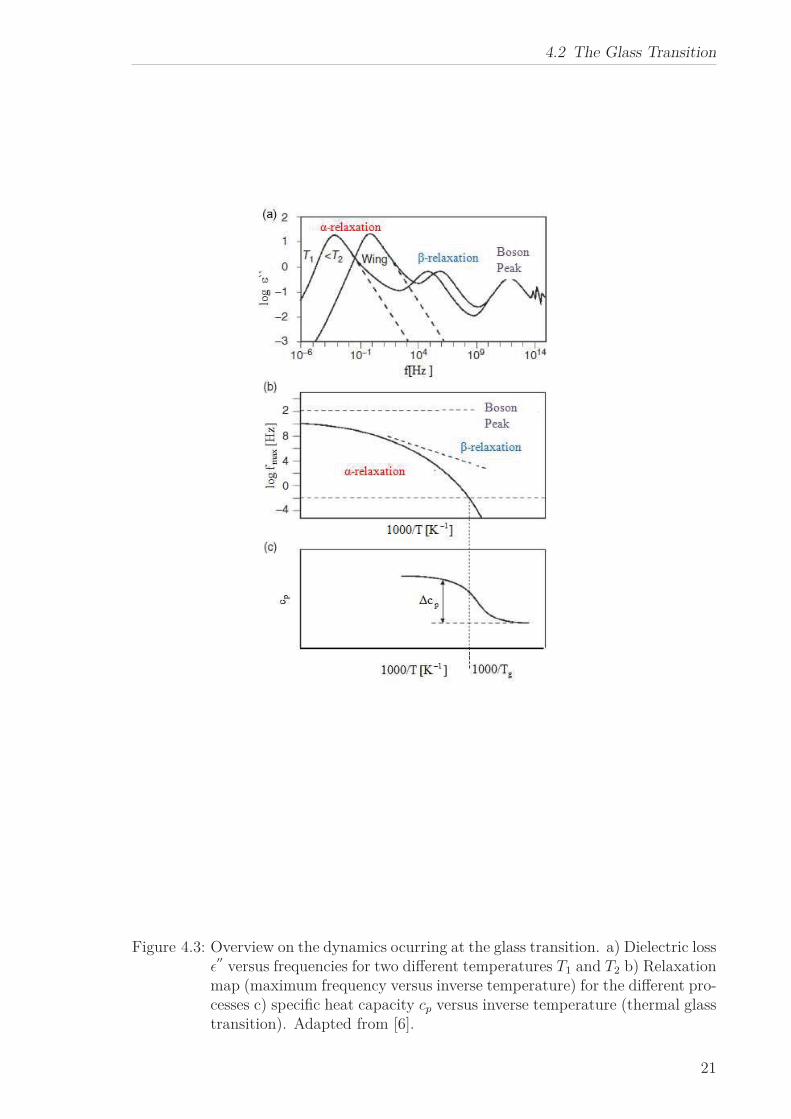
Figure 4.3 shows an overview over the different processes which are observed in poly-
mers and other glass-forming substances in the dielectric loss (see section 5.3):
The pronounced process on the low frequency side (see Figure a) is the α-relaxation
which is also referred to as dynamic glass transition. In the high temperature limit
the representative dielectric relaxation time typically is τ∞ ≅ 10−13 s, due to local ori-
entational fluctuations. In this region the viscosity of the liquid varies between 10−3
to 10−2 Pa s. The strong increase of the relaxation time (and therefore decrease in the
maximum frequency, see Figure 4.3b) as well as the viscosity observed with decreasing
temperature can be approximated by the empirical Vogel-Fulcher-Tammann (VFT)
equation:[22, 23, 24]
log1
2πτ(T ) = log fmax = log f∞ − A
T − T0
= log f∞ − ln(10)DT0
T − T0
(4.3)
where f∞ is a pre-exponential factor, A is a constant and T0 the so-called Vogel or
ideal glass transition temperature(30-70 K below the thermal glass transition) and D
is the so-called fragility parameter or fragility strength. A dependence according to the
Vogel-Fulcher-Tammann equation (4.3) will show up as a straight line in the following
representation:
(d log fmax
dT)−1/2 = A−1/2(T − T0) (4.4)
The singularity in equation (4.3) at T = T0 is attributed to the Kauzmann paradox
observed in calorimetric measurements: by extrapolation the liquids entropy decreases
with decreasing temperature, below a certain temperature TK termed the Kauzmann
temperature even beneath the crystal entropy. However, the physcial interpretation
remains unclear. It should be pointed out that equation (4.3) cannot be applied at
high viscosities because when compared to experimental data the obtained relaxation
times are too high.
As already mentioned and can be seen from Figure 4.3c, the α-relaxation shows up as
a step-like change in the specfic heat capacity (thermal glass transition).
An approach by Avramov [25] (also see reference [19]) which represents an alternative
20
4.2 The Glass Transition
Figure 4.3: Overview on the dynamics ocurring at the glass transition. a) Dielectric lossǫ′′
versus frequencies for two different temperatures T1 and T2 b) Relaxationmap (maximum frequency versus inverse temperature) for the different pro-cesses c) specific heat capacity cp versus inverse temperature (thermal glasstransition). Adapted from [6].
21
4 Introduction
approach to fit the data with the same parameters, is given by
τ = τ0 exp
⎡⎢⎢⎢⎢⎣C
T n
⎤⎥⎥⎥⎥⎦(4.5)
Equation (4.5) does not provide remarkable advancement over Equation (4.3). Ther-
fore in the absence of a better theory of the dynamic glass transition, equation (4.3) is
still commonly used despite its restrictions.
The existence of non-Debye relaxation is another remarkable charcteristic of glassy
dynamics. The exposure of the material under study to an immediate thermal, me-
chanical or electrical perturbation results in a slow relaxation towards the steady state
whereas in most cases the response shows a non-exponential time dependence. The re-
sponse function φ(τ) follows the “stretched exponential” Kohlrausch-Williams-Watts
function written as:
φ(τ) = exp
⎡⎢⎢⎢⎢⎣−⎛⎝
t
τKW W
⎞⎠
βKW W ⎤⎥⎥⎥⎥⎦(4.6)
where βKW W (0 ≪ βKW W ≤ 1) is the stretching parameter attributed to an asymmet-
ric broadening of φ(τ) at short times compared to the exponetial decay and τKW W is
linked to the relaxation time. Glarum derived one of the earliest models to interpret
the molecular basis of equation (4.6) [26] and recently further approaches have been
introduced.[27] There are two possible theories of the KWW-behaviour under current
discussion: one approach assumes a homogenous system consisting of exponentially
relaxing molecules, whereas the other suggests a heterogenous system composed of re-
gions, each of them displaying different dynamics following an exponential relaxation
with a different characteristic time. The latter hypothesis is supported by studies uti-
lizing techniques such as multidimensional NMR, dielectric non-resonant hole-burning,
and optical photo-bleaching.[15] While glassy dynamics is still a controversially dis-
cussed soft matter topic, nonetheless there is predominant consensus about the coop-
erative nature of the underlying motional process.[28]
Adam and Gibbs [29] introduced the Cooperativity Rearranging Regions (CRR). A
CRR is defined as the smallest volume which can change its configuration indepen-
dently from the neighbouring regions. The size of a CRR is small at high temperatures
and increases with decreasing temperature approaching Tg. Within this approach a
temperature dependence according to the VFT law can be derived. Donth developed
a fluctuation approach to the glass transition in order to enhance this idea.[28] Within
his approach a correlation length ξ (or volume VCRR) at the glass transition can be
calculated as
ξ3 = VCRR = kBTg∆(1/cp)ρ(δT )2
(4.7)
22
4.2 The Glass Transition
where Tg is the dynamic glass transition temperature, ρ is the density at Tg and
∆(1/Cp) = 1/cp,Glass − 1/cp,Liquid the step of the reciprocal specific heat capacity at
the glass transition where cV ∼ cp is assumed. δT is the width of the glass transition
and can be extracted experimentally from the temperature dependence of the spe-
cific heat capacity which can be estimated from broadband specific heat spectroscopy
data.[30, 28, 31]. Moreover within the fluctuation approach the temperature depen-
dence of the correlation approach can be derived to ξ ∼ (T − T0)−2/3.[28] This implies
that the degree of cooperativity decreases with decreasing T0 at a given temperature.
Please note that the four point correlation function approach to the glass transition
delivers a similar result.[32].
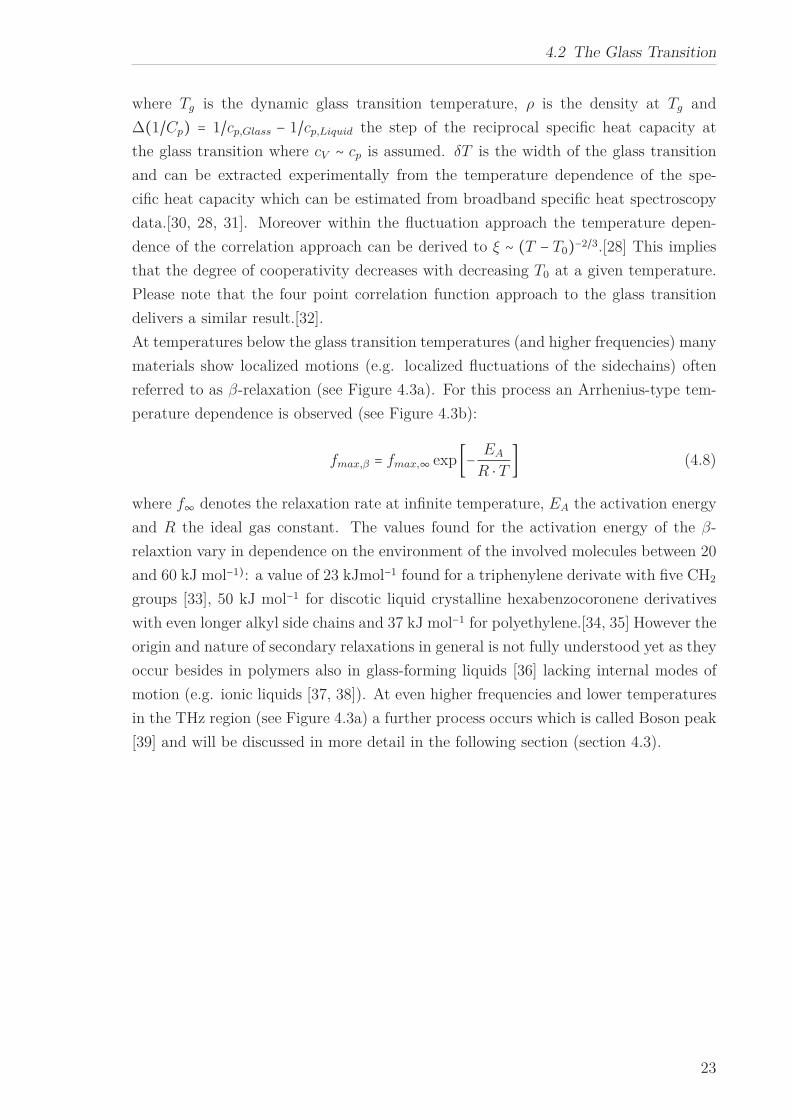
At temperatures below the glass transition temperatures (and higher frequencies) many
materials show localized motions (e.g. localized fluctuations of the sidechains) often
referred to as β-relaxation (see Figure 4.3a). For this process an Arrhenius-type tem-
perature dependence is observed (see Figure 4.3b):
fmax,β = fmax,∞ exp [− EA
R ⋅ T ] (4.8)
where f∞ denotes the relaxation rate at infinite temperature, EA the activation energy
and R the ideal gas constant. The values found for the activation energy of the β-
relaxtion vary in dependence on the environment of the involved molecules between 20
and 60 kJ mol−1): a value of 23 kJmol−1 found for a triphenylene derivate with five CH2
groups [33], 50 kJ mol−1 for discotic liquid crystalline hexabenzocoronene derivatives
with even longer alkyl side chains and 37 kJ mol−1 for polyethylene.[34, 35] However the
origin and nature of secondary relaxations in general is not fully understood yet as they
occur besides in polymers also in glass-forming liquids [36] lacking internal modes of
motion (e.g. ionic liquids [37, 38]). At even higher frequencies and lower temperatures
in the THz region (see Figure 4.3a) a further process occurs which is called Boson peak
[39] and will be discussed in more detail in the following section (section 4.3).
23
4 Introduction
4.3 The Boson Peak
For crystalline materials the vibrational density of states (VDOS) g(ω) (see section
5.3.5) follows the Debye model of sound waves g(ω) ∼ ω2. In contrast amorphous
materials exhibit excess contributions in the frequency range ω = 0.2...1 THz (energy
range 1...5 meV). For these materials in the reduced representation g(ω)/ω2 a peak is
detected. This peak is generally called Boson Peak (BP) which is a universal but con-
troversially discussed feature of glasses and other materials with a complete or partial
disorder.[39] Furthermore it is equivalent to the excess contributions commonly ob-
served for glasses in the specific heat and in thermal conductivity at low temperatures.
Although the time scales of the thermal glass transition (∼ 100 s at Tg), and the BP
(terahertz range) differ, there are strong signs of a relevance of the BP for the glass
transition.
In fact many materials exhibiting a BP also show a glass transition. Materials catego-
rized as “strong glasses” exhibit a well-pronounced BP whereas “weak” ones show only
a weak BP. Moreover the BP rarely depends on temperature. [40]
However the origin of the BP is still unclear. Different theoretical approaches are
discussed and they can be classified into two categories:
1. The modes of the BP differ from sound waves and emerge from (quasi) localized
modes. These result from peculiarities of the interatomic forces in the material
(e. g. group of atoms subject to a soft potential).
2. The BP of the amorphous system is a broadened version of the Van Hove sin-
gularity which is a well-known phenomenon in crystalline systems : For a linear
chain as a model system the frequency is proportional to the sine of the wave
vector. Therefore frequencies close to the maximum occur more often than low
frequency sound frequencies. Under the assumption that this singularity exists
also in amorphous materials to a given extent, the VDOS of an amorphous ma-
terial is only a modification of the VDOS of the corresponding crystalline system
due to random fluctuations of force constants.
Numerous different methods like Fourier transform infrared spectroscopy, inelastic X-
ray Scattering, Neutron Scattering, Mössbauer spectroscopy, low frequency Raman
spectroscopy and light scattering have been employed to study the Boson Peak in
conventional glass formers as low molecular weight liquids and polymers as well as
biologically active systems (e. g. proteins) which are also considered to undergo a
glass transition. In investigations on plastic crystals by means of THz dielectric spec-
troscopy a Boson peak was observed implying that these materials can also undergo a
24
4.3 The Boson Peak
glass transition.[20]
The Boson Peak has been linked to fluctuations of elastic constants in reference [41]
where sound waves in a disordered environment were considered. In this environment
the local elastic constants are subjected to fluctuations whose spatial correlation is
denoted by a correlation length. Sokolov et al. studied the correlation between the
dynamic heterogeneity length scale ζ of glasses estimated from the boson peak and
the activation volume for the dynamic glass transition ∆V # in a number of molecular,
hydrogen bond and polymeric glass formers. They observed that ζ3(Tg) ∼ ∆V #(Tg)holds regardless of chemical structure, molecular weight and pressure (density) of the
studied materials.[42]
When impregnating materials into nanostructures both surface and confinement size
play a role. This can be a useful procedure to distinguish between the two theoretical
approaches.
Confinement can be categorized into two classes, hard and soft confinement.
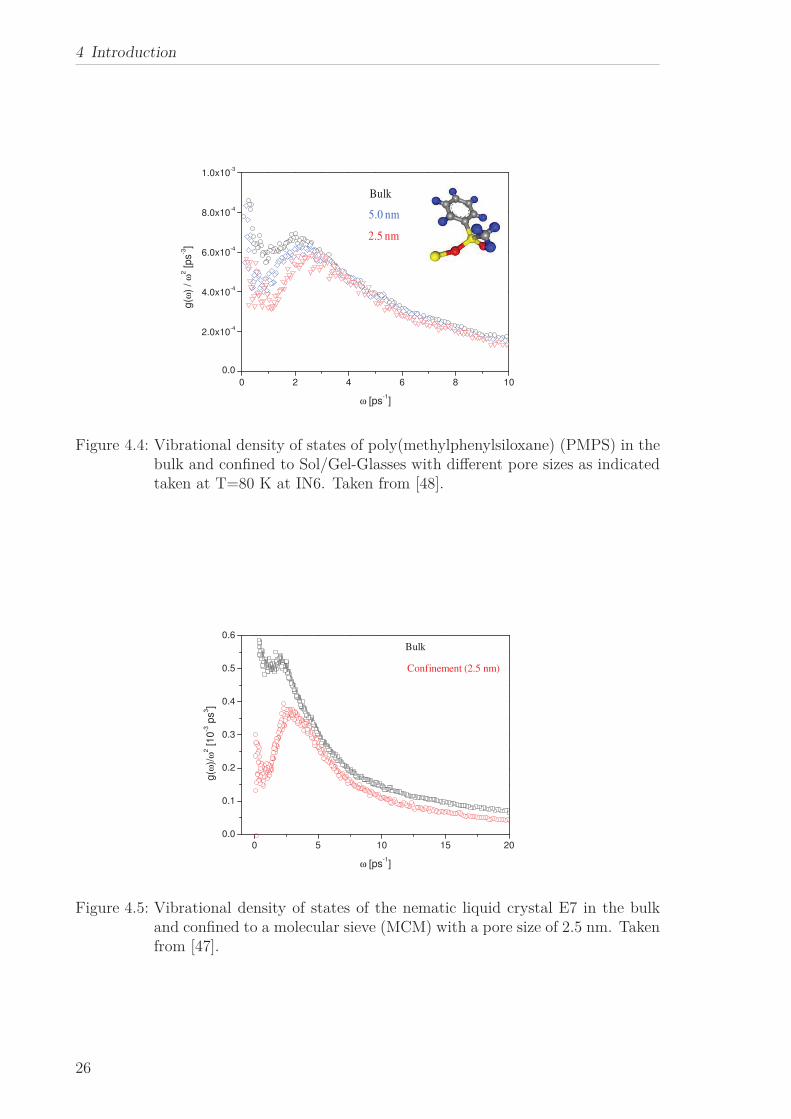
For organic glass-forming systems embedded in a hard confinement (e.g. nanopores),
with decreasing pore size the low frequeny wing is supressed whereas the high frequency
range does not change. This results in a sharper BP which is shifted to higher frequen-
cies as shown for poly(methylphenylsiloxane) (PMPS) confined to Sol/Gel-Glasses in
Figure 4.4. This was observed also for other conventional low molecular weight (sa-
lol) and polymeric glass-forming systems (poly(dimethyl siloxane), poly(phenylmethyl
siloxane), poly(propylene glycol)) [43, 44, 45, 46] and for the glass forming liquid crys-
tal E7 confined to the pores of a molecular sieve.[47] These findings might support the
hypothesis of a collective nature of the BP.
As an example for a study on the influence of soft confinement, Propylene glycol was
embedded to microemulsion droplets. In this case, the boson peak of the bulk material
is completely washed out under the soft confinement.
25
4 Introduction
0 2 4 6 8 10
0.0
2.0x10⁻⁴
4.0x10⁻⁴
6.0x10⁻⁴
8.0x10⁻⁴
1.0x10⁻³
Bulk
5.0 nm
2.5 nm
g(ω
) /
ω2 [ps
-3]
ω [ps-1]
Figure 4.4: Vibrational density of states of poly(methylphenylsiloxane) (PMPS) in thebulk and confined to Sol/Gel-Glasses with different pore sizes as indicatedtaken at T=80 K at IN6. Taken from [48].
0 5 10 15 20
0.0
0.1
0.2
0.3
0.4
0.5
0.6
Bulk
Confinement (2.5 nm)
g(ω
)/ω
2 [10
-3 p
s3]
ω [ps-1]
Figure 4.5: Vibrational density of states of the nematic liquid crystal E7 in the bulkand confined to a molecular sieve (MCM) with a pore size of 2.5 nm. Takenfrom [47].
26
4.4 The Effect of Confinement on Arrangement and Phase Transitions
4.4 The Effect of Confinement on Arrangement and
Phase Transitions
Confining materials on nanoscale can fundamentally influence their properties and
phase behavior. This applies especially to discotic liquid crystals where order and
mobility compete. Synthesizing nanowires by impregnating organic materials into
nanoporous template membranes is one possible breakthrough in the field of organic
(nano-) electronics. The formation of DLC nanowires in self-ordered anodic aluminum
oxide (AAO) was reported by Steinhart et al.[49] However, the supramolecular order
in nanowires is difficult to control because the the long-range order of the bulk cannot
be maintained in the wires. A different approach is producing molecular nanorods by
chemical modification of the pore wall and controlling the packing structure by apply-
ing a magnetic field.[50]
Although the phase behavior and the molecular mobility of discotic liquid crystals have
been studied in detail [2, 51, 52, 53, 54, 10, 33, 55] the impact of a nanoscale confine-
ment on the properties of these unique soft matter materials has been investigated only
scarcely.
For discotic liquid crystals there are two possibilities to arrange with regard to a surface
[56]:
(1) planarly (edge-on orientations of the molecules) as found for columns in thin films
(2) homeotropically (face-on orientation of the molecules) when the material is confined
between two solid substrates.
As the π − π-system has to be electrically contacted by macroscopic electrodes, only
the homeotropic alignment can be used for efficient photovoltaic devices and other
applications.[57] A competition between homeotropic and planar arrangement results
from different interfacial tensions between air and the liquid crystal as well as between
the liquid crystal and a substrate. Homeotropic arrangement organization can be ob-
tained by thermal annealing of the material in open films, when confined between two
interfaces or by combining two miscible mesogens with different mesophases.
For polymers and polymorphs confined to nanopores and porous glasses crystalline
phases which are inaccessible, metastable or transient in the bulk material were re-
ported. [58, 59, 60, 61, 62] The stability and developement of a certain crystalline
phase depends on the size of the confinement. Furthermore a supression of crystalliza-
tion for small pore diameter is observed. Accordingly, one can define a critical diameter
for the development of a certain crystalline state: if the size of the confining space is
smaller than the crystal size of the stable crystalline state, a different metastable crys-
talline state can develop.[63, 64, 65] Moreover confining a material to a pore size smaller
than the crystal size of any possible crystalline phase can result in a stable amorphous
27
4 Introduction
phase. This can also be pictured that enhanced by the interaction of the molecules
with the wall the crystallization dynamics have slowed down drastically so that they
have become undetectable on experimental time scale.
For nanocrystals a metastable crystalline phase can emerge if the sum of the surface en-
ergy contributions is higher than the energetic advantage of a transition to a more stable
crystalline phase. In the case of calamitic rodlike liquid crystals a supression of phase
transitions and new paranematic, short-range ordered smectic, or low-temperature lay-
ered structures have been found.[49, 66, 67, 68, 69, 70, 71, 72] For the nematic liquid
crystal 5CB confined to anodic aluminum membranes, Floudas et el. observed that
the phase transition temperatures shift to lower values with decreasing pore sizes and
a complete supression of the crystallization for pore sizes smaller than 35 nm.[73]
For a variety of materials the decrease of the phase transition temperatures with de-
creasing pore size under confinement can be described by the Gibbs-Thomson formula:
[65, 74]
∆T = TmB
4σ
∆Hρsd(4.9)
where TmB denotes the bulk phase transition temperature, σ is the solid liquid interface
energy per unit area (surface tension), ∆H is the transition enthalpy of the bulk
material, ρS is the density, and d is the pore diameter. The surface tension is mainly a
molecular quantity related to the interaction of the molecule with a surface. [75, 76] In a
recent study [77] it was concluded that while for larger pore sizes due to the existance of
long range translational order T ∼ 1/d = 2/R holds, no signs for such an order has been
found for pore sizes smaller than 10 nm. In the latter case a Landau-de Gennes model
with elastic splay deformations in cylindrical layers of radially arranged molecular
columns is assumed. As a result of the increasing impact of splay deformations with
descreasing pore size T ∼ 1/(R2) is more suitable.
28
5 Experimental Part
5.1 Materials
5.1.1 Discotic Liquid Crystals
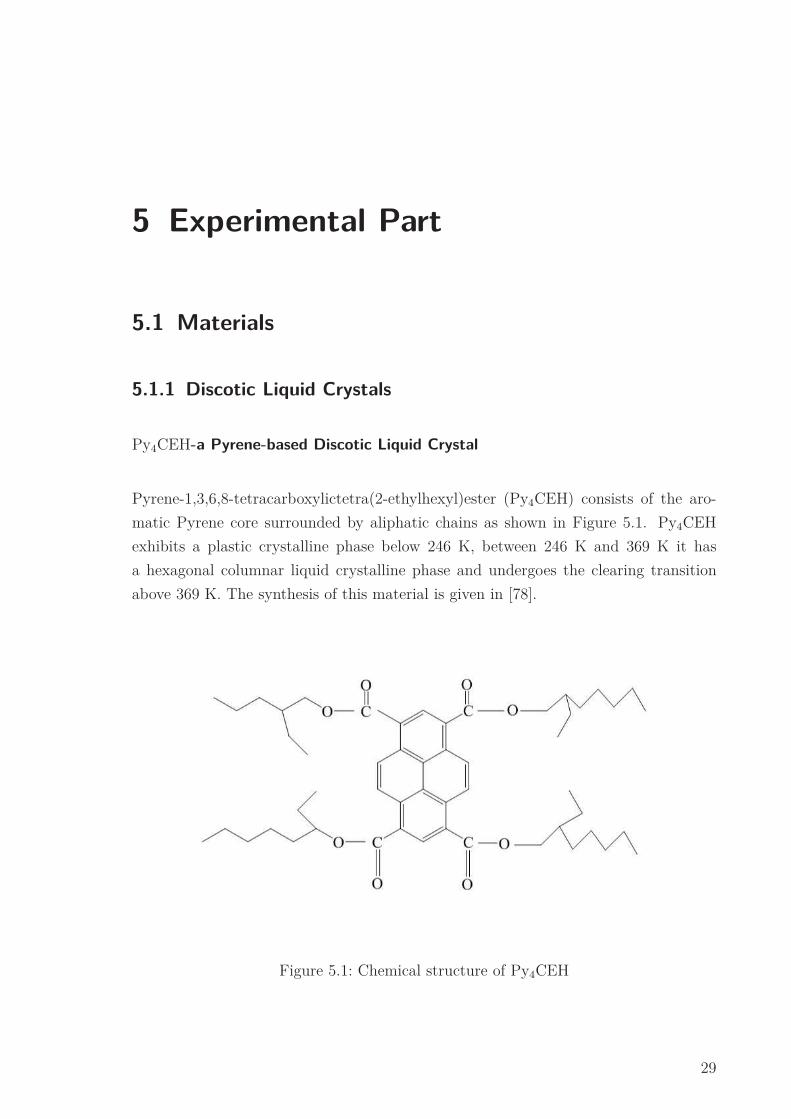
Py4CEH-a Pyrene-based Discotic Liquid Crystal
Pyrene-1,3,6,8-tetracarboxylictetra(2-ethylhexyl)ester (Py4CEH) consists of the aro-
matic Pyrene core surrounded by aliphatic chains as shown in Figure 5.1. Py4CEH
exhibits a plastic crystalline phase below 246 K, between 246 K and 369 K it has
a hexagonal columnar liquid crystalline phase and undergoes the clearing transition
above 369 K. The synthesis of this material is given in [78].
Figure 5.1: Chemical structure of Py4CEH
29
5 Experimental Part
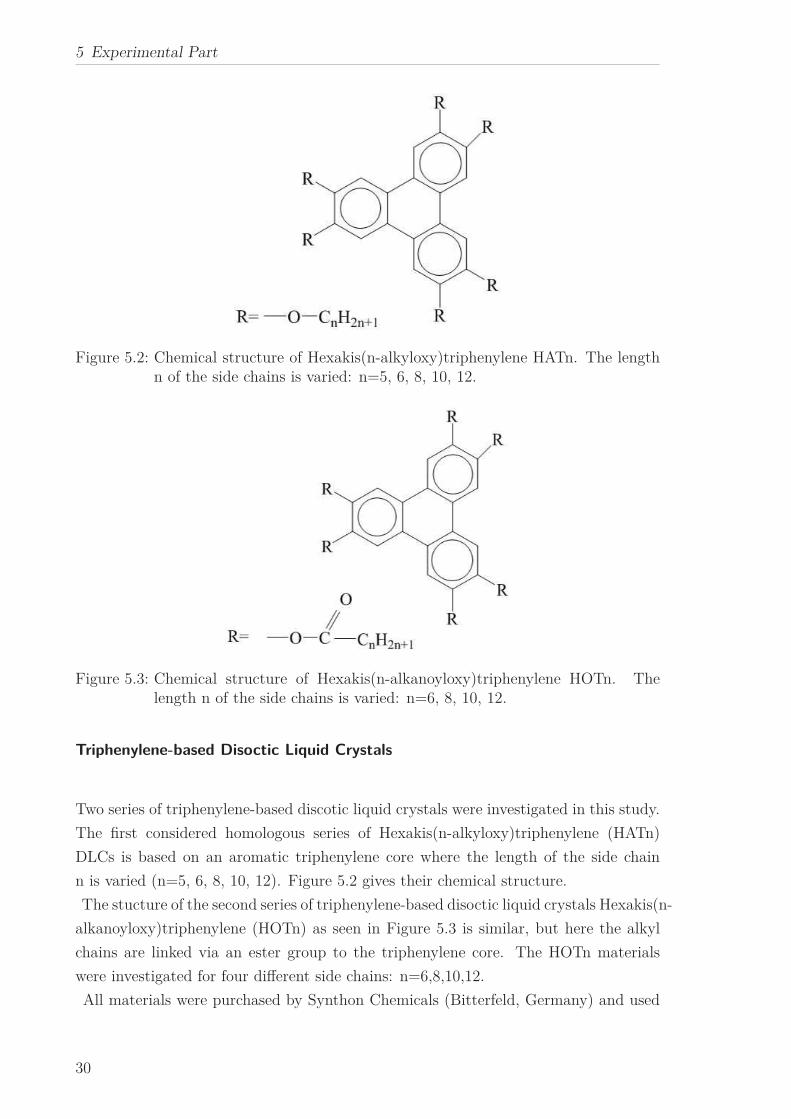
Figure 5.2: Chemical structure of Hexakis(n-alkyloxy)triphenylene HATn. The lengthn of the side chains is varied: n=5, 6, 8, 10, 12.
Figure 5.3: Chemical structure of Hexakis(n-alkanoyloxy)triphenylene HOTn. Thelength n of the side chains is varied: n=6, 8, 10, 12.
Triphenylene-based Disoctic Liquid Crystals
Two series of triphenylene-based discotic liquid crystals were investigated in this study.
The first considered homologous series of Hexakis(n-alkyloxy)triphenylene (HATn)
DLCs is based on an aromatic triphenylene core where the length of the side chain
n is varied (n=5, 6, 8, 10, 12). Figure 5.2 gives their chemical structure.
The stucture of the second series of triphenylene-based disoctic liquid crystals Hexakis(n-
alkanoyloxy)triphenylene (HOTn) as seen in Figure 5.3 is similar, but here the alkyl
chains are linked via an ester group to the triphenylene core. The HOTn materials
were investigated for four different side chains: n=6,8,10,12.
All materials were purchased by Synthon Chemicals (Bitterfeld, Germany) and used
30
5.1 Materials
820 830 840
14C
13C
Inte
nsity [a
.u]
m/z [Da]
12C
MHAT6
=829.24 g/mol
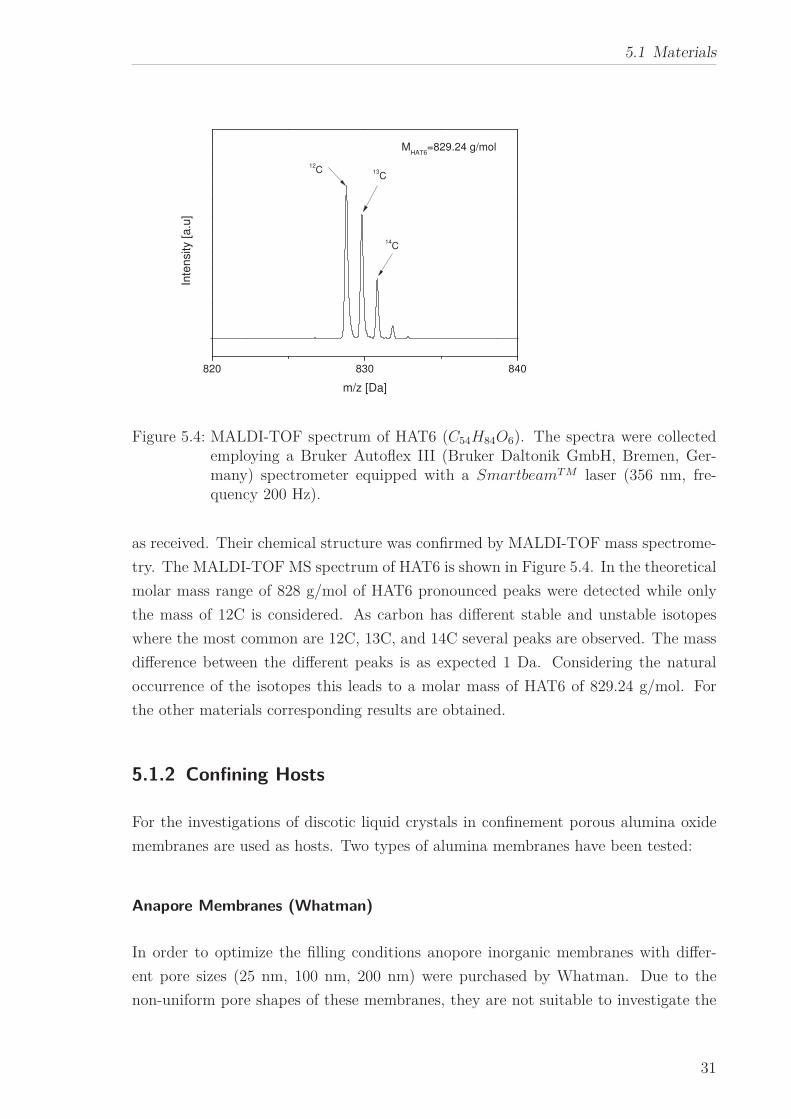
Figure 5.4: MALDI-TOF spectrum of HAT6 (C54H84O6). The spectra were collectedemploying a Bruker Autoflex III (Bruker Daltonik GmbH, Bremen, Ger-many) spectrometer equipped with a SmartbeamT M laser (356 nm, fre-quency 200 Hz).
as received. Their chemical structure was confirmed by MALDI-TOF mass spectrome-
try. The MALDI-TOF MS spectrum of HAT6 is shown in Figure 5.4. In the theoretical
molar mass range of 828 g/mol of HAT6 pronounced peaks were detected while only
the mass of 12C is considered. As carbon has different stable and unstable isotopes
where the most common are 12C, 13C, and 14C several peaks are observed. The mass
difference between the different peaks is as expected 1 Da. Considering the natural
occurrence of the isotopes this leads to a molar mass of HAT6 of 829.24 g/mol. For
the other materials corresponding results are obtained.
5.1.2 Confining Hosts
For the investigations of discotic liquid crystals in confinement porous alumina oxide
membranes are used as hosts. Two types of alumina membranes have been tested:
Anapore Membranes (Whatman)
In order to optimize the filling conditions anopore inorganic membranes with differ-
ent pore sizes (25 nm, 100 nm, 200 nm) were purchased by Whatman. Due to the
non-uniform pore shapes of these membranes, they are not suitable to investigate the
31
5 Experimental Part
a b c
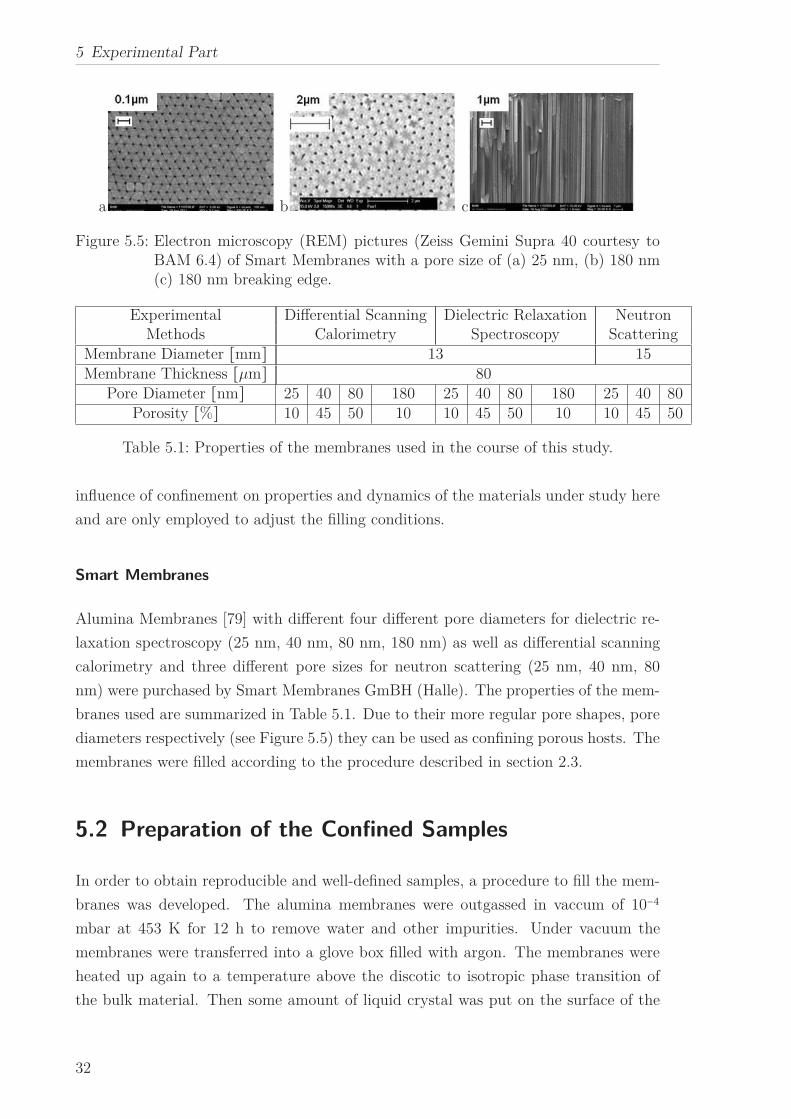
Figure 5.5: Electron microscopy (REM) pictures (Zeiss Gemini Supra 40 courtesy toBAM 6.4) of Smart Membranes with a pore size of (a) 25 nm, (b) 180 nm(c) 180 nm breaking edge.
Experimental Differential Scanning Dielectric Relaxation NeutronMethods Calorimetry Spectroscopy Scattering
Membrane Diameter [mm] 13 15Membrane Thickness [μm] 80
Pore Diameter [nm] 25 40 80 180 25 40 80 180 25 40 80Porosity [%] 10 45 50 10 10 45 50 10 10 45 50
Table 5.1: Properties of the membranes used in the course of this study.
influence of confinement on properties and dynamics of the materials under study here
and are only employed to adjust the filling conditions.
Smart Membranes
Alumina Membranes [79] with different four different pore diameters for dielectric re-
laxation spectroscopy (25 nm, 40 nm, 80 nm, 180 nm) as well as differential scanning
calorimetry and three different pore sizes for neutron scattering (25 nm, 40 nm, 80
nm) were purchased by Smart Membranes GmBH (Halle). The properties of the mem-
branes used are summarized in Table 5.1. Due to their more regular pore shapes, pore
diameters respectively (see Figure 5.5) they can be used as confining porous hosts. The
membranes were filled according to the procedure described in section 2.3.
5.2 Preparation of the Confined Samples
In order to obtain reproducible and well-defined samples, a procedure to fill the mem-
branes was developed. The alumina membranes were outgassed in vaccum of 10−4
mbar at 453 K for 12 h to remove water and other impurities. Under vacuum the
membranes were transferred into a glove box filled with argon. The membranes were
heated up again to a temperature above the discotic to isotropic phase transition of
the bulk material. Then some amount of liquid crystal was put on the surface of the
32
5.2 Preparation of the Confined Samples
a
0
100
200
T [K]
d m
/ d
T [
µg
/K]
weight loss
400 600 800 1000
0
20
40
60
80
100
m [%
]
b
400 600 800 1000
0
20
40
60
80
100
m [%
]
T [K]
weight loss
due to LC
residue 69.3%
(Membrane)
0
200
400
600
800
triphenylene core
d m
/ d
T [
µg
/K]
arms
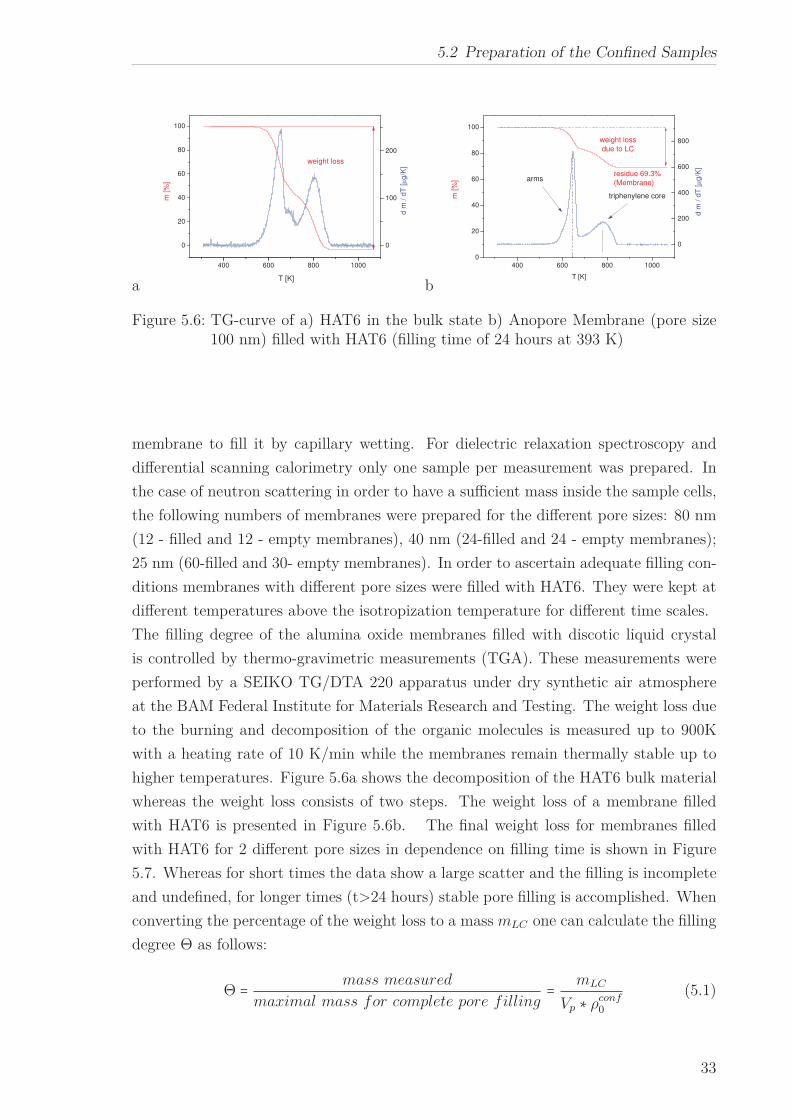
Figure 5.6: TG-curve of a) HAT6 in the bulk state b) Anopore Membrane (pore size100 nm) filled with HAT6 (filling time of 24 hours at 393 K)
membrane to fill it by capillary wetting. For dielectric relaxation spectroscopy and
differential scanning calorimetry only one sample per measurement was prepared. In
the case of neutron scattering in order to have a sufficient mass inside the sample cells,
the following numbers of membranes were prepared for the different pore sizes: 80 nm
(12 - filled and 12 - empty membranes), 40 nm (24-filled and 24 - empty membranes);
25 nm (60-filled and 30- empty membranes). In order to ascertain adequate filling con-
ditions membranes with different pore sizes were filled with HAT6. They were kept at
different temperatures above the isotropization temperature for different time scales.
The filling degree of the alumina oxide membranes filled with discotic liquid crystal
is controlled by thermo-gravimetric measurements (TGA). These measurements were
performed by a SEIKO TG/DTA 220 apparatus under dry synthetic air atmosphere
at the BAM Federal Institute for Materials Research and Testing. The weight loss due
to the burning and decomposition of the organic molecules is measured up to 900K
with a heating rate of 10 K/min while the membranes remain thermally stable up to
higher temperatures. Figure 5.6a shows the decomposition of the HAT6 bulk material
whereas the weight loss consists of two steps. The weight loss of a membrane filled
with HAT6 is presented in Figure 5.6b. The final weight loss for membranes filled
with HAT6 for 2 different pore sizes in dependence on filling time is shown in Figure
5.7. Whereas for short times the data show a large scatter and the filling is incomplete
and undefined, for longer times (t>24 hours) stable pore filling is accomplished. When
converting the percentage of the weight loss to a mass mLC one can calculate the filling
degree Θ as follows:
Θ = mass measured
maximal mass for complete pore filling= mLC
Vp ∗ ρconf0
(5.1)
33
5 Experimental Part
0 20 40 60 80
0
10
20
30
40
50 200 nm
20 nm
weig
ht lo
ss [%
]
Filling Time [h]
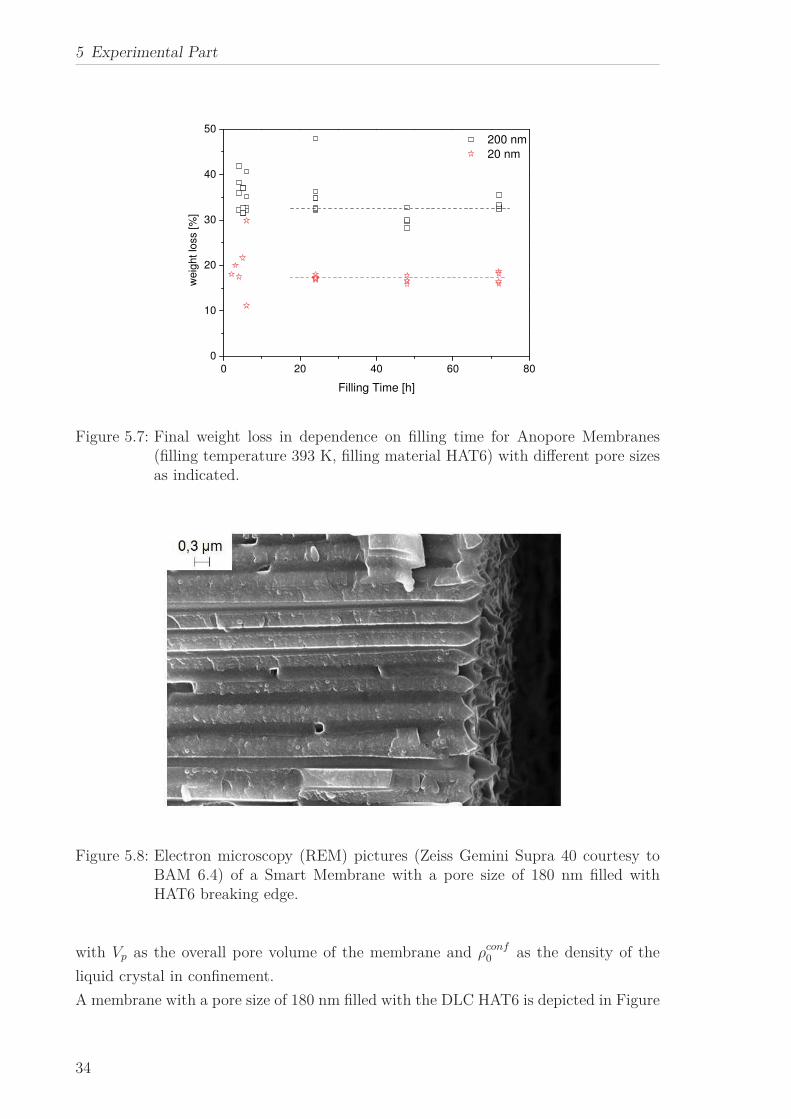
Figure 5.7: Final weight loss in dependence on filling time for Anopore Membranes(filling temperature 393 K, filling material HAT6) with different pore sizesas indicated.
Figure 5.8: Electron microscopy (REM) pictures (Zeiss Gemini Supra 40 courtesy toBAM 6.4) of a Smart Membrane with a pore size of 180 nm filled withHAT6 breaking edge.
with Vp as the overall pore volume of the membrane and ρconf0 as the density of the
liquid crystal in confinement.
A membrane with a pore size of 180 nm filled with the DLC HAT6 is depicted in Figure
34
5.2 Preparation of the Confined Samples
5.8.
35
5 Experimental Part
5.3 Experimental Techniques
5.3.1 Conventional Differential Scanning Calorimetry
Conventional Differential Scanning Calorimetry (DSC) was carried out on the heat
flow using a Seiko DSC 7020. The samples (∼ 10 mg) were measured in appropiate
temperature ranges with a heating and cooling rate of 10 Kmin−1. Nitrogen was used
as the protection gas.
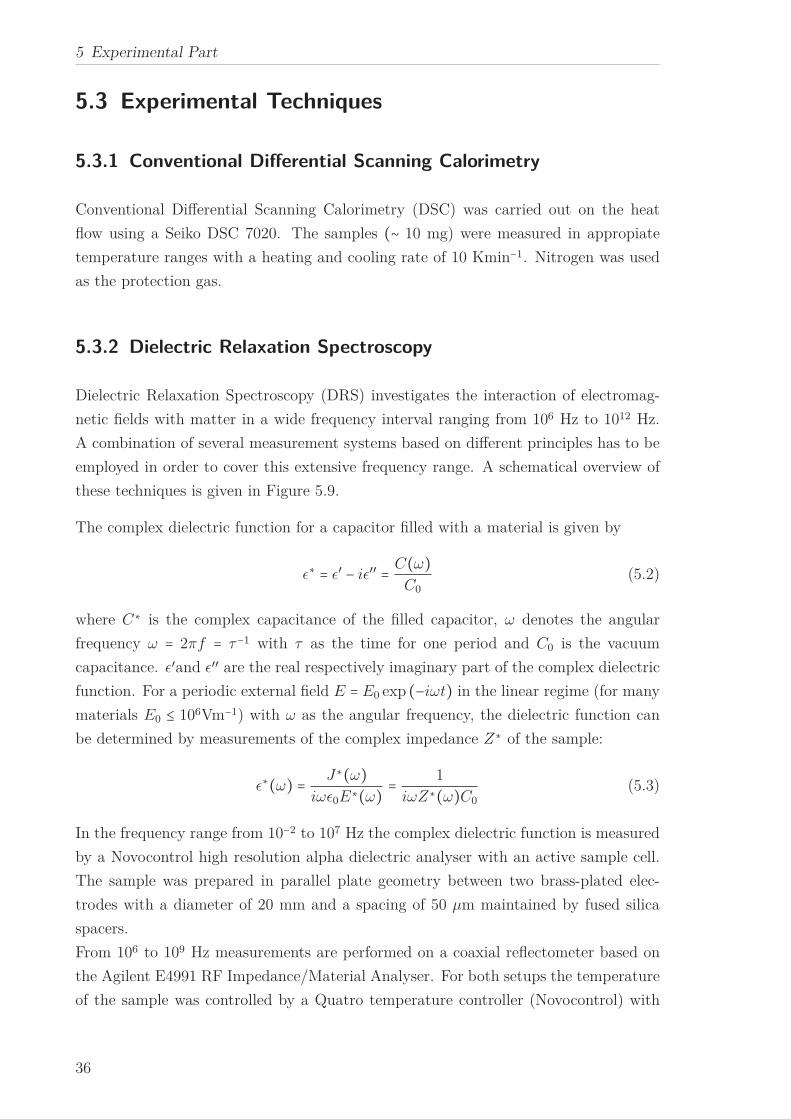
5.3.2 Dielectric Relaxation Spectroscopy
Dielectric Relaxation Spectroscopy (DRS) investigates the interaction of electromag-
netic fields with matter in a wide frequency interval ranging from 106 Hz to 1012 Hz.
A combination of several measurement systems based on different principles has to be
employed in order to cover this extensive frequency range. A schematical overview of
these techniques is given in Figure 5.9.
The complex dielectric function for a capacitor filled with a material is given by
ǫ∗ = ǫ′ − iǫ′′ = C(ω)C0
(5.2)
where C∗ is the complex capacitance of the filled capacitor, ω denotes the angular
frequency ω = 2πf = τ−1 with τ as the time for one period and C0 is the vacuum
capacitance. ǫ′and ǫ′′ are the real respectively imaginary part of the complex dielectric
function. For a periodic external field E = E0 exp (−iωt) in the linear regime (for many
materials E0 ≤ 106Vm−1) with ω as the angular frequency, the dielectric function can
be determined by measurements of the complex impedance Z∗ of the sample:
ǫ∗(ω) = J∗(ω)iωǫ0E∗(ω) = 1
iωZ∗(ω)C0
(5.3)
In the frequency range from 10−2 to 107 Hz the complex dielectric function is measured
by a Novocontrol high resolution alpha dielectric analyser with an active sample cell.
The sample was prepared in parallel plate geometry between two brass-plated elec-
trodes with a diameter of 20 mm and a spacing of 50 μm maintained by fused silica
spacers.
From 106 to 109 Hz measurements are performed on a coaxial reflectometer based on
the Agilent E4991 RF Impedance/Material Analyser. For both setups the temperature
of the sample was controlled by a Quatro temperature controller (Novocontrol) with
36
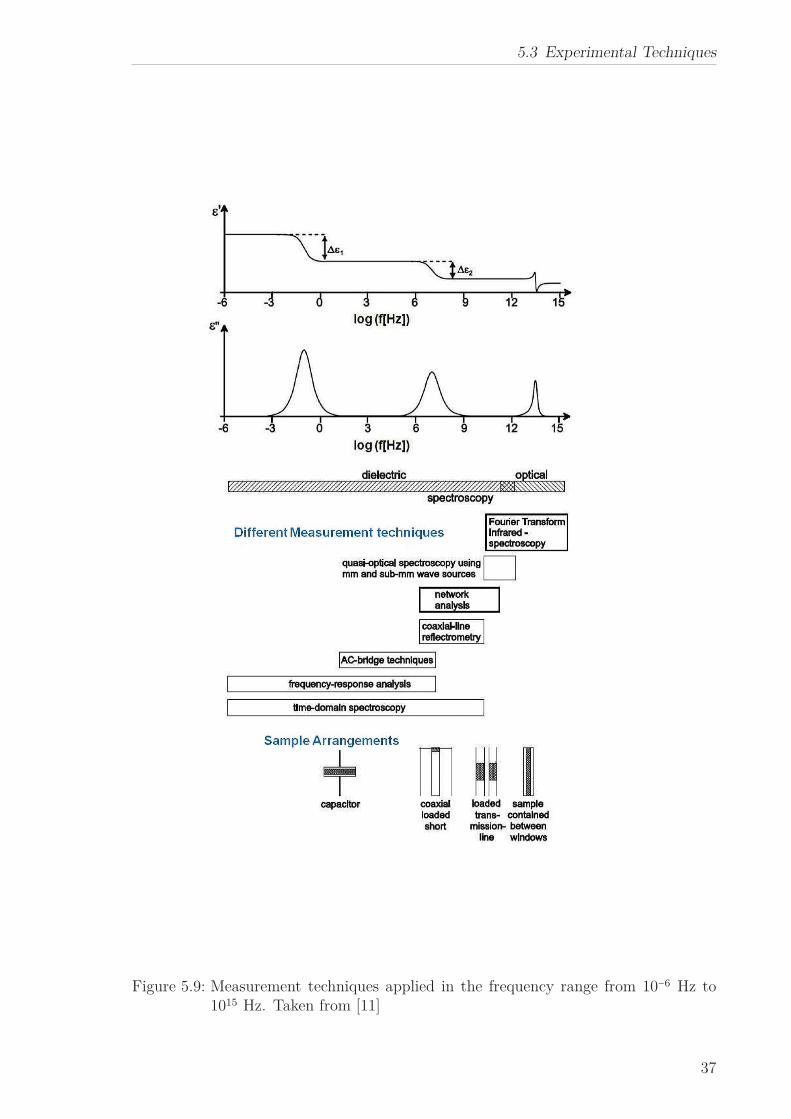
5.3 Experimental Techniques
Figure 5.9: Measurement techniques applied in the frequency range from 10−6 Hz to1015 Hz. Taken from [11]
37
5 Experimental Part
log (f)
ε'
log ε
''
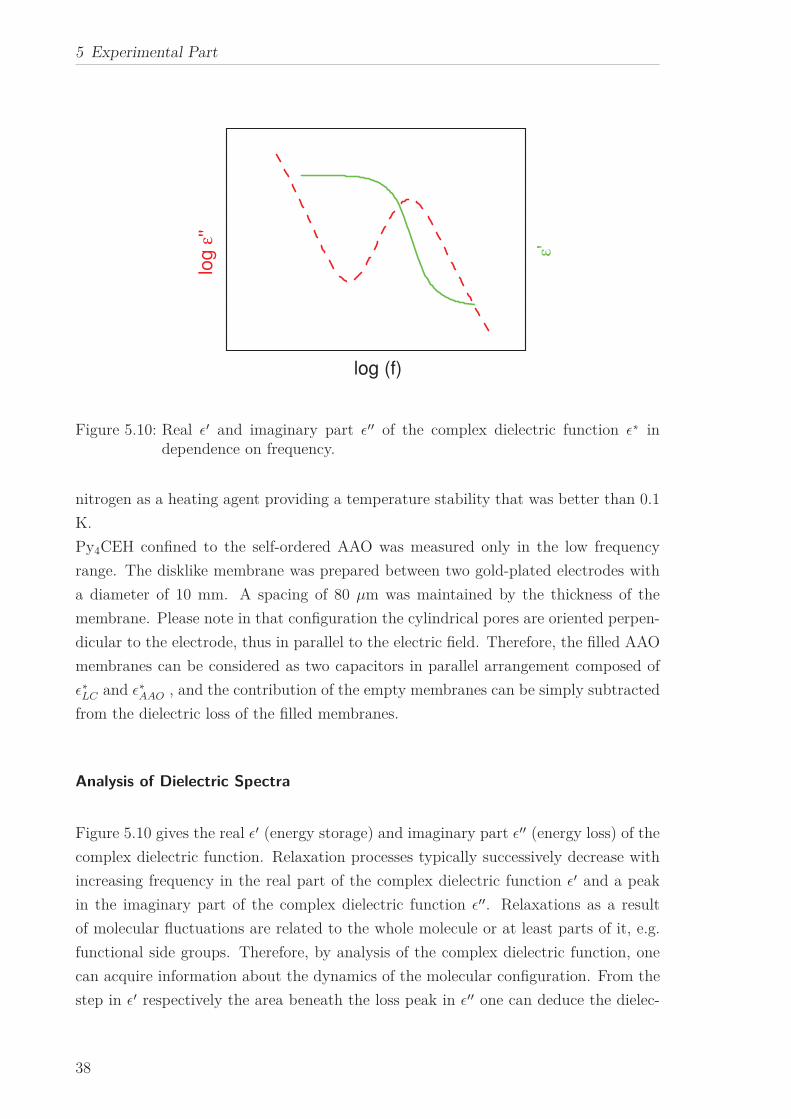
Figure 5.10: Real ǫ′ and imaginary part ǫ′′ of the complex dielectric function ǫ∗ independence on frequency.
nitrogen as a heating agent providing a temperature stability that was better than 0.1
K.
Py4CEH confined to the self-ordered AAO was measured only in the low frequency
range. The disklike membrane was prepared between two gold-plated electrodes with
a diameter of 10 mm. A spacing of 80 μm was maintained by the thickness of the
membrane. Please note in that configuration the cylindrical pores are oriented perpen-
dicular to the electrode, thus in parallel to the electric field. Therefore, the filled AAO
membranes can be considered as two capacitors in parallel arrangement composed of
ǫ∗LC and ǫ∗AAO , and the contribution of the empty membranes can be simply subtracted
from the dielectric loss of the filled membranes.
Analysis of Dielectric Spectra
Figure 5.10 gives the real ǫ′ (energy storage) and imaginary part ǫ′′ (energy loss) of the
complex dielectric function. Relaxation processes typically successively decrease with
increasing frequency in the real part of the complex dielectric function ǫ′ and a peak
in the imaginary part of the complex dielectric function ǫ′′. Relaxations as a result
of molecular fluctuations are related to the whole molecule or at least parts of it, e.g.
functional side groups. Therefore, by analysis of the complex dielectric function, one
can acquire information about the dynamics of the molecular configuration. From the
step in ǫ′ respectively the area beneath the loss peak in ǫ′′ one can deduce the dielec-
38
5.3 Experimental Techniques
tric strength ∆ǫ of the corresponding process. The frequency of the loss peak fmax is
also connected to the characteristic relaxation rate ωmax = 2πfmax or relaxation time
τp = 1/ωmax. The distribution of relaxation times can be determined from the shape of
the loss peak.
Neglecting inertia effects and under the assumption that the polarization changes pro-
portional to its actual value, a simple approach to determine the time dependence of
dielectric behaviour is as follows:
d P (t)dt
= − 1
τD
P (t) (5.4)
where τD denotes the characteristic relaxation time. Equation (5.4) results in an expo-
nential decay for the correlation φ(τ) = exp(−t/τD) delivering for the complex dielectric
function ǫ∗(ω):ǫ∗(ω) = ǫ∞ + ∆ǫ
1 + iωτD
(5.5)
where ∆ǫ = ǫS − ǫ∞ represents the dielectric strength with ǫS = limωτ≪1 ǫ′(ω) and
ǫ∞ = limωτ≫1 ǫ′(ω). The Debye relaxation time is connected to the frequency of the
maximal loss fmax by ωp = 2πfp = 1/τD. The real and imaginary parts of the complex
dielectric function are expressed as follows:
ǫ′(ω) = 1
1 + (ωτD)2ǫ′′(ω) = ωτD
1 + (ωτD)2(5.6)
The Debye function predicts a symmetric loss peak with a half width wD of 1.14
decades.[11] Only very few materials exhibit Debye behaviour, typically one observes
much broader peaks (up to 6 decades) and furthermore an asymmetric relaxation curve
with a high frequency tail in many cases. Therefore, a number of generalizations of the
Debye function have been made to be able to describe broadened as well as asymmetric
loss peaks. The Cole/Cole(CC)-function includes a broadening of the dielectric function
ǫ∗CC(ω) = ǫ∞ + ∆ǫ
1 + (iωτCC)β(5.7)
where 0 < β ≤ 1 denotes the symmetrical broadening of ǫ∗, β = 1 delivers the Debye
function again. The position of the maximum of ǫ′′ is obtained by the Cole-/Cole
relaxation time τCC = 1/ωmax = 1/(2πfmax). The asymmetric broadening observed in
many measurements, mainly those of liquids or low molecular glass forming materials,
can be described by the Cole/Davidson(CD)-function written as:
ǫ∗CD(ω) = ǫ∞ + ∆ǫ
(1 + iωτCD)γ(5.8)
39
5 Experimental Part
where 0 < γ ≤ 1 results in an asymmetrical broadening of ǫ∗ for ω > 1/τCD with
τCD as the Cole-Davidson relaxation time. For γ = 1 the Debye-function ist obtained
again. It is important to note that for the asymmetrical Cole-Davidson function, the
characteristic relaxation time differs from the relaxation time corresponding to the
peak position ωp in ǫ′′. The relationship between both values is determined by the
shape parameter:
ωp = 1
τCD
tan
⎡⎢⎢⎢⎢⎣π
2γ + 2
⎤⎥⎥⎥⎥⎦(5.9)
Havriliak and Negami [80] suggested a more generalized model function (HN-function)
in including a symmetric as well as an asymmetric broadening:
ǫ∗HN = ǫ∞ + ∆ǫ
(1 + (iωτHN)β)γ(5.10)
where β and γ describe the symmetric respectively the asymmetric broadening of the
complex dielectric function. The real and imaginary parts of the Havrilak-Negami-
function are expressed as:
ǫ′(ω) = ǫ∞ + (ǫs − ǫ∞) cos γφ
1 + 2(ωτ0)β sin(π2)(1 − β) + (ωτ0)2β
ǫ′′(ω) = (ǫs − ǫ∞)sinγφ
1 + 2(ωτ0)β sin(π2)(1 − β) + (ωτ0)2β
φ = tan−1(ωτHN)β cos(π
2)(1 − β)
1 + (ωτHN)β sin(π2)(1 − β)
(5.11)
The peak position fmax in ǫ′′ is given by
fmax = ωmax
2π= 1
2πτHN
⎡⎢⎢⎢⎢⎣sin
βπ
2 + 2γ
⎤⎥⎥⎥⎥⎦1/β⎡⎢⎢⎢⎢⎣
sinβγπ
2 + 2γ
⎤⎥⎥⎥⎥⎦−1/β
(5.12)
These shape paramaters are linked to the restricting behaviour of ǫ∗ at low and high
frequencies:
ǫS − ǫ′(ω) ∼ ωm; ǫ′′ ∼ ωm for ω ≪ 1/τHN with m = β (5.13)
ǫ′ω − ǫ∞ ∼ ω−n; ǫ′′ω ∼ ω−n ω ≫ 1/τHN with n = βγ (5.14)
40
5.3 Experimental Techniques
The Debye theory of dielectric relaxation generalized by Kirkwood and Fröhlich gives
for the dielectric relaxation strength
∆ǫ = 1
3ǫ0
gμ2
kBT
N
V(5.15)
where μ is the dipole moment related to the process under consideration and N/V
is the number density of the dipoles involved. g is the Kirkwood-Fröhlich correlation
factor which describes the static correlation between the dipoles. kB is the Boltzmann’s
constant. The Onsager factor covering internal field effects is omitted for the sake of
simplicity.
Charge transport process at higher temperatures and lower frequencies can analyzed
by considering the complex modulus
M∗ = 1
ǫ∗= M ′′ + iM ′′ (5.16)
where M′
is the real part and M ′′ loss or imaginary part. For conductivity a peak is
observed in the imaginary part M′′[6]. Similar to the relaxation processes it can be
analyzed by fitting the loss part of HNequation to corresponding data. One obtains
a characteristic rate fmax,con for the conductivity which can be compared to the other
relaxation rates.
5.3.3 Specific Heat Spectroscopy
The thermal fluctuations of the discotic liquid crystal Py4CEH were studied by a
combination of Temperature Modulated DSC (TMDSC) and AC chip calorimetry. The
temperature is periodically varied with a frequency f. If relaxation processes take place
in the sample a phase shift between the heating and heat flow rate is observed.The
measurements result in a complex heat capacity
c∗p(f) = c′p(f) − ic′′p(f) (5.17)
where c′ and c′′ represent the real, imaginary respectively part of the complex heat
capacity.[81, 82, 83, 84, 85, 86] At low frequencies cp(f) was obtained by step scan
calorimetry, a special variant of TMDSC using a Perkin Elmer Diamond DSC. These
measurements were carried out in the Polymer Physics group of Professor Christoph
Schick at the University of Rostock. The sample (sample mass = 30.17 mg) was
quenched from room temperature, where the material is in the liquid crystalline phase,
to 178 K to avoid crystallization. The step length duration in TMDSC measurements
41
5 Experimental Part
correspond to the frequency range from 10−3 to 4.8 × 10⁻² Hz from a base frequency
(f = 10−3 Hz) with available harmonics.[87] Nitrogen was used as the protection gas to
avoid degradation. The dynamic glass transition temperature was estimated by fitting
Gaussians to the data of the phase angle tan δ = c′′p/c′p which has to be corrected for
heat conductivity effects. For details see references [88] and [89].
At higher frequencies specific heat spectroscopy was performed using a differential AC
chip calorimeter [81] with a sensitivity of pJK−1. Because of this high sensitivity only
a low sample mass (∼ ng) of material is required. The differential setup developed by
Schick et al. [81] is employed where the calorimeter chip XEN 39390 (Xensor Inte-
gration, Nl) is used as the measuring cell. The differential approach will minimize the
contribution of the heat capacity of the empty sensor to the measured data. In the
approximation of thin films (submicron) the heat capacity of the sample CS is then
given by
CS = iωC(∆U − ∆U0)/P0S (5.18)
where C = C0 + G/iω denotes the effective heat capacity of the empty sensor where
G/iω is the heat loss through the surrounding atmosphere, S is the sensitivity of the
thermopile, P0 is the applied heating power, ∆U is the complex differential thermopile
signal for an empty and a sensor with a sample, and ∆U0 is the complex differential
voltage measured for two empty sensors. For identical sensors, ∆U0 = 0 holds.
The measured complex differential voltage ∆U is taken as a measure for c∗p(f) compared
with the complex dielectric function. On the AC calorimeter chip, heaters as well as
thermopiles are arranged as described in [90]. The heat capacity of the system is
measured by the temperature change sensed by the thermopiles in a lock-in approach
(complex voltage). For details see references [84] and [86]. The frequency was swept
from 1 Hz to 1000 Hz under isothermal conditions; this means the mean temperature
was kept constant during the sweep. The temperature was changed from 193 K to
243 K in steps of 2 K. The sample was also kept in a nitrogen atmosphere to avoid
degradation. The amplitude of the complex differential voltage is analyzed as a function
of temperature at a fixed frequency. At the glass transition the real part shows a step-
like change and a dynamic glass transition temperature can be determined by the half
step position of amplitude as a function of the frequency.[91]
5.3.4 X-ray Scattering
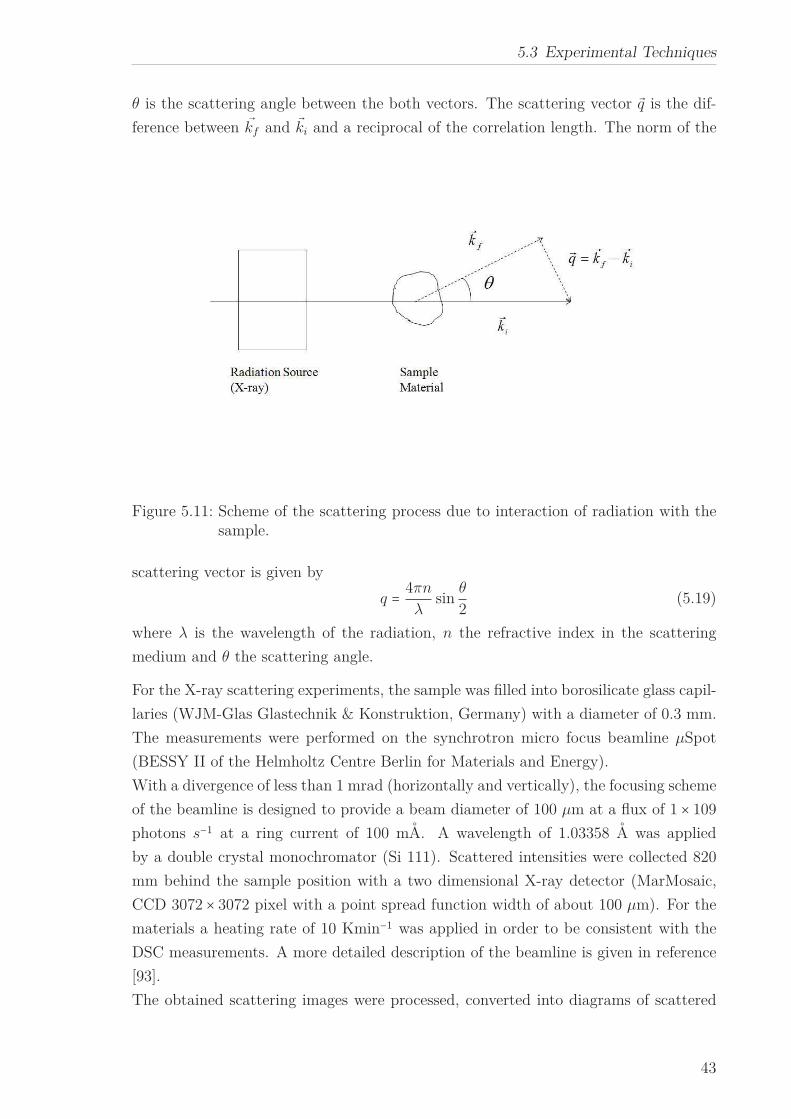
Figure 5.11 gives the geometry of a typical scattering experiment. Interaction of radia-
tion with a material leads to scattering or diffraction as result of spatial and temporal
correlations in the sample.[92] kf and ki denote the scattered and incident vector and
42
5.3 Experimental Techniques
θ is the scattering angle between the both vectors. The scattering vector q is the dif-
ference between kf and ki and a reciprocal of the correlation length. The norm of the
Figure 5.11: Scheme of the scattering process due to interaction of radiation with thesample.
scattering vector is given by
q = 4πn
λsin
θ
2(5.19)
where λ is the wavelength of the radiation, n the refractive index in the scattering
medium and θ the scattering angle.
For the X-ray scattering experiments, the sample was filled into borosilicate glass capil-
laries (WJM-Glas Glastechnik & Konstruktion, Germany) with a diameter of 0.3 mm.
The measurements were performed on the synchrotron micro focus beamline μSpot
(BESSY II of the Helmholtz Centre Berlin for Materials and Energy).
With a divergence of less than 1 mrad (horizontally and vertically), the focusing scheme
of the beamline is designed to provide a beam diameter of 100 μm at a flux of 1 × 10⁹
photons s−1 at a ring current of 100 mA. A wavelength of 1.03358 A was applied
by a double crystal monochromator (Si 111). Scattered intensities were collected 820
mm behind the sample position with a two dimensional X-ray detector (MarMosaic,
CCD 3072 × 3072 pixel with a point spread function width of about 100 μm). For the
materials a heating rate of 10 Kmin−1 was applied in order to be consistent with the
DSC measurements. A more detailed description of the beamline is given in reference
[93].
The obtained scattering images were processed, converted into diagrams of scattered
43
5 Experimental Part
intensities versus scattering vector q and employing an algorithm of the computer pro-
gram FIT2D.[94]
Taking the maximum position qmax the core-core distance dcc is calculated according
to [95, 2]
dcc = 4π√3qmax
(5.20)
44
5.3 Experimental Techniques
5.3.5 Neutron Scattering
Neutron Scattering can monitor the movements of atoms and molecules on microscopic
time scale. The energy and momentum exchanged during the experiment between
neutrons and the sample gives information about space and time.
The double differential cross section is written as
d2Ω/dΩdω = 1/4πkf/ki(σcohScoh(q, ω) + σincSinc(q, ω)) (5.21)
where ki and kf are the incident and final wave vectors of the neutron beam, q the
momentum transfer vector, Ω the space angle of detection, S(q, ω) the so-called scat-
tering function, σ the scattering cross-sections for coherent and incoherent scattering,
ω the angular frequency to energy transfer ∆E which reads
ω = ∆E
h(5.22)
This law can be also written in terms of correlation functions. S(q, ω) is linked by
Fourier transformation (FT) to the intermediate scattering function S(q, t):S(q, ω) = 1/2π ∫ ∞
−∞S(q, t) exp−iωt dt (5.23)
One has to distinguish between a coherent and an incoherent variant of the scattering
function. The coherent variant corresponding to the pair correlation reads
Scoh = 1/N N∑i=1
N∑j=1
⟨expiqri(0) exp−iqrj(t)⟩ (5.24)
where ⟨ ⟩ denotes the thermal averages. The incoherent scattering function dominat-
ing most experiments on polymers and organic liquids is given by
Sinc = 1/N N∑i=1
⟨expiqri(0) exp−iqri(t)⟩ (5.25)
By inverse Fourier Transformation Scoh(q, t) is linked to the van Hove pair correlation
function
G(r, t) = 1
(2π)3 ∫ ∞
−∞e−i(qr−ωt)Scoh(q, t)d3qdω = 1
N
N∑i,j=1
δ(r−ri(0))δ(r−rj(t)) = ⟨ρ(0, 0)ρ(r, t)⟩(5.26)
45
5 Experimental Part
and the self correlation function
G(r, t) = 1
(2π)3 ∫ ∞
−∞e−i(qr−ωt)Sinc(q, t)d3qdω = 1
N
N∑i=1
δ(r − ri(0))δ(r − ri(t)) (5.27)
Measurement of the Vibrational Density of states by Time of Flight
Spectroscopy
Time of Flight Spectroscopy is used to determine the vibrational density of states,
measurements were carried out at IN6 at the ILL Grenoble and FOCUS at the Paul
Scherrer Institute. As an example for a TOF spectrometer the layout of IN6 is given
in Figure 5.12. The wavelength λ of the neutrons analogously to photons according to
the de Broglie relationship is
λ = h
mv(5.28)
where h is the Planck constant, m the neutron mass and v the velocity. The higher the
veleocity of a beam of neutrons created at the same time, the lower is their wavelength.
The kinetic energy is determined via a chopper system. The neutrons are scattered
at the sample and then collected by an array of detectors. The time it takes the
neutrons to cross the distance between the sample and the detector is measured and
gives information about the energy exchange (resolution meV) between the neutron
and the sample. The program INX [96] was used to correct the data for background
and adsorption. The VDOS was measured at 80 K. The resolution of the instrument
was obtained by measuring the sample under investigation at 2 K where all molecular
motion and vibrations are frozen. To correct the data of the filled membranes for the
scattering of the host materials the empty membranes were also measured at 2 and 80
K. The membranes were cleaned as described in 5.2 and sealed into the measuring cell
used for neutron scattering under Argon atmosphere.
Figure 5.13 gives the spectra of HAT10 as measured by IN6 normalized to the height
of the elastic peak. In order to separate the parts from the resolution and from low-
energy vibrations the standard expression for the one-phonon scattering function is
applied :
S(q, ω) = exp−2W (q) (δ(ω) + hq2
2m
g(ω)−ω
× 1 − exp( hω
kBT)−1) (5.29)
where exp−2W q is the Debye-Waller factor and m the average mass of an atom. The
observed scattering law is the convolution of (5.21)with the resolution function of the
instrument. The convolution effect of the inelastic term can be omitted because the
46
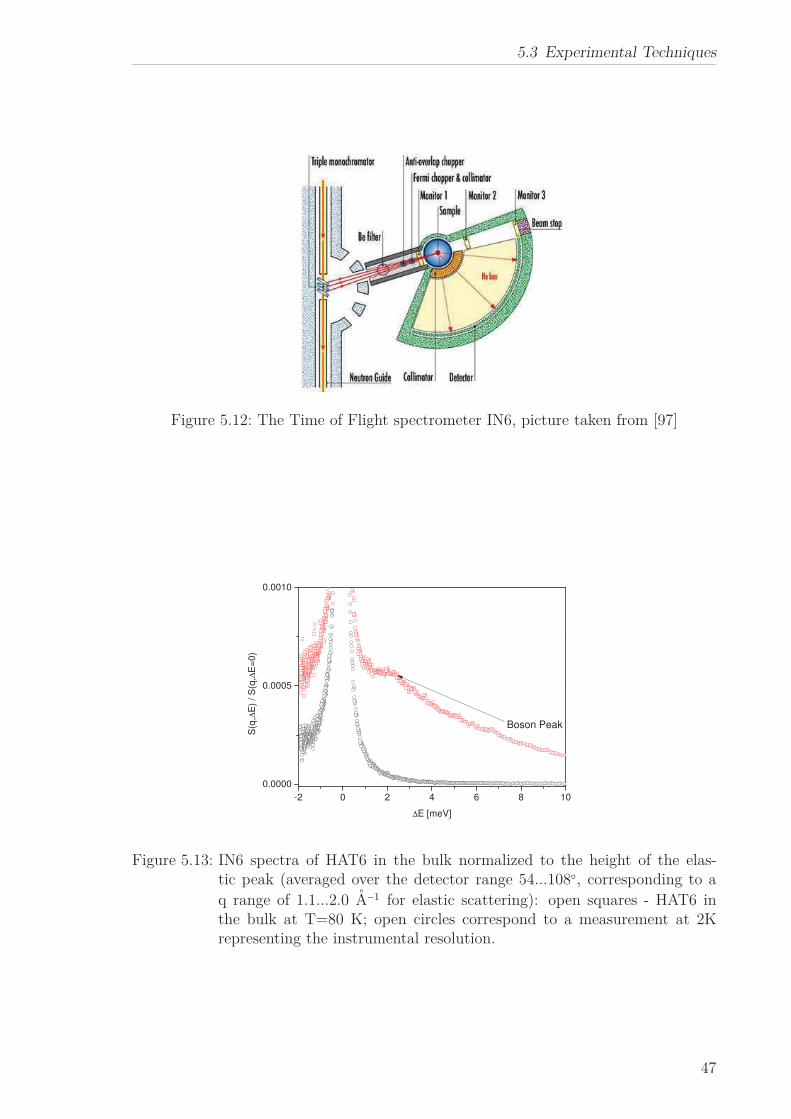
5.3 Experimental Techniques
Figure 5.12: The Time of Flight spectrometer IN6, picture taken from [97]
-2 0 2 4 6 8 10
0.0000
0.0005
0.0010
S(q
,∆E
) / S
(q,∆
E=
0)
∆E [meV]
Boson Peak
Figure 5.13: IN6 spectra of HAT6 in the bulk normalized to the height of the elas-tic peak (averaged over the detector range 54...108, corresponding to a
q range of 1.1...2.0 A−1 for elastic scattering): open squares - HAT6 inthe bulk at T=80 K; open circles correspond to a measurement at 2Krepresenting the instrumental resolution.
47
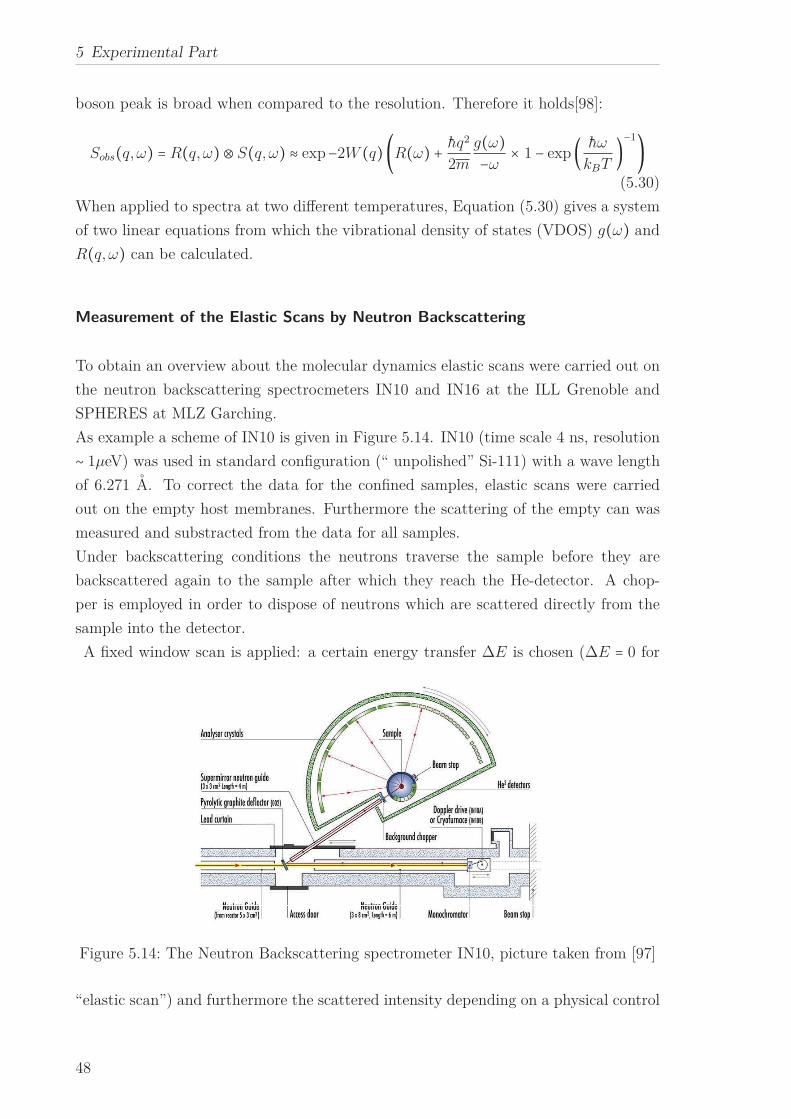
5 Experimental Part
boson peak is broad when compared to the resolution. Therefore it holds[98]:
Sobs(q, ω) = R(q, ω) ⊗ S(q, ω) ≈ exp−2W (q)(R(ω) + hq2
2m
g(ω)−ω
× 1 − exp( hω
kBT)−1)(5.30)
When applied to spectra at two different temperatures, Equation (5.30) gives a system
of two linear equations from which the vibrational density of states (VDOS) g(ω) and
R(q, ω) can be calculated.
Measurement of the Elastic Scans by Neutron Backscattering
To obtain an overview about the molecular dynamics elastic scans were carried out on
the neutron backscattering spectrocmeters IN10 and IN16 at the ILL Grenoble and
SPHERES at MLZ Garching.
As example a scheme of IN10 is given in Figure 5.14. IN10 (time scale 4 ns, resolution
∼ 1μeV) was used in standard configuration (“ unpolished” Si-111) with a wave length
of 6.271 A. To correct the data for the confined samples, elastic scans were carried
out on the empty host membranes. Furthermore the scattering of the empty can was
measured and substracted from the data for all samples.
Under backscattering conditions the neutrons traverse the sample before they are
backscattered again to the sample after which they reach the He-detector. A chop-
per is employed in order to dispose of neutrons which are scattered directly from the
sample into the detector.
A fixed window scan is applied: a certain energy transfer ∆E is chosen (∆E = 0 for
Figure 5.14: The Neutron Backscattering spectrometer IN10, picture taken from [97]
“elastic scan”) and furthermore the scattered intensity depending on a physical control
48
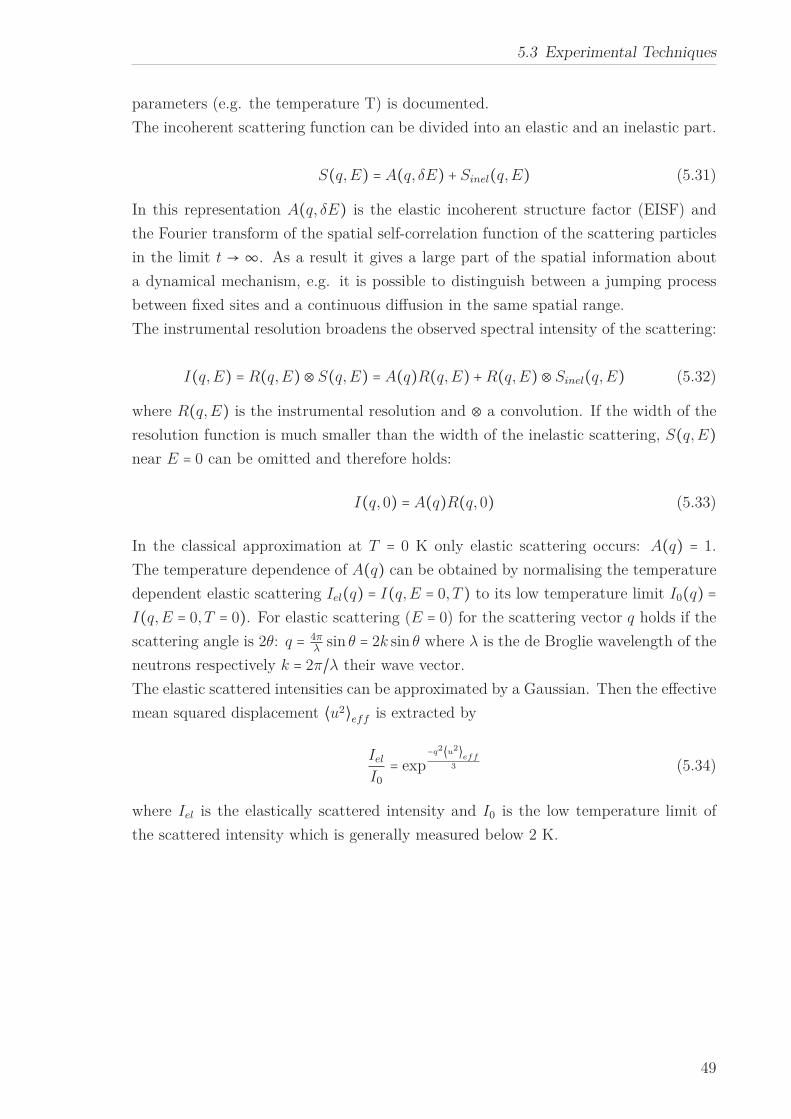
5.3 Experimental Techniques
parameters (e.g. the temperature T) is documented.
The incoherent scattering function can be divided into an elastic and an inelastic part.
S(q, E) = A(q, δE) + Sinel(q, E) (5.31)
In this representation A(q, δE) is the elastic incoherent structure factor (EISF) and
the Fourier transform of the spatial self-correlation function of the scattering particles
in the limit t → ∞. As a result it gives a large part of the spatial information about
a dynamical mechanism, e.g. it is possible to distinguish between a jumping process
between fixed sites and a continuous diffusion in the same spatial range.
The instrumental resolution broadens the observed spectral intensity of the scattering:
I(q, E) = R(q, E) ⊗ S(q, E) = A(q)R(q, E) + R(q, E) ⊗ Sinel(q, E) (5.32)
where R(q, E) is the instrumental resolution and ⊗ a convolution. If the width of the
resolution function is much smaller than the width of the inelastic scattering, S(q, E)near E = 0 can be omitted and therefore holds:
I(q, 0) = A(q)R(q, 0) (5.33)
In the classical approximation at T = 0 K only elastic scattering occurs: A(q) = 1.
The temperature dependence of A(q) can be obtained by normalising the temperature
dependent elastic scattering Iel(q) = I(q, E = 0, T ) to its low temperature limit I0(q) =I(q, E = 0, T = 0). For elastic scattering (E = 0) for the scattering vector q holds if the
scattering angle is 2θ: q = 4πλ
sin θ = 2k sin θ where λ is the de Broglie wavelength of the
neutrons respectively k = 2π/λ their wave vector.
The elastic scattered intensities can be approximated by a Gaussian. Then the effective
mean squared displacement ⟨u2⟩eff is extracted by
Iel
I0
= exp−q2⟨u2⟩
eff
3 (5.34)
where Iel is the elastically scattered intensity and I0 is the low temperature limit of
the scattered intensity which is generally measured below 2 K.
49

5 Experimental Part
50
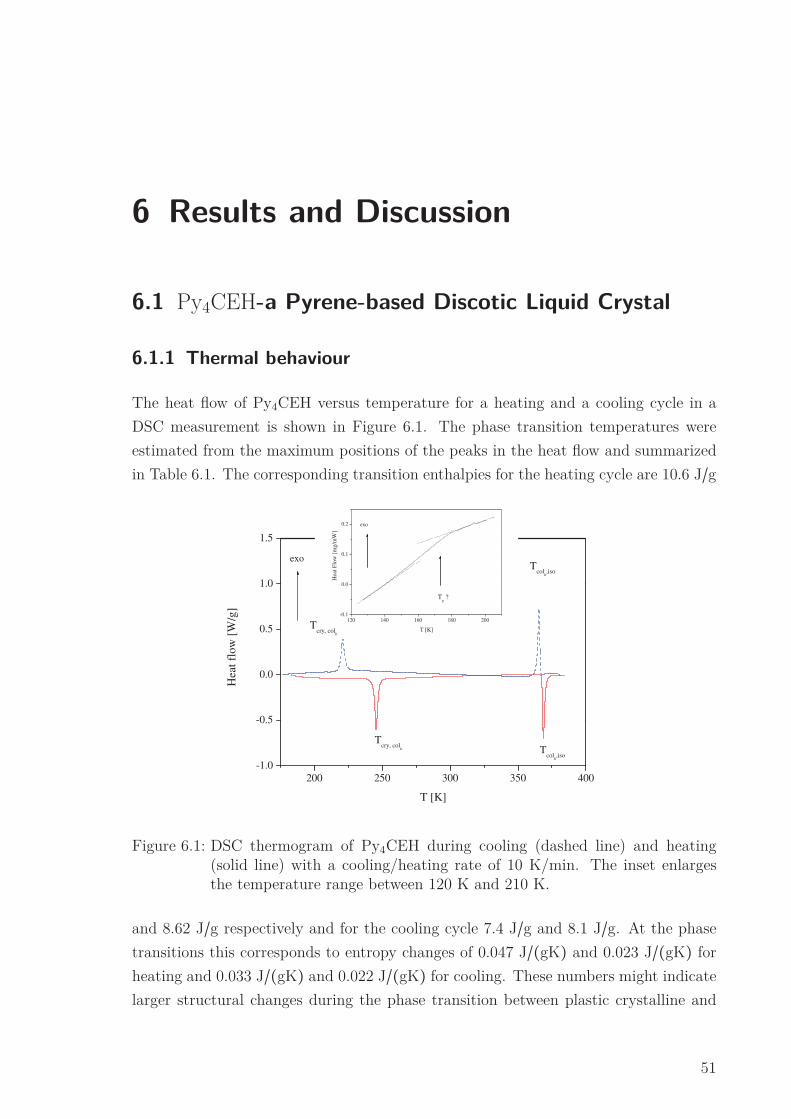
6 Results and Discussion
6.1 Py4CEH-a Pyrene-based Discotic Liquid Crystal
6.1.1 Thermal behaviour
The heat flow of Py4CEH versus temperature for a heating and a cooling cycle in a
DSC measurement is shown in Figure 6.1. The phase transition temperatures were
estimated from the maximum positions of the peaks in the heat flow and summarized
in Table 6.1. The corresponding transition enthalpies for the heating cycle are 10.6 J/g
200 250 300 350 400-1.0
-0.5
0.0
0.5
1.0
1.5
120 140 160 180 200-0.1
0.0
0.1
0.2
Tcol
h,iso
Tcry, col
h
Tcol
h,iso
Hea
t flo
w [
W/g
]
T [K]
Tcry, col
h
exo
Hea
t Flo
w [
mg/
mW
]
T [K]
Tg ?
exo
Figure 6.1: DSC thermogram of Py4CEH during cooling (dashed line) and heating(solid line) with a cooling/heating rate of 10 K/min. The inset enlargesthe temperature range between 120 K and 210 K.
and 8.62 J/g respectively and for the cooling cycle 7.4 J/g and 8.1 J/g. At the phase
transitions this corresponds to entropy changes of 0.047 J/(gK) and 0.023 J/(gK) for
heating and 0.033 J/(gK) and 0.022 J/(gK) for cooling. These numbers might indicate
larger structural changes during the phase transition between plastic crystalline and
51
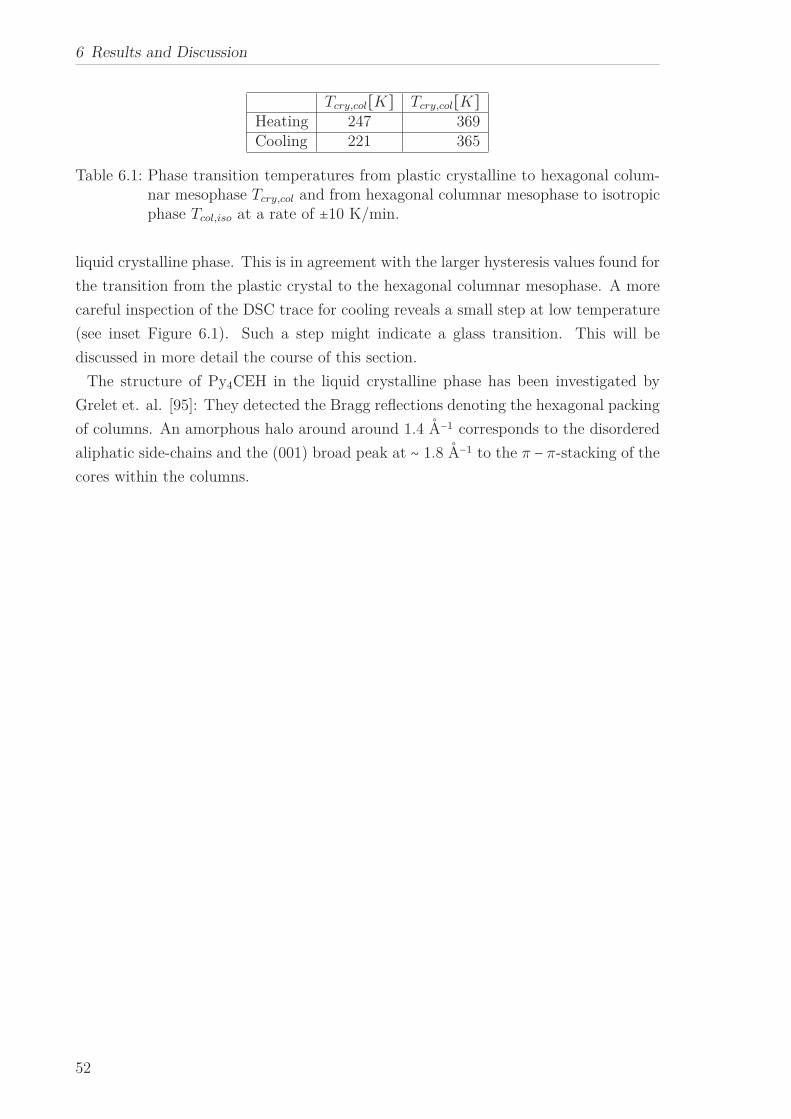
6 Results and Discussion
Tcry,col[K] Tcry,col[K]Heating 247 369Cooling 221 365
Table 6.1: Phase transition temperatures from plastic crystalline to hexagonal colum-nar mesophase Tcry,col and from hexagonal columnar mesophase to isotropicphase Tcol,iso at a rate of ±10 K/min.
liquid crystalline phase. This is in agreement with the larger hysteresis values found for
the transition from the plastic crystal to the hexagonal columnar mesophase. A more
careful inspection of the DSC trace for cooling reveals a small step at low temperature
(see inset Figure 6.1). Such a step might indicate a glass transition. This will be
discussed in more detail the course of this section.
The structure of Py4CEH in the liquid crystalline phase has been investigated by
Grelet et. al. [95]: They detected the Bragg reflections denoting the hexagonal packing
of columns. An amorphous halo around around 1.4 A−1 corresponds to the disordered
aliphatic side-chains and the (001) broad peak at ∼ 1.8 A−1 to the π − π-stacking of the
cores within the columns.
52
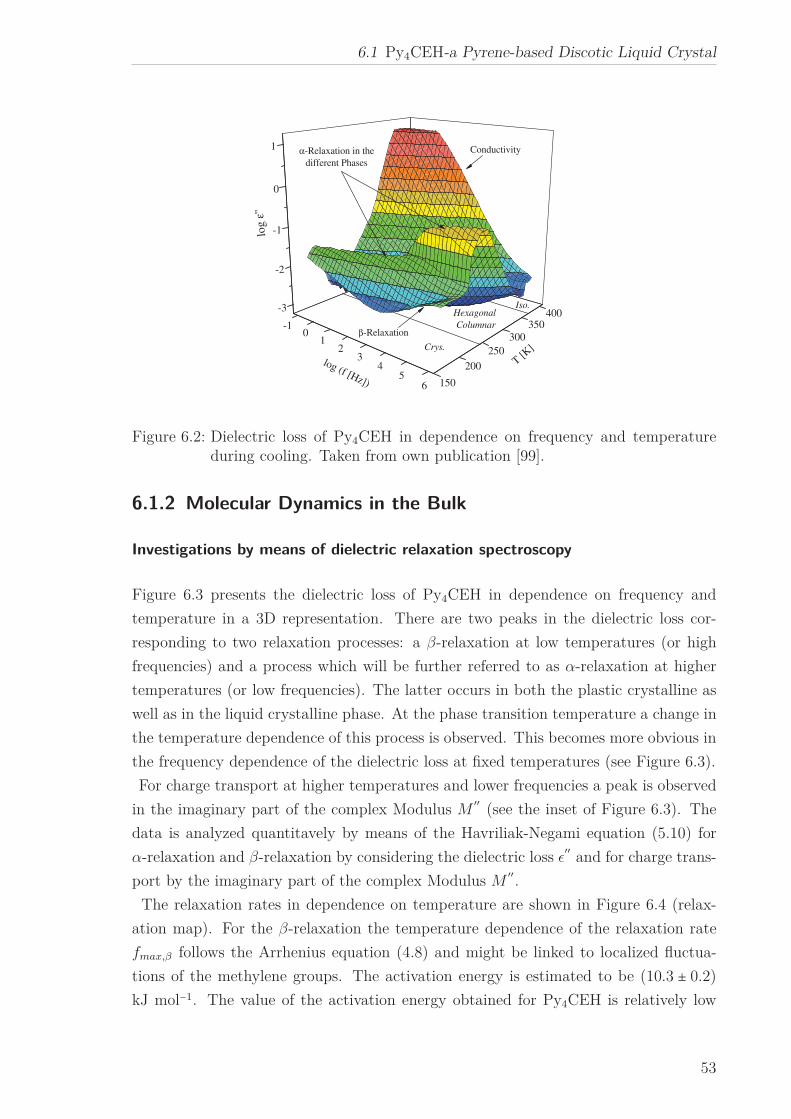
6.1 Py4CEH-a Pyrene-based Discotic Liquid Crystal
-10
12
34
56
-3
-2
-1
0
1
150
200250
300350
400
β-Relaxation
α-Relaxation in thedifferent Phases
Conductivity
Iso.Hexagonal Columnar
log
ε''
T [K]
log (f [Hz])
Crys.
Figure 6.2: Dielectric loss of Py4CEH in dependence on frequency and temperatureduring cooling. Taken from own publication [99].
6.1.2 Molecular Dynamics in the Bulk
Investigations by means of dielectric relaxation spectroscopy
Figure 6.3 presents the dielectric loss of Py4CEH in dependence on frequency and
temperature in a 3D representation. There are two peaks in the dielectric loss cor-
responding to two relaxation processes: a β-relaxation at low temperatures (or high
frequencies) and a process which will be further referred to as α-relaxation at higher
temperatures (or low frequencies). The latter occurs in both the plastic crystalline as
well as in the liquid crystalline phase. At the phase transition temperature a change in
the temperature dependence of this process is observed. This becomes more obvious in
the frequency dependence of the dielectric loss at fixed temperatures (see Figure 6.3).
For charge transport at higher temperatures and lower frequencies a peak is observed
in the imaginary part of the complex Modulus M′′
(see the inset of Figure 6.3). The
data is analyzed quantitavely by means of the Havriliak-Negami equation (5.10) for
α-relaxation and β-relaxation by considering the dielectric loss ǫ′′
and for charge trans-
port by the imaginary part of the complex Modulus M′′.
The relaxation rates in dependence on temperature are shown in Figure 6.4 (relax-
ation map). For the β-relaxation the temperature dependence of the relaxation rate
fmax,β follows the Arrhenius equation (4.8) and might be linked to localized fluctua-
tions of the methylene groups. The activation energy is estimated to be (10.3 ± 0.2)
kJ mol−1. The value of the activation energy obtained for Py4CEH is relatively low
53
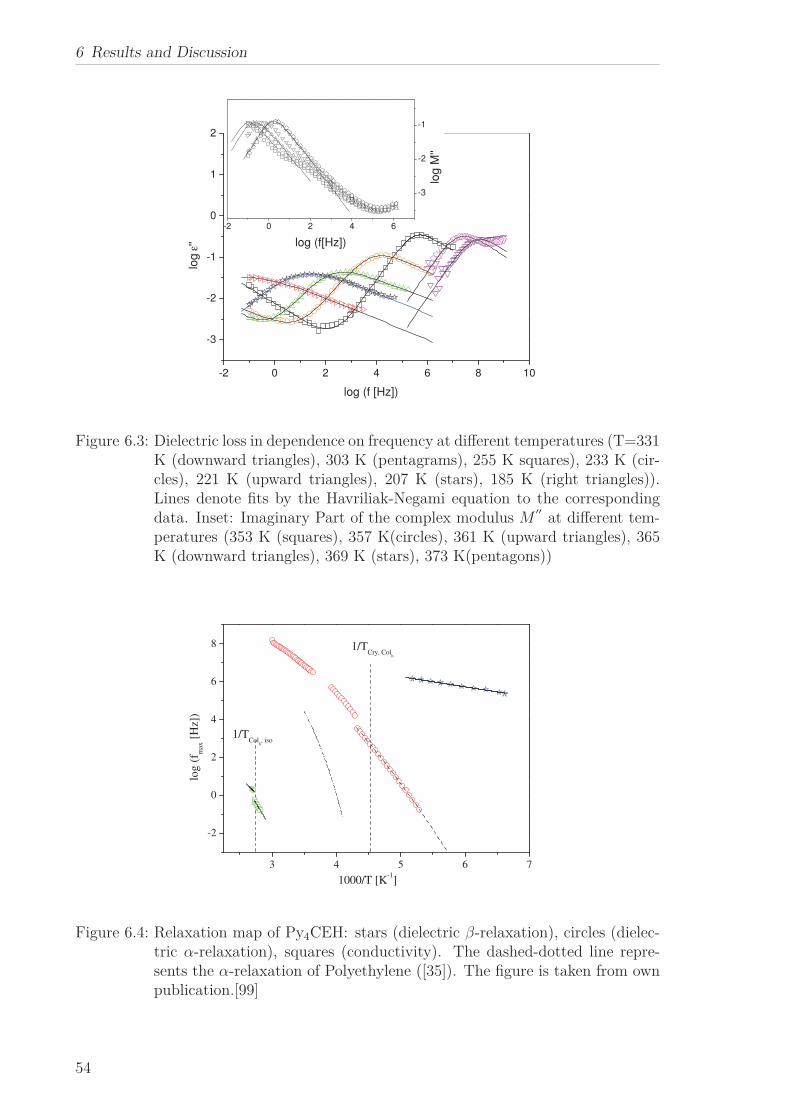
6 Results and Discussion
-2 0 2 4 6 8 10
-3
-2
-1
0
1
2
-2 0 2 4 6
-3
-2
-1
log
ε''
log (f [Hz])
log
M''
log (f[Hz])
Figure 6.3: Dielectric loss in dependence on frequency at different temperatures (T=331K (downward triangles), 303 K (pentagrams), 255 K squares), 233 K (cir-cles), 221 K (upward triangles), 207 K (stars), 185 K (right triangles)).Lines denote fits by the Havriliak-Negami equation to the correspondingdata. Inset: Imaginary Part of the complex modulus M
′′at different tem-
peratures (353 K (squares), 357 K(circles), 361 K (upward triangles), 365K (downward triangles), 369 K (stars), 373 K(pentagons))
3 4 5 6 7
-2
0
2
4
6
8
1/TCol
h, iso
log
(fm
ax [
Hz]
)
1000/T [K-1]
1/TCry, Col
h
Figure 6.4: Relaxation map of Py4CEH: stars (dielectric β-relaxation), circles (dielec-tric α-relaxation), squares (conductivity). The dashed-dotted line repre-sents the α-relaxation of Polyethylene ([35]). The figure is taken from ownpublication.[99]
54
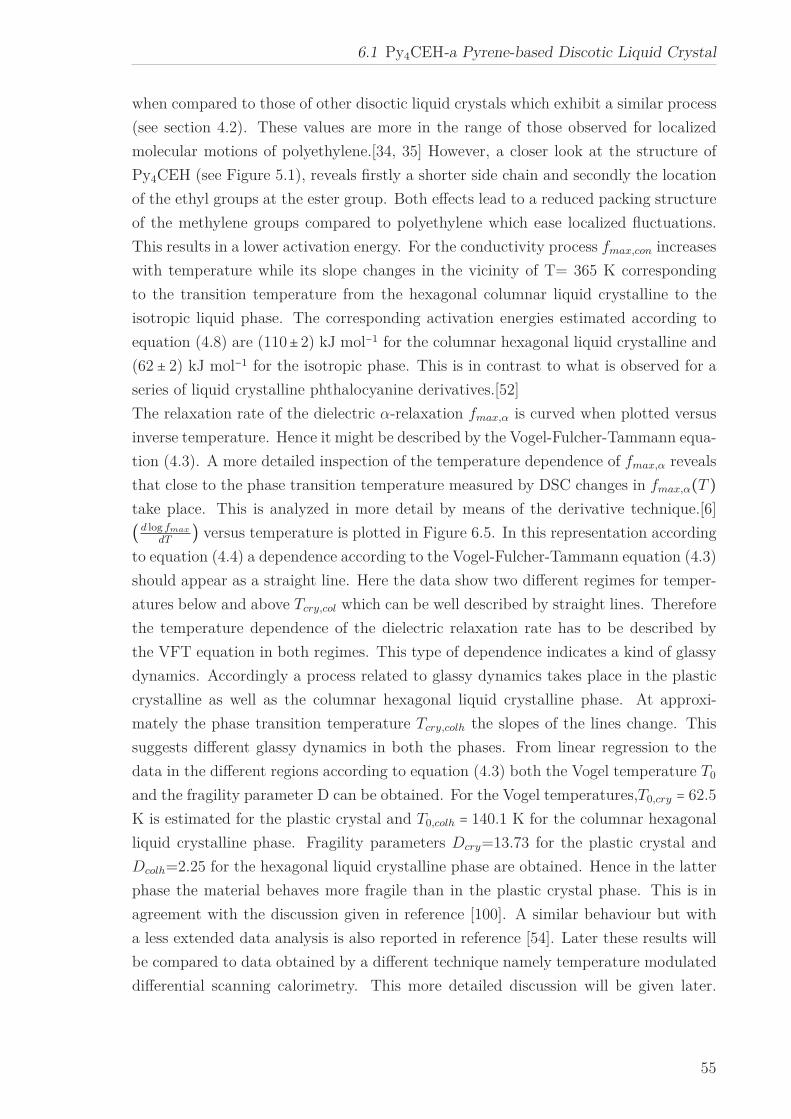
6.1 Py4CEH-a Pyrene-based Discotic Liquid Crystal
when compared to those of other disoctic liquid crystals which exhibit a similar process
(see section 4.2). These values are more in the range of those observed for localized
molecular motions of polyethylene.[34, 35] However, a closer look at the structure of
Py4CEH (see Figure 5.1), reveals firstly a shorter side chain and secondly the location
of the ethyl groups at the ester group. Both effects lead to a reduced packing structure
of the methylene groups compared to polyethylene which ease localized fluctuations.
This results in a lower activation energy. For the conductivity process fmax,con increases
with temperature while its slope changes in the vicinity of T= 365 K corresponding
to the transition temperature from the hexagonal columnar liquid crystalline to the
isotropic liquid phase. The corresponding activation energies estimated according to
equation (4.8) are (110±2) kJ mol−1 for the columnar hexagonal liquid crystalline and
(62 ± 2) kJ mol−1 for the isotropic phase. This is in contrast to what is observed for a
series of liquid crystalline phthalocyanine derivatives.[52]
The relaxation rate of the dielectric α-relaxation fmax,α is curved when plotted versus
inverse temperature. Hence it might be described by the Vogel-Fulcher-Tammann equa-
tion (4.3). A more detailed inspection of the temperature dependence of fmax,α reveals
that close to the phase transition temperature measured by DSC changes in fmax,α(T )take place. This is analyzed in more detail by means of the derivative technique.[6]
(d log fmax
dT) versus temperature is plotted in Figure 6.5. In this representation according
to equation (4.4) a dependence according to the Vogel-Fulcher-Tammann equation (4.3)
should appear as a straight line. Here the data show two different regimes for temper-
atures below and above Tcry,col which can be well described by straight lines. Therefore
the temperature dependence of the dielectric relaxation rate has to be described by
the VFT equation in both regimes. This type of dependence indicates a kind of glassy
dynamics. Accordingly a process related to glassy dynamics takes place in the plastic
crystalline as well as the columnar hexagonal liquid crystalline phase. At approxi-
mately the phase transition temperature Tcry,colh the slopes of the lines change. This
suggests different glassy dynamics in both the phases. From linear regression to the
data in the different regions according to equation (4.3) both the Vogel temperature T0
and the fragility parameter D can be obtained. For the Vogel temperatures,T0,cry = 62.5
K is estimated for the plastic crystal and T0,colh = 140.1 K for the columnar hexagonal
liquid crystalline phase. Fragility parameters Dcry=13.73 for the plastic crystal and
Dcolh=2.25 for the hexagonal liquid crystalline phase are obtained. Hence in the latter
phase the material behaves more fragile than in the plastic crystal phase. This is in
agreement with the discussion given in reference [100]. A similar behaviour but with
a less extended data analysis is also reported in reference [54]. Later these results will
be compared to data obtained by a different technique namely temperature modulated
differential scanning calorimetry. This more detailed discussion will be given later.
55
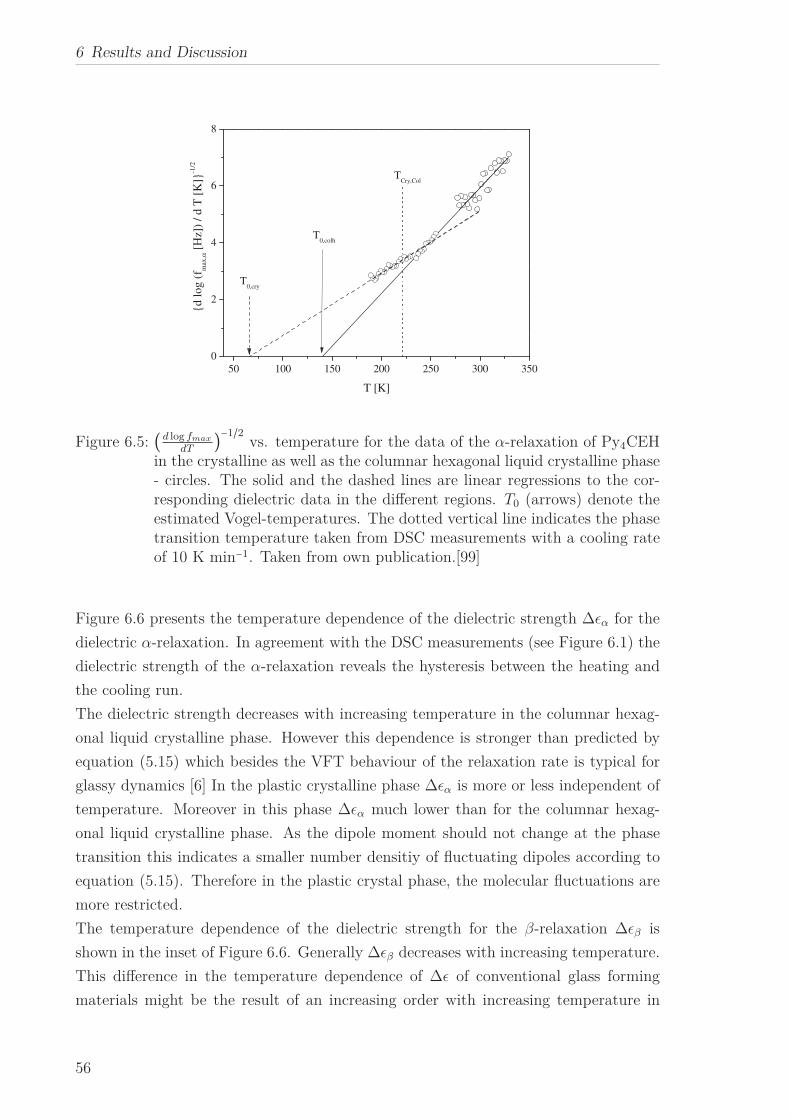
6 Results and Discussion
50 100 150 200 250 300 3500
2
4
6
8
T0,colh
d lo
g (f
max
,α [
Hz]
) / d
T [
K]
-1/2
T [K]
T0,cry
TCry,Col
Figure 6.5: (d log fmax
dT)−1/2
vs. temperature for the data of the α-relaxation of Py4CEHin the crystalline as well as the columnar hexagonal liquid crystalline phase- circles. The solid and the dashed lines are linear regressions to the cor-responding dielectric data in the different regions. T0 (arrows) denote theestimated Vogel-temperatures. The dotted vertical line indicates the phasetransition temperature taken from DSC measurements with a cooling rateof 10 K min−1. Taken from own publication.[99]
Figure 6.6 presents the temperature dependence of the dielectric strength ∆ǫα for the
dielectric α-relaxation. In agreement with the DSC measurements (see Figure 6.1) the
dielectric strength of the α-relaxation reveals the hysteresis between the heating and
the cooling run.
The dielectric strength decreases with increasing temperature in the columnar hexag-
onal liquid crystalline phase. However this dependence is stronger than predicted by
equation (5.15) which besides the VFT behaviour of the relaxation rate is typical for
glassy dynamics [6] In the plastic crystalline phase ∆ǫα is more or less independent of
temperature. Moreover in this phase ∆ǫα much lower than for the columnar hexag-
onal liquid crystalline phase. As the dipole moment should not change at the phase
transition this indicates a smaller number densitiy of fluctuating dipoles according to
equation (5.15). Therefore in the plastic crystal phase, the molecular fluctuations are
more restricted.
The temperature dependence of the dielectric strength for the β-relaxation ∆ǫβ is
shown in the inset of Figure 6.6. Generally ∆ǫβ decreases with increasing temperature.
This difference in the temperature dependence of ∆ǫ of conventional glass forming
materials might be the result of an increasing order with increasing temperature in
56
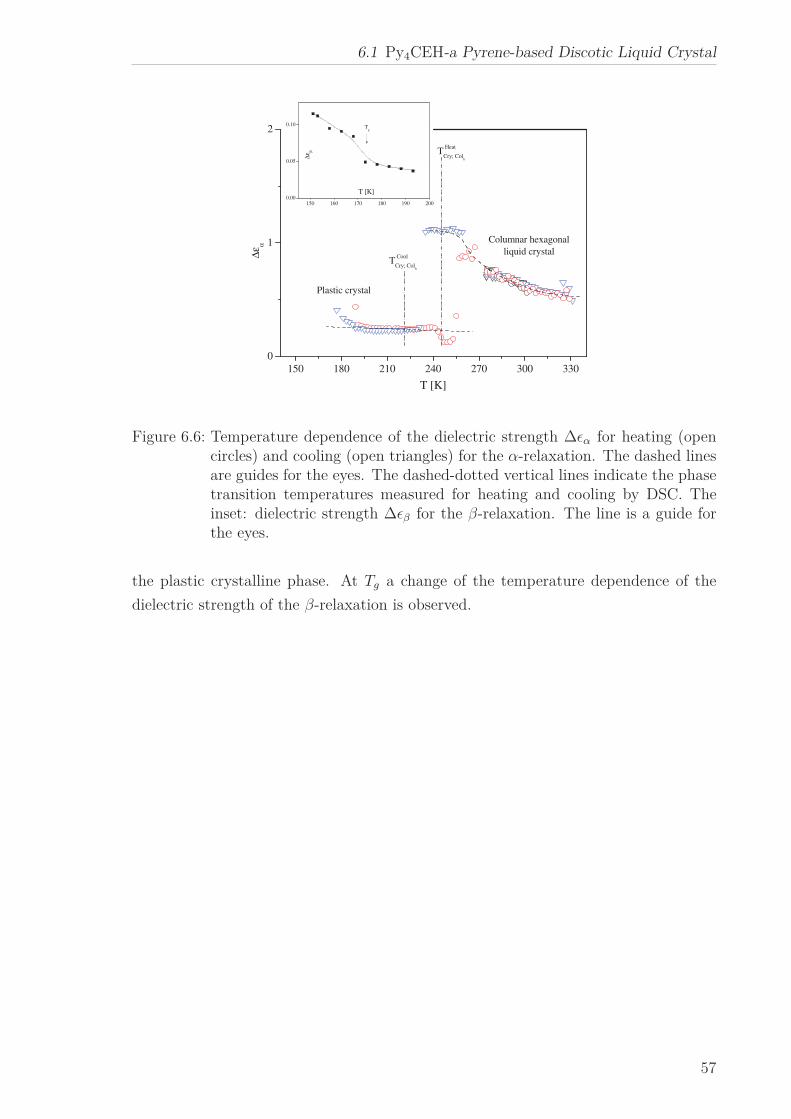
6.1 Py4CEH-a Pyrene-based Discotic Liquid Crystal
150 160 170 180 190 2000.00
0.05
0.10
150 180 210 240 270 300 3300
1
2
∆ε β
T [K]
Tg
T Cool
Cry; Colh
T Heat
Cry; Colh
∆ε α
T [K]
Plastic crystal
Columnar hexagonalliquid crystal
Figure 6.6: Temperature dependence of the dielectric strength ∆ǫα for heating (opencircles) and cooling (open triangles) for the α-relaxation. The dashed linesare guides for the eyes. The dashed-dotted vertical lines indicate the phasetransition temperatures measured for heating and cooling by DSC. Theinset: dielectric strength ∆ǫβ for the β-relaxation. The line is a guide forthe eyes.
the plastic crystalline phase. At Tg a change of the temperature dependence of the
dielectric strength of the β-relaxation is observed.
57
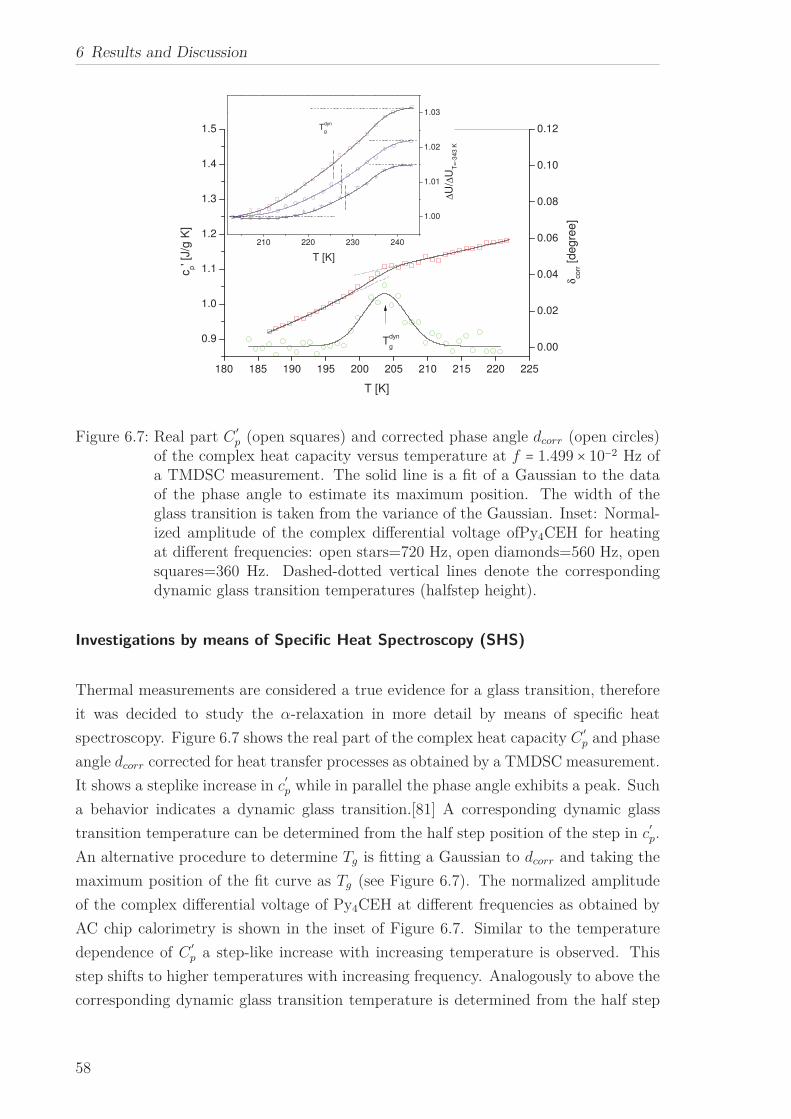
6 Results and Discussion
210 220 230 240
1.00
1.01
1.02
1.03
180 185 190 195 200 205 210 215 220 225
0.9
1.0
1.1
1.2
1.3
1.4
1.5
T [K]
cp' [
J/g
K]
0.00
0.02
0.04
0.06
0.08
0.10
0.12
δco
rr [de
gre
e]
Tdyn
g
Tdyn
g
∆U
/∆U
T=
-343 K
T [K]
Figure 6.7: Real part C′p (open squares) and corrected phase angle dcorr (open circles)
of the complex heat capacity versus temperature at f = 1.499 × 10⁻² Hz ofa TMDSC measurement. The solid line is a fit of a Gaussian to the dataof the phase angle to estimate its maximum position. The width of theglass transition is taken from the variance of the Gaussian. Inset: Normal-ized amplitude of the complex differential voltage ofPy4CEH for heatingat different frequencies: open stars=720 Hz, open diamonds=560 Hz, opensquares=360 Hz. Dashed-dotted vertical lines denote the correspondingdynamic glass transition temperatures (halfstep height).
Investigations by means of Specific Heat Spectroscopy (SHS)
Thermal measurements are considered a true evidence for a glass transition, therefore
it was decided to study the α-relaxation in more detail by means of specific heat
spectroscopy. Figure 6.7 shows the real part of the complex heat capacity C′p and phase
angle dcorr corrected for heat transfer processes as obtained by a TMDSC measurement.
It shows a steplike increase in c′p while in parallel the phase angle exhibits a peak. Such
a behavior indicates a dynamic glass transition.[81] A corresponding dynamic glass
transition temperature can be determined from the half step position of the step in c′p.
An alternative procedure to determine Tg is fitting a Gaussian to dcorr and taking the
maximum position of the fit curve as Tg (see Figure 6.7). The normalized amplitude
of the complex differential voltage of Py4CEH at different frequencies as obtained by
AC chip calorimetry is shown in the inset of Figure 6.7. Similar to the temperature
dependence of C′p a step-like increase with increasing temperature is observed. This
step shifts to higher temperatures with increasing frequency. Analogously to above the
corresponding dynamic glass transition temperature is determined from the half step
58
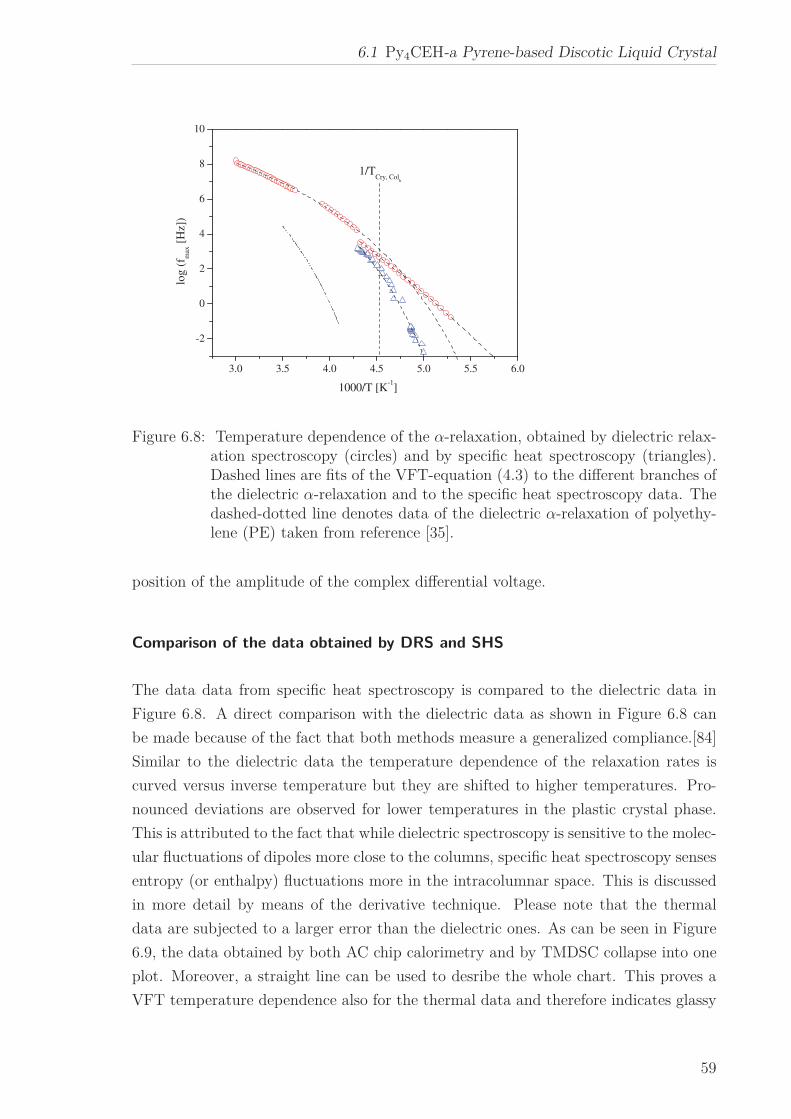
6.1 Py4CEH-a Pyrene-based Discotic Liquid Crystal
3.0 3.5 4.0 4.5 5.0 5.5 6.0
-2
0
2
4
6
8
10
log
(fm
ax [
Hz]
)
1000/T [K-1]
1/TCry, Col
h
Figure 6.8: Temperature dependence of the α-relaxation, obtained by dielectric relax-ation spectroscopy (circles) and by specific heat spectroscopy (triangles).Dashed lines are fits of the VFT-equation (4.3) to the different branches ofthe dielectric α-relaxation and to the specific heat spectroscopy data. Thedashed-dotted line denotes data of the dielectric α-relaxation of polyethy-lene (PE) taken from reference [35].
position of the amplitude of the complex differential voltage.
Comparison of the data obtained by DRS and SHS
The data data from specific heat spectroscopy is compared to the dielectric data in
Figure 6.8. A direct comparison with the dielectric data as shown in Figure 6.8 can
be made because of the fact that both methods measure a generalized compliance.[84]
Similar to the dielectric data the temperature dependence of the relaxation rates is
curved versus inverse temperature but they are shifted to higher temperatures. Pro-
nounced deviations are observed for lower temperatures in the plastic crystal phase.
This is attributed to the fact that while dielectric spectroscopy is sensitive to the molec-
ular fluctuations of dipoles more close to the columns, specific heat spectroscopy senses
entropy (or enthalpy) fluctuations more in the intracolumnar space. This is discussed
in more detail by means of the derivative technique. Please note that the thermal
data are subjected to a larger error than the dielectric ones. As can be seen in Figure
6.9, the data obtained by both AC chip calorimetry and by TMDSC collapse into one
plot. Moreover, a straight line can be used to desribe the whole chart. This proves a
VFT temperature dependence also for the thermal data and therefore indicates glassy
59
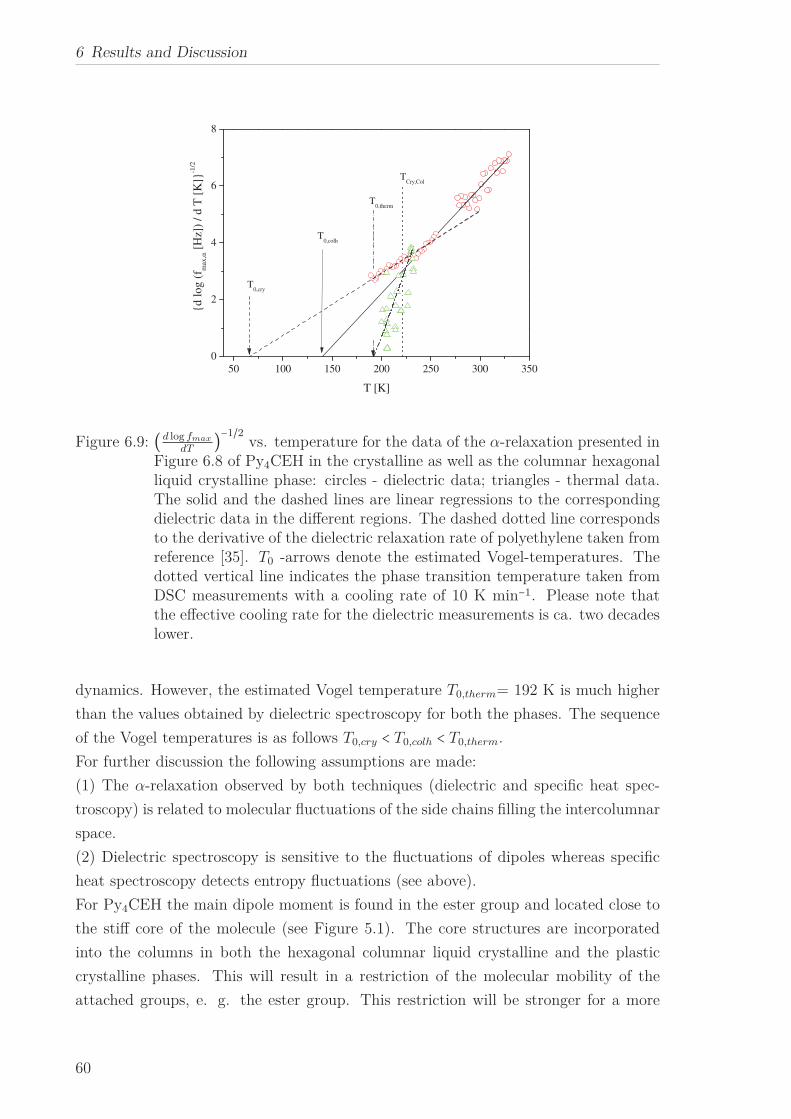
6 Results and Discussion
50 100 150 200 250 300 3500
2
4
6
8
T0,colh
d lo
g (f
max
,α [
Hz]
) / d
T [
K]
-1/2
T [K]
T0,cry
TCry,Col
T0,therm
Figure 6.9: (d log fmax
dT)−1/2
vs. temperature for the data of the α-relaxation presented inFigure 6.8 of Py4CEH in the crystalline as well as the columnar hexagonalliquid crystalline phase: circles - dielectric data; triangles - thermal data.The solid and the dashed lines are linear regressions to the correspondingdielectric data in the different regions. The dashed dotted line correspondsto the derivative of the dielectric relaxation rate of polyethylene taken fromreference [35]. T0 -arrows denote the estimated Vogel-temperatures. Thedotted vertical line indicates the phase transition temperature taken fromDSC measurements with a cooling rate of 10 K min−1. Please note thatthe effective cooling rate for the dielectric measurements is ca. two decadeslower.
dynamics. However, the estimated Vogel temperature T0,therm= 192 K is much higher
than the values obtained by dielectric spectroscopy for both the phases. The sequence
of the Vogel temperatures is as follows T0,cry < T0,colh < T0,therm.
For further discussion the following assumptions are made:
(1) The α-relaxation observed by both techniques (dielectric and specific heat spec-
troscopy) is related to molecular fluctuations of the side chains filling the intercolumnar
space.
(2) Dielectric spectroscopy is sensitive to the fluctuations of dipoles whereas specific
heat spectroscopy detects entropy fluctuations (see above).
For Py4CEH the main dipole moment is found in the ester group and located close to
the stiff core of the molecule (see Figure 5.1). The core structures are incorporated
into the columns in both the hexagonal columnar liquid crystalline and the plastic
crystalline phases. This will result in a restriction of the molecular mobility of the
attached groups, e. g. the ester group. This restriction will be stronger for a more
60
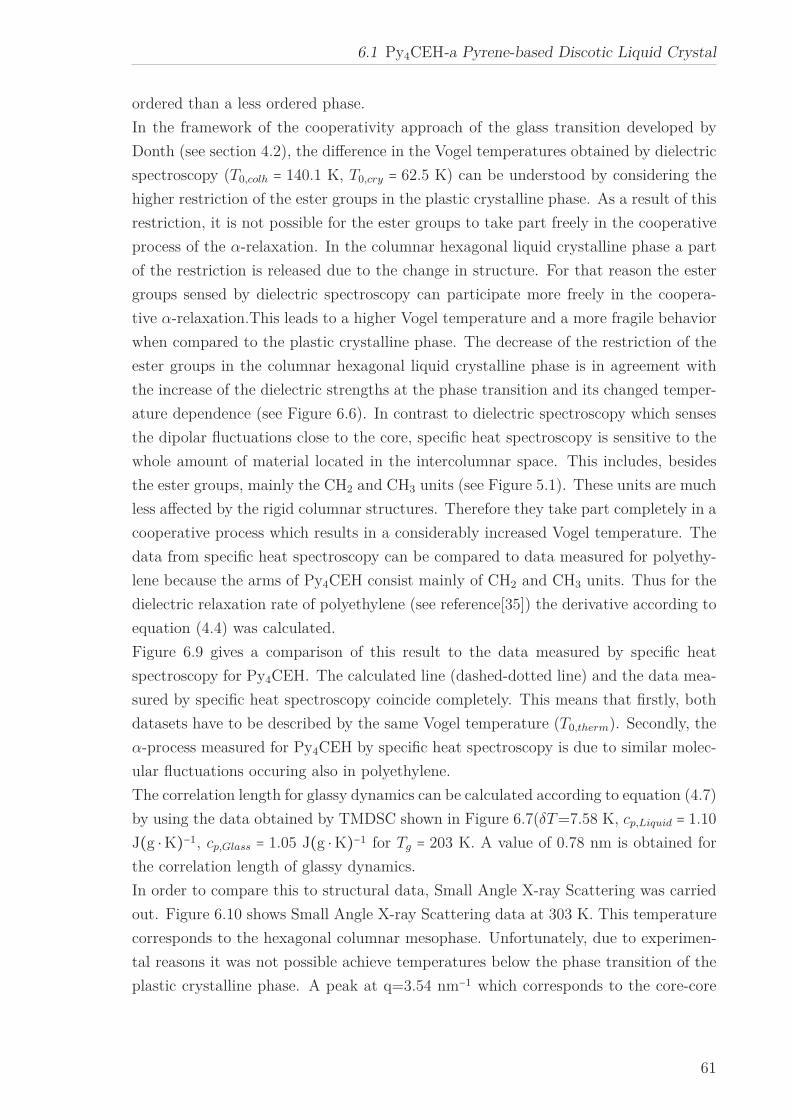
6.1 Py4CEH-a Pyrene-based Discotic Liquid Crystal
ordered than a less ordered phase.
In the framework of the cooperativity approach of the glass transition developed by
Donth (see section 4.2), the difference in the Vogel temperatures obtained by dielectric
spectroscopy (T0,colh = 140.1 K, T0,cry = 62.5 K) can be understood by considering the
higher restriction of the ester groups in the plastic crystalline phase. As a result of this
restriction, it is not possible for the ester groups to take part freely in the cooperative
process of the α-relaxation. In the columnar hexagonal liquid crystalline phase a part
of the restriction is released due to the change in structure. For that reason the ester
groups sensed by dielectric spectroscopy can participate more freely in the coopera-
tive α-relaxation.This leads to a higher Vogel temperature and a more fragile behavior
when compared to the plastic crystalline phase. The decrease of the restriction of the
ester groups in the columnar hexagonal liquid crystalline phase is in agreement with
the increase of the dielectric strengths at the phase transition and its changed temper-
ature dependence (see Figure 6.6). In contrast to dielectric spectroscopy which senses
the dipolar fluctuations close to the core, specific heat spectroscopy is sensitive to the
whole amount of material located in the intercolumnar space. This includes, besides
the ester groups, mainly the CH2 and CH3 units (see Figure 5.1). These units are much
less affected by the rigid columnar structures. Therefore they take part completely in a
cooperative process which results in a considerably increased Vogel temperature. The
data from specific heat spectroscopy can be compared to data measured for polyethy-
lene because the arms of Py4CEH consist mainly of CH2 and CH3 units. Thus for the
dielectric relaxation rate of polyethylene (see reference[35]) the derivative according to
equation (4.4) was calculated.
Figure 6.9 gives a comparison of this result to the data measured by specific heat
spectroscopy for Py4CEH. The calculated line (dashed-dotted line) and the data mea-
sured by specific heat spectroscopy coincide completely. This means that firstly, both
datasets have to be described by the same Vogel temperature (T0,therm). Secondly, the
α-process measured for Py4CEH by specific heat spectroscopy is due to similar molec-
ular fluctuations occuring also in polyethylene.
The correlation length for glassy dynamics can be calculated according to equation (4.7)
by using the data obtained by TMDSC shown in Figure 6.7(δT=7.58 K, cp,Liquid = 1.10
J(g ⋅ K)−1, cp,Glass = 1.05 J(g ⋅ K)−1 for Tg = 203 K. A value of 0.78 nm is obtained for
the correlation length of glassy dynamics.
In order to compare this to structural data, Small Angle X-ray Scattering was carried
out. Figure 6.10 shows Small Angle X-ray Scattering data at 303 K. This temperature
corresponds to the hexagonal columnar mesophase. Unfortunately, due to experimen-
tal reasons it was not possible achieve temperatures below the phase transition of the
plastic crystalline phase. A peak at q=3.54 nm−1 which corresponds to the core-core
61
6 Results and Discussion
distance is observed. By calculating the core-core distance dcc according to equation
0.1 1 10
1E-4
1E-3
0.01
0.1
Inte
nsity
[a.
u.]
q [nm-1]
Figure 6.10: X-ray diffractogram in the small angle range (SAXS) of Py4CEH at T=303K. Taken from own publication [99].
(5.20) one obtaines a value of 2.05 nm. Considering the fact that a part of this distance
has to be assigned to ordered columns on both sites (0.4 nm - 0.5 nm per site) ca. 0.8
nm is estimated for the intercolumnar space. A distance of ca. 0.8 nm can also be
estimated for the all-trans conformation of the alkyl chains. [101] One can conclude
that the length scale calculated from the thermal data (dynamic data) corresponds
very well to the structural data.
62
6.1 Py4CEH-a Pyrene-based Discotic Liquid Crystal
6.1.3 Phase Transitions under Confinement
Differential Scanning Caloriemtry was employed to investigate the phase transitions
of confined Py4CEH. Figure 6.11 shows DSC thermograms (heating rate 10 K/min;
second heating run) of Py4CEH in the bulk state and confined to the nanoporous
channels with three different pore sizes as indicated. The values of the heat flow were
recalculated according to the actual mass of the organic material inside the pores. It is
observed, that Py4CEH undergoes the phase transition from the plastic crystalline to
the hexagonal ordered liquid crystalline and to the isotropic state also when confined
and to the smallest pore diameter used in this study. The effect of the nanoscaled
confinement on the phase transition is threefold:
1. With decreasing pore diameter there is a shift of the phase transition tempera-
tures to lower temperatures for both phase transitions.
2. The phase transition enthalpies decrease with smaller pore size.
3. For the two lowest pore sizes the peak splits up for both phase transitions.
Similar to the bulk material Py4CEH confined to the pores exhibits a glass transition
around 200 K. The glass transition temperature seems to be independent of the pore
size down to 25 nm as expected from results obtained on confined molecular liquids
and amorphous polymers.[102, 103, 104]
Figure 6.12 shows the phase transition temperature from the plastic crystalline to the
liquid crystalline phase versus inverse pore size. As already mentioned above, for pores
with 40 and 25 nm in diameter the phase transition from the plastic crystalline to the
liquid crystalline phase splits of into two peaks (satellite peaks, see arrows in Figure
6.11).
The phase transition temperature for the peak located at higher temperatures remains
more or less independent of the pore size. For the peak at lower temperatures there is
a decrease of the phase transition temperature from plastic crystalline to liquid crys-
talline versus inverse pore size.
For the phase transition between the liquid crystalline and the isotropic liquid phase,
while the phase transition temperature for the peak located at higher temperatures
is more or less independent of the pore size, for the peak at lower temperatures, a
continuous decrease in the phase transition temperatures with decreasing pore size is
observed. (see Figure 6.13).
Similar to other materials for Py4CEH the change in the phase transition temperatures
63
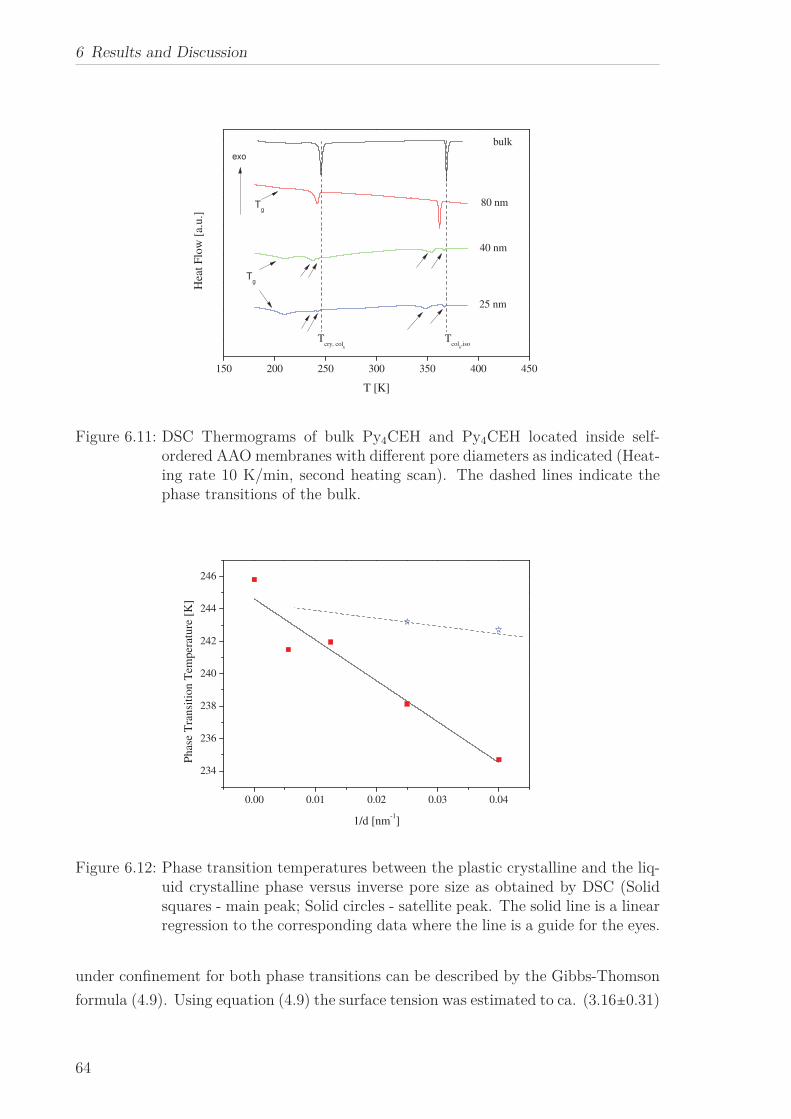
6 Results and Discussion
150 200 250 300 350 400 450
Tg
exo
Tcry, col
h
Tcol
h,iso
40 nm
25 nm
80 nm
Hea
t Flo
w [
a.u.
]
T [K]
bulk
Tg
Figure 6.11: DSC Thermograms of bulk Py4CEH and Py4CEH located inside self-ordered AAO membranes with different pore diameters as indicated (Heat-ing rate 10 K/min, second heating scan). The dashed lines indicate thephase transitions of the bulk.
0.00 0.01 0.02 0.03 0.04
234
236
238
240
242
244
246
Phas
e T
rans
ition
Tem
pera
ture
[K
]
1/d [nm-1]
Figure 6.12: Phase transition temperatures between the plastic crystalline and the liq-uid crystalline phase versus inverse pore size as obtained by DSC (Solidsquares - main peak; Solid circles - satellite peak. The solid line is a linearregression to the corresponding data where the line is a guide for the eyes.
under confinement for both phase transitions can be described by the Gibbs-Thomson
formula (4.9). Using equation (4.9) the surface tension was estimated to ca. (3.16±0.31)
64
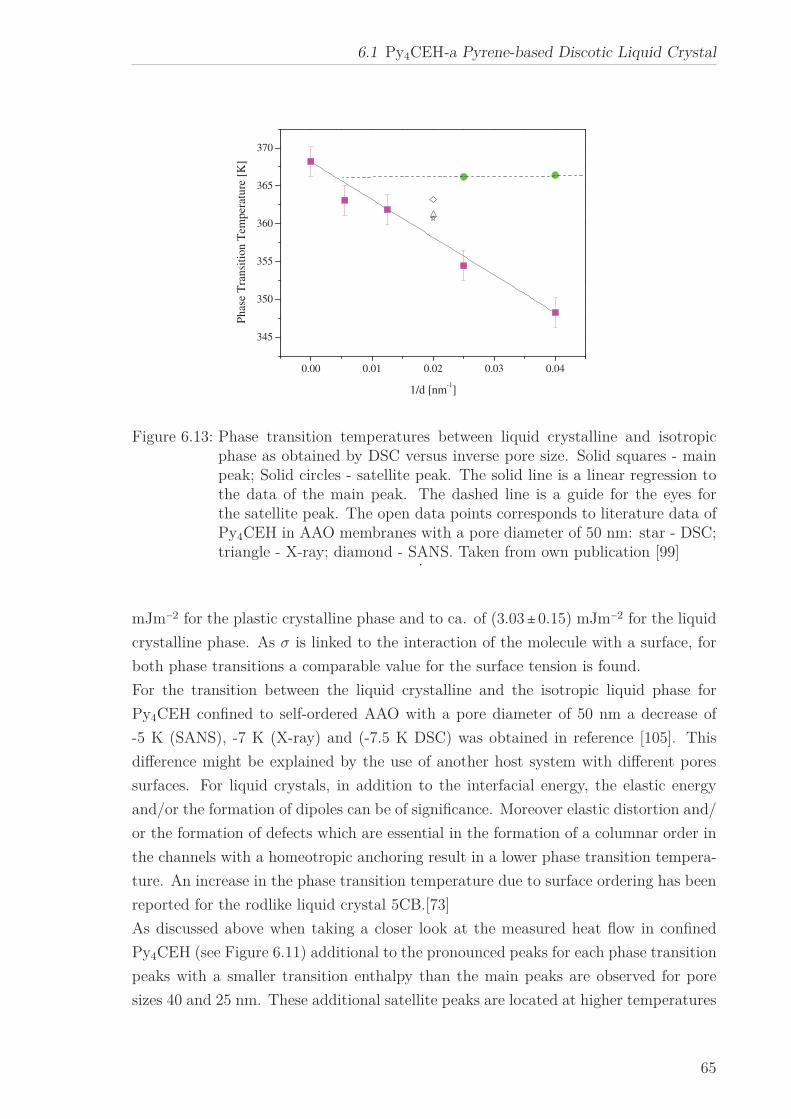
6.1 Py4CEH-a Pyrene-based Discotic Liquid Crystal
0.00 0.01 0.02 0.03 0.04
345
350
355
360
365
370
Phas
e T
rans
ition
Tem
pera
ture
[K
]
1/d [nm-1]
Figure 6.13: Phase transition temperatures between liquid crystalline and isotropicphase as obtained by DSC versus inverse pore size. Solid squares - mainpeak; Solid circles - satellite peak. The solid line is a linear regression tothe data of the main peak. The dashed line is a guide for the eyes forthe satellite peak. The open data points corresponds to literature data ofPy4CEH in AAO membranes with a pore diameter of 50 nm: star - DSC;triangle - X-ray; diamond - SANS. Taken from own publication [99]
.
mJm−2 for the plastic crystalline phase and to ca. of (3.03±0.15) mJm−2 for the liquid
crystalline phase. As σ is linked to the interaction of the molecule with a surface, for
both phase transitions a comparable value for the surface tension is found.
For the transition between the liquid crystalline and the isotropic liquid phase for
Py4CEH confined to self-ordered AAO with a pore diameter of 50 nm a decrease of
-5 K (SANS), -7 K (X-ray) and (-7.5 K DSC) was obtained in reference [105]. This
difference might be explained by the use of another host system with different pores
surfaces. For liquid crystals, in addition to the interfacial energy, the elastic energy
and/or the formation of dipoles can be of significance. Moreover elastic distortion and/
or the formation of defects which are essential in the formation of a columnar order in
the channels with a homeotropic anchoring result in a lower phase transition tempera-
ture. An increase in the phase transition temperature due to surface ordering has been
reported for the rodlike liquid crystal 5CB.[73]
As discussed above when taking a closer look at the measured heat flow in confined
Py4CEH (see Figure 6.11) additional to the pronounced peaks for each phase transition
peaks with a smaller transition enthalpy than the main peaks are observed for pore
sizes 40 and 25 nm. These additional satellite peaks are located at higher temperatures
65
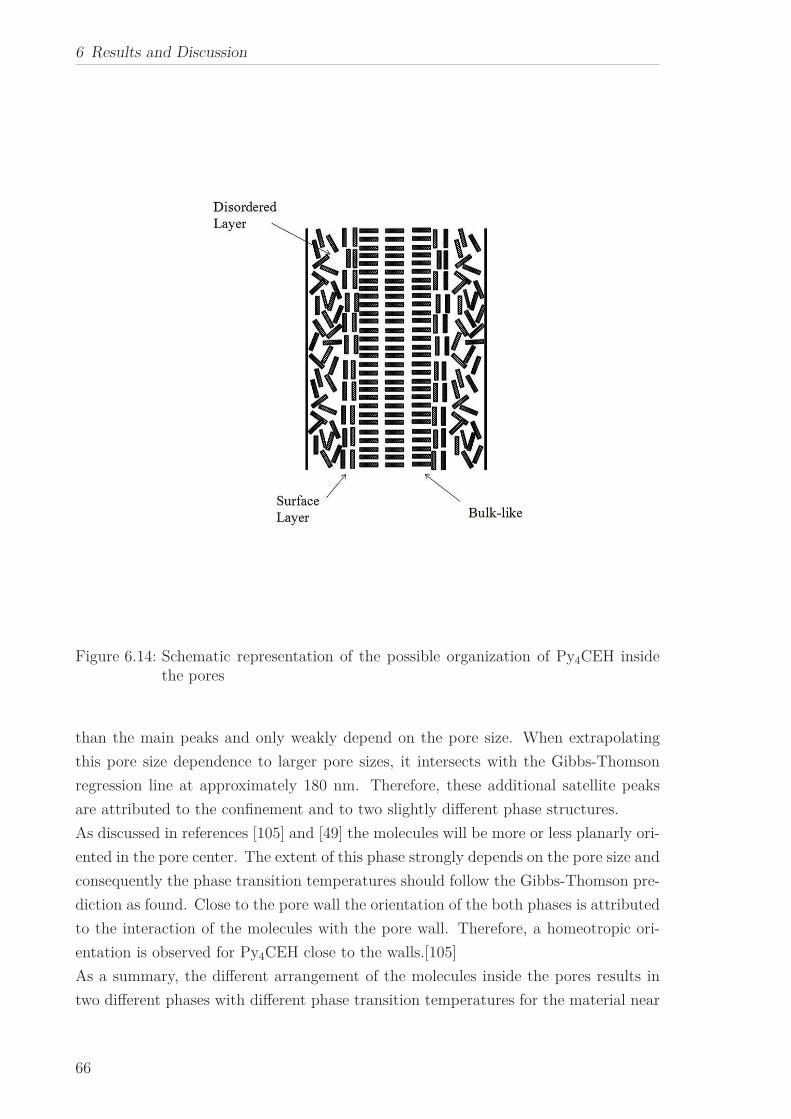
6 Results and Discussion
Figure 6.14: Schematic representation of the possible organization of Py4CEH insidethe pores
than the main peaks and only weakly depend on the pore size. When extrapolating
this pore size dependence to larger pore sizes, it intersects with the Gibbs-Thomson
regression line at approximately 180 nm. Therefore, these additional satellite peaks
are attributed to the confinement and to two slightly different phase structures.
As discussed in references [105] and [49] the molecules will be more or less planarly ori-
ented in the pore center. The extent of this phase strongly depends on the pore size and
consequently the phase transition temperatures should follow the Gibbs-Thomson pre-
diction as found. Close to the pore wall the orientation of the both phases is attributed
to the interaction of the molecules with the pore wall. Therefore, a homeotropic ori-
entation is observed for Py4CEH close to the walls.[105]
As a summary, the different arrangement of the molecules inside the pores results in
two different phases with different phase transition temperatures for the material near
66
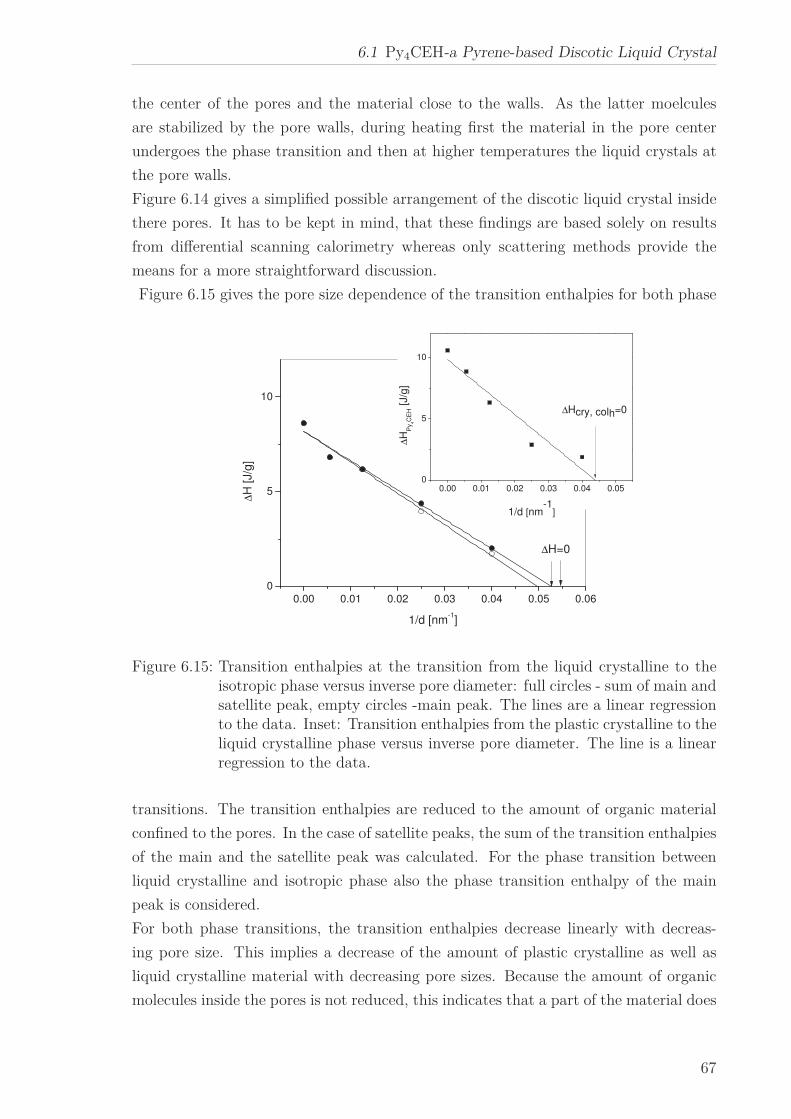
6.1 Py4CEH-a Pyrene-based Discotic Liquid Crystal
the center of the pores and the material close to the walls. As the latter moelcules
are stabilized by the pore walls, during heating first the material in the pore center
undergoes the phase transition and then at higher temperatures the liquid crystals at
the pore walls.
Figure 6.14 gives a simplified possible arrangement of the discotic liquid crystal inside
there pores. It has to be kept in mind, that these findings are based solely on results
from differential scanning calorimetry whereas only scattering methods provide the
means for a more straightforward discussion.
Figure 6.15 gives the pore size dependence of the transition enthalpies for both phase
0.00 0.01 0.02 0.03 0.04 0.05 0.06
0
5
10
0.00 0.01 0.02 0.03 0.04 0.050
5
10
∆H
[J/g
]
1/d [nm-1]
∆H=0
∆Hcry, colh=0
∆H
Py
4C
EH [J/g
]
1/d [nm-1
]
Figure 6.15: Transition enthalpies at the transition from the liquid crystalline to theisotropic phase versus inverse pore diameter: full circles - sum of main andsatellite peak, empty circles -main peak. The lines are a linear regressionto the data. Inset: Transition enthalpies from the plastic crystalline to theliquid crystalline phase versus inverse pore diameter. The line is a linearregression to the data.
transitions. The transition enthalpies are reduced to the amount of organic material
confined to the pores. In the case of satellite peaks, the sum of the transition enthalpies
of the main and the satellite peak was calculated. For the phase transition between
liquid crystalline and isotropic phase also the phase transition enthalpy of the main
peak is considered.
For both phase transitions, the transition enthalpies decrease linearly with decreas-
ing pore size. This implies a decrease of the amount of plastic crystalline as well as
liquid crystalline material with decreasing pore sizes. Because the amount of organic
molecules inside the pores is not reduced, this indicates that a part of the material does
67
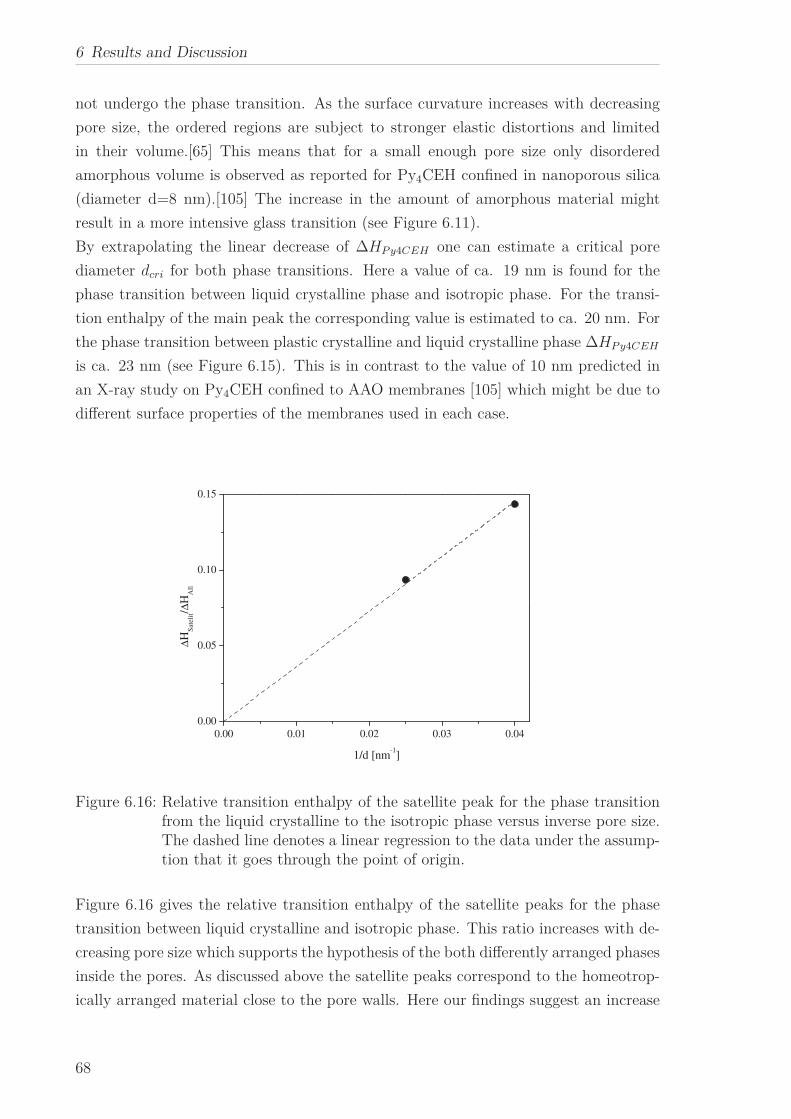
6 Results and Discussion
not undergo the phase transition. As the surface curvature increases with decreasing
pore size, the ordered regions are subject to stronger elastic distortions and limited
in their volume.[65] This means that for a small enough pore size only disordered
amorphous volume is observed as reported for Py4CEH confined in nanoporous silica
(diameter d=8 nm).[105] The increase in the amount of amorphous material might
result in a more intensive glass transition (see Figure 6.11).
By extrapolating the linear decrease of ∆HP y4CEH one can estimate a critical pore
diameter dcri for both phase transitions. Here a value of ca. 19 nm is found for the
phase transition between liquid crystalline phase and isotropic phase. For the transi-
tion enthalpy of the main peak the corresponding value is estimated to ca. 20 nm. For
the phase transition between plastic crystalline and liquid crystalline phase ∆HP y4CEH
is ca. 23 nm (see Figure 6.15). This is in contrast to the value of 10 nm predicted in
an X-ray study on Py4CEH confined to AAO membranes [105] which might be due to
different surface properties of the membranes used in each case.
0.00 0.01 0.02 0.03 0.040.00
0.05
0.10
0.15
∆H
Sate
lit/∆
HA
ll
1/d [nm-1]
Figure 6.16: Relative transition enthalpy of the satellite peak for the phase transitionfrom the liquid crystalline to the isotropic phase versus inverse pore size.The dashed line denotes a linear regression to the data under the assump-tion that it goes through the point of origin.
Figure 6.16 gives the relative transition enthalpy of the satellite peaks for the phase
transition between liquid crystalline and isotropic phase. This ratio increases with de-
creasing pore size which supports the hypothesis of the both differently arranged phases
inside the pores. As discussed above the satellite peaks correspond to the homeotrop-
ically arranged material close to the pore walls. Here our findings suggest an increase
68
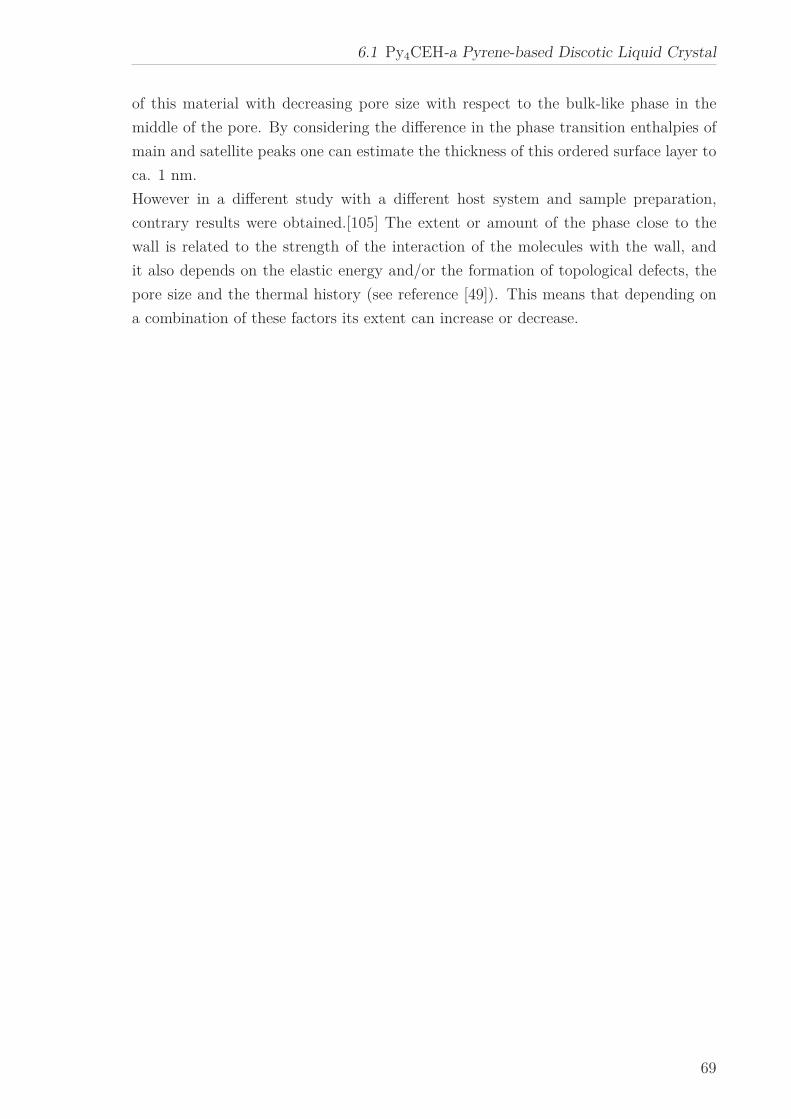
6.1 Py4CEH-a Pyrene-based Discotic Liquid Crystal
of this material with decreasing pore size with respect to the bulk-like phase in the
middle of the pore. By considering the difference in the phase transition enthalpies of
main and satellite peaks one can estimate the thickness of this ordered surface layer to
ca. 1 nm.
However in a different study with a different host system and sample preparation,
contrary results were obtained.[105] The extent or amount of the phase close to the
wall is related to the strength of the interaction of the molecules with the wall, and
it also depends on the elastic energy and/or the formation of topological defects, the
pore size and the thermal history (see reference [49]). This means that depending on
a combination of these factors its extent can increase or decrease.
69
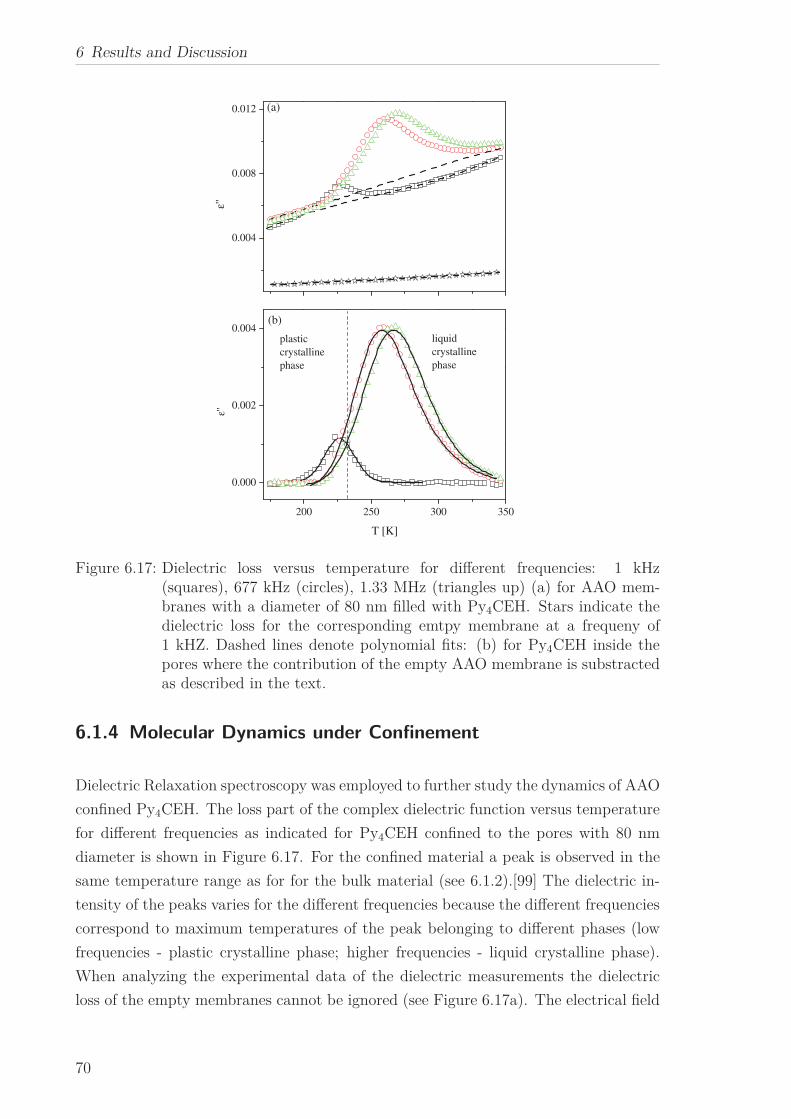
6 Results and Discussion
0.004
0.008
0.012
200 250 300 350
0.000
0.002
0.004
ε''
(a)
plastic crystallinephase
(b)
ε''
T [K]
liquidcrystallinephase
Figure 6.17: Dielectric loss versus temperature for different frequencies: 1 kHz(squares), 677 kHz (circles), 1.33 MHz (triangles up) (a) for AAO mem-branes with a diameter of 80 nm filled with Py4CEH. Stars indicate thedielectric loss for the corresponding emtpy membrane at a frequeny of1 kHZ. Dashed lines denote polynomial fits: (b) for Py4CEH inside thepores where the contribution of the empty AAO membrane is substractedas described in the text.
6.1.4 Molecular Dynamics under Confinement
Dielectric Relaxation spectroscopy was employed to further study the dynamics of AAO
confined Py4CEH. The loss part of the complex dielectric function versus temperature
for different frequencies as indicated for Py4CEH confined to the pores with 80 nm
diameter is shown in Figure 6.17. For the confined material a peak is observed in the
same temperature range as for for the bulk material (see 6.1.2).[99] The dielectric in-
tensity of the peaks varies for the different frequencies because the different frequencies
correspond to maximum temperatures of the peak belonging to different phases (low
frequencies - plastic crystalline phase; higher frequencies - liquid crystalline phase).
When analyzing the experimental data of the dielectric measurements the dielectric
loss of the empty membranes cannot be ignored (see Figure 6.17a). The electrical field
70
6.1 Py4CEH-a Pyrene-based Discotic Liquid Crystal
3.5 4.0 4.5 5.01
2
3
4
5
6
7
3.5 4.0 4.5 5.0 5.5
-2
0
2
4
6
8
log(f
p [H
z])
1000 / T [K-1]
log(f
p [H
z])
1000 / T [K-1]
Figure 6.18: Relaxation map of Py4CEH in the bulk (open squares) and confined toAAO membranes with pore diameters of 180 nm (open circles) and 80nm (open triangles). Lines are guides to the eyes. Inset: relaxation mapof Py4CEH in the bulk (open squares) and confined to AAO membraneswith pore diameters 40 nm (hexagons) and 25 nm (open stars).
is oriented in parallel to the direction of the channels of AAO. Therefore this system
can be treated as a parallel circuit and the measured complex dielectric function is the
sum of the material confined to the pores and of the empty host membrane. First the
scaled contribution of the corresponding empty membrane for the complex dielectric
function of the confined Py4CEH was described by a polynomial and then subtracted
from the spectra of the filled membrane. A Gaussian fit of the data obtained by that
procedure (see Figure6.17b) delivers the maximum position of the peak in the temper-
ature domain. Figure 6.18 shows the temperature dependence of the relaxation rate
for bulk and confined Py4CEH. Similar to the bulk for temperatures above and below
the phase transition the temperature dependence of the relaxation rate for confined
Py4CEH can be described the Vogel-Fulcher-Tamman (VFT-) equation (4.3) but with
essential considerably different parameters in the different phases.
As can be seen in Figure 6.18 a more or less step-like change takes place in the
temperature dependence of the relaxation rates of confined Py4CEH. With decreasing
pore size the temperature dependence of the relaxation rates changes to a lesser extent.
Generally the temperature dependence of the relaxation rates for the confined material
should follow the VFT formula similar to the bulk. But here the temperature depen-
dence of the relaxation rates are approximated by an Arrhenius equation (4.8) due to
the limitation of data sets available for the confined samples. The pore size dependence
71
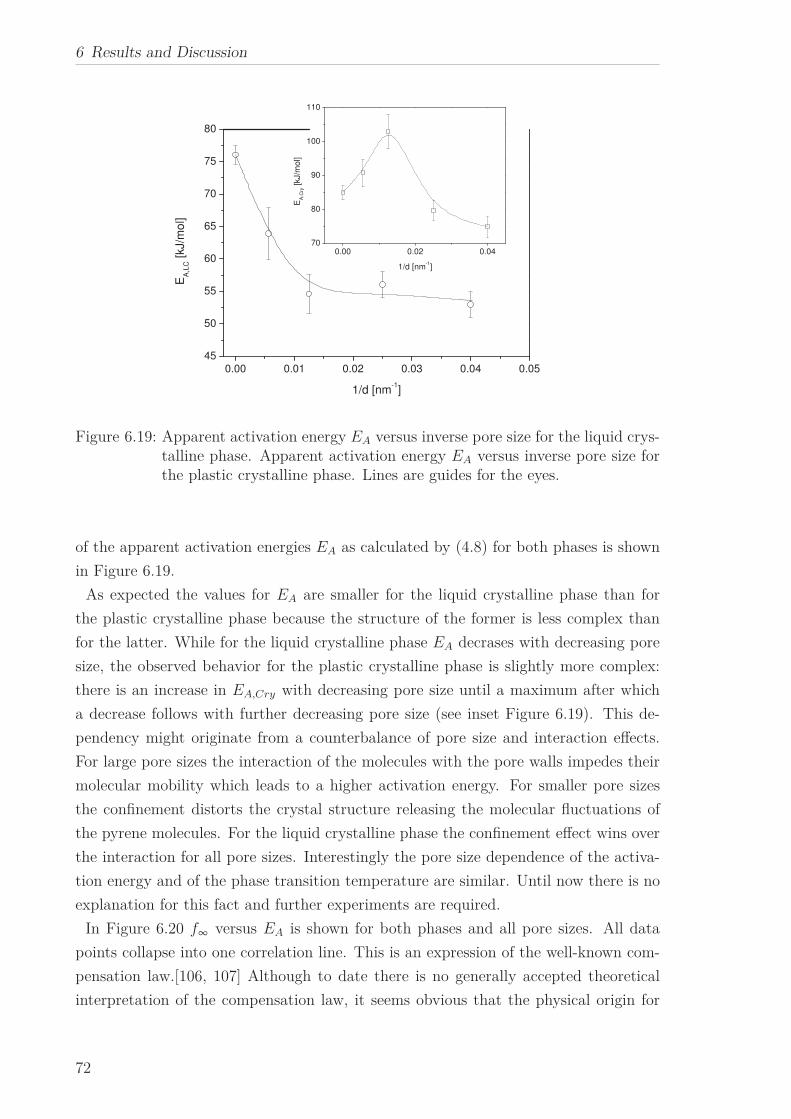
6 Results and Discussion
0.00 0.02 0.0470
80
90
100
110
0.00 0.01 0.02 0.03 0.04 0.05
45
50
55
60
65
70
75
80
EA
,Cry [kJ/m
ol]
1/d [nm-1]
EA
,LC [kJ/m
ol]
1/d [nm-1]
Figure 6.19: Apparent activation energy EA versus inverse pore size for the liquid crys-talline phase. Apparent activation energy EA versus inverse pore size forthe plastic crystalline phase. Lines are guides for the eyes.
of the apparent activation energies EA as calculated by (4.8) for both phases is shown
in Figure 6.19.
As expected the values for EA are smaller for the liquid crystalline phase than for
the plastic crystalline phase because the structure of the former is less complex than
for the latter. While for the liquid crystalline phase EA decrases with decreasing pore
size, the observed behavior for the plastic crystalline phase is slightly more complex:
there is an increase in EA,Cry with decreasing pore size until a maximum after which
a decrease follows with further decreasing pore size (see inset Figure 6.19). This de-
pendency might originate from a counterbalance of pore size and interaction effects.
For large pore sizes the interaction of the molecules with the pore walls impedes their
molecular mobility which leads to a higher activation energy. For smaller pore sizes
the confinement distorts the crystal structure releasing the molecular fluctuations of
the pyrene molecules. For the liquid crystalline phase the confinement effect wins over
the interaction for all pore sizes. Interestingly the pore size dependence of the activa-
tion energy and of the phase transition temperature are similar. Until now there is no
explanation for this fact and further experiments are required.
In Figure 6.20 f∞ versus EA is shown for both phases and all pore sizes. All data
points collapse into one correlation line. This is an expression of the well-known com-
pensation law.[106, 107] Although to date there is no generally accepted theoretical
interpretation of the compensation law, it seems obvious that the physical origin for
72
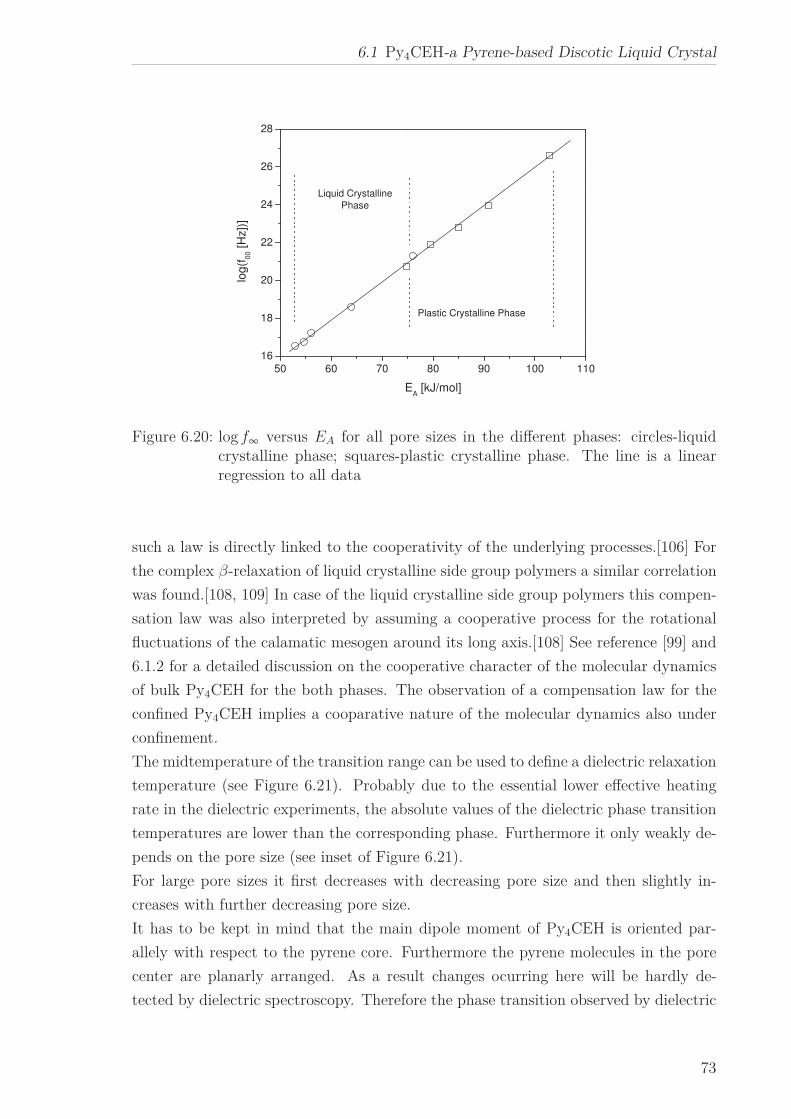
6.1 Py4CEH-a Pyrene-based Discotic Liquid Crystal
50 60 70 80 90 100 110
16
18
20
22
24
26
28
Liquid Crystalline
Phase
log
(f0
0 [H
z])
]
EA [kJ/mol]
Plastic Crystalline Phase
Figure 6.20: log f∞ versus EA for all pore sizes in the different phases: circles-liquidcrystalline phase; squares-plastic crystalline phase. The line is a linearregression to all data
such a law is directly linked to the cooperativity of the underlying processes.[106] For
the complex β-relaxation of liquid crystalline side group polymers a similar correlation
was found.[108, 109] In case of the liquid crystalline side group polymers this compen-
sation law was also interpreted by assuming a cooperative process for the rotational
fluctuations of the calamatic mesogen around its long axis.[108] See reference [99] and
6.1.2 for a detailed discussion on the cooperative character of the molecular dynamics
of bulk Py4CEH for the both phases. The observation of a compensation law for the
confined Py4CEH implies a cooparative nature of the molecular dynamics also under
confinement.
The midtemperature of the transition range can be used to define a dielectric relaxation
temperature (see Figure 6.21). Probably due to the essential lower effective heating
rate in the dielectric experiments, the absolute values of the dielectric phase transition
temperatures are lower than the corresponding phase. Furthermore it only weakly de-
pends on the pore size (see inset of Figure 6.21).
For large pore sizes it first decreases with decreasing pore size and then slightly in-
creases with further decreasing pore size.
It has to be kept in mind that the main dipole moment of Py4CEH is oriented par-
allely with respect to the pyrene core. Furthermore the pyrene molecules in the pore
center are planarly arranged. As a result changes ocurring here will be hardly de-
tected by dielectric spectroscopy. Therefore the phase transition observed by dielectric
73
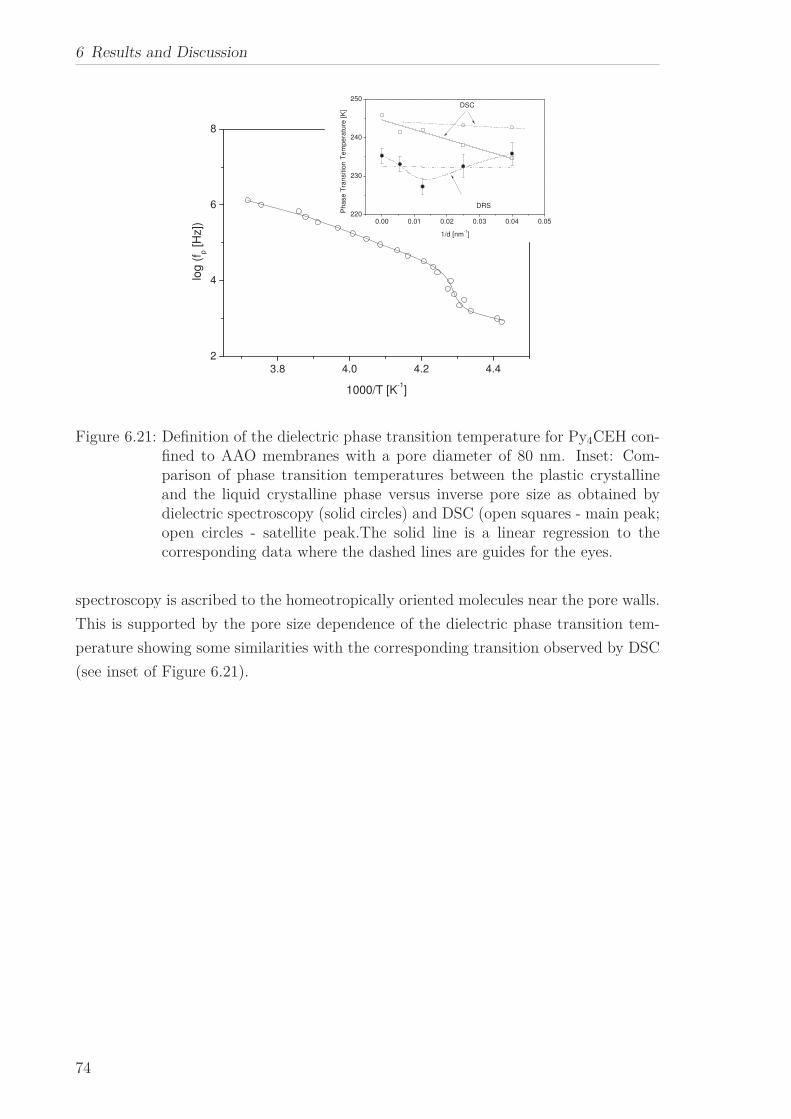
6 Results and Discussion
0.00 0.01 0.02 0.03 0.04 0.05220
230
240
250
Ph
ase
Tra
nsitio
n T
em
pe
ratu
re [
K]
1/d [nm-1]
DSC
DRS
3.8 4.0 4.2 4.4
2
4
6
8
log (
f p [H
z])
1000/T [K-1]
Figure 6.21: Definition of the dielectric phase transition temperature for Py4CEH con-fined to AAO membranes with a pore diameter of 80 nm. Inset: Com-parison of phase transition temperatures between the plastic crystallineand the liquid crystalline phase versus inverse pore size as obtained bydielectric spectroscopy (solid circles) and DSC (open squares - main peak;open circles - satellite peak.The solid line is a linear regression to thecorresponding data where the dashed lines are guides for the eyes.
spectroscopy is ascribed to the homeotropically oriented molecules near the pore walls.
This is supported by the pore size dependence of the dielectric phase transition tem-
perature showing some similarities with the corresponding transition observed by DSC
(see inset of Figure 6.21).
74
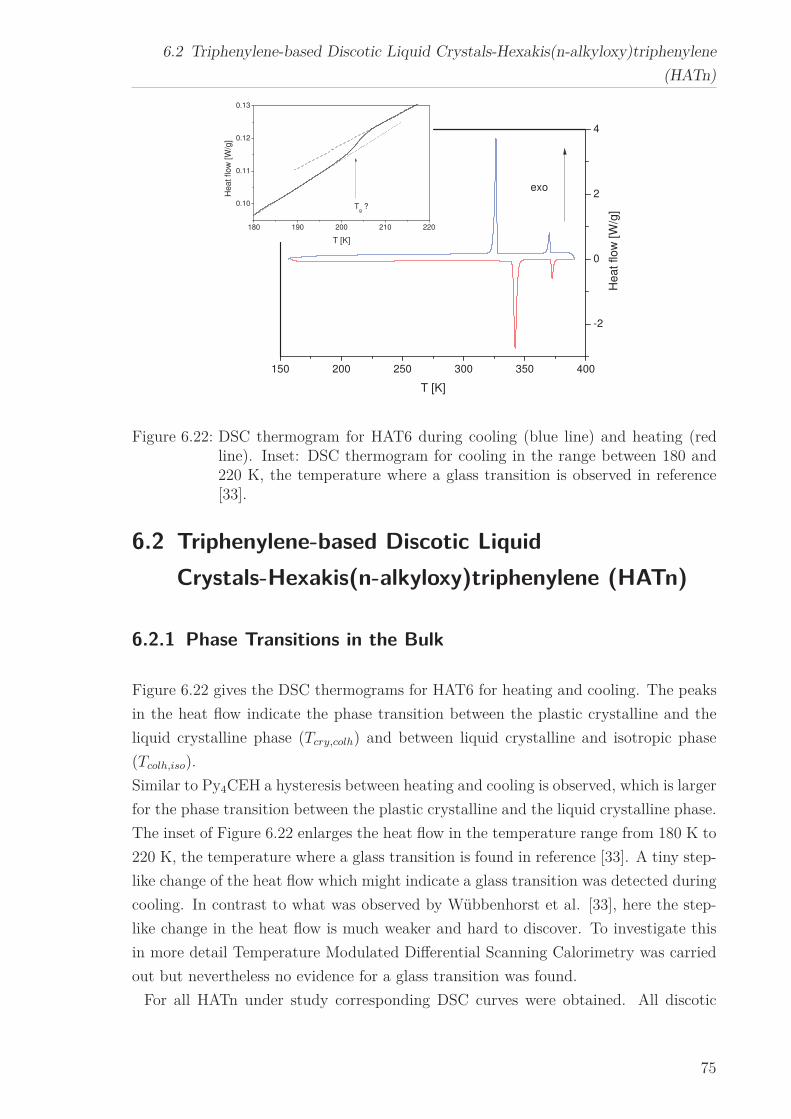
6.2 Triphenylene-based Discotic Liquid Crystals-Hexakis(n-alkyloxy)triphenylene
(HATn)
150 200 250 300 350 400
-2
0
2
4
Heat flow
[W
/g]
T [K]
exo
180 190 200 210 220
0.10
0.11
0.12
0.13
Heat flow
[W
/g]
T [K]
Tg ?
Figure 6.22: DSC thermogram for HAT6 during cooling (blue line) and heating (redline). Inset: DSC thermogram for cooling in the range between 180 and220 K, the temperature where a glass transition is observed in reference[33].
6.2 Triphenylene-based Discotic Liquid
Crystals-Hexakis(n-alkyloxy)triphenylene (HATn)
6.2.1 Phase Transitions in the Bulk
Figure 6.22 gives the DSC thermograms for HAT6 for heating and cooling. The peaks
in the heat flow indicate the phase transition between the plastic crystalline and the
liquid crystalline phase (Tcry,colh) and between liquid crystalline and isotropic phase
(Tcolh,iso).
Similar to Py4CEH a hysteresis between heating and cooling is observed, which is larger
for the phase transition between the plastic crystalline and the liquid crystalline phase.
The inset of Figure 6.22 enlarges the heat flow in the temperature range from 180 K to
220 K, the temperature where a glass transition is found in reference [33]. A tiny step-
like change of the heat flow which might indicate a glass transition was detected during
cooling. In contrast to what was observed by Wübbenhorst et al. [33], here the step-
like change in the heat flow is much weaker and hard to discover. To investigate this
in more detail Temperature Modulated Differential Scanning Calorimetry was carried
out but nevertheless no evidence for a glass transition was found.
For all HATn under study corresponding DSC curves were obtained. All discotic
75
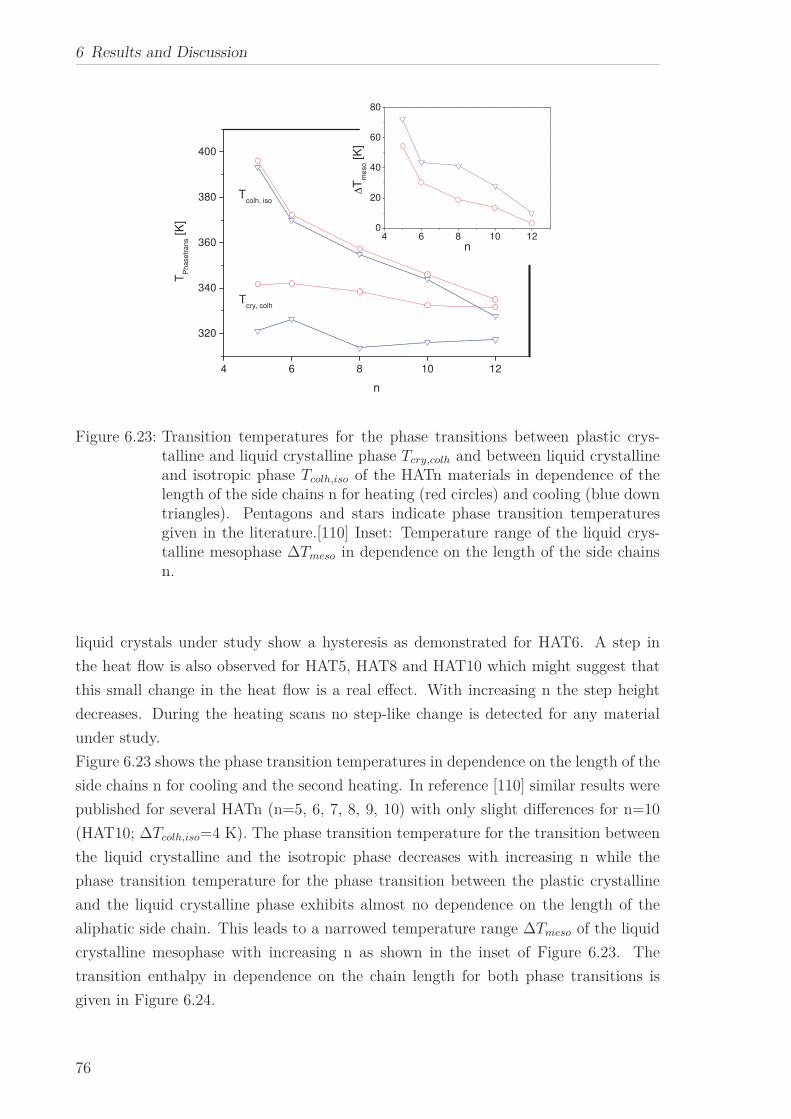
6 Results and Discussion
4 6 8 10 12
320
340
360
380
400
Tcry, colh
TP
hase
tra
ns [K
]
n
Tcolh, iso
4 6 8 10 120
20
40
60
80
∆T
me
so [K
]
n
Figure 6.23: Transition temperatures for the phase transitions between plastic crys-talline and liquid crystalline phase Tcry,colh and between liquid crystallineand isotropic phase Tcolh,iso of the HATn materials in dependence of thelength of the side chains n for heating (red circles) and cooling (blue downtriangles). Pentagons and stars indicate phase transition temperaturesgiven in the literature.[110] Inset: Temperature range of the liquid crys-talline mesophase ∆Tmeso in dependence on the length of the side chainsn.
liquid crystals under study show a hysteresis as demonstrated for HAT6. A step in
the heat flow is also observed for HAT5, HAT8 and HAT10 which might suggest that
this small change in the heat flow is a real effect. With increasing n the step height
decreases. During the heating scans no step-like change is detected for any material
under study.
Figure 6.23 shows the phase transition temperatures in dependence on the length of the
side chains n for cooling and the second heating. In reference [110] similar results were
published for several HATn (n=5, 6, 7, 8, 9, 10) with only slight differences for n=10
(HAT10; ∆Tcolh,iso=4 K). The phase transition temperature for the transition between
the liquid crystalline and the isotropic phase decreases with increasing n while the
phase transition temperature for the phase transition between the plastic crystalline
and the liquid crystalline phase exhibits almost no dependence on the length of the
aliphatic side chain. This leads to a narrowed temperature range ∆Tmeso of the liquid
crystalline mesophase with increasing n as shown in the inset of Figure 6.23. The
transition enthalpy in dependence on the chain length for both phase transitions is
given in Figure 6.24.
76
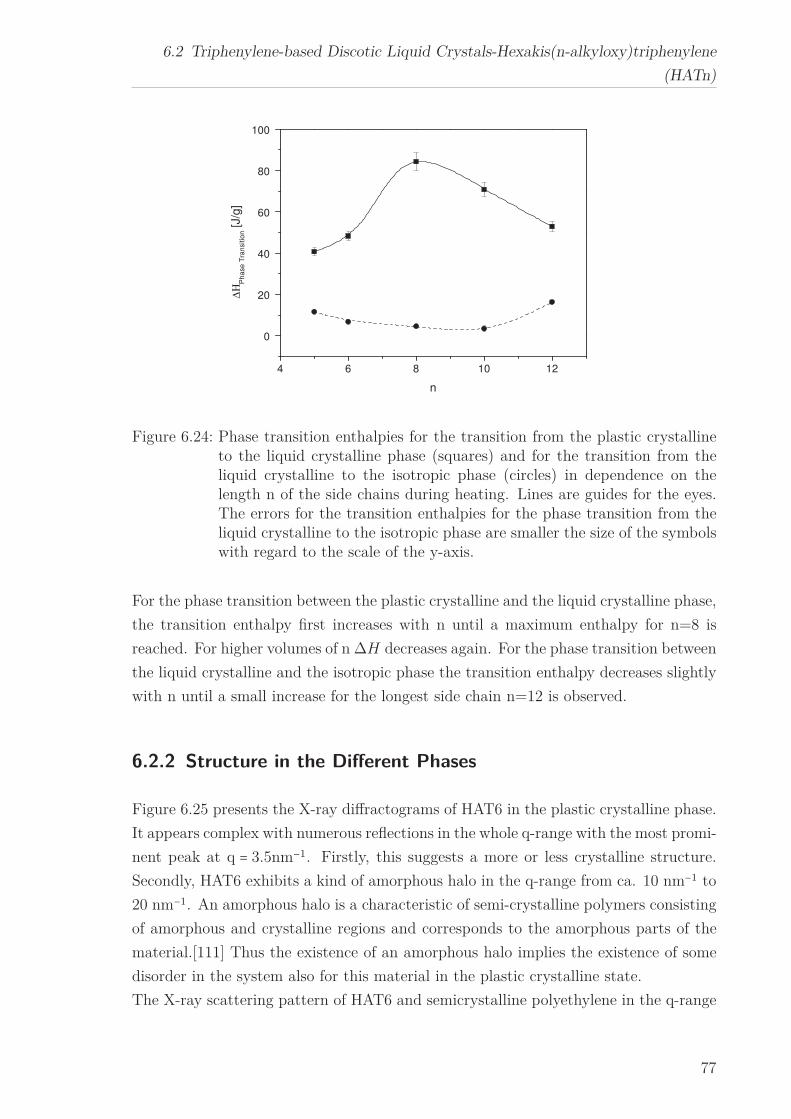
6.2 Triphenylene-based Discotic Liquid Crystals-Hexakis(n-alkyloxy)triphenylene
(HATn)
4 6 8 10 12
0
20
40
60
80
100
∆Η
Ph
ase
Tra
nsitio
n [J/g
]
n
Figure 6.24: Phase transition enthalpies for the transition from the plastic crystallineto the liquid crystalline phase (squares) and for the transition from theliquid crystalline to the isotropic phase (circles) in dependence on thelength n of the side chains during heating. Lines are guides for the eyes.The errors for the transition enthalpies for the phase transition from theliquid crystalline to the isotropic phase are smaller the size of the symbolswith regard to the scale of the y-axis.
For the phase transition between the plastic crystalline and the liquid crystalline phase,
the transition enthalpy first increases with n until a maximum enthalpy for n=8 is
reached. For higher volumes of n ∆H decreases again. For the phase transition between
the liquid crystalline and the isotropic phase the transition enthalpy decreases slightly
with n until a small increase for the longest side chain n=12 is observed.
6.2.2 Structure in the Different Phases
Figure 6.25 presents the X-ray diffractograms of HAT6 in the plastic crystalline phase.
It appears complex with numerous reflections in the whole q-range with the most promi-
nent peak at q = 3.5nm−1. Firstly, this suggests a more or less crystalline structure.
Secondly, HAT6 exhibits a kind of amorphous halo in the q-range from ca. 10 nm−1 to
20 nm−1. An amorphous halo is a characteristic of semi-crystalline polymers consisting
of amorphous and crystalline regions and corresponds to the amorphous parts of the
material.[111] Thus the existence of an amorphous halo implies the existence of some
disorder in the system also for this material in the plastic crystalline state.
The X-ray scattering pattern of HAT6 and semicrystalline polyethylene in the q-range
77
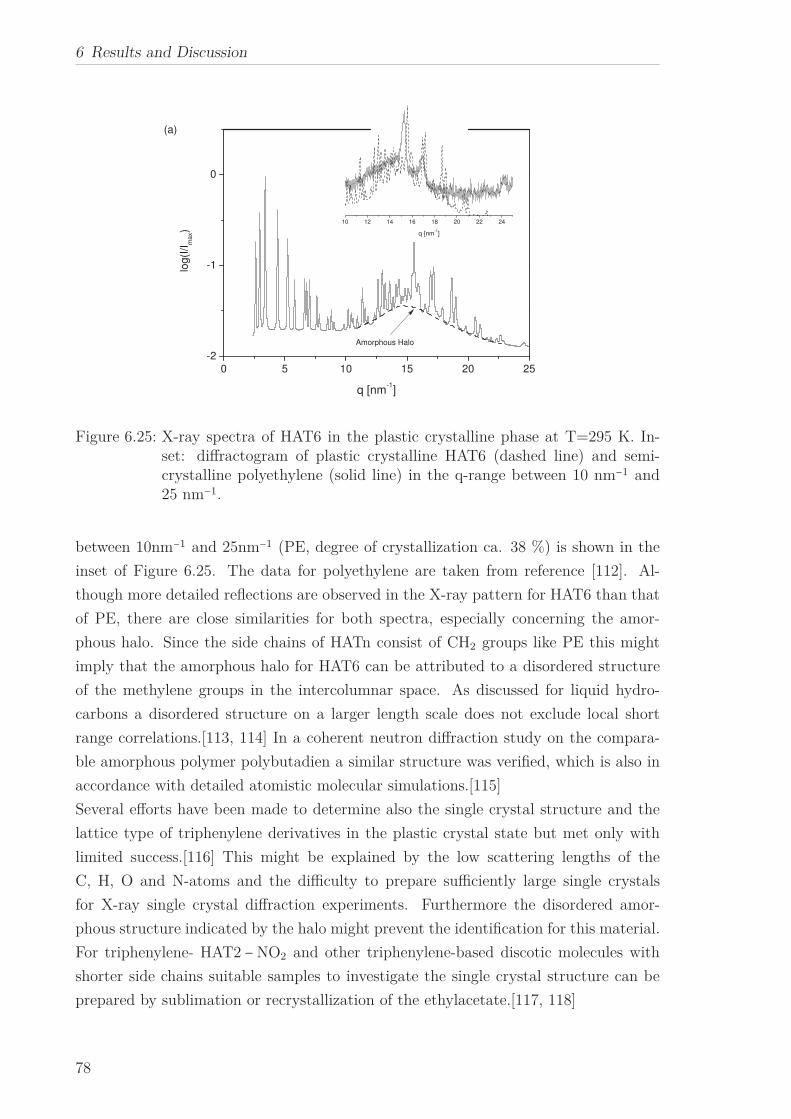
6 Results and Discussion
0 5 10 15 20 25
-2
-1
0
10 12 14 16 18 20 22 24
log(I
/Im
ax)
q [nm-1]
Amorphous Halo
(a)
q [nm-1]
Figure 6.25: X-ray spectra of HAT6 in the plastic crystalline phase at T=295 K. In-set: diffractogram of plastic crystalline HAT6 (dashed line) and semi-crystalline polyethylene (solid line) in the q-range between 10 nm−1 and25 nm−1.
between 10nm−1 and 25nm−1 (PE, degree of crystallization ca. 38 %) is shown in the
inset of Figure 6.25. The data for polyethylene are taken from reference [112]. Al-
though more detailed reflections are observed in the X-ray pattern for HAT6 than that
of PE, there are close similarities for both spectra, especially concerning the amor-
phous halo. Since the side chains of HATn consist of CH2 groups like PE this might
imply that the amorphous halo for HAT6 can be attributed to a disordered structure
of the methylene groups in the intercolumnar space. As discussed for liquid hydro-
carbons a disordered structure on a larger length scale does not exclude local short
range correlations.[113, 114] In a coherent neutron diffraction study on the compara-
ble amorphous polymer polybutadien a similar structure was verified, which is also in
accordance with detailed atomistic molecular simulations.[115]
Several efforts have been made to determine also the single crystal structure and the
lattice type of triphenylene derivatives in the plastic crystal state but met only with
limited success.[116] This might be explained by the low scattering lengths of the
C, H, O and N-atoms and the difficulty to prepare sufficiently large single crystals
for X-ray single crystal diffraction experiments. Furthermore the disordered amor-
phous structure indicated by the halo might prevent the identification for this material.
For triphenylene- HAT2 − NO2 and other triphenylene-based discotic molecules with
shorter side chains suitable samples to investigate the single crystal structure can be
prepared by sublimation or recrystallization of the ethylacetate.[117, 118]
78
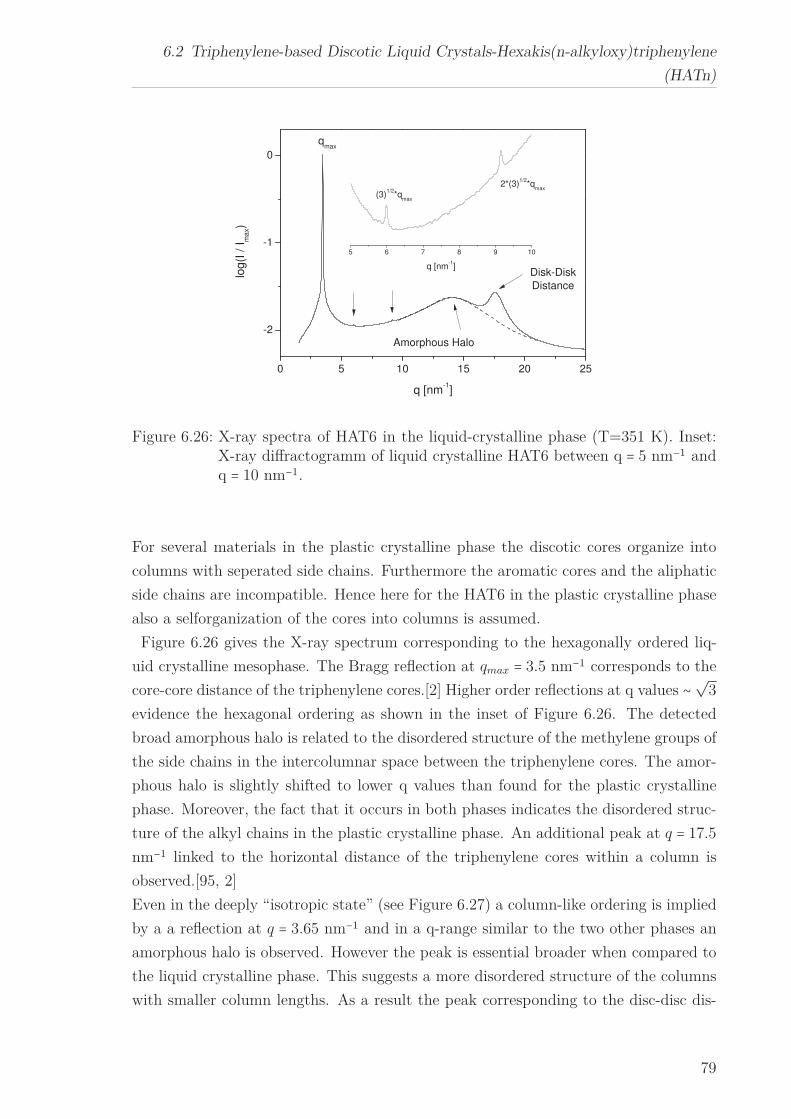
6.2 Triphenylene-based Discotic Liquid Crystals-Hexakis(n-alkyloxy)triphenylene
(HATn)
5 6 7 8 9 10
0 5 10 15 20 25
-2
-1
0
2*(3)1/2
*qmax
q [nm-1]
qmax
(3)1/2
*qmax
log(I
/ I
ma
x)
q [nm-1]
Amorphous Halo
Disk-Disk
Distance
Figure 6.26: X-ray spectra of HAT6 in the liquid-crystalline phase (T=351 K). Inset:X-ray diffractogramm of liquid crystalline HAT6 between q = 5 nm−1 andq = 10 nm−1.
For several materials in the plastic crystalline phase the discotic cores organize into
columns with seperated side chains. Furthermore the aromatic cores and the aliphatic
side chains are incompatible. Hence here for the HAT6 in the plastic crystalline phase
also a selforganization of the cores into columns is assumed.
Figure 6.26 gives the X-ray spectrum corresponding to the hexagonally ordered liq-
uid crystalline mesophase. The Bragg reflection at qmax = 3.5 nm−1 corresponds to the
core-core distance of the triphenylene cores.[2] Higher order reflections at q values ∼ √3
evidence the hexagonal ordering as shown in the inset of Figure 6.26. The detected
broad amorphous halo is related to the disordered structure of the methylene groups of
the side chains in the intercolumnar space between the triphenylene cores. The amor-
phous halo is slightly shifted to lower q values than found for the plastic crystalline
phase. Moreover, the fact that it occurs in both phases indicates the disordered struc-
ture of the alkyl chains in the plastic crystalline phase. An additional peak at q = 17.5
nm−1 linked to the horizontal distance of the triphenylene cores within a column is
observed.[95, 2]
Even in the deeply “isotropic state” (see Figure 6.27) a column-like ordering is implied
by a a reflection at q = 3.65 nm−1 and in a q-range similar to the two other phases an
amorphous halo is observed. However the peak is essential broader when compared to
the liquid crystalline phase. This suggests a more disordered structure of the columns
with smaller column lengths. As a result the peak corresponding to the disc-disc dis-
79
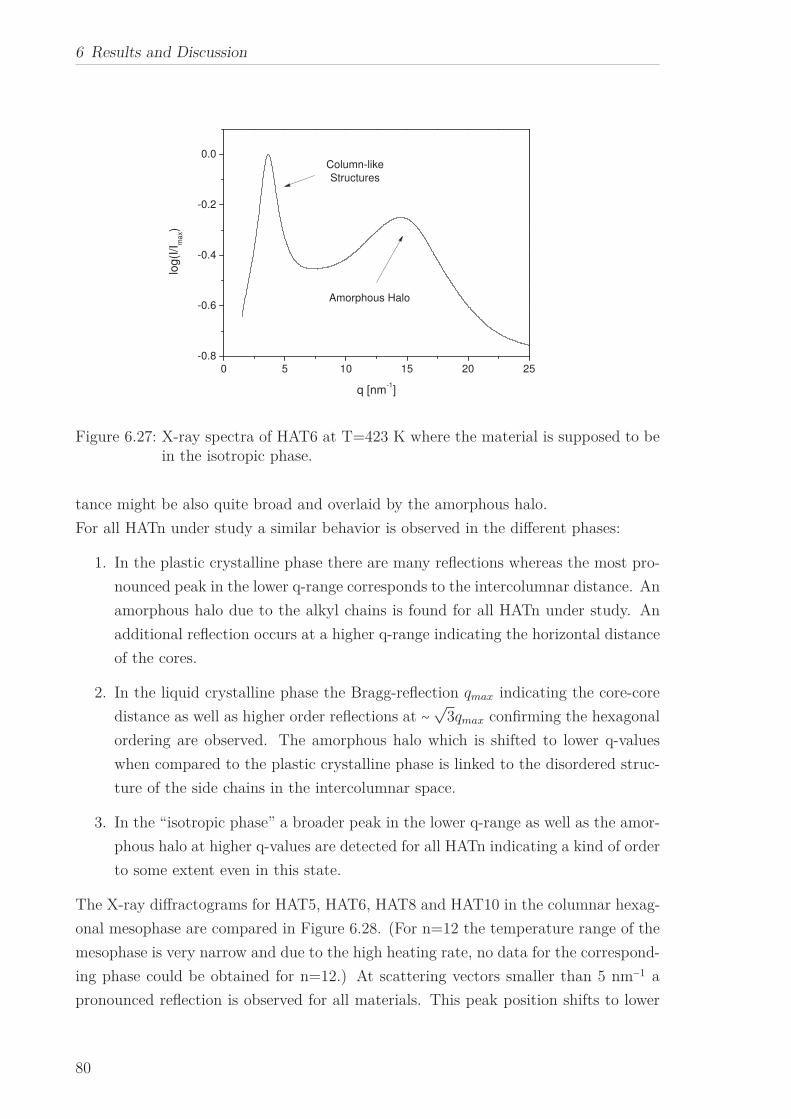
6 Results and Discussion
0 5 10 15 20 25
-0.8
-0.6
-0.4
-0.2
0.0
log(I
/Im
ax)
q [nm-1]
Amorphous Halo
Column-like
Structures
Figure 6.27: X-ray spectra of HAT6 at T=423 K where the material is supposed to bein the isotropic phase.
tance might be also quite broad and overlaid by the amorphous halo.
For all HATn under study a similar behavior is observed in the different phases:
1. In the plastic crystalline phase there are many reflections whereas the most pro-
nounced peak in the lower q-range corresponds to the intercolumnar distance. An
amorphous halo due to the alkyl chains is found for all HATn under study. An
additional reflection occurs at a higher q-range indicating the horizontal distance
of the cores.
2. In the liquid crystalline phase the Bragg-reflection qmax indicating the core-core
distance as well as higher order reflections at ∼ √3qmax confirming the hexagonal
ordering are observed. The amorphous halo which is shifted to lower q-values
when compared to the plastic crystalline phase is linked to the disordered struc-
ture of the side chains in the intercolumnar space.
3. In the “isotropic phase” a broader peak in the lower q-range as well as the amor-
phous halo at higher q-values are detected for all HATn indicating a kind of order
to some extent even in this state.
The X-ray diffractograms for HAT5, HAT6, HAT8 and HAT10 in the columnar hexag-
onal mesophase are compared in Figure 6.28. (For n=12 the temperature range of the
mesophase is very narrow and due to the high heating rate, no data for the correspond-
ing phase could be obtained for n=12.) At scattering vectors smaller than 5 nm−1 a
pronounced reflection is observed for all materials. This peak position shifts to lower
80
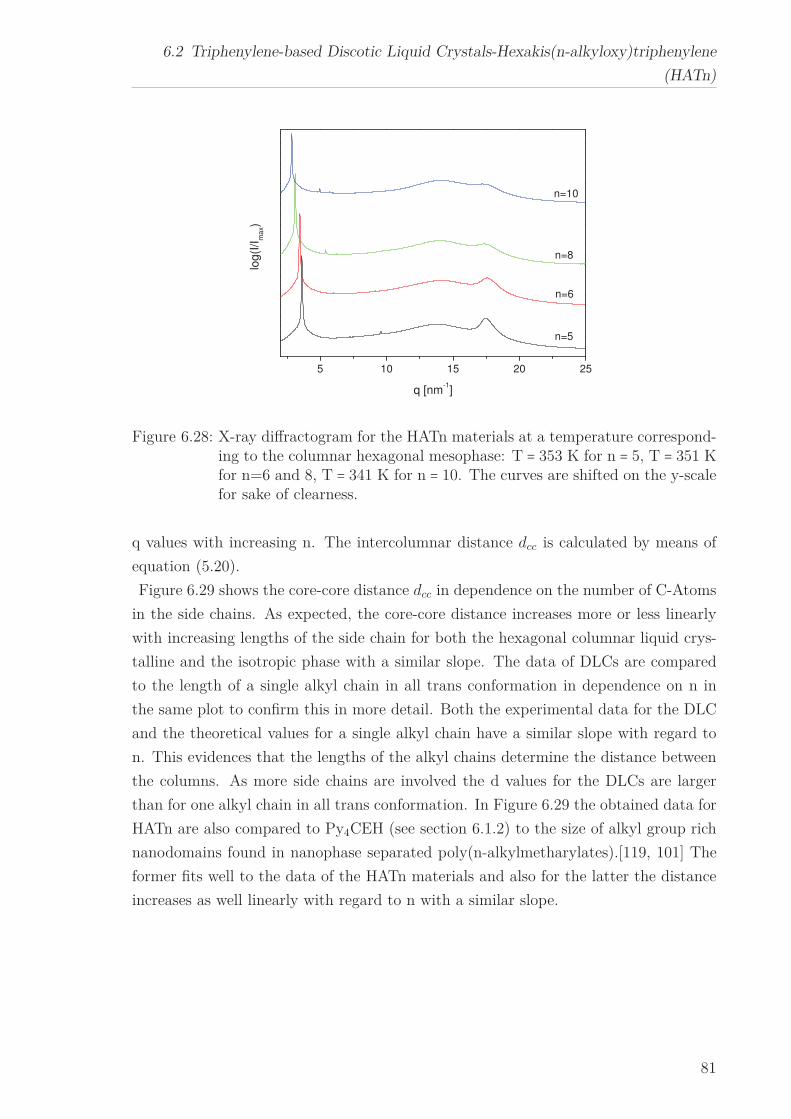
6.2 Triphenylene-based Discotic Liquid Crystals-Hexakis(n-alkyloxy)triphenylene
(HATn)
5 10 15 20 25
n=10
n=8
n=6
log(I
/Im
ax)
q [nm-1]
n=5
Figure 6.28: X-ray diffractogram for the HATn materials at a temperature correspond-ing to the columnar hexagonal mesophase: T = 353 K for n = 5, T = 351 Kfor n=6 and 8, T = 341 K for n = 10. The curves are shifted on the y-scalefor sake of clearness.
q values with increasing n. The intercolumnar distance dcc is calculated by means of
equation (5.20).
Figure 6.29 shows the core-core distance dcc in dependence on the number of C-Atoms
in the side chains. As expected, the core-core distance increases more or less linearly
with increasing lengths of the side chain for both the hexagonal columnar liquid crys-
talline and the isotropic phase with a similar slope. The data of DLCs are compared
to the length of a single alkyl chain in all trans conformation in dependence on n in
the same plot to confirm this in more detail. Both the experimental data for the DLC
and the theoretical values for a single alkyl chain have a similar slope with regard to
n. This evidences that the lengths of the alkyl chains determine the distance between
the columns. As more side chains are involved the d values for the DLCs are larger
than for one alkyl chain in all trans conformation. In Figure 6.29 the obtained data for
HATn are also compared to Py4CEH (see section 6.1.2) to the size of alkyl group rich
nanodomains found in nanophase separated poly(n-alkylmetharylates).[119, 101] The
former fits well to the data of the HATn materials and also for the latter the distance
increases as well linearly with regard to n with a similar slope.
81
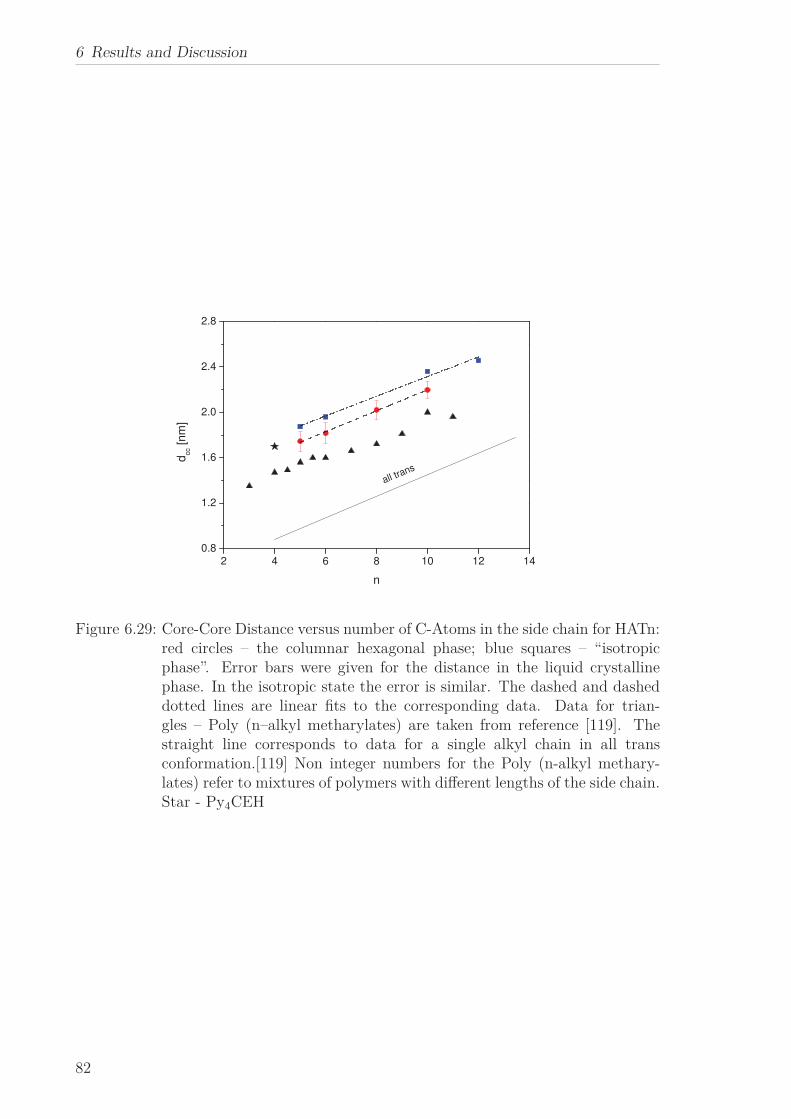
6 Results and Discussion
2 4 6 8 10 12 14
0.8
1.2
1.6
2.0
2.4
2.8
dcc [n
m]
n
all trans
Figure 6.29: Core-Core Distance versus number of C-Atoms in the side chain for HATn:red circles – the columnar hexagonal phase; blue squares – “isotropicphase”. Error bars were given for the distance in the liquid crystallinephase. In the isotropic state the error is similar. The dashed and dasheddotted lines are linear fits to the corresponding data. Data for trian-gles – Poly (n–alkyl metharylates) are taken from reference [119]. Thestraight line corresponds to data for a single alkyl chain in all transconformation.[119] Non integer numbers for the Poly (n-alkyl methary-lates) refer to mixtures of polymers with different lengths of the side chain.Star - Py4CEH
82
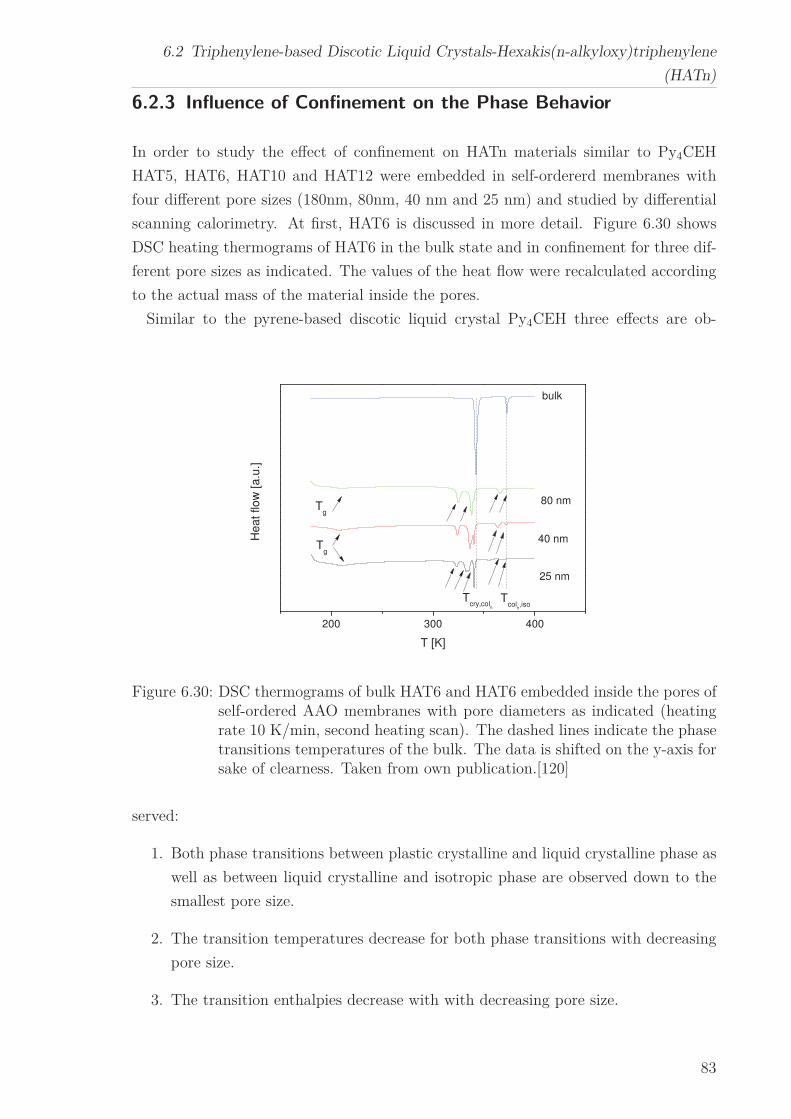
6.2 Triphenylene-based Discotic Liquid Crystals-Hexakis(n-alkyloxy)triphenylene
(HATn)
6.2.3 Influence of Confinement on the Phase Behavior
In order to study the effect of confinement on HATn materials similar to Py4CEH
HAT5, HAT6, HAT10 and HAT12 were embedded in self-ordererd membranes with
four different pore sizes (180nm, 80nm, 40 nm and 25 nm) and studied by differential
scanning calorimetry. At first, HAT6 is discussed in more detail. Figure 6.30 shows
DSC heating thermograms of HAT6 in the bulk state and in confinement for three dif-
ferent pore sizes as indicated. The values of the heat flow were recalculated according
to the actual mass of the material inside the pores.
Similar to the pyrene-based discotic liquid crystal Py4CEH three effects are ob-
200 300 400
Tg
Tcol
h,iso
40 nm
80 nm
Heat flow
[a.u
.]
T [K]
bulk
25 nm
Tcry,col
h
Tg
Figure 6.30: DSC thermograms of bulk HAT6 and HAT6 embedded inside the pores ofself-ordered AAO membranes with pore diameters as indicated (heatingrate 10 K/min, second heating scan). The dashed lines indicate the phasetransitions temperatures of the bulk. The data is shifted on the y-axis forsake of clearness. Taken from own publication.[120]
served:
1. Both phase transitions between plastic crystalline and liquid crystalline phase as
well as between liquid crystalline and isotropic phase are observed down to the
smallest pore size.
2. The transition temperatures decrease for both phase transitions with decreasing
pore size.
3. The transition enthalpies decrease with with decreasing pore size.
83
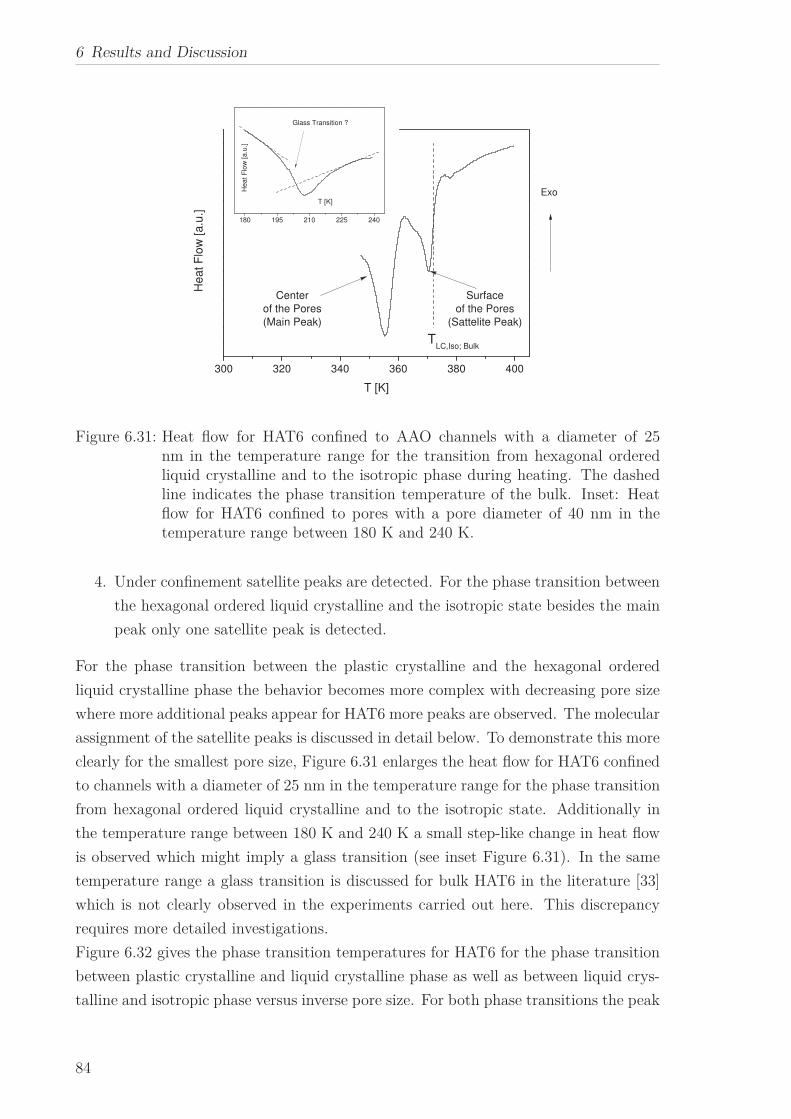
6 Results and Discussion
180 195 210 225 240
300 320 340 360 380 400
He
at
Flo
w [
a.u
.]
T [K]
Glass Transition ?
Surface
of the Pores
(Sattelite Peak)
He
at F
low
[a.u
.]
T [K]
TLC,Iso; Bulk
Center
of the Pores
(Main Peak)
Exo
Figure 6.31: Heat flow for HAT6 confined to AAO channels with a diameter of 25nm in the temperature range for the transition from hexagonal orderedliquid crystalline and to the isotropic phase during heating. The dashedline indicates the phase transition temperature of the bulk. Inset: Heatflow for HAT6 confined to pores with a pore diameter of 40 nm in thetemperature range between 180 K and 240 K.
4. Under confinement satellite peaks are detected. For the phase transition between
the hexagonal ordered liquid crystalline and the isotropic state besides the main
peak only one satellite peak is detected.
For the phase transition between the plastic crystalline and the hexagonal ordered
liquid crystalline phase the behavior becomes more complex with decreasing pore size
where more additional peaks appear for HAT6 more peaks are observed. The molecular
assignment of the satellite peaks is discussed in detail below. To demonstrate this more
clearly for the smallest pore size, Figure 6.31 enlarges the heat flow for HAT6 confined
to channels with a diameter of 25 nm in the temperature range for the phase transition
from hexagonal ordered liquid crystalline and to the isotropic state. Additionally in
the temperature range between 180 K and 240 K a small step-like change in heat flow
is observed which might imply a glass transition (see inset Figure 6.31). In the same
temperature range a glass transition is discussed for bulk HAT6 in the literature [33]
which is not clearly observed in the experiments carried out here. This discrepancy
requires more detailed investigations.
Figure 6.32 gives the phase transition temperatures for HAT6 for the phase transition
between plastic crystalline and liquid crystalline phase as well as between liquid crys-
talline and isotropic phase versus inverse pore size. For both phase transitions the peak
84
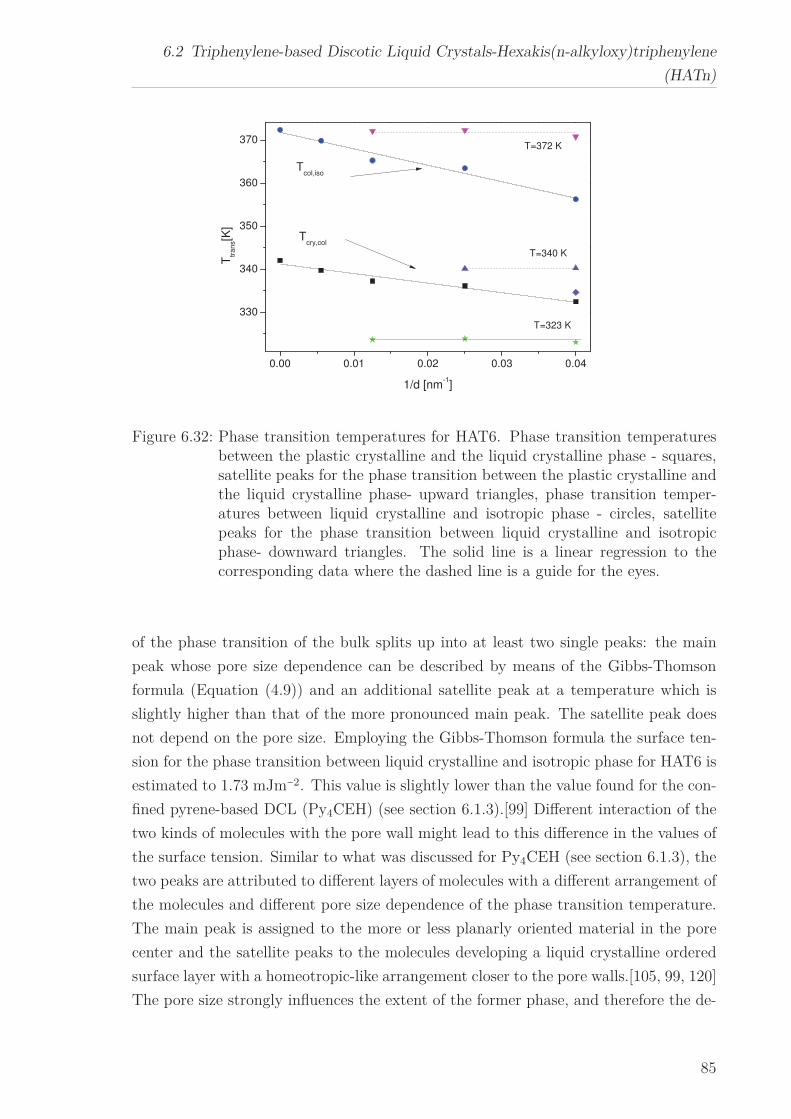
6.2 Triphenylene-based Discotic Liquid Crystals-Hexakis(n-alkyloxy)triphenylene
(HATn)
0.00 0.01 0.02 0.03 0.04
330
340
350
360
370
Ttr
an
s[K
]
1/d [nm-1]
Tcry,col
Tcol,iso
T=340 K
T=372 K
T=323 K
Figure 6.32: Phase transition temperatures for HAT6. Phase transition temperaturesbetween the plastic crystalline and the liquid crystalline phase - squares,satellite peaks for the phase transition between the plastic crystalline andthe liquid crystalline phase- upward triangles, phase transition temper-atures between liquid crystalline and isotropic phase - circles, satellitepeaks for the phase transition between liquid crystalline and isotropicphase- downward triangles. The solid line is a linear regression to thecorresponding data where the dashed line is a guide for the eyes.
of the phase transition of the bulk splits up into at least two single peaks: the main
peak whose pore size dependence can be described by means of the Gibbs-Thomson
formula (Equation (4.9)) and an additional satellite peak at a temperature which is
slightly higher than that of the more pronounced main peak. The satellite peak does
not depend on the pore size. Employing the Gibbs-Thomson formula the surface ten-
sion for the phase transition between liquid crystalline and isotropic phase for HAT6 is
estimated to 1.73 mJm−2. This value is slightly lower than the value found for the con-
fined pyrene-based DCL (Py4CEH) (see section 6.1.3).[99] Different interaction of the
two kinds of molecules with the pore wall might lead to this difference in the values of
the surface tension. Similar to what was discussed for Py4CEH (see section 6.1.3), the
two peaks are attributed to different layers of molecules with a different arrangement of
the molecules and different pore size dependence of the phase transition temperature.
The main peak is assigned to the more or less planarly oriented material in the pore
center and the satellite peaks to the molecules developing a liquid crystalline ordered
surface layer with a homeotropic-like arrangement closer to the pore walls.[105, 99, 120]
The pore size strongly influences the extent of the former phase, and therefore the de-
85
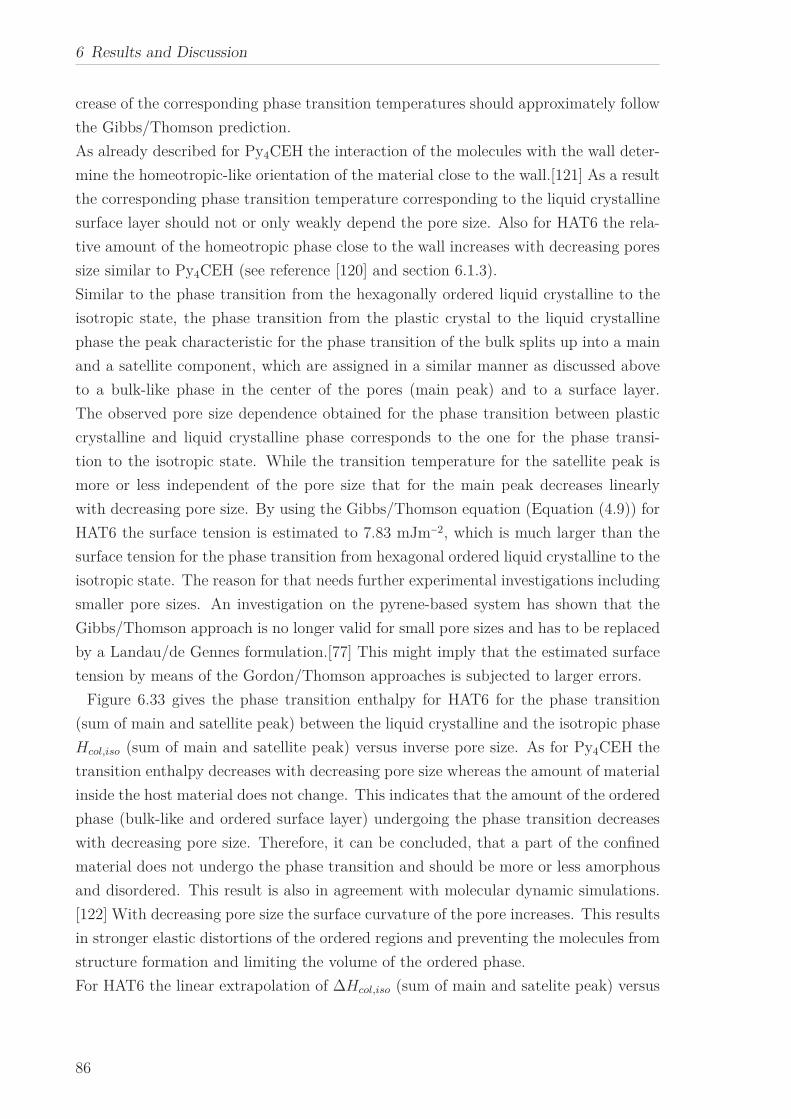
6 Results and Discussion
crease of the corresponding phase transition temperatures should approximately follow
the Gibbs/Thomson prediction.
As already described for Py4CEH the interaction of the molecules with the wall deter-
mine the homeotropic-like orientation of the material close to the wall.[121] As a result
the corresponding phase transition temperature corresponding to the liquid crystalline
surface layer should not or only weakly depend the pore size. Also for HAT6 the rela-
tive amount of the homeotropic phase close to the wall increases with decreasing pores
size similar to Py4CEH (see reference [120] and section 6.1.3).
Similar to the phase transition from the hexagonally ordered liquid crystalline to the
isotropic state, the phase transition from the plastic crystal to the liquid crystalline
phase the peak characteristic for the phase transition of the bulk splits up into a main
and a satellite component, which are assigned in a similar manner as discussed above
to a bulk-like phase in the center of the pores (main peak) and to a surface layer.
The observed pore size dependence obtained for the phase transition between plastic
crystalline and liquid crystalline phase corresponds to the one for the phase transi-
tion to the isotropic state. While the transition temperature for the satellite peak is
more or less independent of the pore size that for the main peak decreases linearly
with decreasing pore size. By using the Gibbs/Thomson equation (Equation (4.9)) for
HAT6 the surface tension is estimated to 7.83 mJm−2, which is much larger than the
surface tension for the phase transition from hexagonal ordered liquid crystalline to the
isotropic state. The reason for that needs further experimental investigations including
smaller pore sizes. An investigation on the pyrene-based system has shown that the
Gibbs/Thomson approach is no longer valid for small pore sizes and has to be replaced
by a Landau/de Gennes formulation.[77] This might imply that the estimated surface
tension by means of the Gordon/Thomson approaches is subjected to larger errors.
Figure 6.33 gives the phase transition enthalpy for HAT6 for the phase transition
(sum of main and satellite peak) between the liquid crystalline and the isotropic phase
Hcol,iso (sum of main and satellite peak) versus inverse pore size. As for Py4CEH the
transition enthalpy decreases with decreasing pore size whereas the amount of material
inside the host material does not change. This indicates that the amount of the ordered
phase (bulk-like and ordered surface layer) undergoing the phase transition decreases
with decreasing pore size. Therefore, it can be concluded, that a part of the confined
material does not undergo the phase transition and should be more or less amorphous
and disordered. This result is also in agreement with molecular dynamic simulations.
[122] With decreasing pore size the surface curvature of the pore increases. This results
in stronger elastic distortions of the ordered regions and preventing the molecules from
structure formation and limiting the volume of the ordered phase.
For HAT6 the linear extrapolation of ∆Hcol,iso (sum of main and satelite peak) versus
86
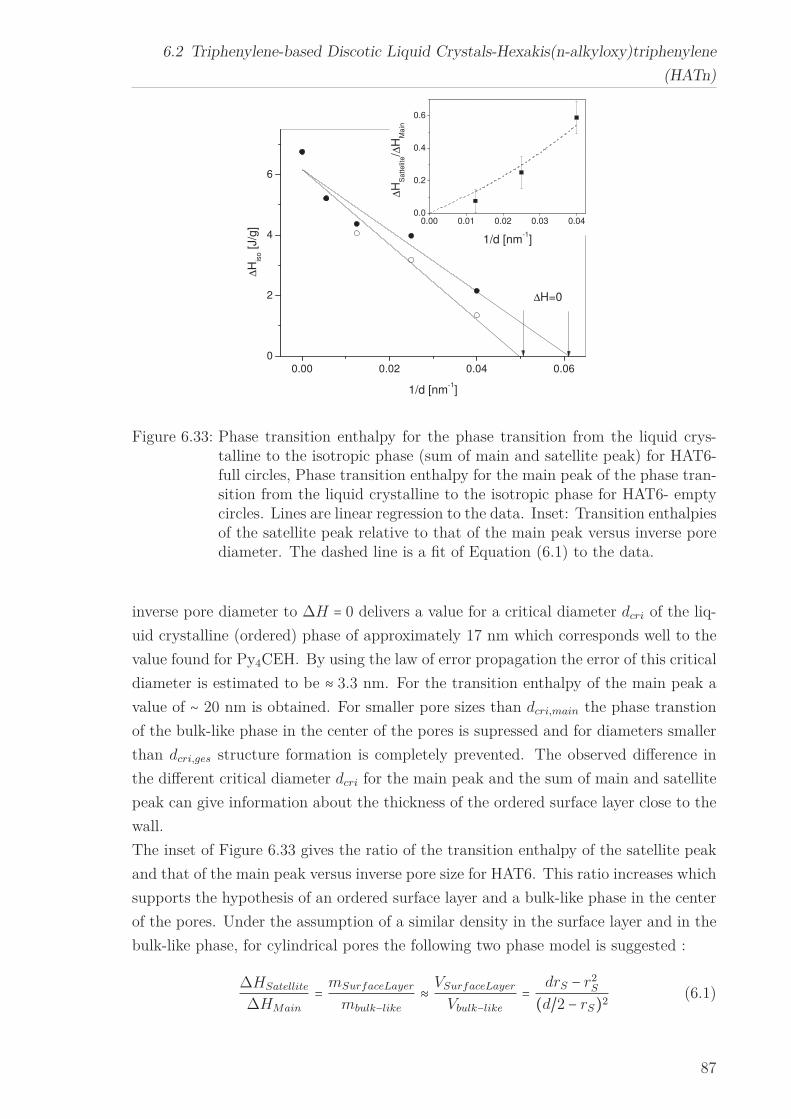
6.2 Triphenylene-based Discotic Liquid Crystals-Hexakis(n-alkyloxy)triphenylene
(HATn)
0.00 0.02 0.04 0.06
0
2
4
6
0.00 0.01 0.02 0.03 0.040.0
0.2
0.4
0.6
∆H
iso [J/g
]
1/d [nm-1]
∆H=0
∆H
Sa
tte
lite/∆
HM
ain
1/d [nm-1]
Figure 6.33: Phase transition enthalpy for the phase transition from the liquid crys-talline to the isotropic phase (sum of main and satellite peak) for HAT6-full circles, Phase transition enthalpy for the main peak of the phase tran-sition from the liquid crystalline to the isotropic phase for HAT6- emptycircles. Lines are linear regression to the data. Inset: Transition enthalpiesof the satellite peak relative to that of the main peak versus inverse porediameter. The dashed line is a fit of Equation (6.1) to the data.
inverse pore diameter to ∆H = 0 delivers a value for a critical diameter dcri of the liq-
uid crystalline (ordered) phase of approximately 17 nm which corresponds well to the
value found for Py4CEH. By using the law of error propagation the error of this critical
diameter is estimated to be ≈ 3.3 nm. For the transition enthalpy of the main peak a
value of ∼ 20 nm is obtained. For smaller pore sizes than dcri,main the phase transtion
of the bulk-like phase in the center of the pores is supressed and for diameters smaller
than dcri,ges structure formation is completely prevented. The observed difference in
the different critical diameter dcri for the main peak and the sum of main and satellite
peak can give information about the thickness of the ordered surface layer close to the
wall.
The inset of Figure 6.33 gives the ratio of the transition enthalpy of the satellite peak
and that of the main peak versus inverse pore size for HAT6. This ratio increases which
supports the hypothesis of an ordered surface layer and a bulk-like phase in the center
of the pores. Under the assumption of a similar density in the surface layer and in the
bulk-like phase, for cylindrical pores the following two phase model is suggested :
∆HSatellite
∆HMain
= mSurfaceLayer
mbulk−like
≈ VSurfaceLayer
Vbulk−like
= drS − r2S(d/2 − rS)2
(6.1)
87
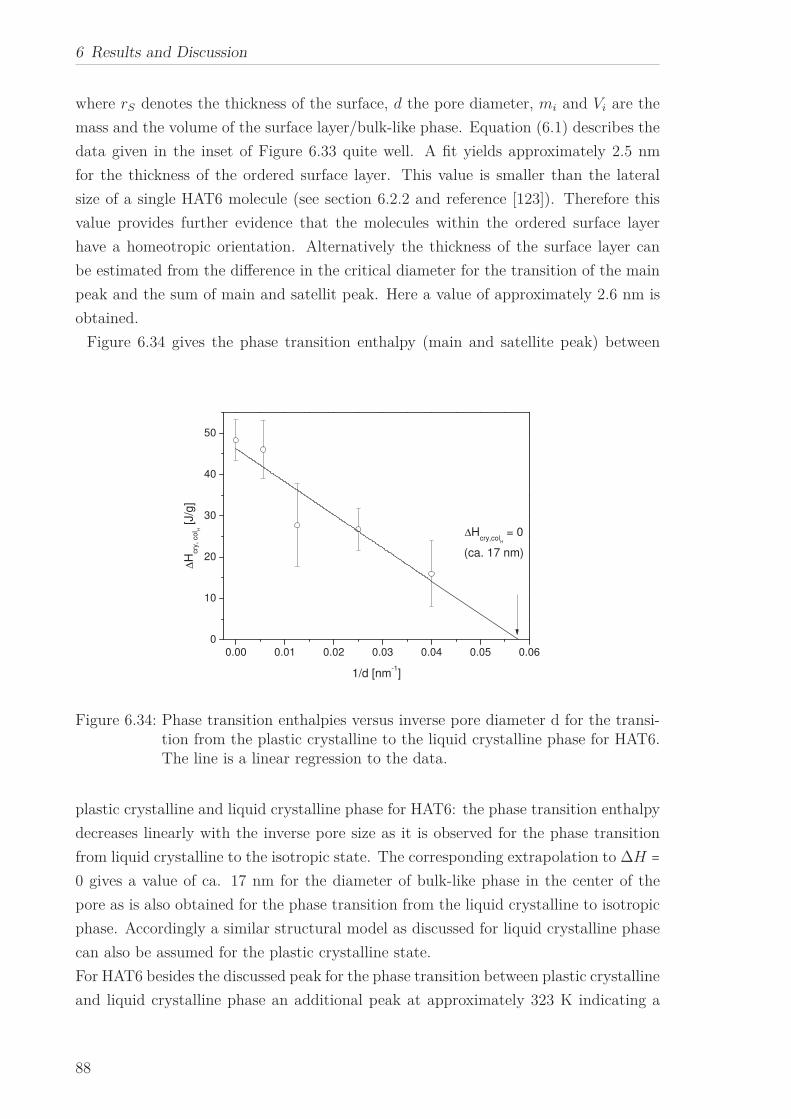
6 Results and Discussion
where rS denotes the thickness of the surface, d the pore diameter, mi and Vi are the
mass and the volume of the surface layer/bulk-like phase. Equation (6.1) describes the
data given in the inset of Figure 6.33 quite well. A fit yields approximately 2.5 nm
for the thickness of the ordered surface layer. This value is smaller than the lateral
size of a single HAT6 molecule (see section 6.2.2 and reference [123]). Therefore this
value provides further evidence that the molecules within the ordered surface layer
have a homeotropic orientation. Alternatively the thickness of the surface layer can
be estimated from the difference in the critical diameter for the transition of the main
peak and the sum of main and satellit peak. Here a value of approximately 2.6 nm is
obtained.
Figure 6.34 gives the phase transition enthalpy (main and satellite peak) between
0.00 0.01 0.02 0.03 0.04 0.05 0.06
0
10
20
30
40
50
∆Hcry,col
H
= 0
(ca. 17 nm)
∆H
cry
, co
l H
[J/g
]
1/d [nm-1]
Figure 6.34: Phase transition enthalpies versus inverse pore diameter d for the transi-tion from the plastic crystalline to the liquid crystalline phase for HAT6.The line is a linear regression to the data.
plastic crystalline and liquid crystalline phase for HAT6: the phase transition enthalpy
decreases linearly with the inverse pore size as it is observed for the phase transition
from liquid crystalline to the isotropic state. The corresponding extrapolation to ∆H =0 gives a value of ca. 17 nm for the diameter of bulk-like phase in the center of the
pore as is also obtained for the phase transition from the liquid crystalline to isotropic
phase. Accordingly a similar structural model as discussed for liquid crystalline phase
can also be assumed for the plastic crystalline state.
For HAT6 besides the discussed peak for the phase transition between plastic crystalline
and liquid crystalline phase an additional peak at approximately 323 K indicating a
88
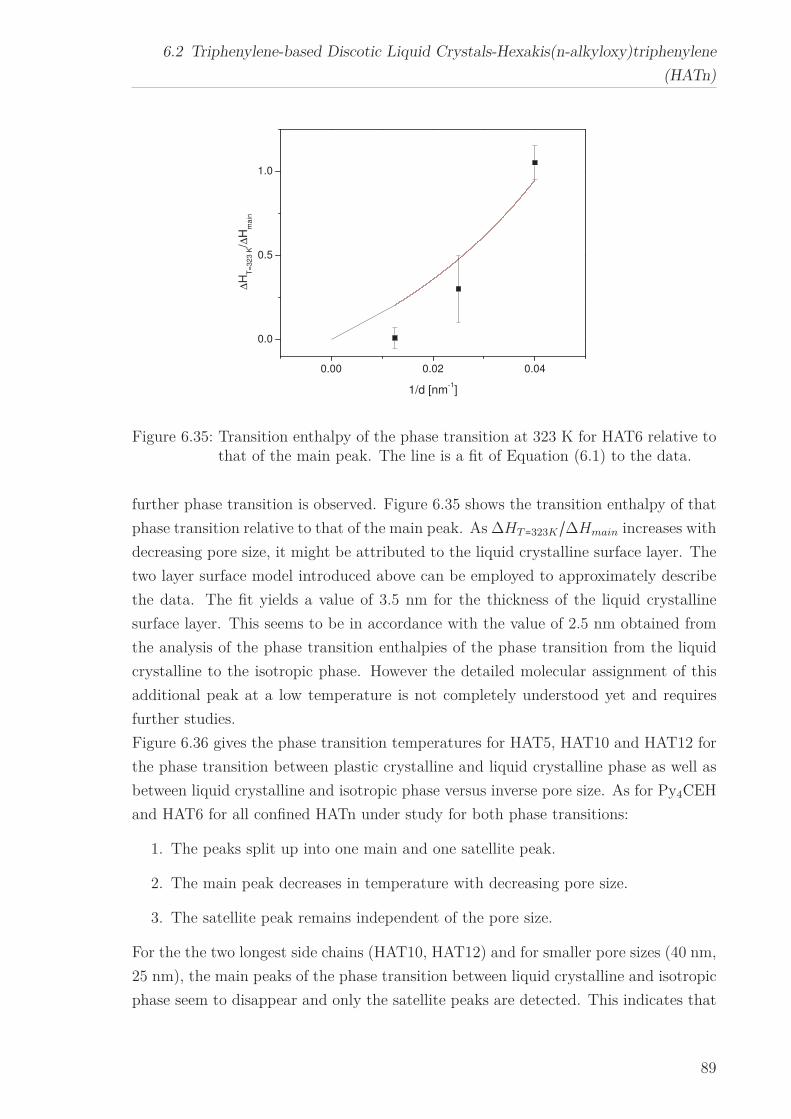
6.2 Triphenylene-based Discotic Liquid Crystals-Hexakis(n-alkyloxy)triphenylene
(HATn)
0.00 0.02 0.04
0.0
0.5
1.0
∆H
T=
32
3 K
/∆H
ma
in
1/d [nm-1]
Figure 6.35: Transition enthalpy of the phase transition at 323 K for HAT6 relative tothat of the main peak. The line is a fit of Equation (6.1) to the data.
further phase transition is observed. Figure 6.35 shows the transition enthalpy of that
phase transition relative to that of the main peak. As ∆HT=323K/∆Hmain increases with
decreasing pore size, it might be attributed to the liquid crystalline surface layer. The
two layer surface model introduced above can be employed to approximately describe
the data. The fit yields a value of 3.5 nm for the thickness of the liquid crystalline
surface layer. This seems to be in accordance with the value of 2.5 nm obtained from
the analysis of the phase transition enthalpies of the phase transition from the liquid
crystalline to the isotropic phase. However the detailed molecular assignment of this
additional peak at a low temperature is not completely understood yet and requires
further studies.
Figure 6.36 gives the phase transition temperatures for HAT5, HAT10 and HAT12 for
the phase transition between plastic crystalline and liquid crystalline phase as well as
between liquid crystalline and isotropic phase versus inverse pore size. As for Py4CEH
and HAT6 for all confined HATn under study for both phase transitions:
1. The peaks split up into one main and one satellite peak.
2. The main peak decreases in temperature with decreasing pore size.
3. The satellite peak remains independent of the pore size.
For the the two longest side chains (HAT10, HAT12) and for smaller pore sizes (40 nm,
25 nm), the main peaks of the phase transition between liquid crystalline and isotropic
phase seem to disappear and only the satellite peaks are detected. This indicates that
89
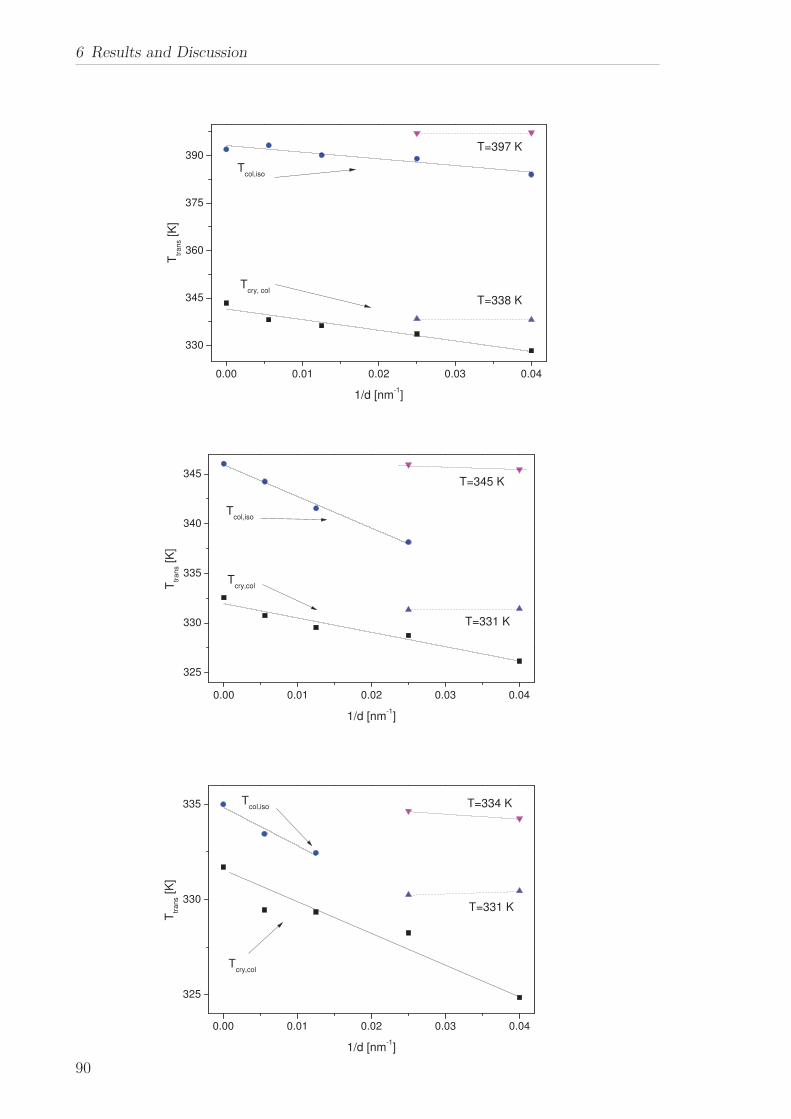
6 Results and Discussion
0.00 0.01 0.02 0.03 0.04
330
345
360
375
390
1/d [nm-1]
T=397 K
Tcol,iso
Ttr
an
s [K
]
Tcry, col
T=338 K
0.00 0.01 0.02 0.03 0.04
325
330
335
340
345
T=331 K
Tcol,iso
Ttr
an
s [K
]
1/d [nm-1]
Tcry,col
T=345 K
0.00 0.01 0.02 0.03 0.04
325
330
335
Ttr
an
s [K
]
Tcol,iso
Tcry,col
T=334 K
1/d [nm-1]
T=331 K
90
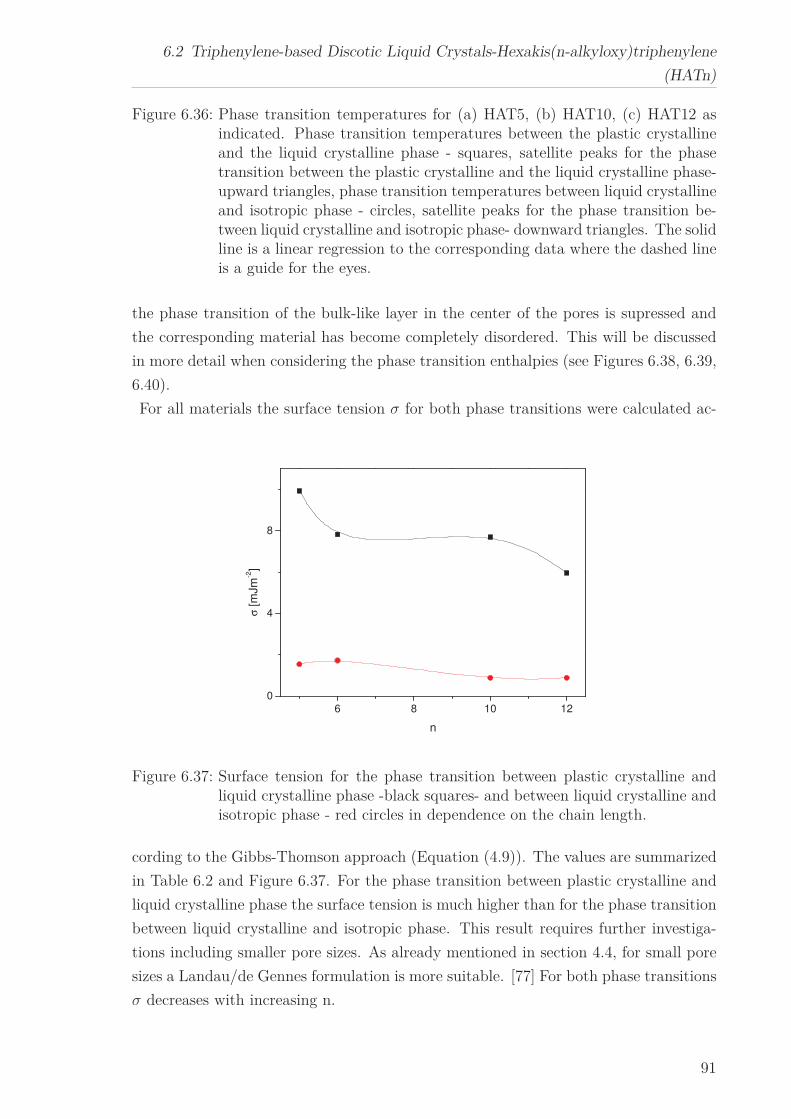
6.2 Triphenylene-based Discotic Liquid Crystals-Hexakis(n-alkyloxy)triphenylene
(HATn)
Figure 6.36: Phase transition temperatures for (a) HAT5, (b) HAT10, (c) HAT12 asindicated. Phase transition temperatures between the plastic crystallineand the liquid crystalline phase - squares, satellite peaks for the phasetransition between the plastic crystalline and the liquid crystalline phase-upward triangles, phase transition temperatures between liquid crystallineand isotropic phase - circles, satellite peaks for the phase transition be-tween liquid crystalline and isotropic phase- downward triangles. The solidline is a linear regression to the corresponding data where the dashed lineis a guide for the eyes.
the phase transition of the bulk-like layer in the center of the pores is supressed and
the corresponding material has become completely disordered. This will be discussed
in more detail when considering the phase transition enthalpies (see Figures 6.38, 6.39,
6.40).
For all materials the surface tension σ for both phase transitions were calculated ac-
6 8 10 12
0
4
8
σ [m
Jm
-2]
n
Figure 6.37: Surface tension for the phase transition between plastic crystalline andliquid crystalline phase -black squares- and between liquid crystalline andisotropic phase - red circles in dependence on the chain length.
cording to the Gibbs-Thomson approach (Equation (4.9)). The values are summarized
in Table 6.2 and Figure 6.37. For the phase transition between plastic crystalline and
liquid crystalline phase the surface tension is much higher than for the phase transition
between liquid crystalline and isotropic phase. This result requires further investiga-
tions including smaller pore sizes. As already mentioned in section 4.4, for small pore
sizes a Landau/de Gennes formulation is more suitable. [77] For both phase transitions
σ decreases with increasing n.
91
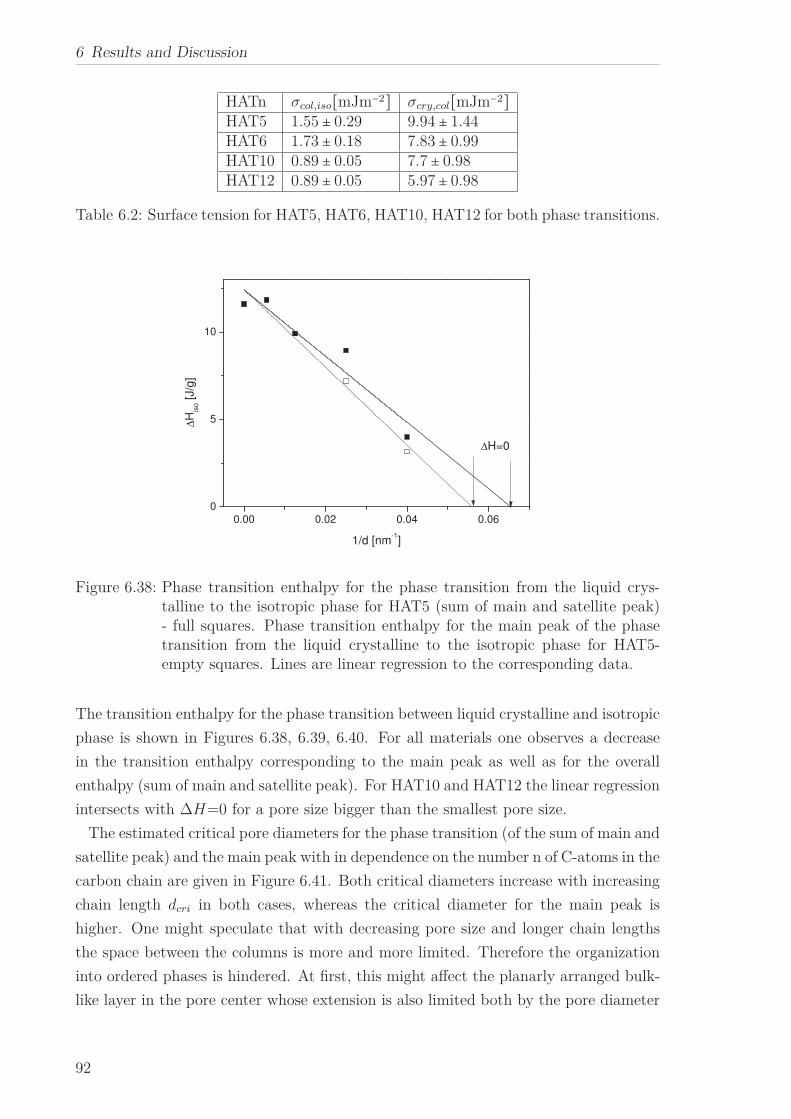
6 Results and Discussion
HATn σcol,iso[mJm−2] σcry,col[mJm−2]HAT5 1.55 ± 0.29 9.94 ± 1.44HAT6 1.73 ± 0.18 7.83 ± 0.99HAT10 0.89 ± 0.05 7.7 ± 0.98HAT12 0.89 ± 0.05 5.97 ± 0.98
Table 6.2: Surface tension for HAT5, HAT6, HAT10, HAT12 for both phase transitions.
0.00 0.02 0.04 0.06
0
5
10
∆H=0
∆H
iso [J/g
]
1/d [nm-1]
Figure 6.38: Phase transition enthalpy for the phase transition from the liquid crys-talline to the isotropic phase for HAT5 (sum of main and satellite peak)- full squares. Phase transition enthalpy for the main peak of the phasetransition from the liquid crystalline to the isotropic phase for HAT5-empty squares. Lines are linear regression to the corresponding data.
The transition enthalpy for the phase transition between liquid crystalline and isotropic
phase is shown in Figures 6.38, 6.39, 6.40. For all materials one observes a decrease
in the transition enthalpy corresponding to the main peak as well as for the overall
enthalpy (sum of main and satellite peak). For HAT10 and HAT12 the linear regression
intersects with ∆H=0 for a pore size bigger than the smallest pore size.
The estimated critical pore diameters for the phase transition (of the sum of main and
satellite peak) and the main peak with in dependence on the number n of C-atoms in the
carbon chain are given in Figure 6.41. Both critical diameters increase with increasing
chain length dcri in both cases, whereas the critical diameter for the main peak is
higher. One might speculate that with decreasing pore size and longer chain lengths
the space between the columns is more and more limited. Therefore the organization
into ordered phases is hindered. At first, this might affect the planarly arranged bulk-
like layer in the pore center whose extension is also limited both by the pore diameter
92
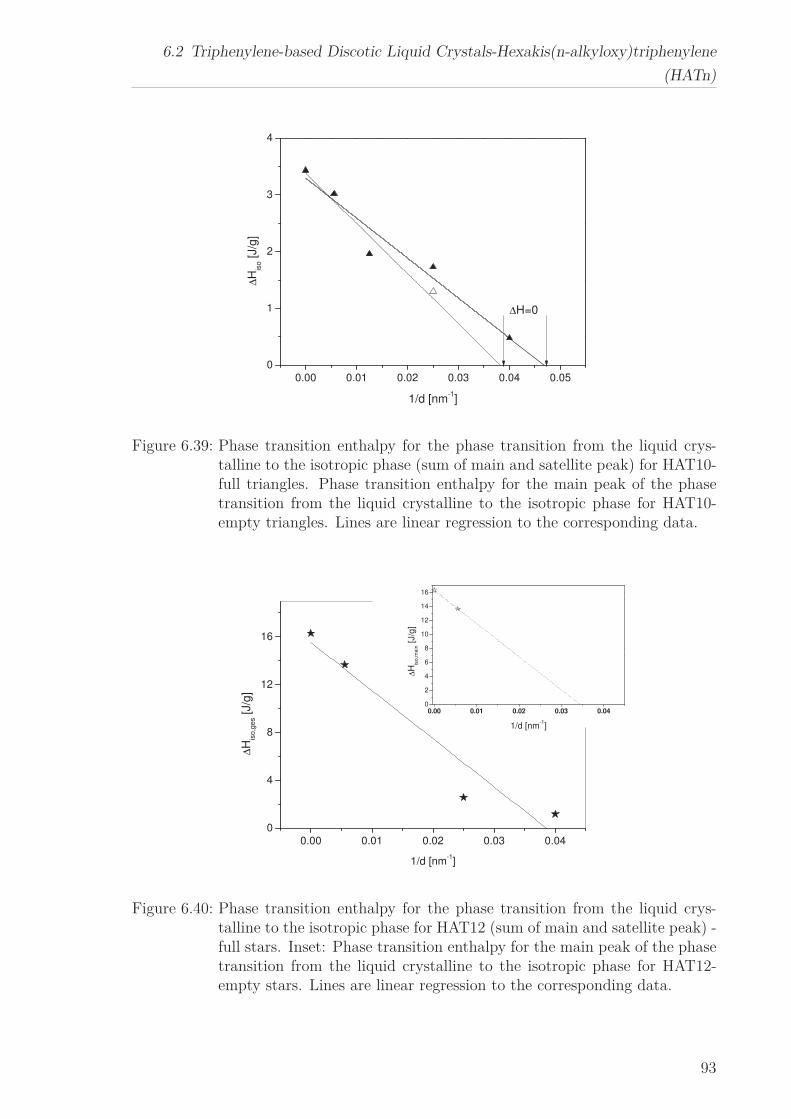
6.2 Triphenylene-based Discotic Liquid Crystals-Hexakis(n-alkyloxy)triphenylene
(HATn)
0.00 0.01 0.02 0.03 0.04 0.05
0
1
2
3
4
∆H
iso [J/g
]
1/d [nm-1]
∆H=0
Figure 6.39: Phase transition enthalpy for the phase transition from the liquid crys-talline to the isotropic phase (sum of main and satellite peak) for HAT10-full triangles. Phase transition enthalpy for the main peak of the phasetransition from the liquid crystalline to the isotropic phase for HAT10-empty triangles. Lines are linear regression to the corresponding data.
0.00 0.01 0.02 0.03 0.04
0
4
8
12
16
∆H
iso
,ge
s [J/g
]
1/d [nm-1]
0.00 0.01 0.02 0.03 0.04
0
2
4
6
8
10
12
14
16
∆H
iso
,ma
in [J/g
]
1/d [nm-1]
Figure 6.40: Phase transition enthalpy for the phase transition from the liquid crys-talline to the isotropic phase for HAT12 (sum of main and satellite peak) -full stars. Inset: Phase transition enthalpy for the main peak of the phasetransition from the liquid crystalline to the isotropic phase for HAT12-empty stars. Lines are linear regression to the corresponding data.
93
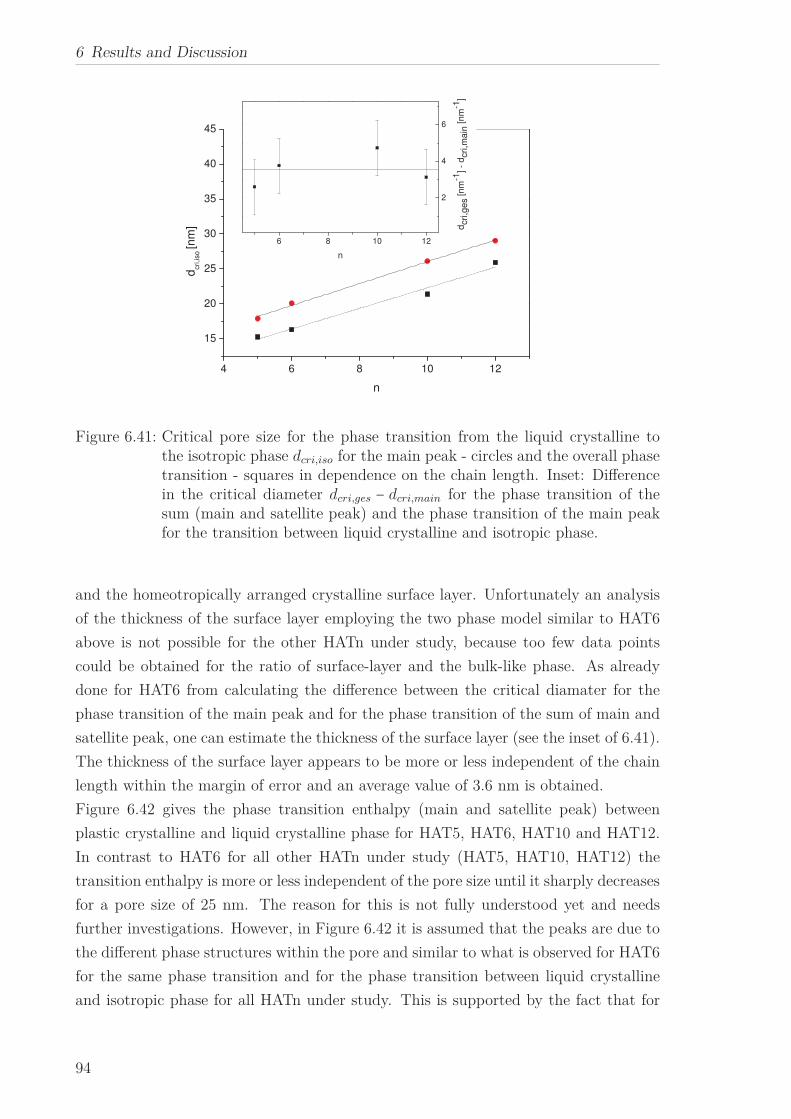
6 Results and Discussion
4 6 8 10 12
15
20
25
30
35
40
45
6 8 10 12
2
4
6
dcri
,iso
[nm
]
n
dcri,g
es [nm
-1] -
dcri,m
ain
[nm
-1]
n
Figure 6.41: Critical pore size for the phase transition from the liquid crystalline tothe isotropic phase dcri,iso for the main peak - circles and the overall phasetransition - squares in dependence on the chain length. Inset: Differencein the critical diameter dcri,ges − dcri,main for the phase transition of thesum (main and satellite peak) and the phase transition of the main peakfor the transition between liquid crystalline and isotropic phase.
and the homeotropically arranged crystalline surface layer. Unfortunately an analysis
of the thickness of the surface layer employing the two phase model similar to HAT6
above is not possible for the other HATn under study, because too few data points
could be obtained for the ratio of surface-layer and the bulk-like phase. As already
done for HAT6 from calculating the difference between the critical diamater for the
phase transition of the main peak and for the phase transition of the sum of main and
satellite peak, one can estimate the thickness of the surface layer (see the inset of 6.41).
The thickness of the surface layer appears to be more or less independent of the chain
length within the margin of error and an average value of 3.6 nm is obtained.
Figure 6.42 gives the phase transition enthalpy (main and satellite peak) between
plastic crystalline and liquid crystalline phase for HAT5, HAT6, HAT10 and HAT12.
In contrast to HAT6 for all other HATn under study (HAT5, HAT10, HAT12) the
transition enthalpy is more or less independent of the pore size until it sharply decreases
for a pore size of 25 nm. The reason for this is not fully understood yet and needs
further investigations. However, in Figure 6.42 it is assumed that the peaks are due to
the different phase structures within the pore and similar to what is observed for HAT6
for the same phase transition and for the phase transition between liquid crystalline
and isotropic phase for all HATn under study. This is supported by the fact that for
94
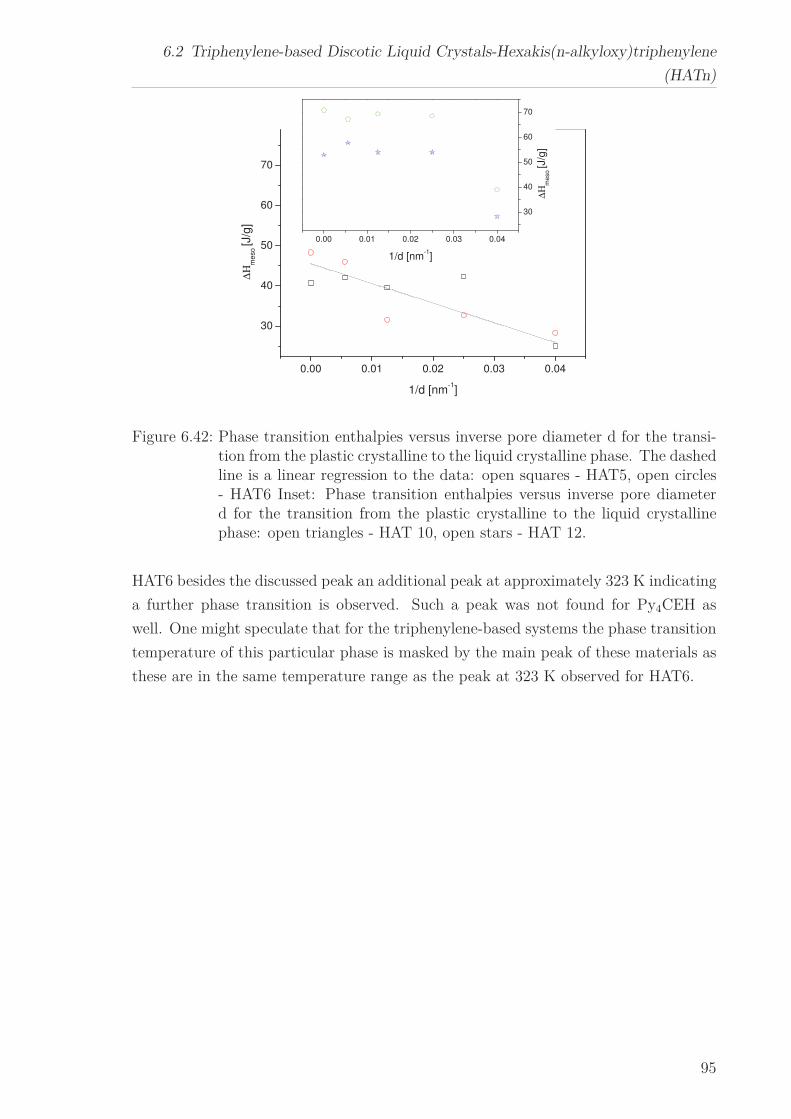
6.2 Triphenylene-based Discotic Liquid Crystals-Hexakis(n-alkyloxy)triphenylene
(HATn)
0.00 0.01 0.02 0.03 0.04
30
40
50
60
70
0.00 0.01 0.02 0.03 0.04
30
40
50
60
70
∆Η
me
so
[J/g
]
1/d [nm-1]
∆Η
meso [J
/g]
1/d [nm-1]
Figure 6.42: Phase transition enthalpies versus inverse pore diameter d for the transi-tion from the plastic crystalline to the liquid crystalline phase. The dashedline is a linear regression to the data: open squares - HAT5, open circles- HAT6 Inset: Phase transition enthalpies versus inverse pore diameterd for the transition from the plastic crystalline to the liquid crystallinephase: open triangles - HAT 10, open stars - HAT 12.
HAT6 besides the discussed peak an additional peak at approximately 323 K indicating
a further phase transition is observed. Such a peak was not found for Py4CEH as
well. One might speculate that for the triphenylene-based systems the phase transition
temperature of this particular phase is masked by the main peak of these materials as
these are in the same temperature range as the peak at 323 K observed for HAT6.
95
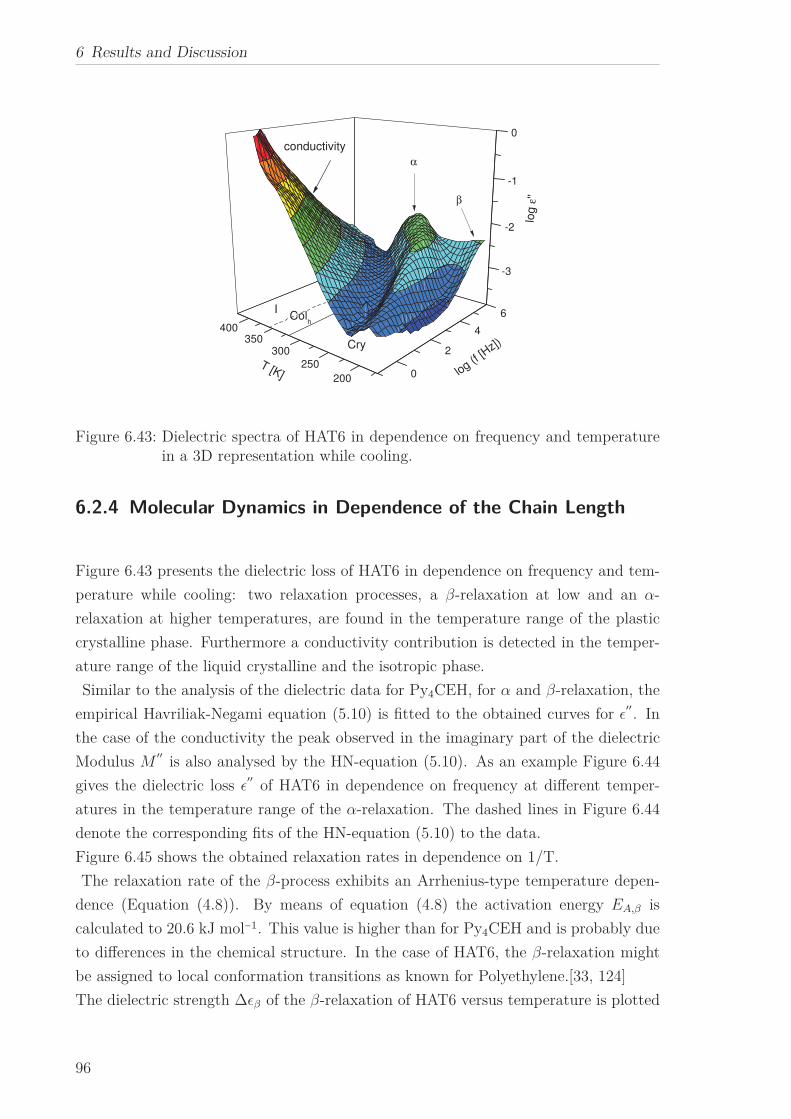
6 Results and Discussion
0
2
4
6
200
250
300350
400
-3
-2
-1
0
T [K]
log ε
''
log (f [H
z])Cry
Colh
I
conductivity
α
β
Figure 6.43: Dielectric spectra of HAT6 in dependence on frequency and temperaturein a 3D representation while cooling.
6.2.4 Molecular Dynamics in Dependence of the Chain Length
Figure 6.43 presents the dielectric loss of HAT6 in dependence on frequency and tem-
perature while cooling: two relaxation processes, a β-relaxation at low and an α-
relaxation at higher temperatures, are found in the temperature range of the plastic
crystalline phase. Furthermore a conductivity contribution is detected in the temper-
ature range of the liquid crystalline and the isotropic phase.
Similar to the analysis of the dielectric data for Py4CEH, for α and β-relaxation, the
empirical Havriliak-Negami equation (5.10) is fitted to the obtained curves for ǫ′′. In
the case of the conductivity the peak observed in the imaginary part of the dielectric
Modulus M′′
is also analysed by the HN-equation (5.10). As an example Figure 6.44
gives the dielectric loss ǫ′′
of HAT6 in dependence on frequency at different temper-
atures in the temperature range of the α-relaxation. The dashed lines in Figure 6.44
denote the corresponding fits of the HN-equation (5.10) to the data.
Figure 6.45 shows the obtained relaxation rates in dependence on 1/T.
The relaxation rate of the β-process exhibits an Arrhenius-type temperature depen-
dence (Equation (4.8)). By means of equation (4.8) the activation energy EA,β is
calculated to 20.6 kJ mol−1. This value is higher than for Py4CEH and is probably due
to differences in the chemical structure. In the case of HAT6, the β-relaxation might
be assigned to local conformation transitions as known for Polyethylene.[33, 124]
The dielectric strength ∆ǫβ of the β-relaxation of HAT6 versus temperature is plotted
96
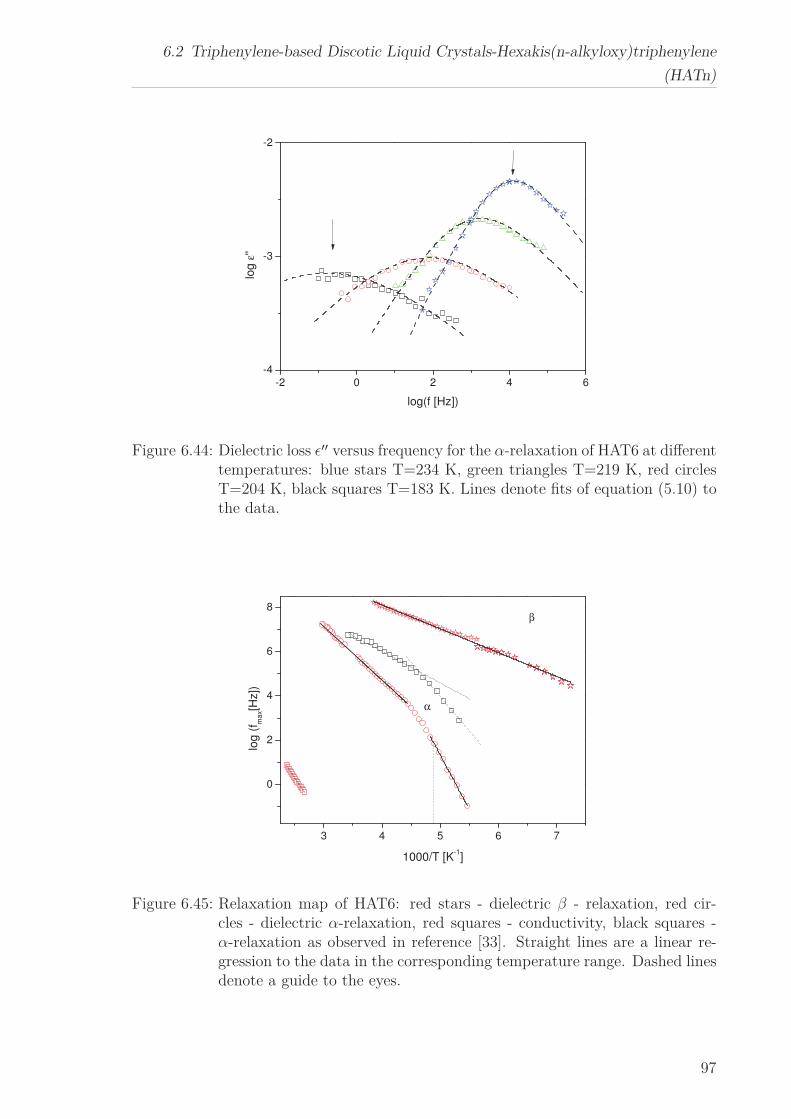
6.2 Triphenylene-based Discotic Liquid Crystals-Hexakis(n-alkyloxy)triphenylene
(HATn)
-2 0 2 4 6
-4
-3
-2
log ε
''
log(f [Hz])
Figure 6.44: Dielectric loss ǫ′′ versus frequency for the α-relaxation of HAT6 at differenttemperatures: blue stars T=234 K, green triangles T=219 K, red circlesT=204 K, black squares T=183 K. Lines denote fits of equation (5.10) tothe data.
3 4 5 6 7
0
2
4
6
8
log
(f m
ax[H
z])
1000/T [K-1]
β
α
Figure 6.45: Relaxation map of HAT6: red stars - dielectric β - relaxation, red cir-cles - dielectric α-relaxation, red squares - conductivity, black squares -α-relaxation as observed in reference [33]. Straight lines are a linear re-gression to the data in the corresponding temperature range. Dashed linesdenote a guide to the eyes.
97
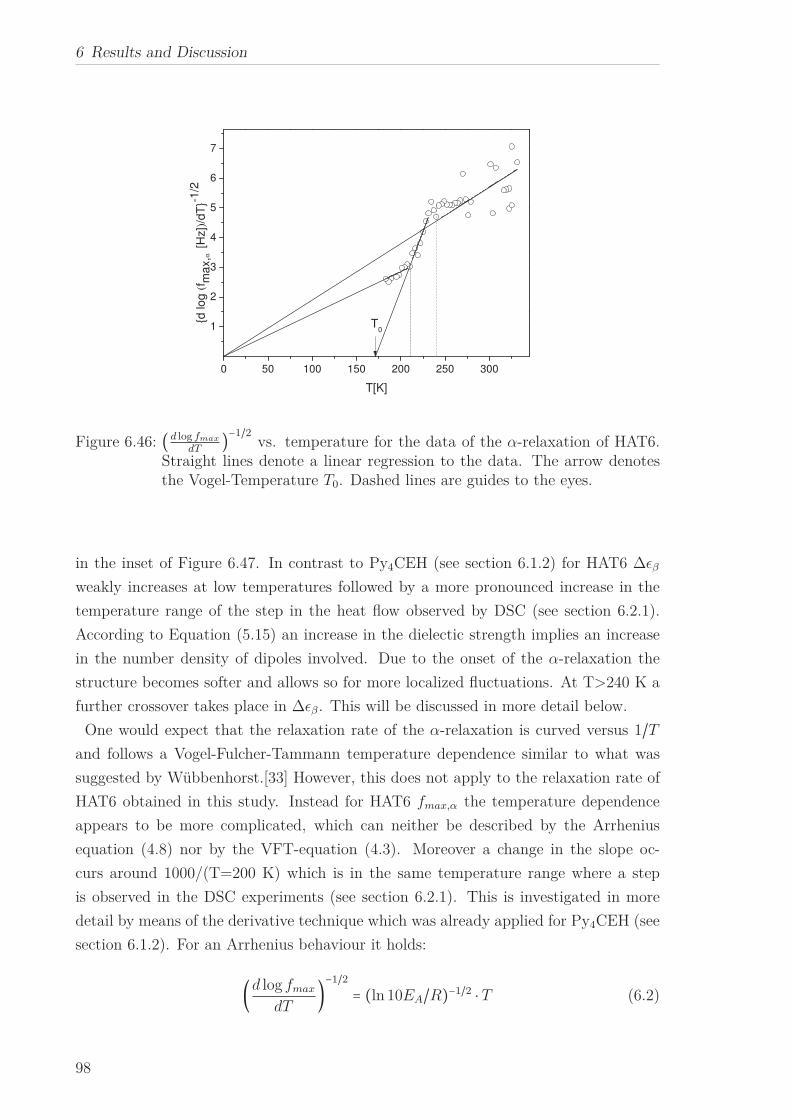
6 Results and Discussion
0 50 100 150 200 250 300
1
2
3
4
5
6
7
d lo
g (
f ma
x,α
[H
z])
/dT
-1/2
T[K]
T0
Figure 6.46: (d log fmax
dT)−1/2
vs. temperature for the data of the α-relaxation of HAT6.Straight lines denote a linear regression to the data. The arrow denotesthe Vogel-Temperature T0. Dashed lines are guides to the eyes.
in the inset of Figure 6.47. In contrast to Py4CEH (see section 6.1.2) for HAT6 ∆ǫβ
weakly increases at low temperatures followed by a more pronounced increase in the
temperature range of the step in the heat flow observed by DSC (see section 6.2.1).
According to Equation (5.15) an increase in the dielectic strength implies an increase
in the number density of dipoles involved. Due to the onset of the α-relaxation the
structure becomes softer and allows so for more localized fluctuations. At T>240 K a
further crossover takes place in ∆ǫβ. This will be discussed in more detail below.
One would expect that the relaxation rate of the α-relaxation is curved versus 1/Tand follows a Vogel-Fulcher-Tammann temperature dependence similar to what was
suggested by Wübbenhorst.[33] However, this does not apply to the relaxation rate of
HAT6 obtained in this study. Instead for HAT6 fmax,α the temperature dependence
appears to be more complicated, which can neither be described by the Arrhenius
equation (4.8) nor by the VFT-equation (4.3). Moreover a change in the slope oc-
curs around 1000/(T=200 K) which is in the same temperature range where a step
is observed in the DSC experiments (see section 6.2.1). This is investigated in more
detail by means of the derivative technique which was already applied for Py4CEH (see
section 6.1.2). For an Arrhenius behaviour it holds:
(d log fmax
dT)−1/2 = (ln 10EA/R)−1/2 ⋅ T (6.2)
98
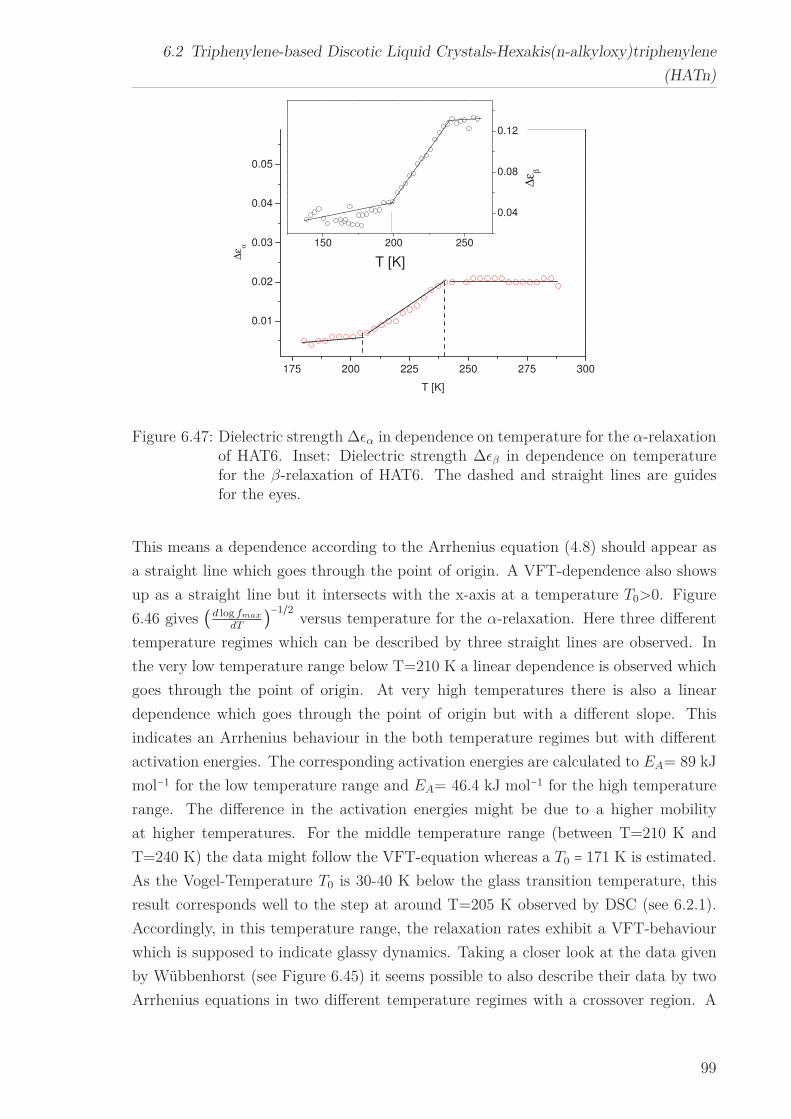
6.2 Triphenylene-based Discotic Liquid Crystals-Hexakis(n-alkyloxy)triphenylene
(HATn)
175 200 225 250 275 300
0.01
0.02
0.03
0.04
0.05
150 200 250
0.04
0.08
0.12
∆ε α
T [K]
∆ε β
T [K]
Figure 6.47: Dielectric strength ∆ǫα in dependence on temperature for the α-relaxationof HAT6. Inset: Dielectric strength ∆ǫβ in dependence on temperaturefor the β-relaxation of HAT6. The dashed and straight lines are guidesfor the eyes.
This means a dependence according to the Arrhenius equation (4.8) should appear as
a straight line which goes through the point of origin. A VFT-dependence also shows
up as a straight line but it intersects with the x-axis at a temperature T0>0. Figure
6.46 gives (d log fmax
dT)−1/2
versus temperature for the α-relaxation. Here three different
temperature regimes which can be described by three straight lines are observed. In
the very low temperature range below T=210 K a linear dependence is observed which
goes through the point of origin. At very high temperatures there is also a linear
dependence which goes through the point of origin but with a different slope. This
indicates an Arrhenius behaviour in the both temperature regimes but with different
activation energies. The corresponding activation energies are calculated to EA= 89 kJ
mol−1 for the low temperature range and EA= 46.4 kJ mol−1 for the high temperature
range. The difference in the activation energies might be due to a higher mobility
at higher temperatures. For the middle temperature range (between T=210 K and
T=240 K) the data might follow the VFT-equation whereas a T0 = 171 K is estimated.
As the Vogel-Temperature T0 is 30-40 K below the glass transition temperature, this
result corresponds well to the step at around T=205 K observed by DSC (see 6.2.1).
Accordingly, in this temperature range, the relaxation rates exhibit a VFT-behaviour
which is supposed to indicate glassy dynamics. Taking a closer look at the data given
by Wübbenhorst (see Figure 6.45) it seems possible to also describe their data by two
Arrhenius equations in two different temperature regimes with a crossover region. A
99
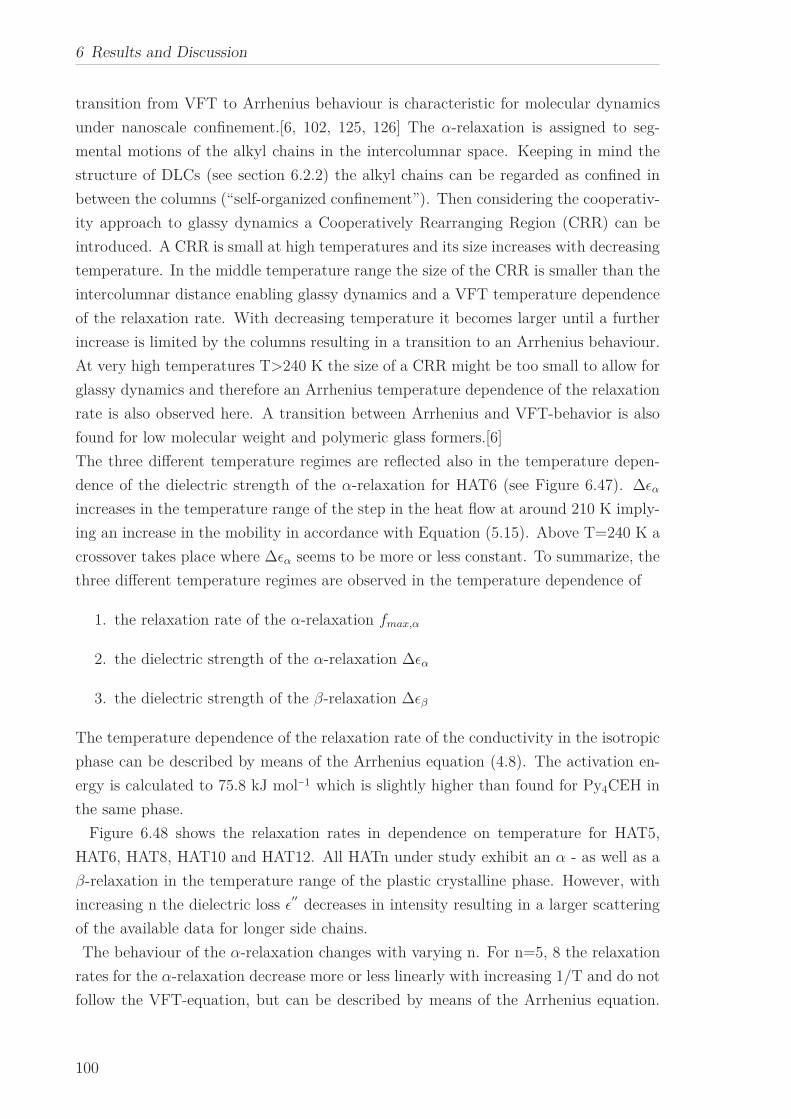
6 Results and Discussion
transition from VFT to Arrhenius behaviour is characteristic for molecular dynamics
under nanoscale confinement.[6, 102, 125, 126] The α-relaxation is assigned to seg-
mental motions of the alkyl chains in the intercolumnar space. Keeping in mind the
structure of DLCs (see section 6.2.2) the alkyl chains can be regarded as confined in
between the columns (“self-organized confinement”). Then considering the cooperativ-
ity approach to glassy dynamics a Cooperatively Rearranging Region (CRR) can be
introduced. A CRR is small at high temperatures and its size increases with decreasing
temperature. In the middle temperature range the size of the CRR is smaller than the
intercolumnar distance enabling glassy dynamics and a VFT temperature dependence
of the relaxation rate. With decreasing temperature it becomes larger until a further
increase is limited by the columns resulting in a transition to an Arrhenius behaviour.
At very high temperatures T>240 K the size of a CRR might be too small to allow for
glassy dynamics and therefore an Arrhenius temperature dependence of the relaxation
rate is also observed here. A transition between Arrhenius and VFT-behavior is also
found for low molecular weight and polymeric glass formers.[6]
The three different temperature regimes are reflected also in the temperature depen-
dence of the dielectric strength of the α-relaxation for HAT6 (see Figure 6.47). ∆ǫα
increases in the temperature range of the step in the heat flow at around 210 K imply-
ing an increase in the mobility in accordance with Equation (5.15). Above T=240 K a
crossover takes place where ∆ǫα seems to be more or less constant. To summarize, the
three different temperature regimes are observed in the temperature dependence of
1. the relaxation rate of the α-relaxation fmax,α
2. the dielectric strength of the α-relaxation ∆ǫα
3. the dielectric strength of the β-relaxation ∆ǫβ
The temperature dependence of the relaxation rate of the conductivity in the isotropic
phase can be described by means of the Arrhenius equation (4.8). The activation en-
ergy is calculated to 75.8 kJ mol−1 which is slightly higher than found for Py4CEH in
the same phase.
Figure 6.48 shows the relaxation rates in dependence on temperature for HAT5,
HAT6, HAT8, HAT10 and HAT12. All HATn under study exhibit an α - as well as a
β-relaxation in the temperature range of the plastic crystalline phase. However, with
increasing n the dielectric loss ǫ′′
decreases in intensity resulting in a larger scattering
of the available data for longer side chains.
The behaviour of the α-relaxation changes with varying n. For n=5, 8 the relaxation
rates for the α-relaxation decrease more or less linearly with increasing 1/T and do not
follow the VFT-equation, but can be described by means of the Arrhenius equation.
100
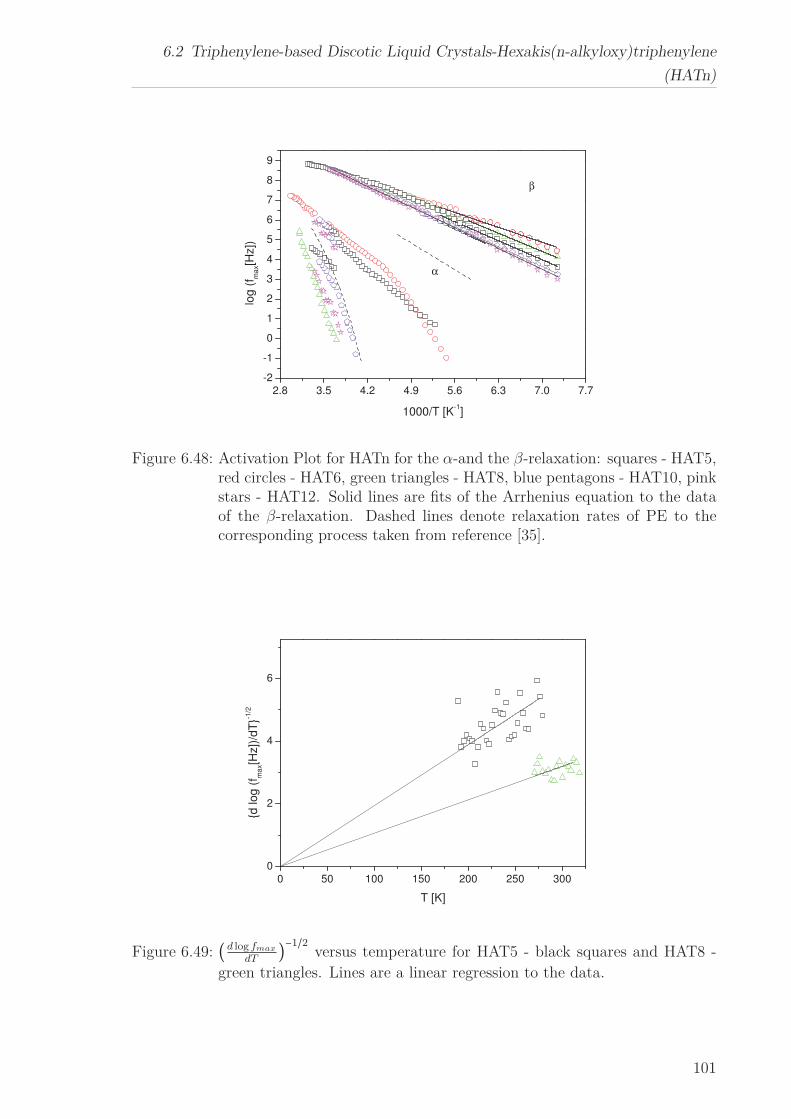
6.2 Triphenylene-based Discotic Liquid Crystals-Hexakis(n-alkyloxy)triphenylene
(HATn)
2.8 3.5 4.2 4.9 5.6 6.3 7.0 7.7
-2
-1
0
1
2
3
4
5
6
7
8
9
log
(f m
ax[H
z])
1000/T [K-1]
β
α
Figure 6.48: Activation Plot for HATn for the α-and the β-relaxation: squares - HAT5,red circles - HAT6, green triangles - HAT8, blue pentagons - HAT10, pinkstars - HAT12. Solid lines are fits of the Arrhenius equation to the dataof the β-relaxation. Dashed lines denote relaxation rates of PE to thecorresponding process taken from reference [35].
0 50 100 150 200 250 300
0
2
4
6
d lo
g (
f ma
x[H
z])
/dT
-1/2
T [K]
Figure 6.49: (d log fmax
dT)−1/2
versus temperature for HAT5 - black squares and HAT8 -
green triangles. Lines are a linear regression to the data.
101
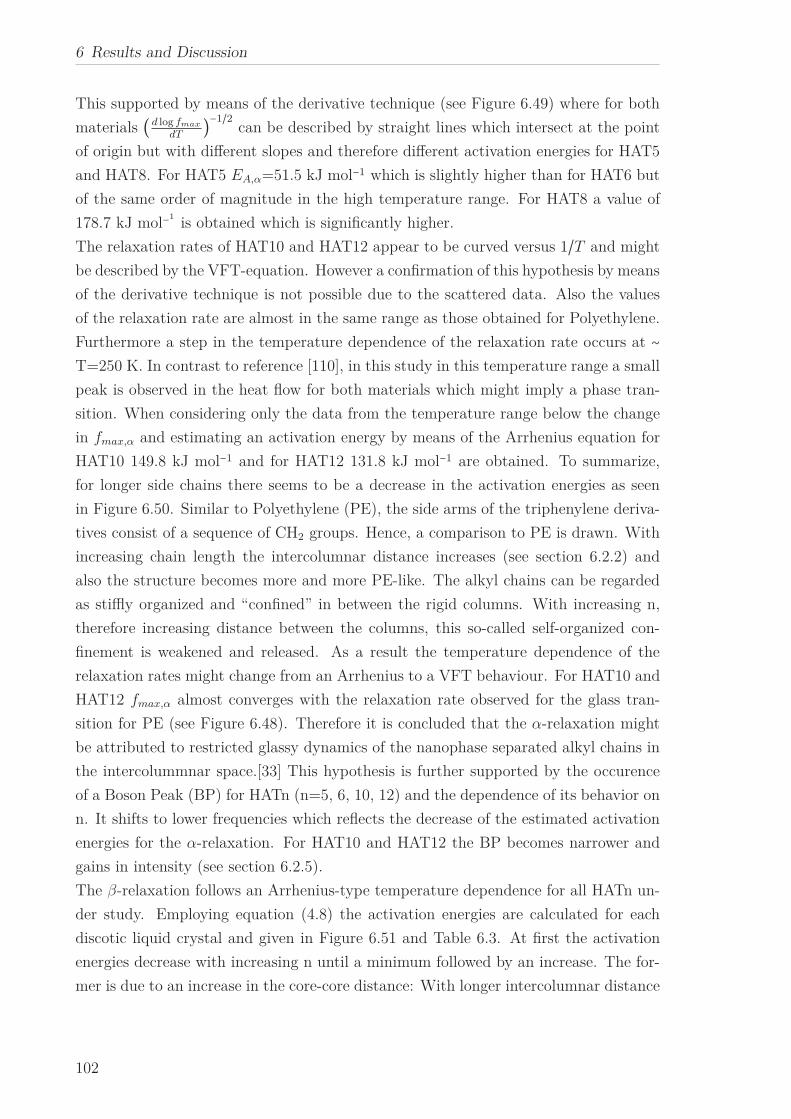
6 Results and Discussion
This supported by means of the derivative technique (see Figure 6.49) where for both
materials (d log fmax
dT)−1/2
can be described by straight lines which intersect at the point
of origin but with different slopes and therefore different activation energies for HAT5
and HAT8. For HAT5 EA,α=51.5 kJ mol−1 which is slightly higher than for HAT6 but
of the same order of magnitude in the high temperature range. For HAT8 a value of
178.7 kJ mol−1
is obtained which is significantly higher.
The relaxation rates of HAT10 and HAT12 appear to be curved versus 1/T and might
be described by the VFT-equation. However a confirmation of this hypothesis by means
of the derivative technique is not possible due to the scattered data. Also the values
of the relaxation rate are almost in the same range as those obtained for Polyethylene.
Furthermore a step in the temperature dependence of the relaxation rate occurs at ∼T=250 K. In contrast to reference [110], in this study in this temperature range a small
peak is observed in the heat flow for both materials which might imply a phase tran-
sition. When considering only the data from the temperature range below the change
in fmax,α and estimating an activation energy by means of the Arrhenius equation for
HAT10 149.8 kJ mol−1 and for HAT12 131.8 kJ mol−1 are obtained. To summarize,
for longer side chains there seems to be a decrease in the activation energies as seen
in Figure 6.50. Similar to Polyethylene (PE), the side arms of the triphenylene deriva-
tives consist of a sequence of CH2 groups. Hence, a comparison to PE is drawn. With
increasing chain length the intercolumnar distance increases (see section 6.2.2) and
also the structure becomes more and more PE-like. The alkyl chains can be regarded
as stiffly organized and “confined” in between the rigid columns. With increasing n,
therefore increasing distance between the columns, this so-called self-organized con-
finement is weakened and released. As a result the temperature dependence of the
relaxation rates might change from an Arrhenius to a VFT behaviour. For HAT10 and
HAT12 fmax,α almost converges with the relaxation rate observed for the glass tran-
sition for PE (see Figure 6.48). Therefore it is concluded that the α-relaxation might
be attributed to restricted glassy dynamics of the nanophase separated alkyl chains in
the intercolummnar space.[33] This hypothesis is further supported by the occurence
of a Boson Peak (BP) for HATn (n=5, 6, 10, 12) and the dependence of its behavior on
n. It shifts to lower frequencies which reflects the decrease of the estimated activation
energies for the α-relaxation. For HAT10 and HAT12 the BP becomes narrower and
gains in intensity (see section 6.2.5).
The β-relaxation follows an Arrhenius-type temperature dependence for all HATn un-
der study. Employing equation (4.8) the activation energies are calculated for each
discotic liquid crystal and given in Figure 6.51 and Table 6.3. At first the activation
energies decrease with increasing n until a minimum followed by an increase. The for-
mer is due to an increase in the core-core distance: With longer intercolumnar distance
102
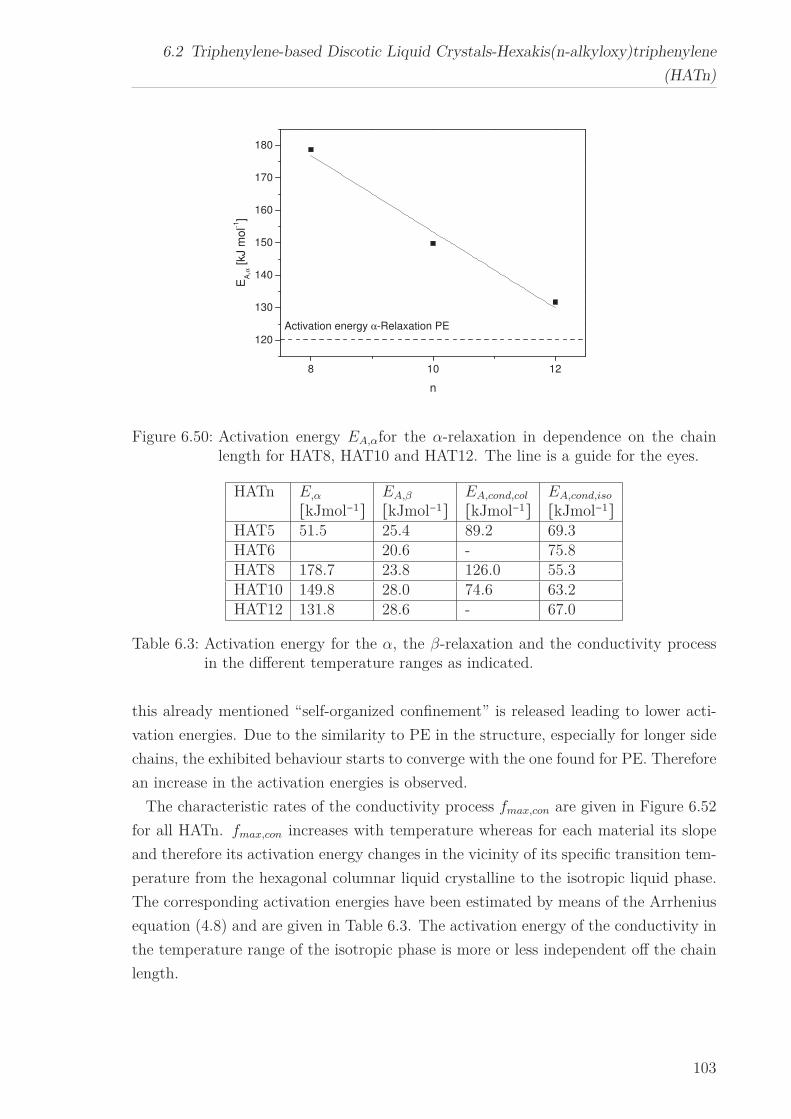
6.2 Triphenylene-based Discotic Liquid Crystals-Hexakis(n-alkyloxy)triphenylene
(HATn)
8 10 12
120
130
140
150
160
170
180
Activation energy α-Relaxation PE
EA
,α [kJ m
ol-1
]
n
Figure 6.50: Activation energy EA,αfor the α-relaxation in dependence on the chainlength for HAT8, HAT10 and HAT12. The line is a guide for the eyes.
HATn E,α EA,β EA,cond,col EA,cond,iso[kJmol−1] [kJmol−1] [kJmol−1] [kJmol−1]HAT5 51.5 25.4 89.2 69.3HAT6 20.6 - 75.8HAT8 178.7 23.8 126.0 55.3HAT10 149.8 28.0 74.6 63.2HAT12 131.8 28.6 - 67.0
Table 6.3: Activation energy for the α, the β-relaxation and the conductivity processin the different temperature ranges as indicated.
this already mentioned “self-organized confinement” is released leading to lower acti-
vation energies. Due to the similarity to PE in the structure, especially for longer side
chains, the exhibited behaviour starts to converge with the one found for PE. Therefore
an increase in the activation energies is observed.
The characteristic rates of the conductivity process fmax,con are given in Figure 6.52
for all HATn. fmax,con increases with temperature whereas for each material its slope
and therefore its activation energy changes in the vicinity of its specific transition tem-
perature from the hexagonal columnar liquid crystalline to the isotropic liquid phase.
The corresponding activation energies have been estimated by means of the Arrhenius
equation (4.8) and are given in Table 6.3. The activation energy of the conductivity in
the temperature range of the isotropic phase is more or less independent off the chain
length.
103
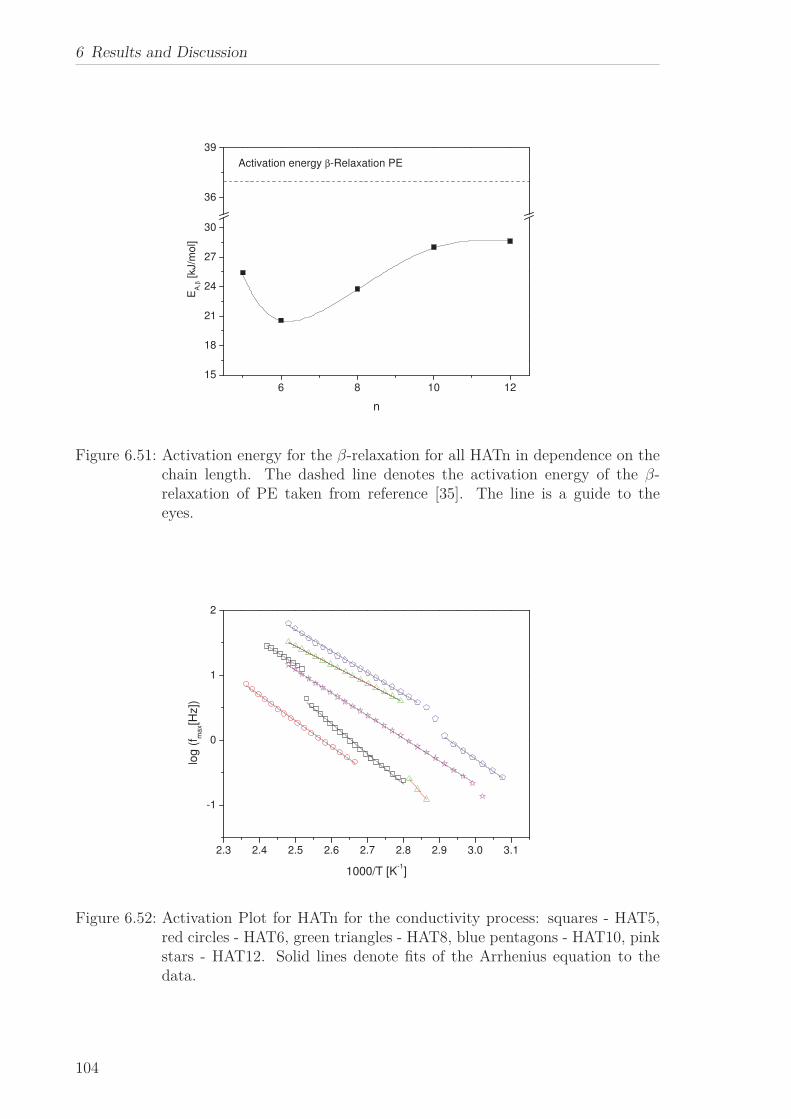
6 Results and Discussion
6 8 10 12
15
18
21
24
27
30
36
39
EA
,β [kJ/m
ol]
n
Activation energy β-Relaxation PE
Figure 6.51: Activation energy for the β-relaxation for all HATn in dependence on thechain length. The dashed line denotes the activation energy of the β-relaxation of PE taken from reference [35]. The line is a guide to theeyes.
2.3 2.4 2.5 2.6 2.7 2.8 2.9 3.0 3.1
-1
0
1
2
log
(f m
ax[H
z])
1000/T [K-1]
Figure 6.52: Activation Plot for HATn for the conductivity process: squares - HAT5,red circles - HAT6, green triangles - HAT8, blue pentagons - HAT10, pinkstars - HAT12. Solid lines denote fits of the Arrhenius equation to thedata.
104
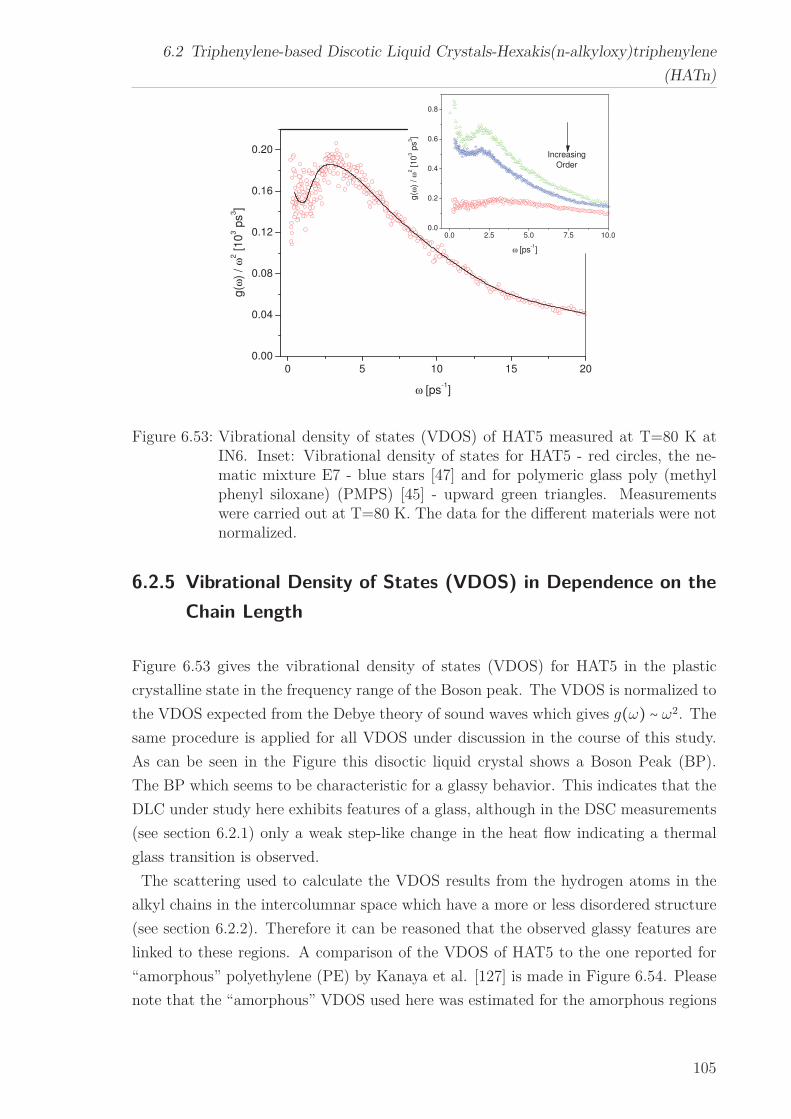
6.2 Triphenylene-based Discotic Liquid Crystals-Hexakis(n-alkyloxy)triphenylene
(HATn)
0 5 10 15 20
0.00
0.04
0.08
0.12
0.16
0.20
0.0 2.5 5.0 7.5 10.00.0
0.2
0.4
0.6
0.8
g(ω
) /
ω2 [10
3 p
s3]
ω [ps-1]
g(ω
) /
ω2 [10
3 p
s3]
ω [ps-1]
Increasing
Order
Figure 6.53: Vibrational density of states (VDOS) of HAT5 measured at T=80 K atIN6. Inset: Vibrational density of states for HAT5 - red circles, the ne-matic mixture E7 - blue stars [47] and for polymeric glass poly (methylphenyl siloxane) (PMPS) [45] - upward green triangles. Measurementswere carried out at T=80 K. The data for the different materials were notnormalized.
6.2.5 Vibrational Density of States (VDOS) in Dependence on the
Chain Length
Figure 6.53 gives the vibrational density of states (VDOS) for HAT5 in the plastic
crystalline state in the frequency range of the Boson peak. The VDOS is normalized to
the VDOS expected from the Debye theory of sound waves which gives g(ω) ∼ ω2. The
same procedure is applied for all VDOS under discussion in the course of this study.
As can be seen in the Figure this disoctic liquid crystal shows a Boson Peak (BP).
The BP which seems to be characteristic for a glassy behavior. This indicates that the
DLC under study here exhibits features of a glass, although in the DSC measurements
(see section 6.2.1) only a weak step-like change in the heat flow indicating a thermal
glass transition is observed.
The scattering used to calculate the VDOS results from the hydrogen atoms in the
alkyl chains in the intercolumnar space which have a more or less disordered structure
(see section 6.2.2). Therefore it can be reasoned that the observed glassy features are
linked to these regions. A comparison of the VDOS of HAT5 to the one reported for
“amorphous” polyethylene (PE) by Kanaya et al. [127] is made in Figure 6.54. Please
note that the “amorphous” VDOS used here was estimated for the amorphous regions
105
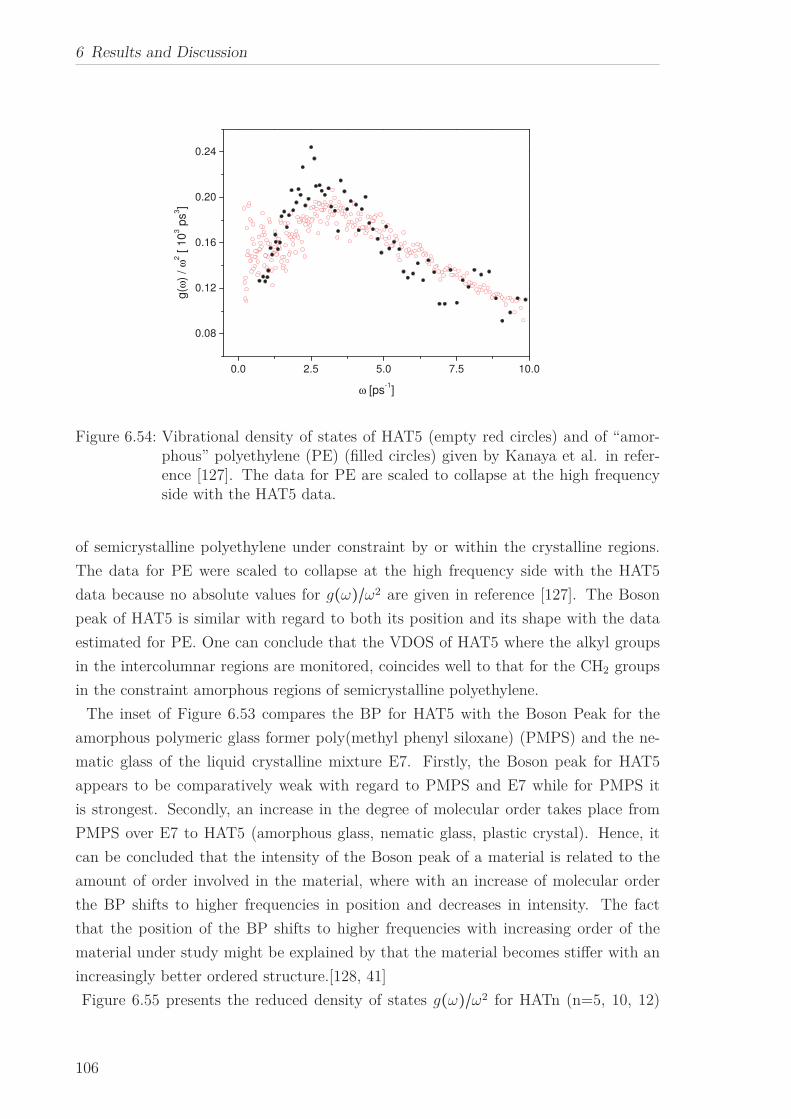
6 Results and Discussion
0.0 2.5 5.0 7.5 10.0
0.08
0.12
0.16
0.20
0.24
g(ω
) /
ω2 [ 1
03 p
s3]
ω [ps-1]
Figure 6.54: Vibrational density of states of HAT5 (empty red circles) and of “amor-phous” polyethylene (PE) (filled circles) given by Kanaya et al. in refer-ence [127]. The data for PE are scaled to collapse at the high frequencyside with the HAT5 data.
of semicrystalline polyethylene under constraint by or within the crystalline regions.
The data for PE were scaled to collapse at the high frequency side with the HAT5
data because no absolute values for g(ω)/ω2 are given in reference [127]. The Boson
peak of HAT5 is similar with regard to both its position and its shape with the data
estimated for PE. One can conclude that the VDOS of HAT5 where the alkyl groups
in the intercolumnar regions are monitored, coincides well to that for the CH2 groups
in the constraint amorphous regions of semicrystalline polyethylene.
The inset of Figure 6.53 compares the BP for HAT5 with the Boson Peak for the
amorphous polymeric glass former poly(methyl phenyl siloxane) (PMPS) and the ne-
matic glass of the liquid crystalline mixture E7. Firstly, the Boson peak for HAT5
appears to be comparatively weak with regard to PMPS and E7 while for PMPS it
is strongest. Secondly, an increase in the degree of molecular order takes place from
PMPS over E7 to HAT5 (amorphous glass, nematic glass, plastic crystal). Hence, it
can be concluded that the intensity of the Boson peak of a material is related to the
amount of order involved in the material, where with an increase of molecular order
the BP shifts to higher frequencies in position and decreases in intensity. The fact
that the position of the BP shifts to higher frequencies with increasing order of the
material under study might be explained by that the material becomes stiffer with an
increasingly better ordered structure.[128, 41]
Figure 6.55 presents the reduced density of states g(ω)/ω2 for HATn (n=5, 10, 12)
106
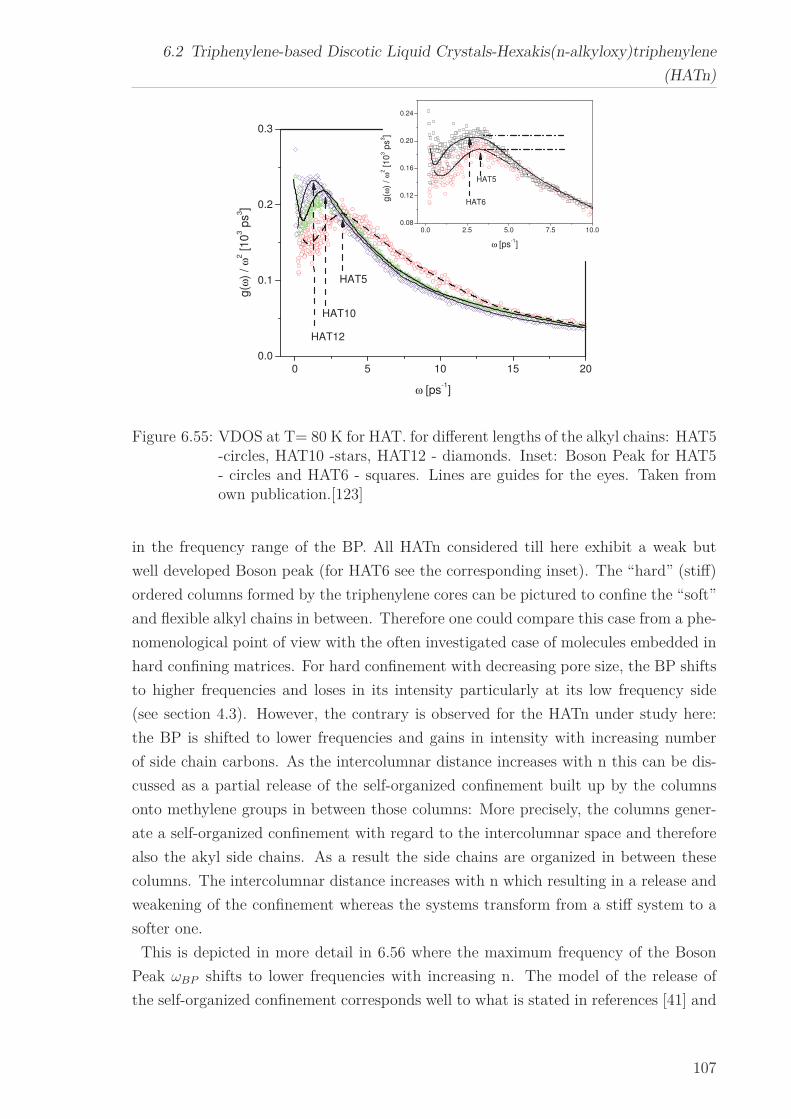
6.2 Triphenylene-based Discotic Liquid Crystals-Hexakis(n-alkyloxy)triphenylene
(HATn)
0.0 2.5 5.0 7.5 10.00.08
0.12
0.16
0.20
0.24
0 5 10 15 20
0.0
0.1
0.2
0.3
HAT6
g(ω
) /
ω2 [10
3 p
s3]
ω [ps-1]
HAT5
HAT12
HAT10
g(ω
) /
ω2 [10
3 p
s3]
ω [ps-1]
HAT5
Figure 6.55: VDOS at T= 80 K for HAT. for different lengths of the alkyl chains: HAT5-circles, HAT10 -stars, HAT12 - diamonds. Inset: Boson Peak for HAT5- circles and HAT6 - squares. Lines are guides for the eyes. Taken fromown publication.[123]
in the frequency range of the BP. All HATn considered till here exhibit a weak but
well developed Boson peak (for HAT6 see the corresponding inset). The “hard” (stiff)
ordered columns formed by the triphenylene cores can be pictured to confine the “soft”
and flexible alkyl chains in between. Therefore one could compare this case from a phe-
nomenological point of view with the often investigated case of molecules embedded in
hard confining matrices. For hard confinement with decreasing pore size, the BP shifts
to higher frequencies and loses in its intensity particularly at its low frequency side
(see section 4.3). However, the contrary is observed for the HATn under study here:
the BP is shifted to lower frequencies and gains in intensity with increasing number
of side chain carbons. As the intercolumnar distance increases with n this can be dis-
cussed as a partial release of the self-organized confinement built up by the columns
onto methylene groups in between those columns: More precisely, the columns gener-
ate a self-organized confinement with regard to the intercolumnar space and therefore
also the akyl side chains. As a result the side chains are organized in between these
columns. The intercolumnar distance increases with n which resulting in a release and
weakening of the confinement whereas the systems transform from a stiff system to a
softer one.
This is depicted in more detail in 6.56 where the maximum frequency of the Boson
Peak ωBP shifts to lower frequencies with increasing n. The model of the release of
the self-organized confinement corresponds well to what is stated in references [41] and
107
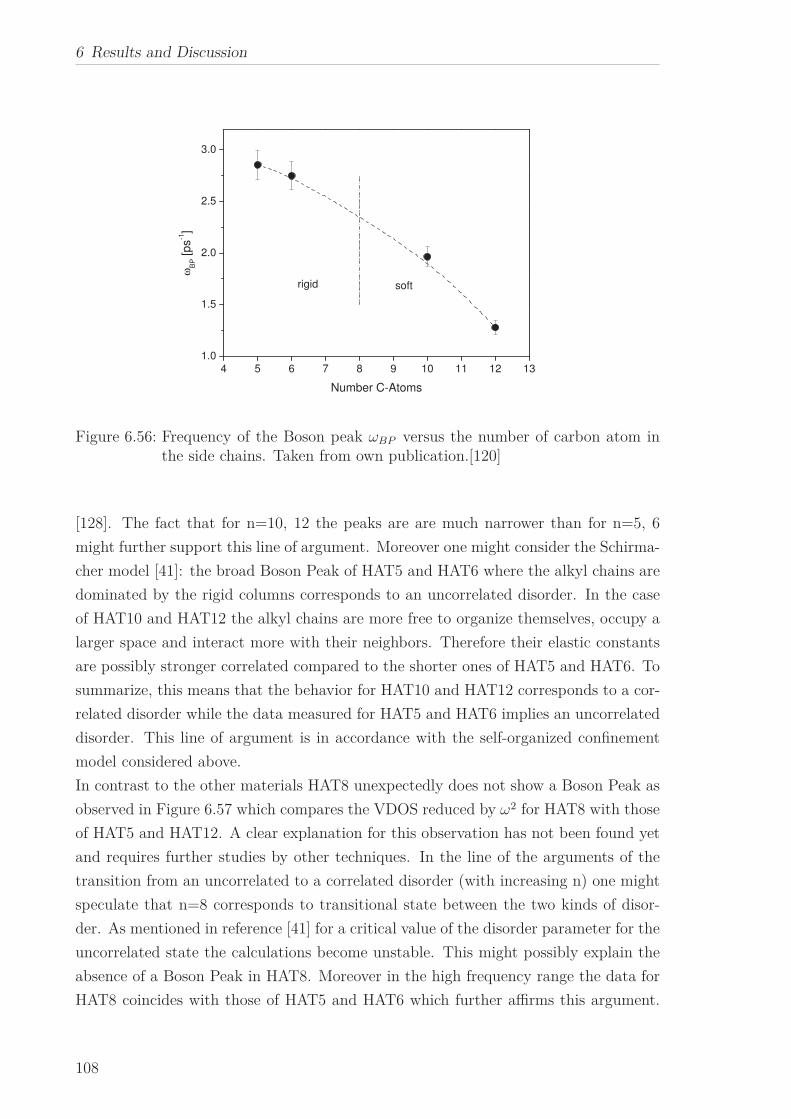
6 Results and Discussion
4 5 6 7 8 9 10 11 12 13
1.0
1.5
2.0
2.5
3.0
ωB
P [ps
-1]
Number C-Atoms
rigid soft
Figure 6.56: Frequency of the Boson peak ωBP versus the number of carbon atom inthe side chains. Taken from own publication.[120]
[128]. The fact that for n=10, 12 the peaks are are much narrower than for n=5, 6
might further support this line of argument. Moreover one might consider the Schirma-
cher model [41]: the broad Boson Peak of HAT5 and HAT6 where the alkyl chains are
dominated by the rigid columns corresponds to an uncorrelated disorder. In the case
of HAT10 and HAT12 the alkyl chains are more free to organize themselves, occupy a
larger space and interact more with their neighbors. Therefore their elastic constants
are possibly stronger correlated compared to the shorter ones of HAT5 and HAT6. To
summarize, this means that the behavior for HAT10 and HAT12 corresponds to a cor-
related disorder while the data measured for HAT5 and HAT6 implies an uncorrelated
disorder. This line of argument is in accordance with the self-organized confinement
model considered above.
In contrast to the other materials HAT8 unexpectedly does not show a Boson Peak as
observed in Figure 6.57 which compares the VDOS reduced by ω2 for HAT8 with those
of HAT5 and HAT12. A clear explanation for this observation has not been found yet
and requires further studies by other techniques. In the line of the arguments of the
transition from an uncorrelated to a correlated disorder (with increasing n) one might
speculate that n=8 corresponds to transitional state between the two kinds of disor-
der. As mentioned in reference [41] for a critical value of the disorder parameter for the
uncorrelated state the calculations become unstable. This might possibly explain the
absence of a Boson Peak in HAT8. Moreover in the high frequency range the data for
HAT8 coincides with those of HAT5 and HAT6 which further affirms this argument.
108
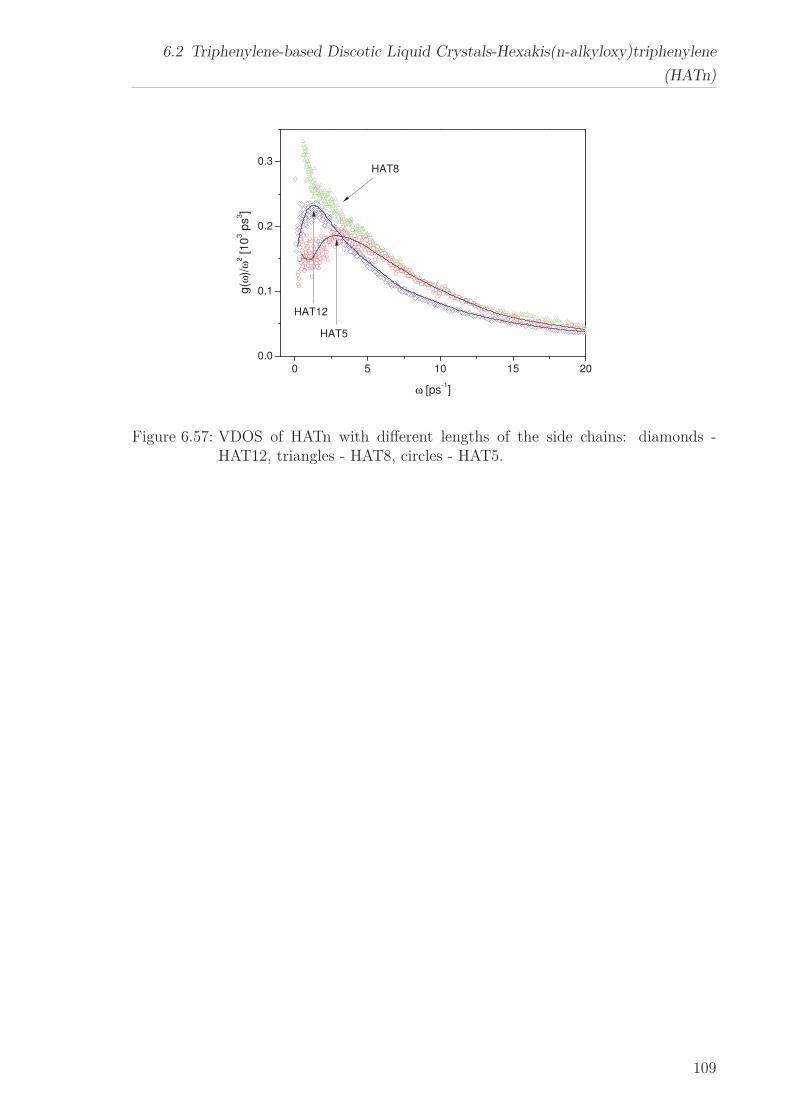
6.2 Triphenylene-based Discotic Liquid Crystals-Hexakis(n-alkyloxy)triphenylene
(HATn)
0 5 10 15 20
0.0
0.1
0.2
0.3HAT8
HAT5
g(ω
)/ω
2 [10
3 p
s3]
ω [ps-1]
HAT12
Figure 6.57: VDOS of HATn with different lengths of the side chains: diamonds -HAT12, triangles - HAT8, circles - HAT5.
109
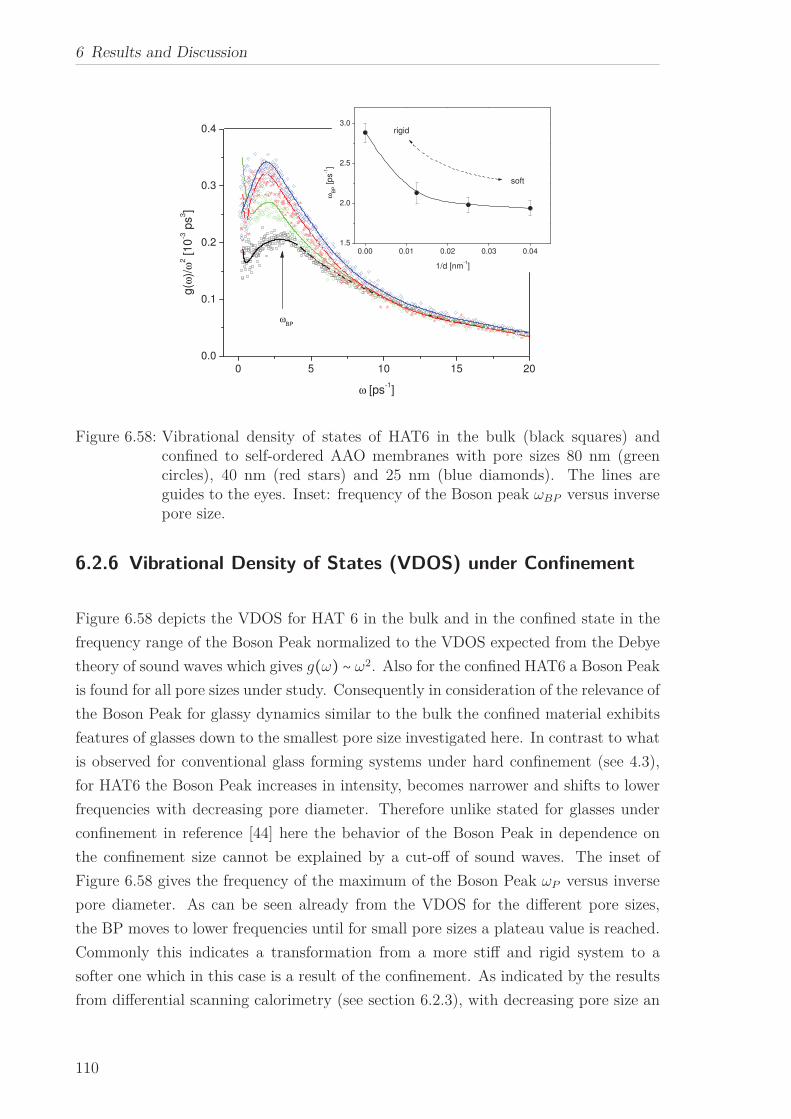
6 Results and Discussion
0.00 0.01 0.02 0.03 0.041.5
2.0
2.5
3.0
0 5 10 15 20
0.0
0.1
0.2
0.3
0.4
soft
ωB
P [
ps
-1]
1/d [nm-1]
rigid
g(ω
)/ω
2 [10
-3 p
s3]
ω [ps-1]
ωBP
Figure 6.58: Vibrational density of states of HAT6 in the bulk (black squares) andconfined to self-ordered AAO membranes with pore sizes 80 nm (greencircles), 40 nm (red stars) and 25 nm (blue diamonds). The lines areguides to the eyes. Inset: frequency of the Boson peak ωBP versus inversepore size.
6.2.6 Vibrational Density of States (VDOS) under Confinement
Figure 6.58 depicts the VDOS for HAT 6 in the bulk and in the confined state in the
frequency range of the Boson Peak normalized to the VDOS expected from the Debye
theory of sound waves which gives g(ω) ∼ ω2. Also for the confined HAT6 a Boson Peak
is found for all pore sizes under study. Consequently in consideration of the relevance of
the Boson Peak for glassy dynamics similar to the bulk the confined material exhibits
features of glasses down to the smallest pore size investigated here. In contrast to what
is observed for conventional glass forming systems under hard confinement (see 4.3),
for HAT6 the Boson Peak increases in intensity, becomes narrower and shifts to lower
frequencies with decreasing pore diameter. Therefore unlike stated for glasses under
confinement in reference [44] here the behavior of the Boson Peak in dependence on
the confinement size cannot be explained by a cut-off of sound waves. The inset of
Figure 6.58 gives the frequency of the maximum of the Boson Peak ωP versus inverse
pore diameter. As can be seen already from the VDOS for the different pore sizes,
the BP moves to lower frequencies until for small pore sizes a plateau value is reached.
Commonly this indicates a transformation from a more stiff and rigid system to a
softer one which in this case is a result of the confinement. As indicated by the results
from differential scanning calorimetry (see section 6.2.3), with decreasing pore size an
110
6.2 Triphenylene-based Discotic Liquid Crystals-Hexakis(n-alkyloxy)triphenylene
(HATn)
increasing amount of material has to be regarded as more or less disordered as indicated
by the pore size dependence of the phase transition enthalpies in the DSC experiments.
This means that for the confined material the elastic properties should be softer than
for the plastic crystalline state of the bulk material. Accordingly the modification of
the Boson Peak can be a result of a modification in the degree of order. The plateau
value found for pore sizes 40 nm and 25 nm implies that the elastic properties as well as
the degree of order of the confined systems are comparable at a lower pore size. A more
detailed analysis of the data requires the sound velocity for plastic crystalline HAT6
which unfortunately seems not to be available in the literature. As concluded from
the thermal data there is a liquid crystalline surface layer where the (homeotropic)
orientation of the molecules is different from the bulk-like planarly arranged molecules
in the pore center. Therefore one might regard the VDOS under the consideration of a
two phase model. According to reference [44] the VDOS gd(ω) observed for cylindrical
pores of a diameter d should be an average of the bulk VDOS gbulk and that of the
surface gsurf
gD(ω) = Vsurf
Vpore
gsurf(ω) + (1 − Vsurf
Vpore
) gbulk(ω) (6.3)
weighed by the respective volume fractions. In this case the ratio
gbulk(ω) − gd(ω)gbulk(ω) − g25nm(ω) ∼ Vsurf
Vpore
= dr2S(d/2)2
(6.4)
is expected to be independent of ω and proportional to the surface fraction Vsurf/Vpore
where rS is the thickness of the surface layer. The following procedure was carried out
to calculate the ratio: In order to obtain equidistant points and to slightly average the
experimental data, the points in the frequency range from 0.8 ps−1 to 1.8 ps−1 were
interpolated. Then the ratio defined by Equation (6.4) was calculated point by point
(inset Figure 6.59). In spite of the considerable scattering of the data it is obvious that
in the frequency range examined here the ratio predominantly does not depend on the
frequency.
Figure 6.59 plots the average ratio (arithmetic average using all points) versus inverse
pore diameter. At first glance the two phase model seems appropriate to describe the
data. However, a fit to these results delivers a value of 12.5 nm for the thickness of the
surface layer which corresponds to the pore radius of the smallest pore size. Firstly,
this value is much larger than that obtained from the analysis of the DSC data (see
section (6.2.3)). Secondly, the DSC data also demonstrate that a bulk-like phase which
is not part of an ordered surface layer remains down to a pore size of 25 nm. As a
result the simple two layer model is not in agreement with the results obtained by DSC
and cannot be applied to characterize the effect of hard confinement on HAT6.
111
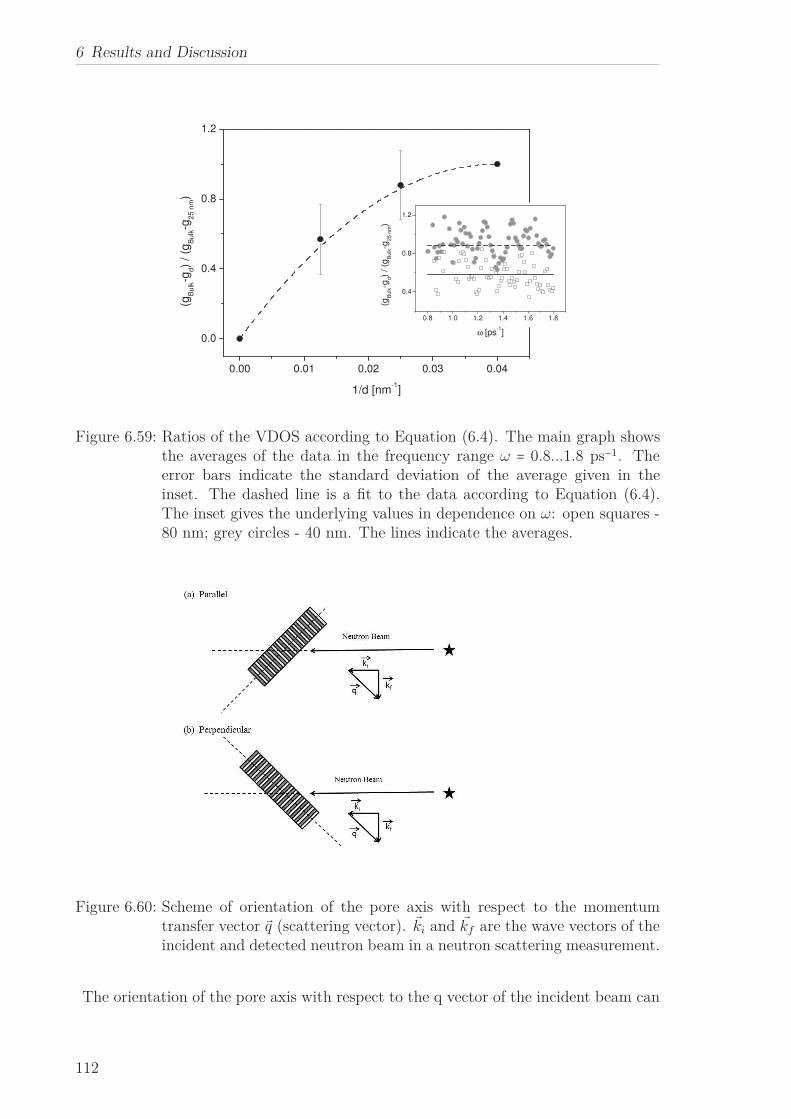
6 Results and Discussion
0.8 1.0 1.2 1.4 1.6 1.8
0.4
0.8
1.2
0.00 0.01 0.02 0.03 0.04
0.0
0.4
0.8
1.2
(gB
ulk-g
d)
/ (g
Bulk-g
25
nm)
ω [ps-1]
(gB
ulk-g
d)
/ (g
Bu
lk-g
25
nm)
1/d [nm-1]
Figure 6.59: Ratios of the VDOS according to Equation (6.4). The main graph showsthe averages of the data in the frequency range ω = 0.8...1.8 ps−1. Theerror bars indicate the standard deviation of the average given in theinset. The dashed line is a fit to the data according to Equation (6.4).The inset gives the underlying values in dependence on ω: open squares -80 nm; grey circles - 40 nm. The lines indicate the averages.
Figure 6.60: Scheme of orientation of the pore axis with respect to the momentumtransfer vector q (scattering vector). ki and kf are the wave vectors of theincident and detected neutron beam in a neutron scattering measurement.
The orientation of the pore axis with respect to the q vector of the incident beam can
112
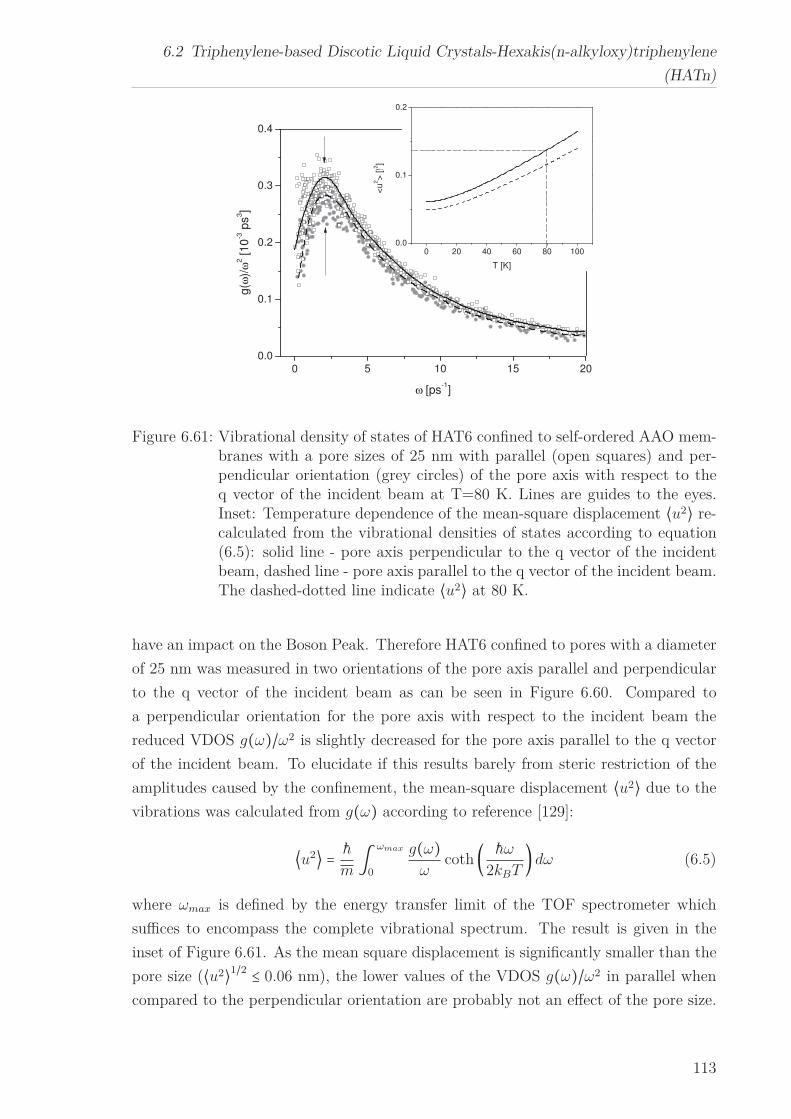
6.2 Triphenylene-based Discotic Liquid Crystals-Hexakis(n-alkyloxy)triphenylene
(HATn)
0 20 40 60 80 1000.0
0.1
0.2
0 5 10 15 20
0.0
0.1
0.2
0.3
0.4
<u
2>
[2]
T [K]
g(ω
)/ω
2 [10
-3 p
s3]
ω [ps-1]
Figure 6.61: Vibrational density of states of HAT6 confined to self-ordered AAO mem-branes with a pore sizes of 25 nm with parallel (open squares) and per-pendicular orientation (grey circles) of the pore axis with respect to theq vector of the incident beam at T=80 K. Lines are guides to the eyes.Inset: Temperature dependence of the mean-square displacement ⟨u2⟩ re-calculated from the vibrational densities of states according to equation(6.5): solid line - pore axis perpendicular to the q vector of the incidentbeam, dashed line - pore axis parallel to the q vector of the incident beam.The dashed-dotted line indicate ⟨u2⟩ at 80 K.
have an impact on the Boson Peak. Therefore HAT6 confined to pores with a diameter
of 25 nm was measured in two orientations of the pore axis parallel and perpendicular
to the q vector of the incident beam as can be seen in Figure 6.60. Compared to
a perpendicular orientation for the pore axis with respect to the incident beam the
reduced VDOS g(ω)/ω2 is slightly decreased for the pore axis parallel to the q vector
of the incident beam. To elucidate if this results barely from steric restriction of the
amplitudes caused by the confinement, the mean-square displacement ⟨u2⟩ due to the
vibrations was calculated from g(ω) according to reference [129]:
⟨u2⟩ = h
m∫ ωmax
0
g(ω)ω
coth( hω
2kBT)dω (6.5)
where ωmax is defined by the energy transfer limit of the TOF spectrometer which
suffices to encompass the complete vibrational spectrum. The result is given in the
inset of Figure 6.61. As the mean square displacement is significantly smaller than the
pore size (⟨u2⟩1/2 ≤ 0.06 nm), the lower values of the VDOS g(ω)/ω2 in parallel when
compared to the perpendicular orientation are probably not an effect of the pore size.
113
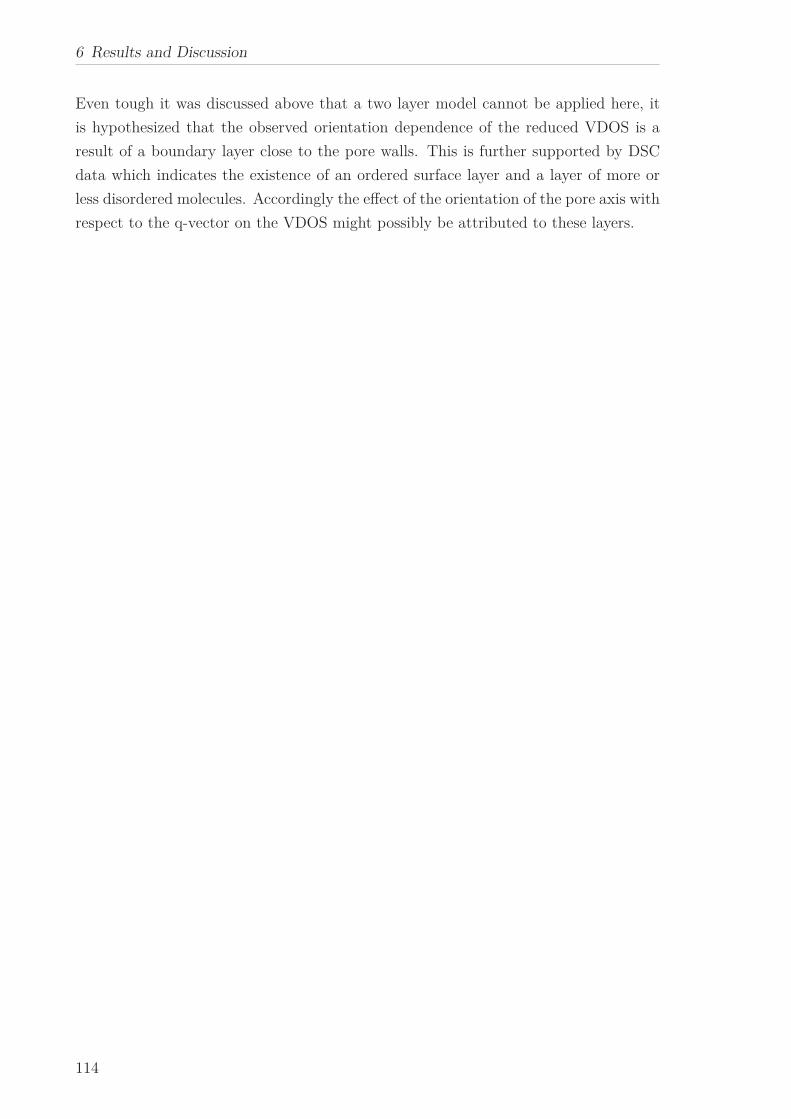
6 Results and Discussion
Even tough it was discussed above that a two layer model cannot be applied here, it
is hypothesized that the observed orientation dependence of the reduced VDOS is a
result of a boundary layer close to the pore walls. This is further supported by DSC
data which indicates the existence of an ordered surface layer and a layer of more or
less disordered molecules. Accordingly the effect of the orientation of the pore axis with
respect to the q-vector on the VDOS might possibly be attributed to these layers.
114
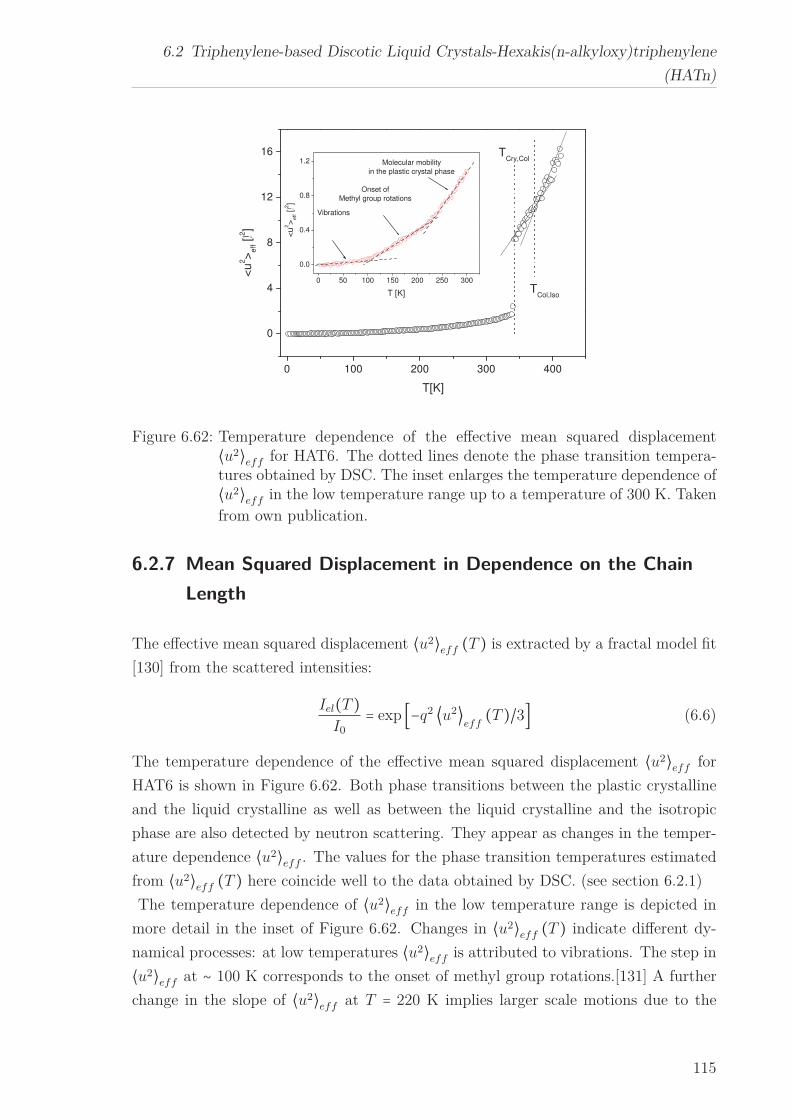
6.2 Triphenylene-based Discotic Liquid Crystals-Hexakis(n-alkyloxy)triphenylene
(HATn)
0 50 100 150 200 250 300
0.0
0.4
0.8
1.2
0 100 200 300 400
0
4
8
12
16Molecular mobility
in the plastic crystal phase
Onset of
Methyl group rotations
Vibrations
<u
2>
eff [
2]
T [K]
TCol,Iso
TCry,Col
<u
2>
eff [
2]
T[K]
Figure 6.62: Temperature dependence of the effective mean squared displacement⟨u2⟩eff for HAT6. The dotted lines denote the phase transition tempera-tures obtained by DSC. The inset enlarges the temperature dependence of⟨u2⟩eff in the low temperature range up to a temperature of 300 K. Taken
from own publication.
6.2.7 Mean Squared Displacement in Dependence on the Chain
Length
The effective mean squared displacement ⟨u2⟩eff (T ) is extracted by a fractal model fit
[130] from the scattered intensities:
Iel(T )I0
= exp [−q2 ⟨u2⟩eff
(T )/3] (6.6)
The temperature dependence of the effective mean squared displacement ⟨u2⟩eff for
HAT6 is shown in Figure 6.62. Both phase transitions between the plastic crystalline
and the liquid crystalline as well as between the liquid crystalline and the isotropic
phase are also detected by neutron scattering. They appear as changes in the temper-
ature dependence ⟨u2⟩eff . The values for the phase transition temperatures estimated
from ⟨u2⟩eff (T ) here coincide well to the data obtained by DSC. (see section 6.2.1)
The temperature dependence of ⟨u2⟩eff in the low temperature range is depicted in
more detail in the inset of Figure 6.62. Changes in ⟨u2⟩eff (T ) indicate different dy-
namical processes: at low temperatures ⟨u2⟩eff is attributed to vibrations. The step in
⟨u2⟩eff at ∼ 100 K corresponds to the onset of methyl group rotations.[131] A further
change in the slope of ⟨u2⟩eff at T = 220 K implies larger scale motions due to the
115
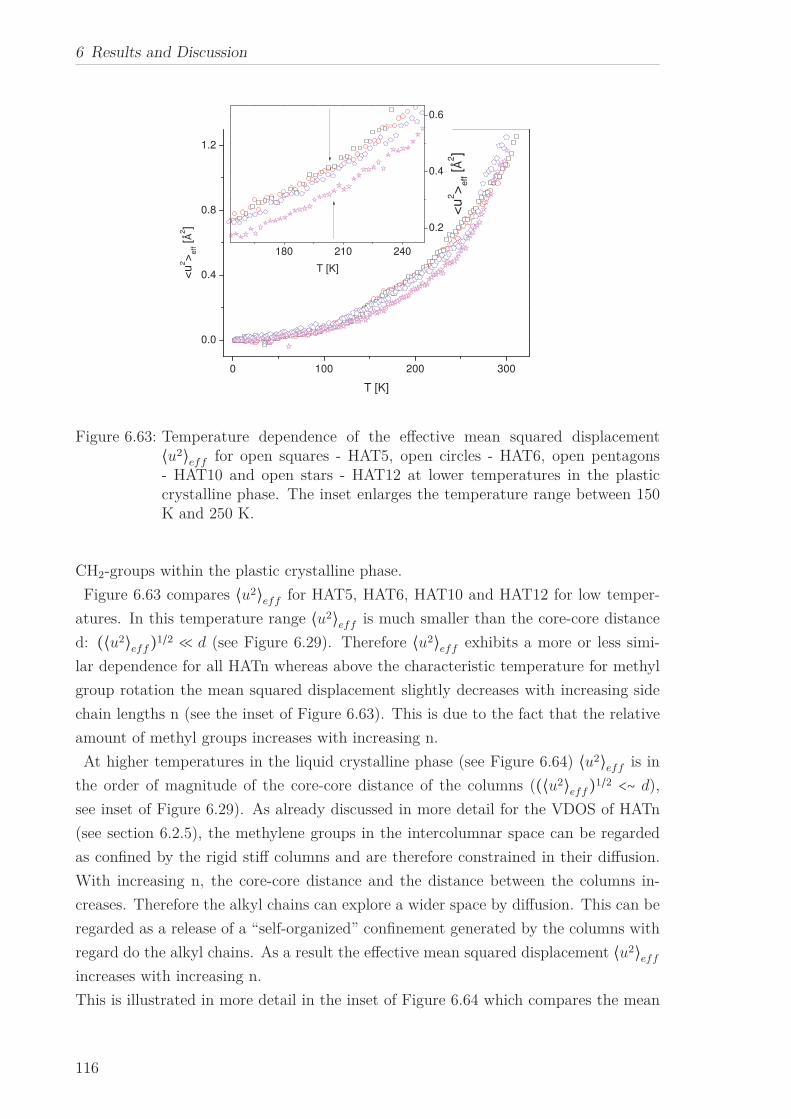
6 Results and Discussion
0 100 200 300
0.0
0.4
0.8
1.2
180 210 240
0.2
0.4
0.6
<u
2>
eff [
2]
T [K]
<u
2>
eff [
2]
T [K]
Figure 6.63: Temperature dependence of the effective mean squared displacement⟨u2⟩eff for open squares - HAT5, open circles - HAT6, open pentagons- HAT10 and open stars - HAT12 at lower temperatures in the plasticcrystalline phase. The inset enlarges the temperature range between 150K and 250 K.
CH2-groups within the plastic crystalline phase.
Figure 6.63 compares ⟨u2⟩eff for HAT5, HAT6, HAT10 and HAT12 for low temper-
atures. In this temperature range ⟨u2⟩eff is much smaller than the core-core distance
d: (⟨u2⟩eff)1/2 ≪ d (see Figure 6.29). Therefore ⟨u2⟩eff exhibits a more or less simi-
lar dependence for all HATn whereas above the characteristic temperature for methyl
group rotation the mean squared displacement slightly decreases with increasing side
chain lengths n (see the inset of Figure 6.63). This is due to the fact that the relative
amount of methyl groups increases with increasing n.
At higher temperatures in the liquid crystalline phase (see Figure 6.64) ⟨u2⟩eff is in
the order of magnitude of the core-core distance of the columns ((⟨u2⟩eff)1/2 <∼ d),
see inset of Figure 6.29). As already discussed in more detail for the VDOS of HATn
(see section 6.2.5), the methylene groups in the intercolumnar space can be regarded
as confined by the rigid stiff columns and are therefore constrained in their diffusion.
With increasing n, the core-core distance and the distance between the columns in-
creases. Therefore the alkyl chains can explore a wider space by diffusion. This can be
regarded as a release of a “self-organized” confinement generated by the columns with
regard do the alkyl chains. As a result the effective mean squared displacement ⟨u2⟩eff
increases with increasing n.
This is illustrated in more detail in the inset of Figure 6.64 which compares the mean
116
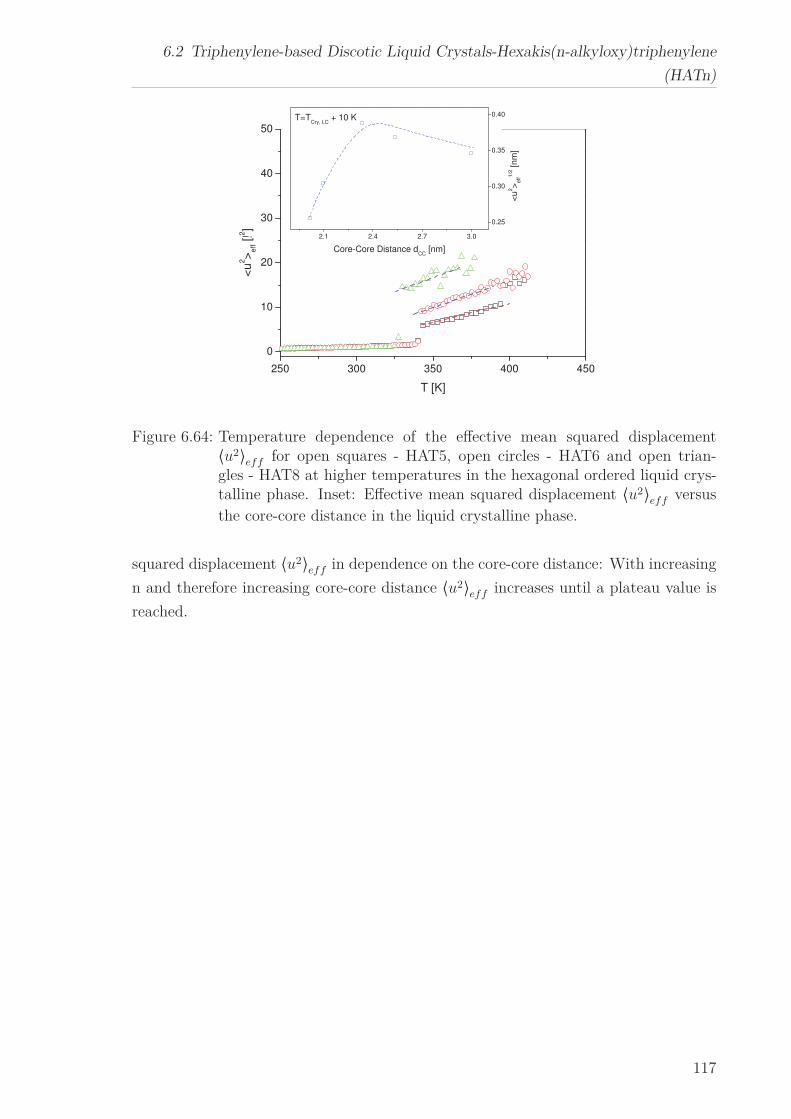
6.2 Triphenylene-based Discotic Liquid Crystals-Hexakis(n-alkyloxy)triphenylene
(HATn)
250 300 350 400 450
0
10
20
30
40
50
2.1 2.4 2.7 3.0
0.25
0.30
0.35
0.40
<u
2>
eff [
2]
T [K]
<u
2>
eff
1/2 [nm
]
Core-Core Distance dCC
[nm]
T=TCry, LC
+ 10 K
Figure 6.64: Temperature dependence of the effective mean squared displacement⟨u2⟩eff for open squares - HAT5, open circles - HAT6 and open trian-gles - HAT8 at higher temperatures in the hexagonal ordered liquid crys-talline phase. Inset: Effective mean squared displacement ⟨u2⟩eff versus
the core-core distance in the liquid crystalline phase.
squared displacement ⟨u2⟩eff in dependence on the core-core distance: With increasing
n and therefore increasing core-core distance ⟨u2⟩eff increases until a plateau value is
reached.
117
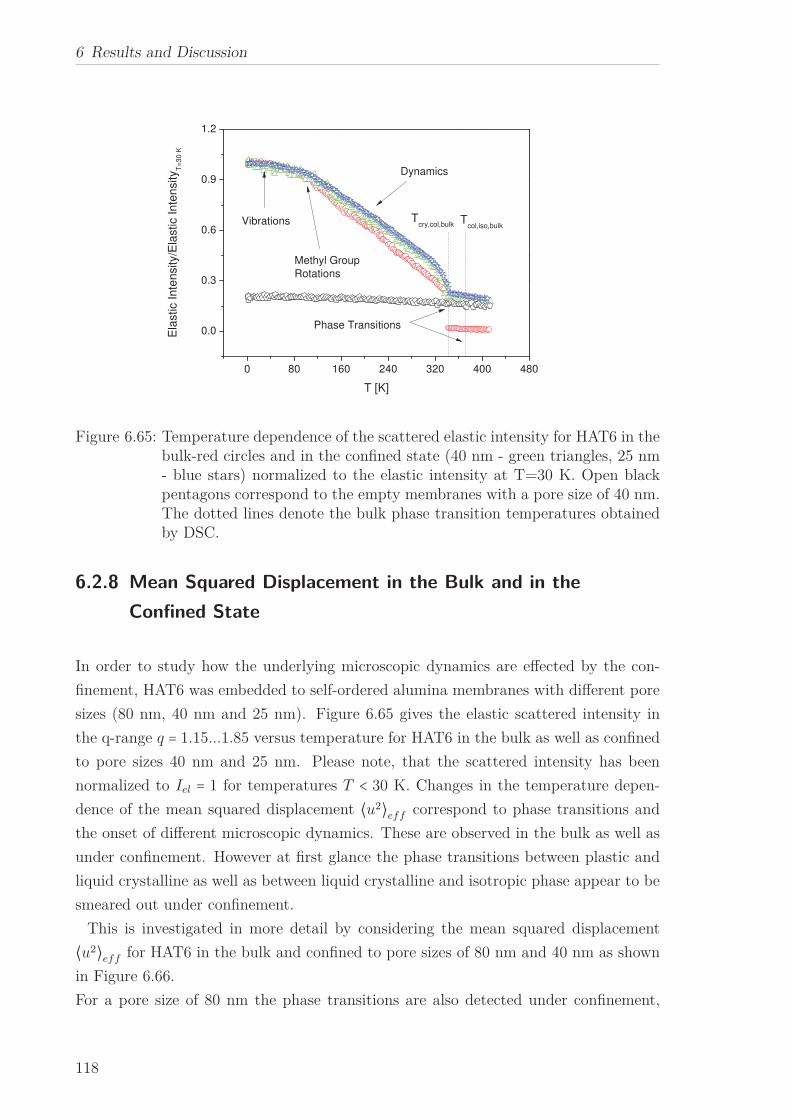
6 Results and Discussion
0 80 160 240 320 400 480
0.0
0.3
0.6
0.9
1.2
Ela
stic Inte
nsity/E
lastic Inte
nsity
T=
30
K
T [K]
Vibrations
Methyl Group
Rotations
Phase Transitions
Dynamics
Tcry,col,bulk T
col,iso,bulk
Figure 6.65: Temperature dependence of the scattered elastic intensity for HAT6 in thebulk-red circles and in the confined state (40 nm - green triangles, 25 nm- blue stars) normalized to the elastic intensity at T=30 K. Open blackpentagons correspond to the empty membranes with a pore size of 40 nm.The dotted lines denote the bulk phase transition temperatures obtainedby DSC.
6.2.8 Mean Squared Displacement in the Bulk and in the
Confined State
In order to study how the underlying microscopic dynamics are effected by the con-
finement, HAT6 was embedded to self-ordered alumina membranes with different pore
sizes (80 nm, 40 nm and 25 nm). Figure 6.65 gives the elastic scattered intensity in
the q-range q = 1.15...1.85 versus temperature for HAT6 in the bulk as well as confined
to pore sizes 40 nm and 25 nm. Please note, that the scattered intensity has been
normalized to Iel = 1 for temperatures T < 30 K. Changes in the temperature depen-
dence of the mean squared displacement ⟨u2⟩eff correspond to phase transitions and
the onset of different microscopic dynamics. These are observed in the bulk as well as
under confinement. However at first glance the phase transitions between plastic and
liquid crystalline as well as between liquid crystalline and isotropic phase appear to be
smeared out under confinement.
This is investigated in more detail by considering the mean squared displacement
⟨u2⟩eff for HAT6 in the bulk and confined to pore sizes of 80 nm and 40 nm as shown
in Figure 6.66.
For a pore size of 80 nm the phase transitions are also detected under confinement,
118
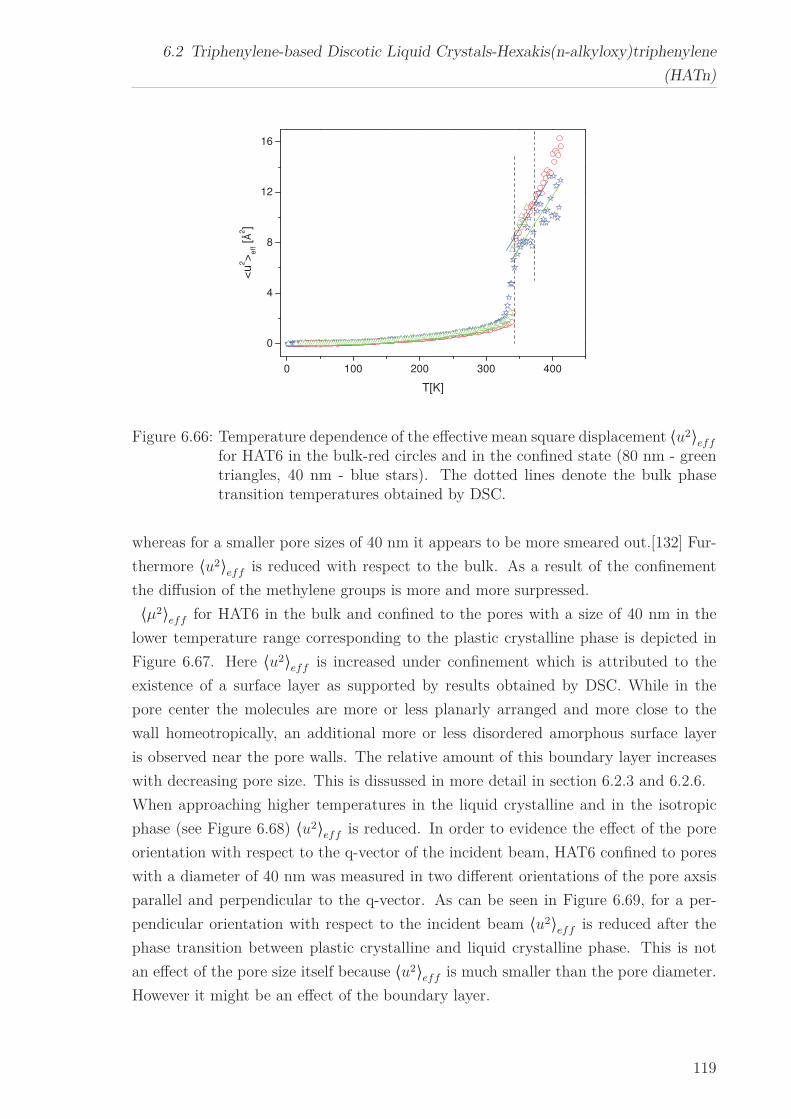
6.2 Triphenylene-based Discotic Liquid Crystals-Hexakis(n-alkyloxy)triphenylene
(HATn)
0 100 200 300 400
0
4
8
12
16
<u
2>
eff [
2]
T[K]
Figure 6.66: Temperature dependence of the effective mean square displacement ⟨u2⟩eff
for HAT6 in the bulk-red circles and in the confined state (80 nm - greentriangles, 40 nm - blue stars). The dotted lines denote the bulk phasetransition temperatures obtained by DSC.
whereas for a smaller pore sizes of 40 nm it appears to be more smeared out.[132] Fur-
thermore ⟨u2⟩eff is reduced with respect to the bulk. As a result of the confinement
the diffusion of the methylene groups is more and more surpressed.
⟨μ2⟩eff for HAT6 in the bulk and confined to the pores with a size of 40 nm in the
lower temperature range corresponding to the plastic crystalline phase is depicted in
Figure 6.67. Here ⟨u2⟩eff is increased under confinement which is attributed to the
existence of a surface layer as supported by results obtained by DSC. While in the
pore center the molecules are more or less planarly arranged and more close to the
wall homeotropically, an additional more or less disordered amorphous surface layer
is observed near the pore walls. The relative amount of this boundary layer increases
with decreasing pore size. This is dissussed in more detail in section 6.2.3 and 6.2.6.
When approaching higher temperatures in the liquid crystalline and in the isotropic
phase (see Figure 6.68) ⟨u2⟩eff is reduced. In order to evidence the effect of the pore
orientation with respect to the q-vector of the incident beam, HAT6 confined to pores
with a diameter of 40 nm was measured in two different orientations of the pore axsis
parallel and perpendicular to the q-vector. As can be seen in Figure 6.69, for a per-
pendicular orientation with respect to the incident beam ⟨u2⟩eff is reduced after the
phase transition between plastic crystalline and liquid crystalline phase. This is not
an effect of the pore size itself because ⟨u2⟩eff is much smaller than the pore diameter.
However it might be an effect of the boundary layer.
119
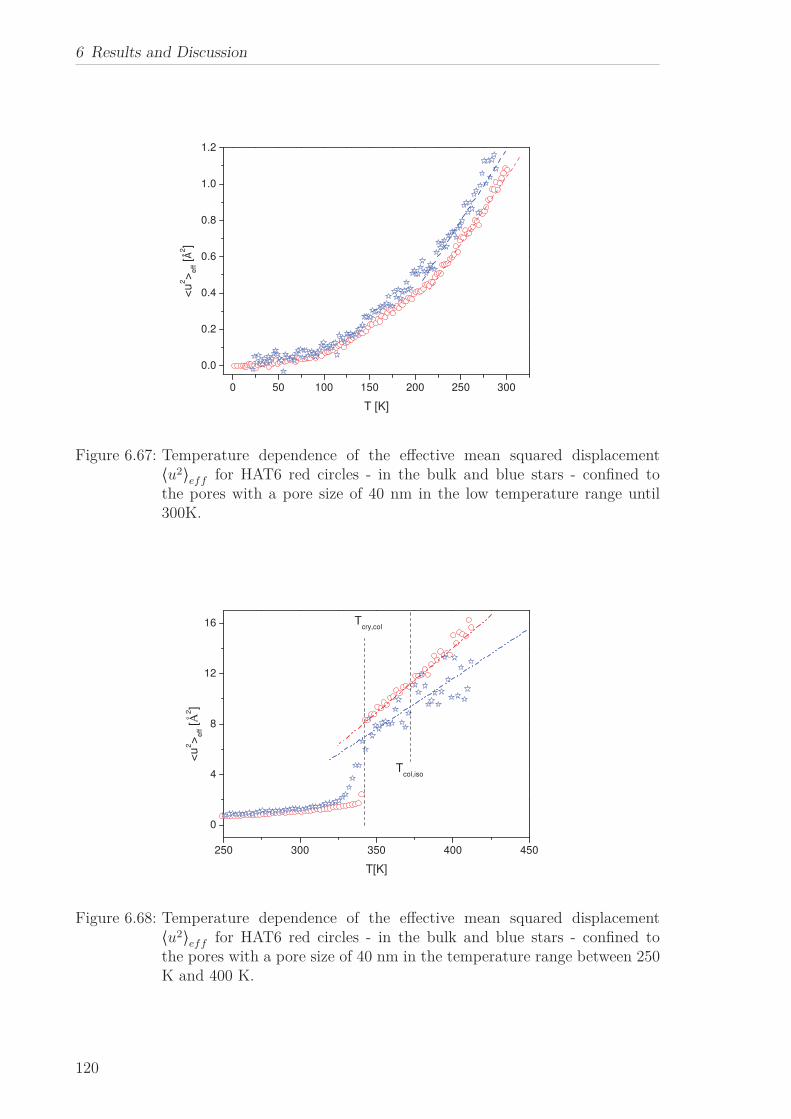
6 Results and Discussion
0 50 100 150 200 250 300
0.0
0.2
0.4
0.6
0.8
1.0
1.2
<u
2>
eff [
2]
T [K]
Figure 6.67: Temperature dependence of the effective mean squared displacement⟨u2⟩eff for HAT6 red circles - in the bulk and blue stars - confined tothe pores with a pore size of 40 nm in the low temperature range until300K.
250 300 350 400 450
0
4
8
12
16
Tcol,iso
<u
2>
eff [
Å2]
T[K]
Tcry,col
Figure 6.68: Temperature dependence of the effective mean squared displacement⟨u2⟩eff for HAT6 red circles - in the bulk and blue stars - confined tothe pores with a pore size of 40 nm in the temperature range between 250K and 400 K.
120
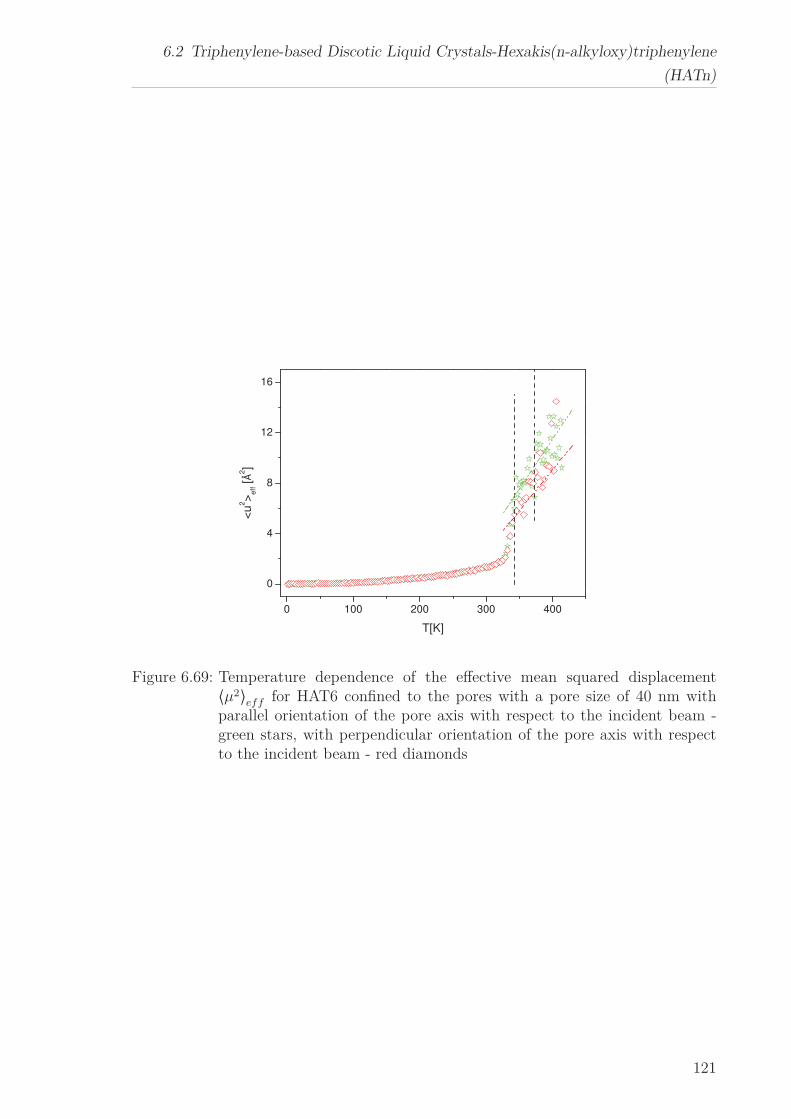
6.2 Triphenylene-based Discotic Liquid Crystals-Hexakis(n-alkyloxy)triphenylene
(HATn)
0 100 200 300 400
0
4
8
12
16
<u
2>
eff [
2]
T[K]
Figure 6.69: Temperature dependence of the effective mean squared displacement⟨μ2⟩eff for HAT6 confined to the pores with a pore size of 40 nm withparallel orientation of the pore axis with respect to the incident beam -green stars, with perpendicular orientation of the pore axis with respectto the incident beam - red diamonds
121
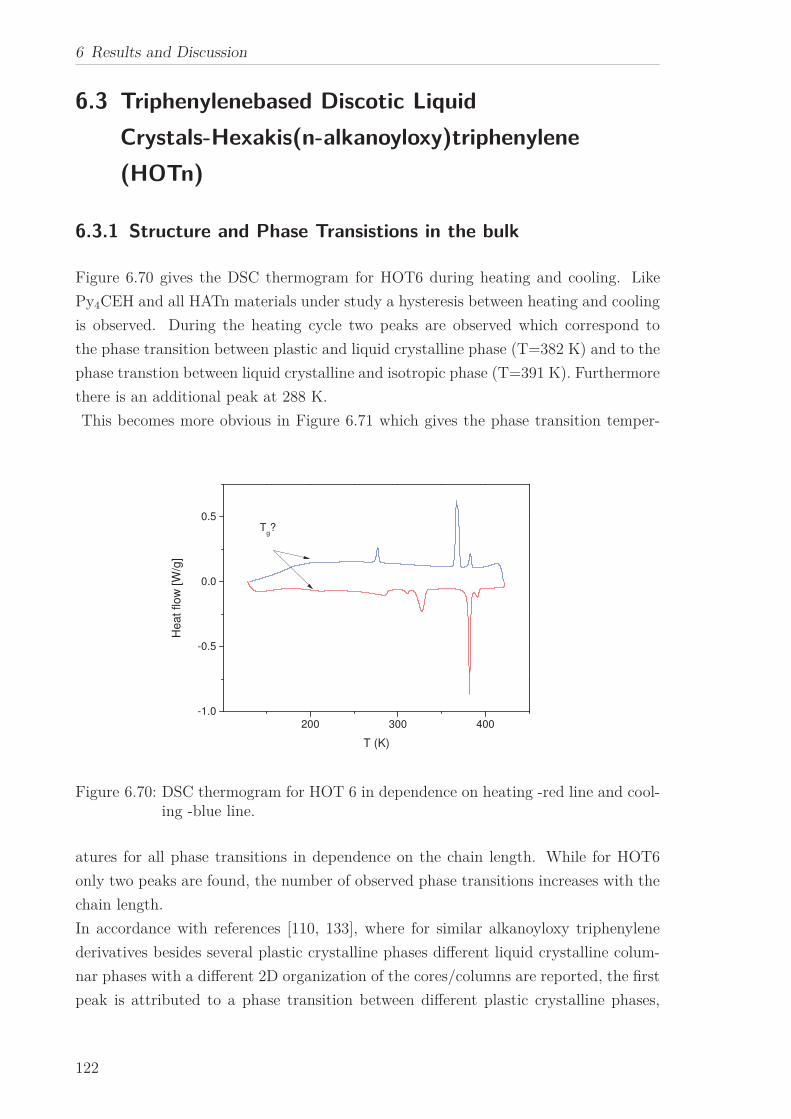
6 Results and Discussion
6.3 Triphenylenebased Discotic Liquid
Crystals-Hexakis(n-alkanoyloxy)triphenylene
(HOTn)
6.3.1 Structure and Phase Transistions in the bulk
Figure 6.70 gives the DSC thermogram for HOT6 during heating and cooling. Like
Py4CEH and all HATn materials under study a hysteresis between heating and cooling
is observed. During the heating cycle two peaks are observed which correspond to
the phase transition between plastic and liquid crystalline phase (T=382 K) and to the
phase transtion between liquid crystalline and isotropic phase (T=391 K). Furthermore
there is an additional peak at 288 K.
This becomes more obvious in Figure 6.71 which gives the phase transition temper-
200 300 400
-1.0
-0.5
0.0
0.5
Heat flow
[W
/g]
T (K)
Tg?
Figure 6.70: DSC thermogram for HOT 6 in dependence on heating -red line and cool-ing -blue line.
atures for all phase transitions in dependence on the chain length. While for HOT6
only two peaks are found, the number of observed phase transitions increases with the
chain length.
In accordance with references [110, 133], where for similar alkanoyloxy triphenylene
derivatives besides several plastic crystalline phases different liquid crystalline colum-
nar phases with a different 2D organization of the cores/columns are reported, the first
peak is attributed to a phase transition between different plastic crystalline phases,
122
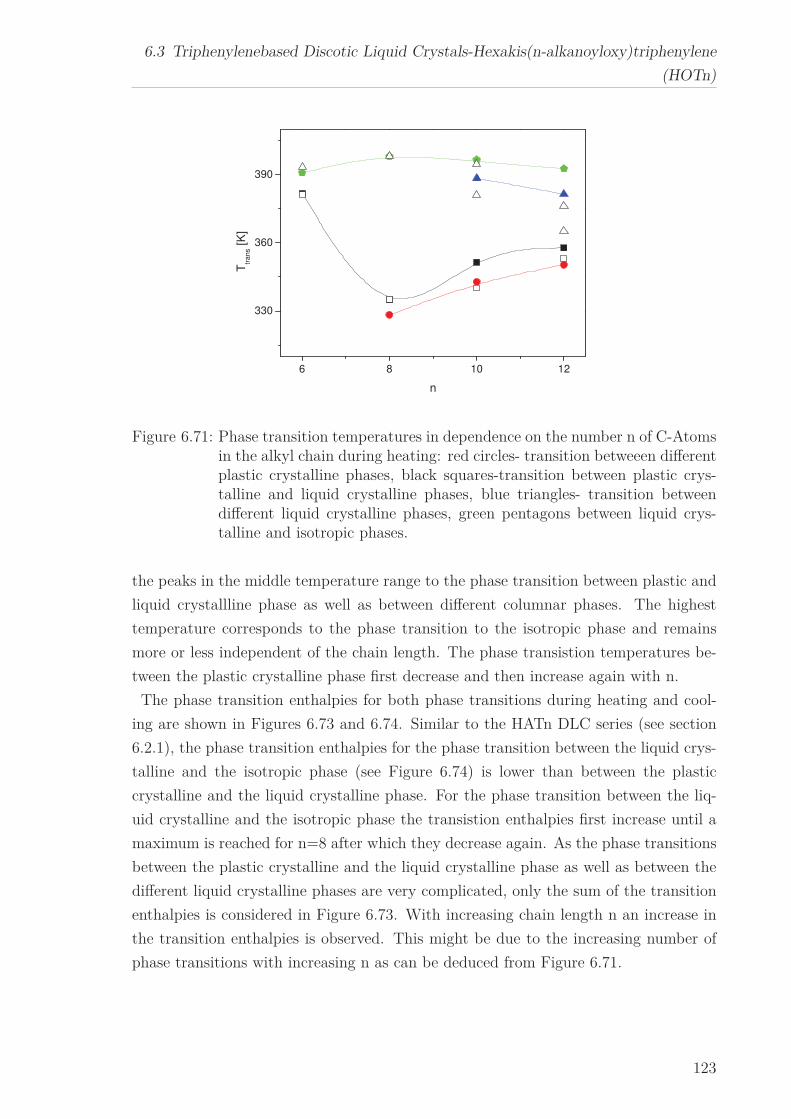
6.3 Triphenylenebased Discotic Liquid Crystals-Hexakis(n-alkanoyloxy)triphenylene
(HOTn)
6 8 10 12
330
360
390
Ttr
ans [K
]
n
Figure 6.71: Phase transition temperatures in dependence on the number n of C-Atomsin the alkyl chain during heating: red circles- transition betweeen differentplastic crystalline phases, black squares-transition between plastic crys-talline and liquid crystalline phases, blue triangles- transition betweendifferent liquid crystalline phases, green pentagons between liquid crys-talline and isotropic phases.
the peaks in the middle temperature range to the phase transition between plastic and
liquid crystallline phase as well as between different columnar phases. The highest
temperature corresponds to the phase transition to the isotropic phase and remains
more or less independent of the chain length. The phase transistion temperatures be-
tween the plastic crystalline phase first decrease and then increase again with n.
The phase transition enthalpies for both phase transitions during heating and cool-
ing are shown in Figures 6.73 and 6.74. Similar to the HATn DLC series (see section
6.2.1), the phase transition enthalpies for the phase transition between the liquid crys-
talline and the isotropic phase (see Figure 6.74) is lower than between the plastic
crystalline and the liquid crystalline phase. For the phase transition between the liq-
uid crystalline and the isotropic phase the transistion enthalpies first increase until a
maximum is reached for n=8 after which they decrease again. As the phase transitions
between the plastic crystalline and the liquid crystalline phase as well as between the
different liquid crystalline phases are very complicated, only the sum of the transition
enthalpies is considered in Figure 6.73. With increasing chain length n an increase in
the transition enthalpies is observed. This might be due to the increasing number of
phase transitions with increasing n as can be deduced from Figure 6.71.
123
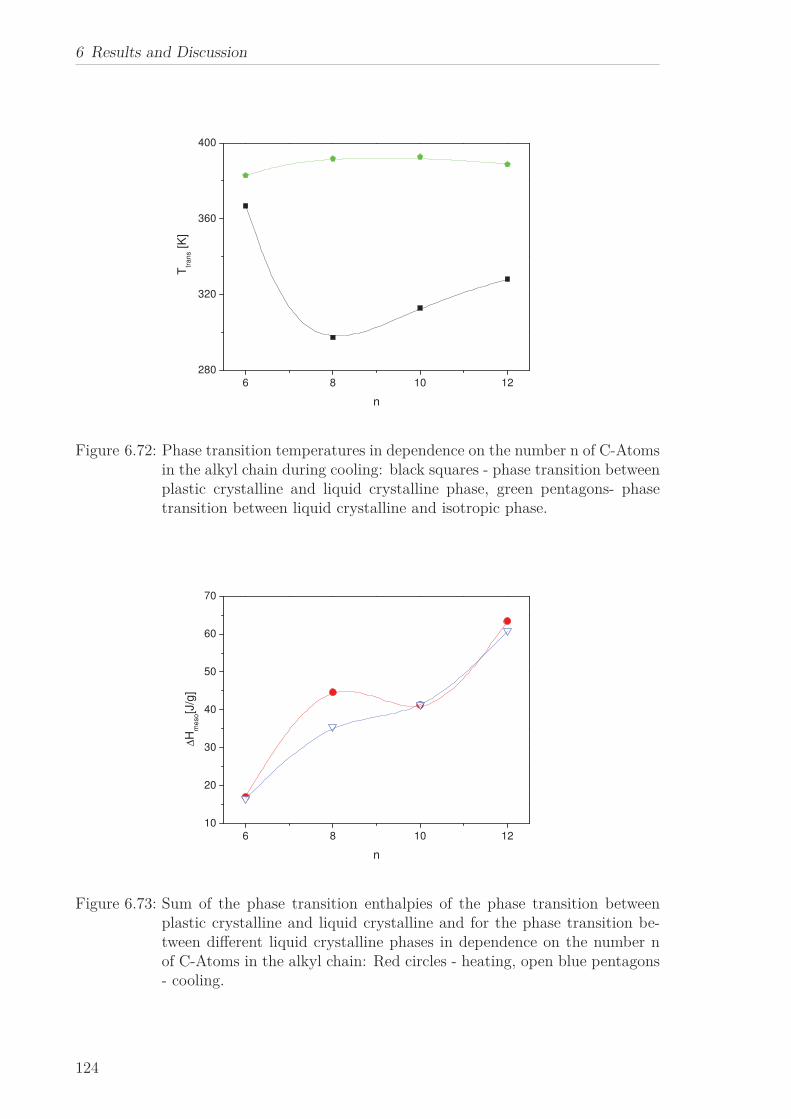
6 Results and Discussion
6 8 10 12
280
320
360
400
Ttr
an
s [K
]
n
Figure 6.72: Phase transition temperatures in dependence on the number n of C-Atomsin the alkyl chain during cooling: black squares - phase transition betweenplastic crystalline and liquid crystalline phase, green pentagons- phasetransition between liquid crystalline and isotropic phase.
6 8 10 12
10
20
30
40
50
60
70
∆H
me
so[J
/g]
n
Figure 6.73: Sum of the phase transition enthalpies of the phase transition betweenplastic crystalline and liquid crystalline and for the phase transition be-tween different liquid crystalline phases in dependence on the number nof C-Atoms in the alkyl chain: Red circles - heating, open blue pentagons- cooling.
124
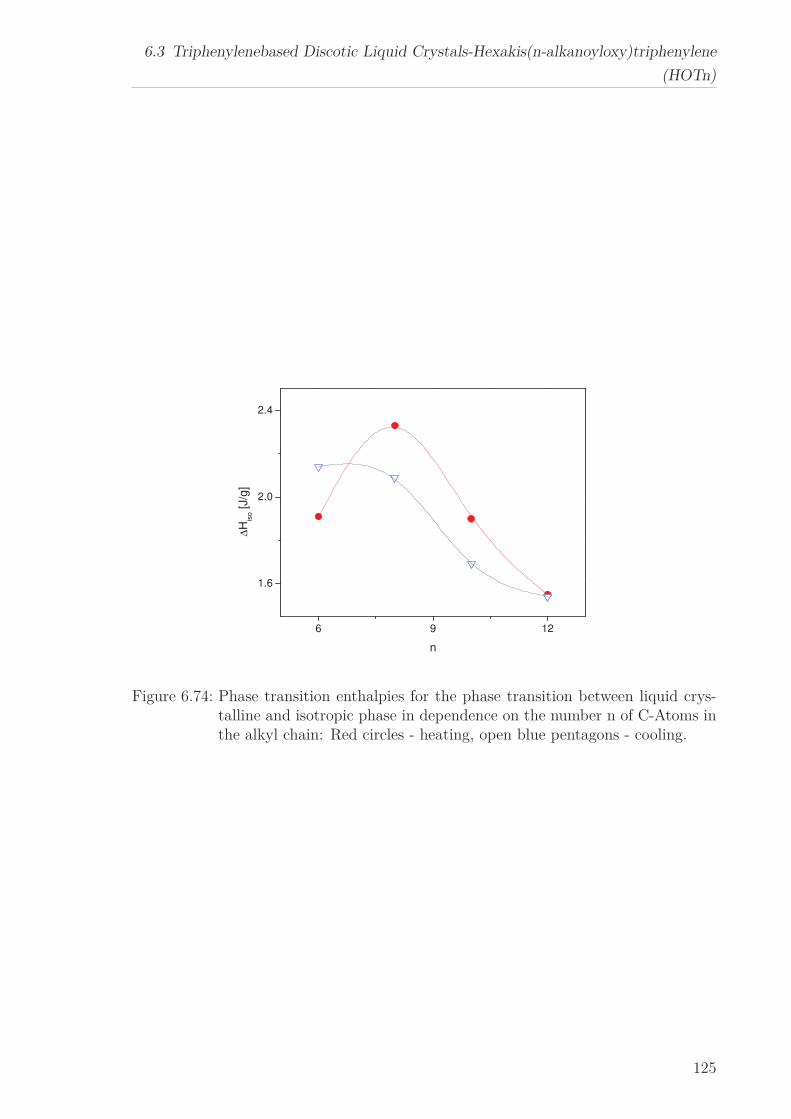
6.3 Triphenylenebased Discotic Liquid Crystals-Hexakis(n-alkanoyloxy)triphenylene
(HOTn)
6 9 12
1.6
2.0
2.4
∆H
iso [J/g
]
n
Figure 6.74: Phase transition enthalpies for the phase transition between liquid crys-talline and isotropic phase in dependence on the number n of C-Atoms inthe alkyl chain: Red circles - heating, open blue pentagons - cooling.
125
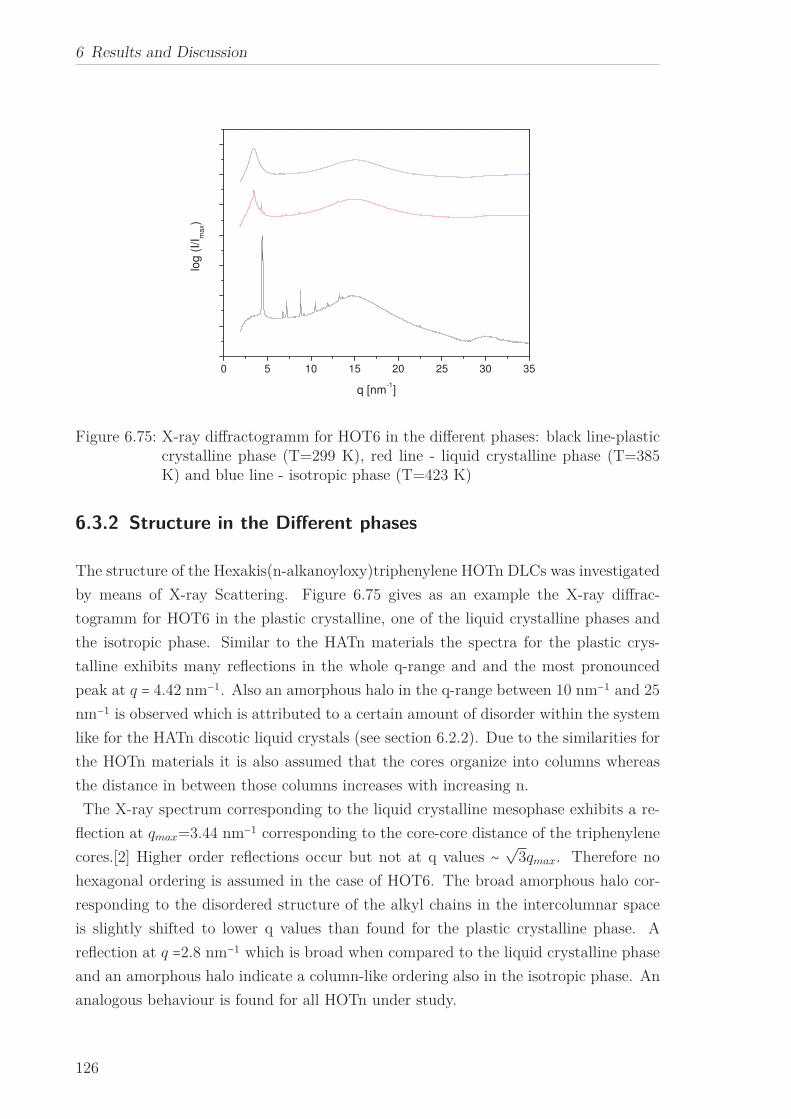
6 Results and Discussion
0 5 10 15 20 25 30 35
log (
I/I m
ax)
q [nm-1]
Figure 6.75: X-ray diffractogramm for HOT6 in the different phases: black line-plasticcrystalline phase (T=299 K), red line - liquid crystalline phase (T=385K) and blue line - isotropic phase (T=423 K)
6.3.2 Structure in the Different phases
The structure of the Hexakis(n-alkanoyloxy)triphenylene HOTn DLCs was investigated
by means of X-ray Scattering. Figure 6.75 gives as an example the X-ray diffrac-
togramm for HOT6 in the plastic crystalline, one of the liquid crystalline phases and
the isotropic phase. Similar to the HATn materials the spectra for the plastic crys-
talline exhibits many reflections in the whole q-range and and the most pronounced
peak at q = 4.42 nm−1. Also an amorphous halo in the q-range between 10 nm−1 and 25
nm−1 is observed which is attributed to a certain amount of disorder within the system
like for the HATn discotic liquid crystals (see section 6.2.2). Due to the similarities for
the HOTn materials it is also assumed that the cores organize into columns whereas
the distance in between those columns increases with increasing n.
The X-ray spectrum corresponding to the liquid crystalline mesophase exhibits a re-
flection at qmax=3.44 nm−1 corresponding to the core-core distance of the triphenylene
cores.[2] Higher order reflections occur but not at q values ∼ √3qmax. Therefore no
hexagonal ordering is assumed in the case of HOT6. The broad amorphous halo cor-
responding to the disordered structure of the alkyl chains in the intercolumnar space
is slightly shifted to lower q values than found for the plastic crystalline phase. A
reflection at q =2.8 nm−1 which is broad when compared to the liquid crystalline phase
and an amorphous halo indicate a column-like ordering also in the isotropic phase. An
analogous behaviour is found for all HOTn under study.
126
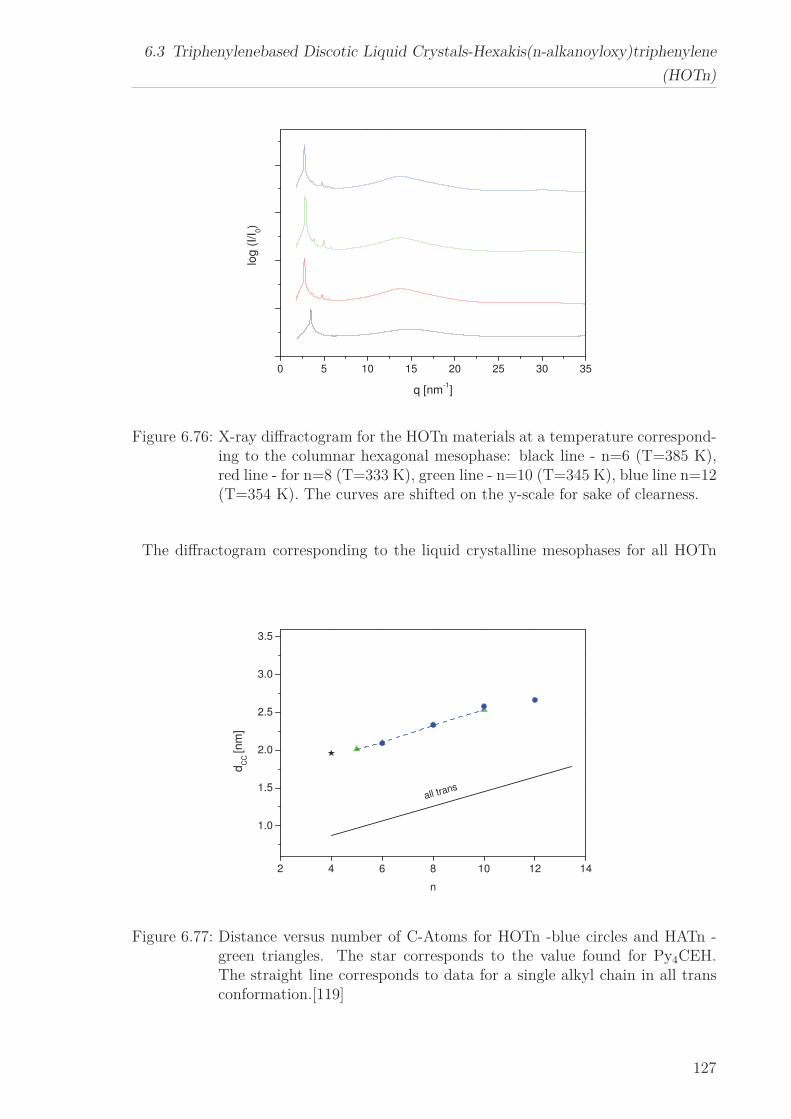
6.3 Triphenylenebased Discotic Liquid Crystals-Hexakis(n-alkanoyloxy)triphenylene
(HOTn)
0 5 10 15 20 25 30 35
log (
I/I 0
)
q [nm-1]
Figure 6.76: X-ray diffractogram for the HOTn materials at a temperature correspond-ing to the columnar hexagonal mesophase: black line - n=6 (T=385 K),red line - for n=8 (T=333 K), green line - n=10 (T=345 K), blue line n=12(T=354 K). The curves are shifted on the y-scale for sake of clearness.
The diffractogram corresponding to the liquid crystalline mesophases for all HOTn
2 4 6 8 10 12 14
1.0
1.5
2.0
2.5
3.0
3.5
dC
C [n
m]
n
all trans
Figure 6.77: Distance versus number of C-Atoms for HOTn -blue circles and HATn -green triangles. The star corresponds to the value found for Py4CEH.The straight line corresponds to data for a single alkyl chain in all transconformation.[119]
127
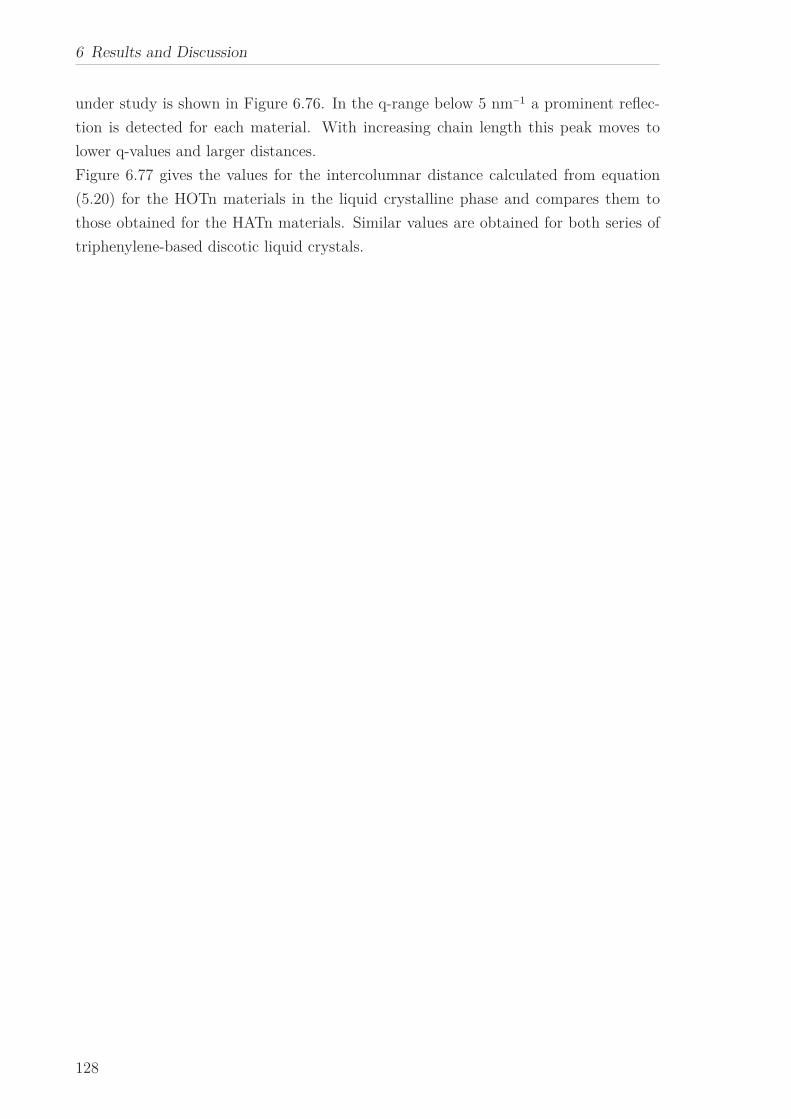
6 Results and Discussion
under study is shown in Figure 6.76. In the q-range below 5 nm−1 a prominent reflec-
tion is detected for each material. With increasing chain length this peak moves to
lower q-values and larger distances.
Figure 6.77 gives the values for the intercolumnar distance calculated from equation
(5.20) for the HOTn materials in the liquid crystalline phase and compares them to
those obtained for the HATn materials. Similar values are obtained for both series of
triphenylene-based discotic liquid crystals.
128
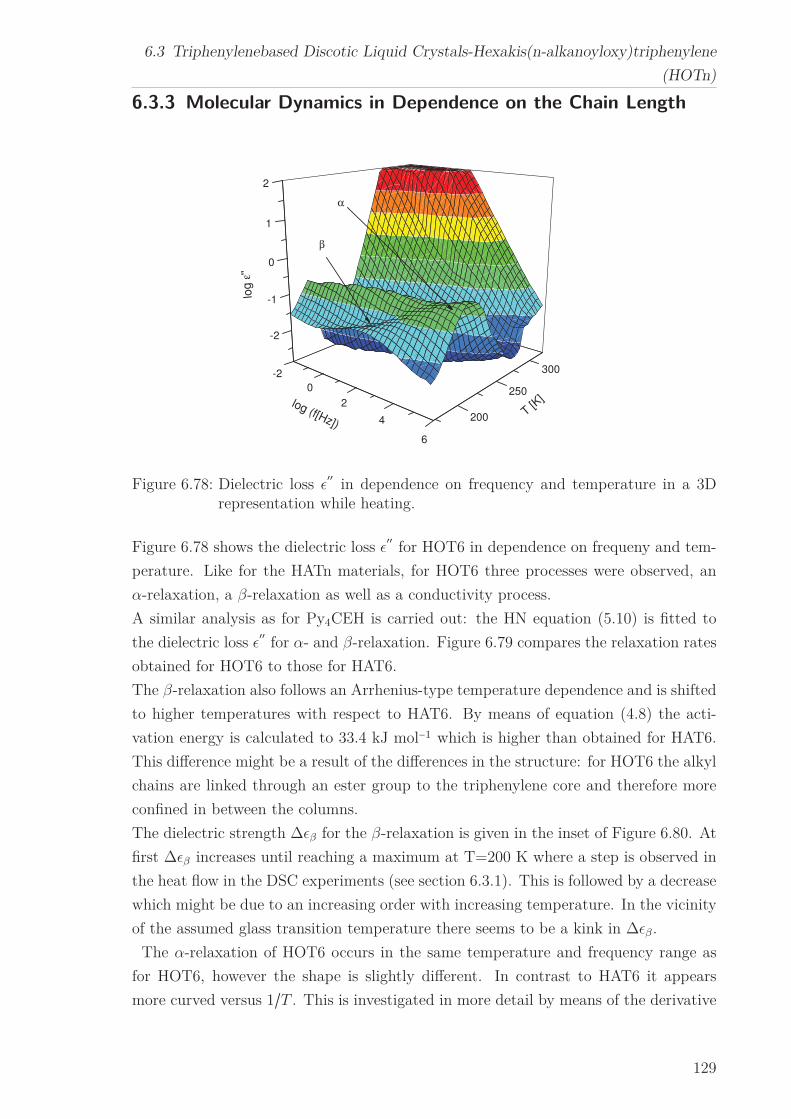
6.3 Triphenylenebased Discotic Liquid Crystals-Hexakis(n-alkanoyloxy)triphenylene
(HOTn)
6.3.3 Molecular Dynamics in Dependence on the Chain Length
-2
0
2
4
6
-2
-1
0
1
2
200
250
300
log ε
''
T [K]log (f[Hz])
α
β
Figure 6.78: Dielectric loss ǫ′′
in dependence on frequency and temperature in a 3Drepresentation while heating.
Figure 6.78 shows the dielectric loss ǫ′′
for HOT6 in dependence on frequeny and tem-
perature. Like for the HATn materials, for HOT6 three processes were observed, an
α-relaxation, a β-relaxation as well as a conductivity process.
A similar analysis as for Py4CEH is carried out: the HN equation (5.10) is fitted to
the dielectric loss ǫ′′
for α- and β-relaxation. Figure 6.79 compares the relaxation rates
obtained for HOT6 to those for HAT6.
The β-relaxation also follows an Arrhenius-type temperature dependence and is shifted
to higher temperatures with respect to HAT6. By means of equation (4.8) the acti-
vation energy is calculated to 33.4 kJ mol−1 which is higher than obtained for HAT6.
This difference might be a result of the differences in the structure: for HOT6 the alkyl
chains are linked through an ester group to the triphenylene core and therefore more
confined in between the columns.
The dielectric strength ∆ǫβ for the β-relaxation is given in the inset of Figure 6.80. At
first ∆ǫβ increases until reaching a maximum at T=200 K where a step is observed in
the heat flow in the DSC experiments (see section 6.3.1). This is followed by a decrease
which might be due to an increasing order with increasing temperature. In the vicinity
of the assumed glass transition temperature there seems to be a kink in ∆ǫβ.
The α-relaxation of HOT6 occurs in the same temperature and frequency range as
for HOT6, however the shape is slightly different. In contrast to HAT6 it appears
more curved versus 1/T . This is investigated in more detail by means of the derivative
129
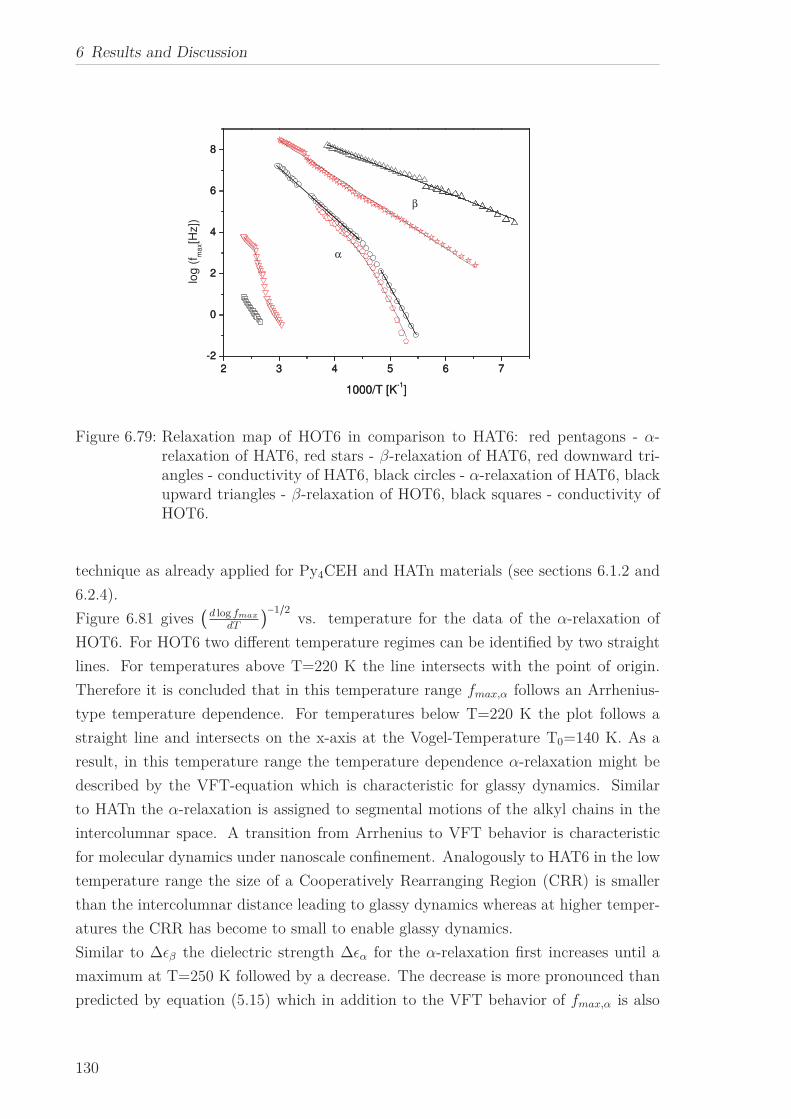
6 Results and Discussion
2 3 4 5 6 7
-2
0
2
4
6
8
2 3 4 5 6 7
-2
0
2
4
6
8
log
(f m
ax[H
z])
1000/T [K-1]
β
α
1000/T [K-1]
Figure 6.79: Relaxation map of HOT6 in comparison to HAT6: red pentagons - α-relaxation of HAT6, red stars - β-relaxation of HAT6, red downward tri-angles - conductivity of HAT6, black circles - α-relaxation of HAT6, blackupward triangles - β-relaxation of HOT6, black squares - conductivity ofHOT6.
technique as already applied for Py4CEH and HATn materials (see sections 6.1.2 and
6.2.4).
Figure 6.81 gives (d log fmax
dT)−1/2
vs. temperature for the data of the α-relaxation of
HOT6. For HOT6 two different temperature regimes can be identified by two straight
lines. For temperatures above T=220 K the line intersects with the point of origin.
Therefore it is concluded that in this temperature range fmax,α follows an Arrhenius-
type temperature dependence. For temperatures below T=220 K the plot follows a
straight line and intersects on the x-axis at the Vogel-Temperature T0=140 K. As a
result, in this temperature range the temperature dependence α-relaxation might be
described by the VFT-equation which is characteristic for glassy dynamics. Similar
to HATn the α-relaxation is assigned to segmental motions of the alkyl chains in the
intercolumnar space. A transition from Arrhenius to VFT behavior is characteristic
for molecular dynamics under nanoscale confinement. Analogously to HAT6 in the low
temperature range the size of a Cooperatively Rearranging Region (CRR) is smaller
than the intercolumnar distance leading to glassy dynamics whereas at higher temper-
atures the CRR has become to small to enable glassy dynamics.
Similar to ∆ǫβ the dielectric strength ∆ǫα for the α-relaxation first increases until a
maximum at T=250 K followed by a decrease. The decrease is more pronounced than
predicted by equation (5.15) which in addition to the VFT behavior of fmax,α is also
130
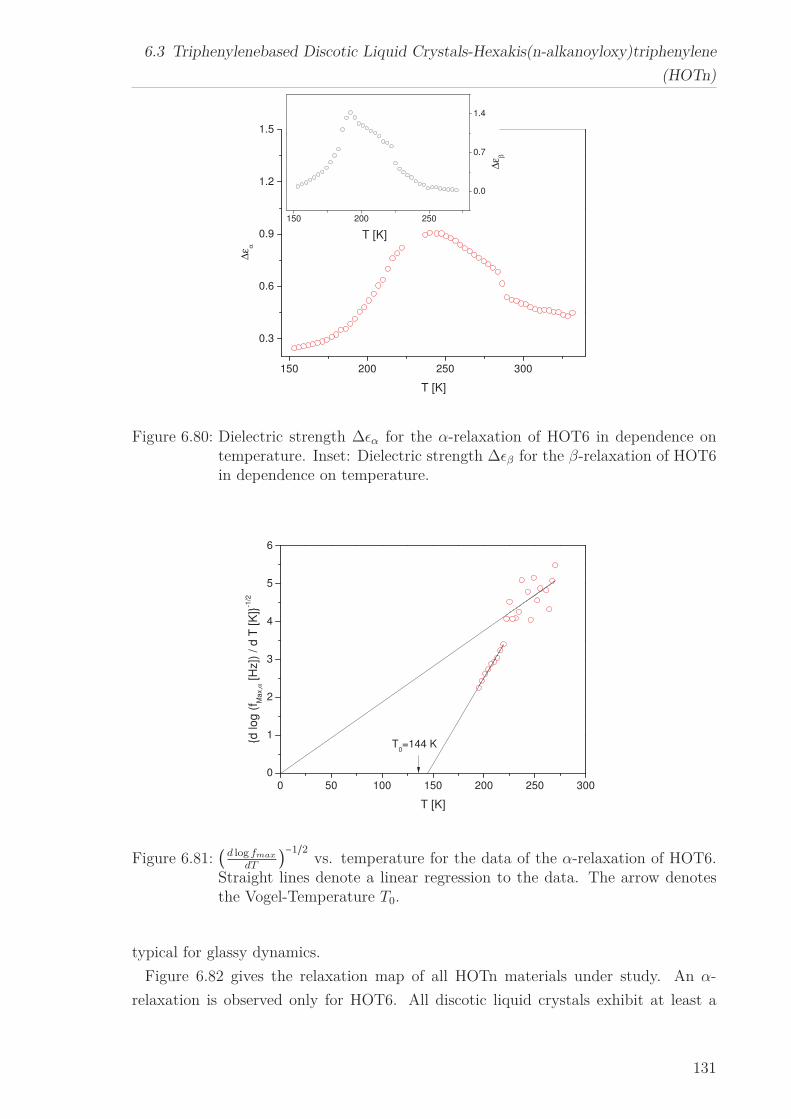
6.3 Triphenylenebased Discotic Liquid Crystals-Hexakis(n-alkanoyloxy)triphenylene
(HOTn)
150 200 250 300
0.3
0.6
0.9
1.2
1.5
∆ε α
T [K]
150 200 250
0.0
0.7
1.4
∆ε β
T [K]
Figure 6.80: Dielectric strength ∆ǫα for the α-relaxation of HOT6 in dependence ontemperature. Inset: Dielectric strength ∆ǫβ for the β-relaxation of HOT6in dependence on temperature.
0 50 100 150 200 250 300
0
1
2
3
4
5
6
d lo
g (
f Ma
x,α [H
z])
/ d
T [K
]-1
/2
T [K]
T0=144 K
Figure 6.81: (d log fmax
dT)−1/2
vs. temperature for the data of the α-relaxation of HOT6.Straight lines denote a linear regression to the data. The arrow denotesthe Vogel-Temperature T0.
typical for glassy dynamics.
Figure 6.82 gives the relaxation map of all HOTn materials under study. An α-
relaxation is observed only for HOT6. All discotic liquid crystals exhibit at least a
131
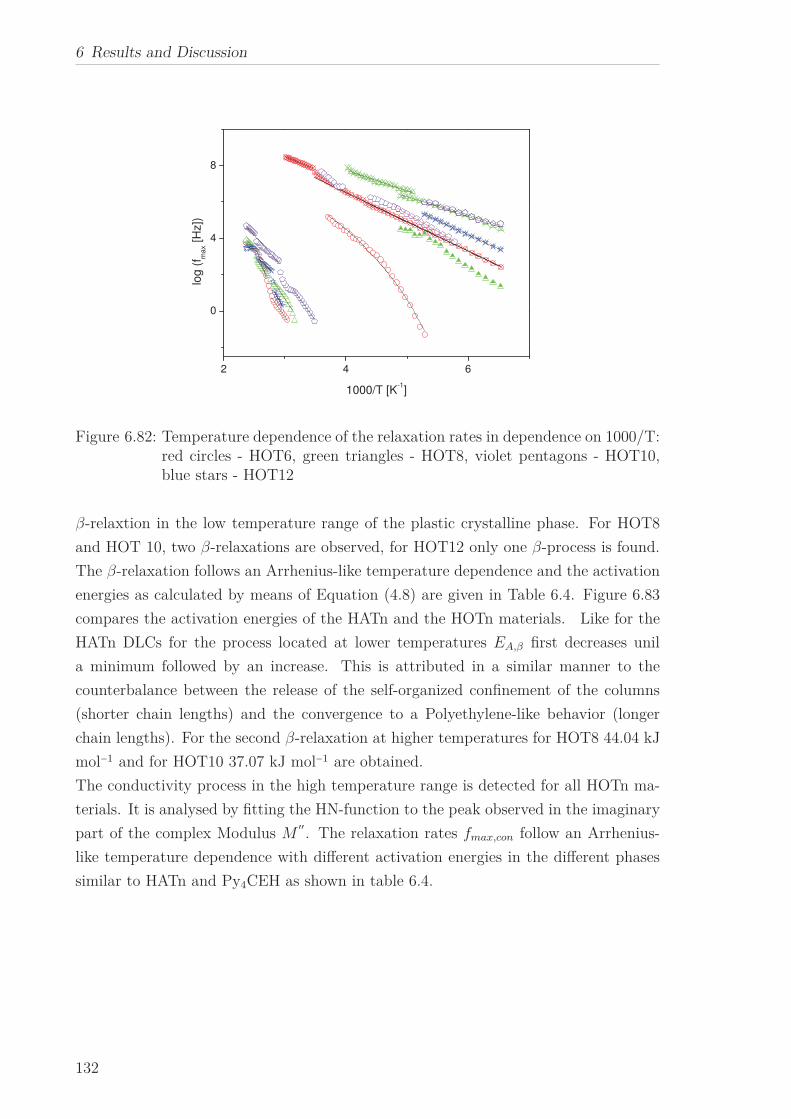
6 Results and Discussion
2 4 6
0
4
8
log
(f m
ax [H
z])
1000/T [K-1]
Figure 6.82: Temperature dependence of the relaxation rates in dependence on 1000/T:red circles - HOT6, green triangles - HOT8, violet pentagons - HOT10,blue stars - HOT12
β-relaxtion in the low temperature range of the plastic crystalline phase. For HOT8
and HOT 10, two β-relaxations are observed, for HOT12 only one β-process is found.
The β-relaxation follows an Arrhenius-like temperature dependence and the activation
energies as calculated by means of Equation (4.8) are given in Table 6.4. Figure 6.83
compares the activation energies of the HATn and the HOTn materials. Like for the
HATn DLCs for the process located at lower temperatures EA,β first decreases unil
a minimum followed by an increase. This is attributed in a similar manner to the
counterbalance between the release of the self-organized confinement of the columns
(shorter chain lengths) and the convergence to a Polyethylene-like behavior (longer
chain lengths). For the second β-relaxation at higher temperatures for HOT8 44.04 kJ
mol−1 and for HOT10 37.07 kJ mol−1 are obtained.
The conductivity process in the high temperature range is detected for all HOTn ma-
terials. It is analysed by fitting the HN-function to the peak observed in the imaginary
part of the complex Modulus M′′. The relaxation rates fmax,con follow an Arrhenius-
like temperature dependence with different activation energies in the different phases
similar to HATn and Py4CEH as shown in table 6.4.
132
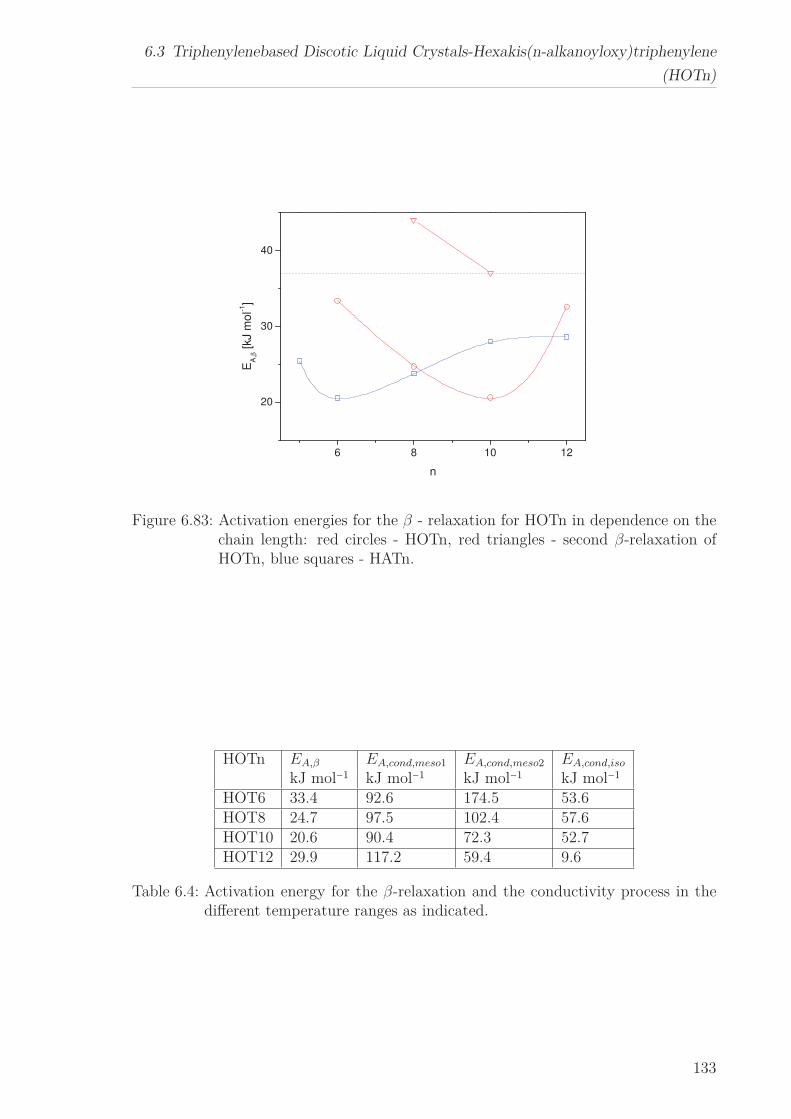
6.3 Triphenylenebased Discotic Liquid Crystals-Hexakis(n-alkanoyloxy)triphenylene
(HOTn)
6 8 10 12
20
30
40
EA
,β [kJ m
ol-1
]
n
Figure 6.83: Activation energies for the β - relaxation for HOTn in dependence on thechain length: red circles - HOTn, red triangles - second β-relaxation ofHOTn, blue squares - HATn.
HOTn EA,β EA,cond,meso1 EA,cond,meso2 EA,cond,iso
kJ mol−1 kJ mol−1 kJ mol−1 kJ mol−1
HOT6 33.4 92.6 174.5 53.6HOT8 24.7 97.5 102.4 57.6HOT10 20.6 90.4 72.3 52.7HOT12 29.9 117.2 59.4 9.6
Table 6.4: Activation energy for the β-relaxation and the conductivity process in thedifferent temperature ranges as indicated.
133
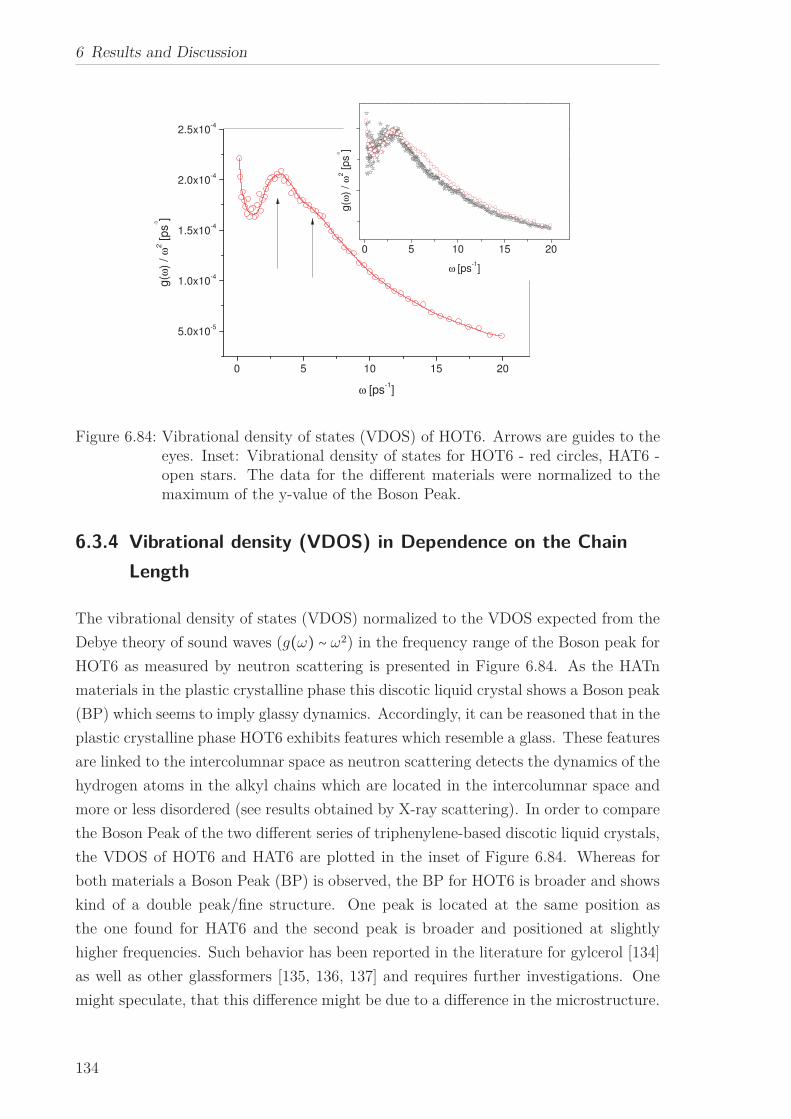
6 Results and Discussion
0 5 10 15 20
5.0x10⁻⁵
1.0x10⁻⁴
1.5x10⁻⁴
2.0x10⁻⁴
2.5x10⁻⁴
g(ω
) /
ω2 [ps
-3
]
ω [ps-1]
0 5 10 15 20
g(ω
) /
ω2 [ps
-3
]
ω [ps-1]
Figure 6.84: Vibrational density of states (VDOS) of HOT6. Arrows are guides to theeyes. Inset: Vibrational density of states for HOT6 - red circles, HAT6 -open stars. The data for the different materials were normalized to themaximum of the y-value of the Boson Peak.
6.3.4 Vibrational density (VDOS) in Dependence on the Chain
Length
The vibrational density of states (VDOS) normalized to the VDOS expected from the
Debye theory of sound waves (g(ω) ∼ ω2) in the frequency range of the Boson peak for
HOT6 as measured by neutron scattering is presented in Figure 6.84. As the HATn
materials in the plastic crystalline phase this discotic liquid crystal shows a Boson peak
(BP) which seems to imply glassy dynamics. Accordingly, it can be reasoned that in the
plastic crystalline phase HOT6 exhibits features which resemble a glass. These features
are linked to the intercolumnar space as neutron scattering detects the dynamics of the
hydrogen atoms in the alkyl chains which are located in the intercolumnar space and
more or less disordered (see results obtained by X-ray scattering). In order to compare
the Boson Peak of the two different series of triphenylene-based discotic liquid crystals,
the VDOS of HOT6 and HAT6 are plotted in the inset of Figure 6.84. Whereas for
both materials a Boson Peak (BP) is observed, the BP for HOT6 is broader and shows
kind of a double peak/fine structure. One peak is located at the same position as
the one found for HAT6 and the second peak is broader and positioned at slightly
higher frequencies. Such behavior has been reported in the literature for gylcerol [134]
as well as other glassformers [135, 136, 137] and requires further investigations. One
might speculate, that this difference might be due to a difference in the microstructure.
134
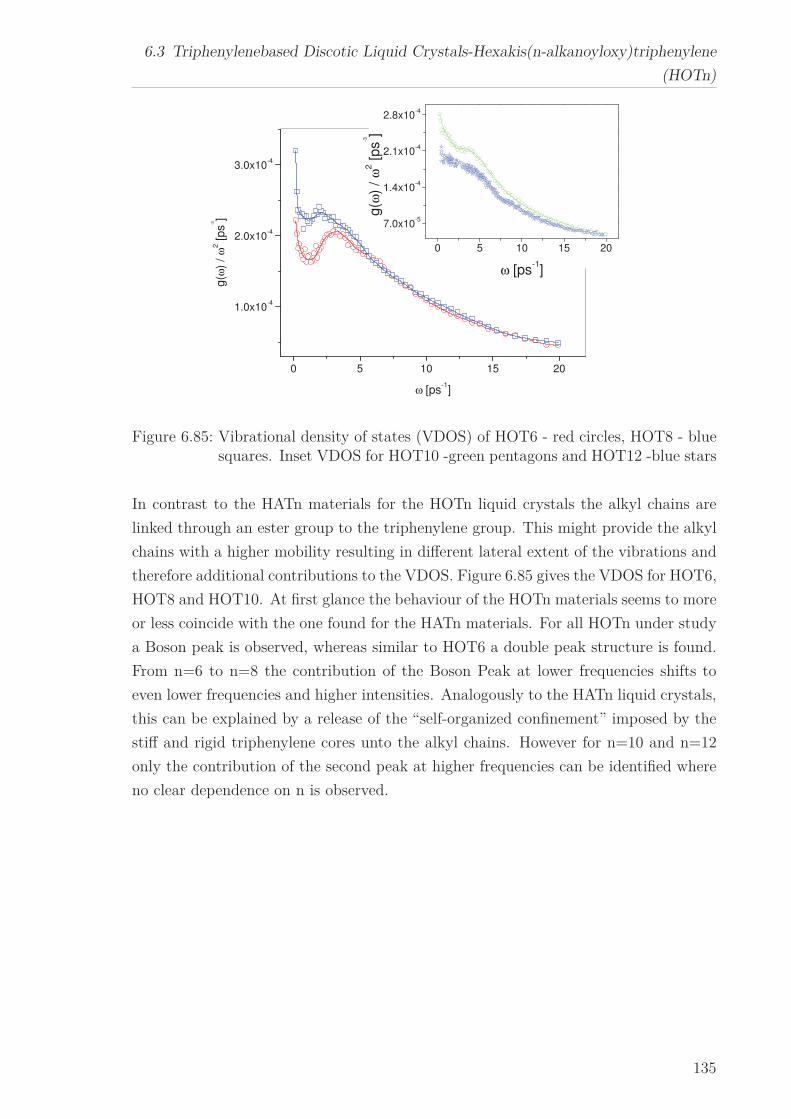
6.3 Triphenylenebased Discotic Liquid Crystals-Hexakis(n-alkanoyloxy)triphenylene
(HOTn)
0 5 10 15 20
1.0x10⁻⁴
2.0x10⁻⁴
3.0x10⁻⁴
0 5 10 15 20
7.0x10⁻⁵
1.4x10⁻⁴
2.1x10⁻⁴
2.8x10⁻⁴
g(ω
) /
ω2 [ps
-3
]
ω [ps-1]
g(ω
) /
ω2 [ps
-3
]
ω [ps-1]
Figure 6.85: Vibrational density of states (VDOS) of HOT6 - red circles, HOT8 - bluesquares. Inset VDOS for HOT10 -green pentagons and HOT12 -blue stars
In contrast to the HATn materials for the HOTn liquid crystals the alkyl chains are
linked through an ester group to the triphenylene group. This might provide the alkyl
chains with a higher mobility resulting in different lateral extent of the vibrations and
therefore additional contributions to the VDOS. Figure 6.85 gives the VDOS for HOT6,
HOT8 and HOT10. At first glance the behaviour of the HOTn materials seems to more
or less coincide with the one found for the HATn materials. For all HOTn under study
a Boson peak is observed, whereas similar to HOT6 a double peak structure is found.
From n=6 to n=8 the contribution of the Boson Peak at lower frequencies shifts to
even lower frequencies and higher intensities. Analogously to the HATn liquid crystals,
this can be explained by a release of the “self-organized confinement” imposed by the
stiff and rigid triphenylene cores unto the alkyl chains. However for n=10 and n=12
only the contribution of the second peak at higher frequencies can be identified where
no clear dependence on n is observed.
135
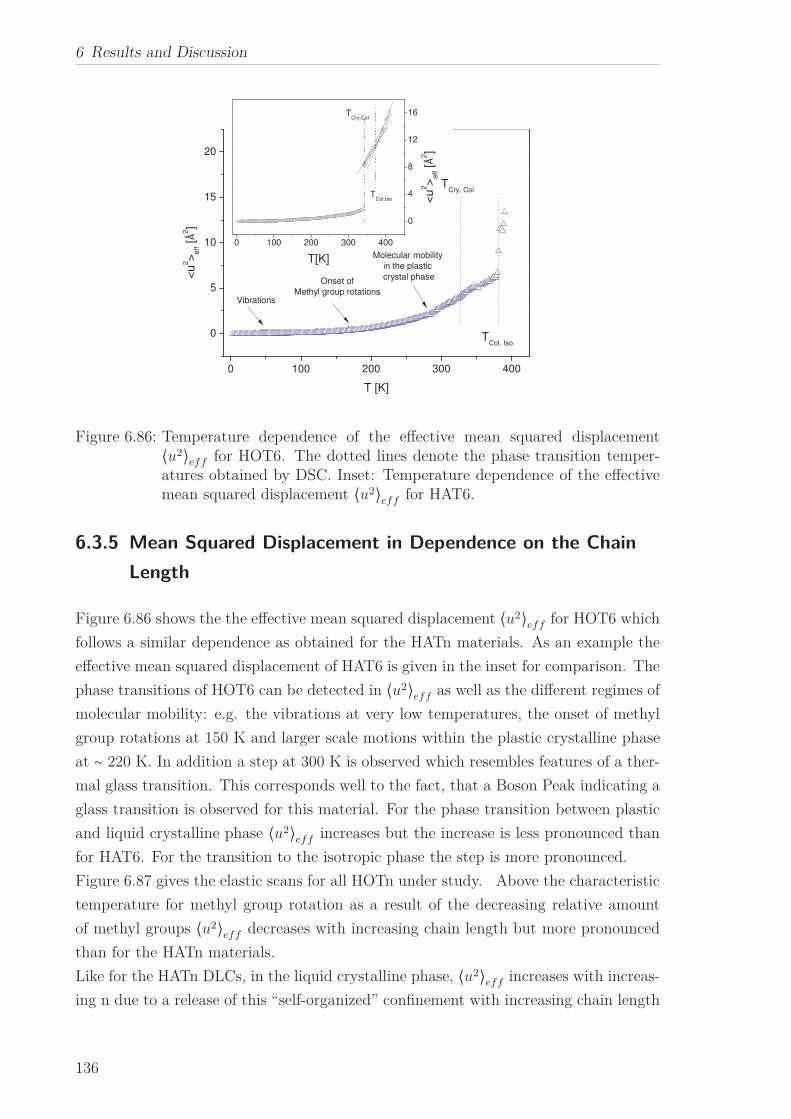
6 Results and Discussion
0 100 200 300 400
0
5
10
15
20
0 100 200 300 400
0
4
8
12
16
TCol, Iso
<u
2>
eff [
2]
T [K]
TCry, Col
Molecular mobility
in the plastic
crystal phaseOnset of
Methyl group rotationsVibrations
<u
2>
eff [
2]
TCol,Iso
TCry,Col
T[K]
Figure 6.86: Temperature dependence of the effective mean squared displacement⟨u2⟩eff for HOT6. The dotted lines denote the phase transition temper-atures obtained by DSC. Inset: Temperature dependence of the effectivemean squared displacement ⟨u2⟩eff for HAT6.
6.3.5 Mean Squared Displacement in Dependence on the Chain
Length
Figure 6.86 shows the the effective mean squared displacement ⟨u2⟩eff for HOT6 which
follows a similar dependence as obtained for the HATn materials. As an example the
effective mean squared displacement of HAT6 is given in the inset for comparison. The
phase transitions of HOT6 can be detected in ⟨u2⟩eff as well as the different regimes of
molecular mobility: e.g. the vibrations at very low temperatures, the onset of methyl
group rotations at 150 K and larger scale motions within the plastic crystalline phase
at ∼ 220 K. In addition a step at 300 K is observed which resembles features of a ther-
mal glass transition. This corresponds well to the fact, that a Boson Peak indicating a
glass transition is observed for this material. For the phase transition between plastic
and liquid crystalline phase ⟨u2⟩eff increases but the increase is less pronounced than
for HAT6. For the transition to the isotropic phase the step is more pronounced.
Figure 6.87 gives the elastic scans for all HOTn under study. Above the characteristic
temperature for methyl group rotation as a result of the decreasing relative amount
of methyl groups ⟨u2⟩eff decreases with increasing chain length but more pronounced
than for the HATn materials.
Like for the HATn DLCs, in the liquid crystalline phase, ⟨u2⟩eff increases with increas-
ing n due to a release of this “self-organized” confinement with increasing chain length
136
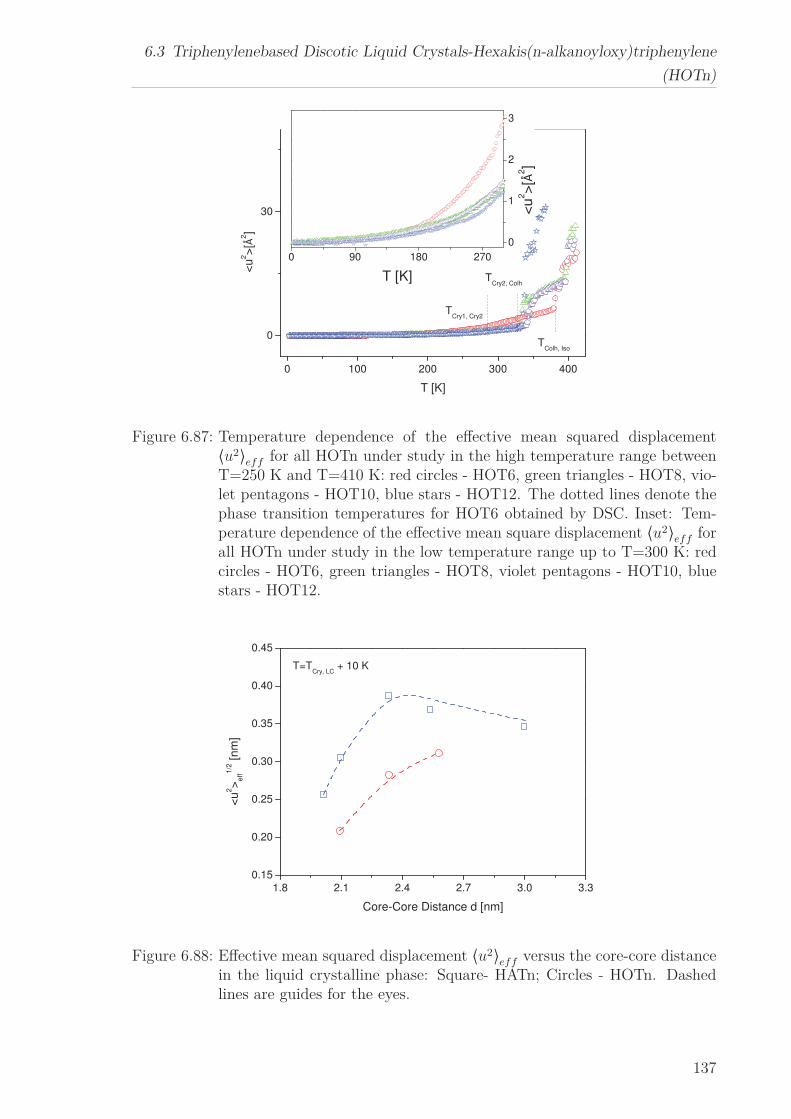
6.3 Triphenylenebased Discotic Liquid Crystals-Hexakis(n-alkanoyloxy)triphenylene
(HOTn)
0 100 200 300 400
0
30
0 90 180 270
0
1
2
3
TCry1, Cry2
TColh, Iso
TCry2, Colh
<u
2>
[2]
T [K]
<u
2>
[2]
T [K]
Figure 6.87: Temperature dependence of the effective mean squared displacement⟨u2⟩eff for all HOTn under study in the high temperature range betweenT=250 K and T=410 K: red circles - HOT6, green triangles - HOT8, vio-let pentagons - HOT10, blue stars - HOT12. The dotted lines denote thephase transition temperatures for HOT6 obtained by DSC. Inset: Tem-perature dependence of the effective mean square displacement ⟨u2⟩eff forall HOTn under study in the low temperature range up to T=300 K: redcircles - HOT6, green triangles - HOT8, violet pentagons - HOT10, bluestars - HOT12.
1.8 2.1 2.4 2.7 3.0 3.3
0.15
0.20
0.25
0.30
0.35
0.40
0.45
<u
2>
eff
1/2 [n
m]
Core-Core Distance d [nm]
T=TCry, LC
+ 10 K
Figure 6.88: Effective mean squared displacement ⟨u2⟩eff versus the core-core distancein the liquid crystalline phase: Square- HATn; Circles - HOTn. Dashedlines are guides for the eyes.
137
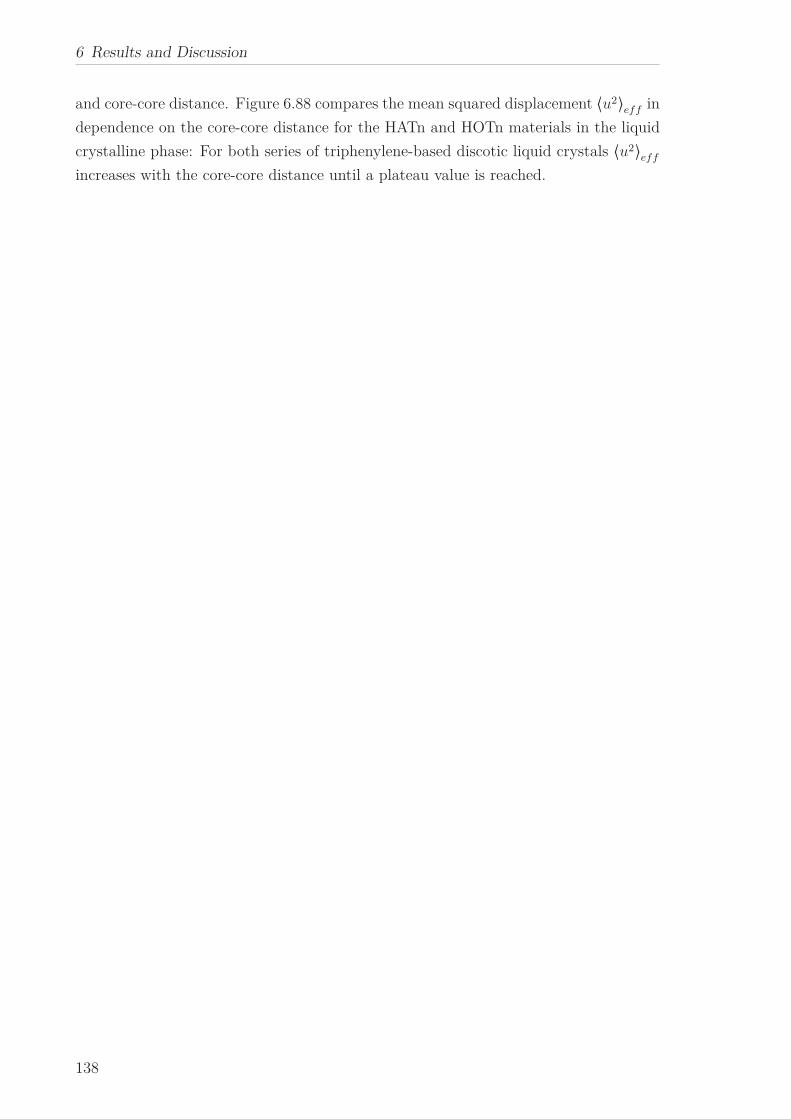
6 Results and Discussion
and core-core distance. Figure 6.88 compares the mean squared displacement ⟨u2⟩eff in
dependence on the core-core distance for the HATn and HOTn materials in the liquid
crystalline phase: For both series of triphenylene-based discotic liquid crystals ⟨u2⟩eff
increases with the core-core distance until a plateau value is reached.
138
7 Summary
In the course of this work, the structure and dynamics of several discotic liquid crys-
tals (DLCs) were investigated in detail. Different techniques (Differential Scanning
Calorimetry, X-ray Scattering, Dielectric Relaxation Spectroscopy, Specific Heat Spec-
troscopy, Neutron Scattering) were applied whereas each technique is sensitive to a
different probe. For selected DLCs the impact of nanoscale confinement on the phase
transitions and dynamics for two DLCs as an example was studied.
This thesis focusses on the structure as well as the dynamics of two series of triphenylene-
based discotic liquid crystals (Hexakis(n-alkyloxy)triphenylene (HATn materials) and
Hexakis(n-alkanoyloxy) triphenylene (HOTn materials) and one pyrene-based discotic
liquid crystal (Py4CEH).
An α-relaxation was observed for Py4CEH by dielectric relaxation spectroscopy. Two
different VFT dependencies with different Vogel temperatures and fragilities were found
for the plastic and the liquid crystalline phase in the dielectric data. The glassy dynam-
ics were evidenced by specific heat spectroscopy. Two different Vogel-Fulcher-Tammann
(VFT)-dependencies were obtained by the two different techniques as a result of the
different restrictions of the molecular fluctuations close to the columns (dielectric spec-
troscopy) and the groups located more in the intercolumnar space (specific heat spec-
troscopy). From the specific heat capacity data a correlation length for glassy dynamics
is calculated which correlates well with structural data.
For charge transport in the high temperature range different activation energies are
observed in the liquid crystalline and the isotropic phases.
When confined to anodic aluminum membranes with four different pore diameters d (d
= 25, 40, 80, 180 nm) for both phase transitions of Py4CEH the peak of the bulk tran-
sition splits up into two peaks. This indicates different phase structures in the pore
center and close to the wall. A decrease in the phase transition temperatures with
decreasing pores size was found for the phase in the pore center which was described
by means of the Gibbs-Thomson equation. The phase transition temperatures of the
phase close to the wall remains independent of the pore size. Furthermore, a decrease
in the transition enthalpies with decreasing pore sizes was found for both phase transi-
tions which implies an increase of confined disordered material which does not undergo
139
7 Summary
the phase transitions. A critical pore size for which the whole material inside the pores
is completely disordered was estimated to ca. 20 nm for both phase transitions.
In the dielectric measurements a peak is observed which corresponds to the α-relaxation
as also found for the bulk material. At the phase transition the temperature depen-
dence of the relaxation rates changes allowing to define and estimate a dielectric phase
transition temperature.
The structure and phase behavior of the HATn materials (n=5, 6, 8, 10, 12) in the
bulk state is studied by means of X-ray Scattering, Differential Scanning Calorimetry
(DSC). In the liquid crystalline phase, the scattering pattern for all materials shows
a sharp Bragg-reflection corresponding to the intercolumnar distance in the lower q-
range. In the higher q-range, a reflection corresponding to the stacking of the cores
within one column and a broad amorphous halo linked to the disordered structure of
the methylene groups in the side chains are observed. In the plastic crystalline phase
a similar structural arrangement is assumed, these alkyl chains form a nanophase sep-
arated state between the columns.
DSC measurements were carried out on HATn materials (n=5, 6, 10, 12) confined to
self-ordered alumina oxide membranes with different pore sizes. The influence of chain
length and confinement on the phase transitions is discussed in more detail: In con-
finement the two phase transitions between plastic crystalline and hexagonal ordered
phase at lower and from the latter to an isotropic state at higher temperatures are
also observed. Different phase structures close to the wall and in the pore center are
evidenced by additional peaks in the heat flow. The temperature of the former peaks
is independent of the pore size. However, the depression of the phase transition tem-
peratures of the latter ones can be described by the Gibbs-Thomson-equation for the
phase transition between the liquid crystalline phase for all HATn under study. With
decreasing pore size for both phase transitions the transition enthalpies decrease. This
implies an increase in the amount of disordered amorphous material inside the pore
which does not undergo the phase transition. The critical pore size dcri estimated for
phase transformation for the liquid crystalline to the isotropic phase from the pore
size dependence of the transition enthalpies for each material increases with increasing
chain length. By considering the difference in the dcri of the bulk-like phase in the
center of the pores and the dcri considering the complete amount of material undergo-
ing the phase transition, the thickness of the surface layer can be estimated. For the
thickness of the surface layer comparable values are obtained for all n under study.
The molecular dynamics of the bulk materials have been studied by means of dielectric
relaxation spectroscopy and neutron scattering.
All HATn under study exhibit a β-relaxation at low temperatures which is followed
by α-relaxation and a conductivity contribution in the high temperature range. The
140
relaxation rates of the β-relaxation are described by means of the Arrhenius equa-
tion. A self-organized confinement model, where the confinement is generated by the
columns to the intercolumnar space, where with increasing n the confinement is weak-
ened, was developed to describe the different processes. The chain length dependence
of the estimated activation energies is explained by a counterbalance between a release
of self-organized confinement and polyethylene-like behavior. The temperature depen-
dence of the α-relaxation rates changes with increasing n from an almost linear to a
VFT-like temperature dependence approaching the behavior observed for poylethylene.
In the case of the relaxation rate of HAT6 thhe temperature dependence is more com-
plicated and changes with increasing temperature from an Arrhenius-type temperature
dependence to a VFT-dependence to an Arrhenius-type temperature dependence.
For the HATn materials a Boson Peak (BP) is observed for n=5, 6, 10, 12. The BP
shifts to lower frequencies and gains in intensity with increasing lengths n of the side
chains. This is discussed employing the model of a self-organized confinement. The
peaks for n=10, 12 are much narrower than for n=5, 6 which might imply the transfor-
mation from a rigid system to a softer one with increasing chain length. In agreement
with the model of the self-organized confinement, the results can be also discussed in
the framework of a transition from uncorrelated to a correlated disorder with increasing
n where n=8 might be speculatively considered as a transitional state.
For HAT6 confined to the pores with three different pore diameters (d=25, 40, 80 nm)
a Boson Peak is observed under confinement. The BP which shifts to lower tempera-
tures and gains in intensity with decreasing pore size. This is explained by a decrease
of order in the material in the pores.
The structure and dynamics of HOTn materials (n=6, 8, 10, 12) is similar to the
HATn materials in some aspects and differs in others. A similar structure is obtained
by means of X-ray scattering and the intercolumnar distance increases linearly with
increasing n. However the data obtained by differential scanning calorimetry reveals
several plastic crystalline as well as liquid crystalline phases indicated by additional
peaks in the heat flow.
Conductivity and β-relaxation are observed for all HOTn under study, an α-relaxation
only for HOT6. The former are described by means of the Arrhenius equation yielding
similar results to HATn. For the α-relaxation of HOT6 the temperature dependence
of fmax,α changes from an Arrhenius to a VFT-behavior with decreasing temperature.
This result is explained under consideration of the structure of the DLC as well as the
Cooperativity approach to glassy dynamics.
All HOTn materials(n=6,8,10,12) exhibit a Boson Peak but with an additional contri-
bution at higher frequencies. The former seems to increase in intensity and shift to
lower frequencies whereas the latter shows no clear dependence on the chain length.
141
7 Summary
Elastic scans were carried out for all HATn and HOTn materials under study in the
bulk as well as for HAT6 confined to three different pore sizes to monitor the molecular
dynamics on a time scale of nanoseconds.
142
8 Publications
8.1 List of Peer-Reviewed Publications
1. C. Krause, H. Yin, C. Cerclier, D. Morineau, A. Wurm, C. Schick, F. Emmerling
and A. Schönhals, Molecular Dynamics of a Discotic Liquid Crystal Investigated
by a Combination of Dielectric Relaxation and Specific Heat Spectroscopy, Soft
Matter, 2012, 8, 11115-11122
2. C. Krause and A. Schönhals, Phase Transitions and Molecular Mobility of a
Discotic Liquid Crystal under Nanoscale Confinement, The Journal of Physical
Chemistry C, 2013, 117, 19712-19720
3. C. Krause, R. Zorn, F. Emmerling, B. Frick, P. Huber, J. Falkenhagen, and A.
Schönhals, Vibrational Density of States of Triphenylene Based Discotic Liquid
Crystals: Dependence on the Length of the Alkyl Chain, Physical Chemistry
Chemical Physics, 2014, 16, 7324-7333
4. C. Krause, R. Zorn, B. Frick and A. Schönhals, Thermal Properties and Vibra-
tional Density of States of a Nanoconfined Discotic Liquid Crystal, Colloid and
Polymer Science, 2014, 292, 1949-1960
5. C. Krause, R. Zorn, B. Frick and A. Schönhals, Quasi-elastic and Inelastic Scat-
tering to Investigate the Molecular Dynamics of Discotic Molecules in the Bulk,
QENSWINS2014 proceedings, accepted
6. A. V. Kityk, M. Busch, D. Rau, S. Calus, C. V. Cerclier, R. Lefort, D. Morineau,
E. Grelet, C. Krause, A. Schönhals, B. Frick and P. Huber, Thermotropic Orienta-
tional Order of Discotic Liquid Crystals in Nanochannels: an optical Polarimetry
Study and a Landau-de Gennes Analysis, Soft Matter, 2014, 10, 4522-4534
143
8 Publications
8.2 List of Talks
1. C. Krause, H. Yin, A. Wurm, C. Schick and A. Schönhals, Molecular Dynamics
of a Discotic Liquid Crystal Studied by Dielectric Relaxation and Specific Heat
Spectroscopy, DPG-Frühjahrstagung der Sektion Kondensierte Materie (SKM),
Regensburg, March 2013
2. C. Krause, H. Yin, A. Wurm, C. Schick and A. Schönhals, Glassy-Like Dynamics
in a Discotic Liquid Crystal Revealed by Broadband Dielectric and Specific Heat
Spectroscopy, 7th. Int. Discussion Meeting on Relaxations in Complex Systems,
Barcelona, Spain, July 2013
8.3 List of Posters
1. C. Krause, H. Yin and Andreas Schönhals, Investigation of Discotic Liquid Crys-
tals, DPG Frühjahrstagung der Sektion AMOP (SAMOP) und der Sektion Kon-
densierte Materie (SKM), Dresden, March 2011
2. C. Krause, B. Frick, R. Zorn and A. Schönhals, Neutron Scattering on Discotic
Liquid Crystals in the Bulk and in the Nanoconfined State, DPG-Frühjahrstagung
der Sektion Kondensierte Materie (SKM), Berlin, March 2012
3. Christina Krause, Huajie Yin and Andreas Schönhals, Glassy dynamics in Pyrene-
1,3,6,8-tetracarboxylic tetra(2-ethylhexyl)esther studied by Differential Alternat-
ing Current Chip Calorimetry and Dielectric Relaxation spectroscopy, DPG-
Frühjahrstagung der Sektion Kondensierte Materie (SKM), Berlin, March 2012
4. C. Krause, F. Emmerling and A. Schönhals, Triphenylene-Based Discotic Liquid
Crystals, 7th BDS/IDS Conference, Leipzig, September 2012
5. C. Krause, H. Yin, A. Wurm, C. Schick and A. Schönhals, Molecular Dynamics
of a Discotic Liquid Crystal, 7th BDS/IDS Conference, Leipzig, September 2012
6. Christina Krause, Huajie Yin and Andreas Schönhals, Vibrational Density of
States and Molecular Dynamics of Discotic Liquid Crystals in the Bulk and in the
Nanoconfined State Investigated by Neutron Scattering, DPG-Frühjahrstagung
der Sektion Kondensierte Materie (SKM), Regensburg, March 2013
144
9 List of Abbreviations, Symbols and
Constants
List of Abbreviations
Al AluminumCC Cole/Cole functionCD Cole/Davidson functionCRR Cooperatively Rearranging RegionDLC Discotic Liquid CrystalDRS Dielectric Relaxation SpectroscopyDSC Differential Scanning CalorimetryHATn Hexakis(n-alkyloxy)triphenyleneHN Havriliak-Negami EquationHOTn Hexakis(n-alkanoyloxy)triphenyleneKWW Kohlrausch-Williams-Watts EquationLC Liquid CrystalNS Neutron ScatteringMW Molecular WeightPy4CEH Pyrene-1,3,6,8-tetracarboxylictetra(2-ethylhexyl)esterSHS Specific Heat SpectroscopyTGA Thermogravimetric AnalysisVDOS Vibrational Density of StatesVFT Vogel-Fulcher-Tammann Equation
145
9 List of Abbreviations, Symbols and Constants
List of Symbols
cp Specific Heat Capacityd Pore diameterdCC Core-Core DistanceEA Activation EnergyC CapacitanceE Electric Field∆E Energy Transfer∆ǫ Dielectric Strengthǫ∗ Complex Dielectric Functionǫ′; ǫ′′
Real and Imaginary Part of the Complex Dielectric Functionf Frequencyfmax,α; fmax,β; fmax, Relaxation rates for α-relaxation, β-relaxation and conductivityIel; I0 Elastically Scattered Intensity and Low Temperature Limit of
the Elastically Scattered Intensityki; lf Incident and Final Wave Vectors of the Neutron Beam⟨u2⟩eff Mean Squared Displacement
λ wavelengthM Complex ModulusM
′; M
′′Real and Imaginary Part of the Complex Modulus
P Polarizationq Scattering Transfer VectorS Scattering Functionσ Scattering Cross SectionTg Glass Transition TemperatureTg Vogel Temperatureτ Relaxation TimeΩ Space Angle of Detectionω Angular Frequencyη Viscosityζ Cooperative Length of a CRR
List of Constants
kB Boltzmann ConstantR Ideal Gas Constant (R=8.314 Jmol−1K)ǫ0 Dielectric Permittivity Constant in Vacuum (ǫ0 = 8.854 ∗ 10−12AsV−1K)NA Avogadro Number (NA = 6.022 ∗ 1023mol−1)
146
Bibliography
Bibliography
[1] Fischbach, I., Pakula, T., Minkin, P., Fechtenkötter, A., Müllen, K., Spiess,
H. W., and Saalwächter, K. The Journal of Physical Chemistry B 106(25),
6408–6418 (2002).
[2] Laschat, S., Baro, A., Steinke, N., Giesselmann, F., Hägele, C., Scalia, G., Judele,
R., Kapatsina, E., Sauer, S., Schreivogel, A., and Tosoni, M. Angewandte Chemie
International Edition 46(26), 4832–4887 (2007).
[3] T. J. Sluckin, D. A. Dunmur, H. S., editor. Crystals that flow: Classic papers
from the history of liquid crystals. Taylor&Francis, London, (2004).
[4] Billard, J., Dubois, J. C., Huutinh, N., and Zann, A. Nouv. J. Chim. 2, 535–540
(1978).
[5] Levelut, A. M. J. Phys. Lett. 40, L81–L84 (1979).
[6] Kremer, F. and Schönhals, A., editors. Broadband Dielectric Spectroscopy.
Springer, (2002).
[7] Luigi Nordio, P., Rigatti, G., and Segre, U. Molecular Physics 25(1), 129–136
(1973).
[8] Araki, K., Attard, G. S., Kozak, A., Williams, G., Gray, G. W., Lacey, D., and
Nestor, G. J. Chem. Soc.,Faraday Trans. 2 84, 1067–1081 (1988).
[9] Tasios, N., Grigoriadis, C., Hansen, M. R., Wonneberger, H., Li, C., Spiess,
H. W., Müllen, K., and Floudas, G. Journal of the American Chemical Society
132(21), 7478–7487 (2010).
[10] Elmahdy, M. M., Floudas, G., Mondeshki, M., Spiess, H. W., Dou, X., and
Müllen, K. Phys. Rev. Lett. 100, 107801 Mar (2008).
[11] Kremer, F. and Schönhals, A., editors. Broadband Dielectric Spectroscopy.
Springer, Berlin, (2003).
[12] Anderson, P. W. Science 267, 1615 (1995).
147
Bibliography
[13] Angell, C. A. Proc Natl Acad Sci U S A 92(15), 6675–6682 Jul (1995).
[14] Angell, C. A. Science 267(5206), 1924–1935 Mar (1995).
[15] Ediger, M. D. Annu Rev Phys Chem 51, 99–128 (2000).
[16] Sangoro, J. R. Rotational and Translational Diffusion in Ionic Liquids. PhD
thesis, Universität Leipzig, (2009).
[17] Angell, C. A. Chem Rev 102(8), 2627–2650 Aug (2002).
[18] Angell, C. Relaxations in Complex Systems, chapter "Strong and fragile liquids",
3–11. U.S. GPO, Washington, D.C. (1985).
[19] Dyre, J. C. Rev. Mod. Phys. 78(3) (2006).
[20] H, S. and S, S. J Non-Cryst Solids 16, 171–194 (1974).
[21] Brás, A. R., Dionísio, M., Huth, H., Schick, C., and Schönhals, A. Phys. Rev. E
75, 061708 Jun (2007).
[22] Vogel, H. Phys. Zeit 22, 645–646 (1921).
[23] Tammann, G. and Hesse, W. Zeitschrift für anorganische und allgemeine Chemie
156(1), 245–257 (1926).
[24] Fulcher, G. S. Journal of the American Ceramic Society 8(6), 339–355 (1925).
[25] Avramov, I. Journal of Non-Crystalline Solids 351, 3163–3173 (2005).
[26] Glarum, S. J Chem Phys 33(5), 1371–1375 (1960).
[27] Bendler, J. T., Fontanella, J. J., Shlesinger, M. F., and Wintersgill, M. C. AIP
Conf Proc 982(1), 215–218 (February 2008).
[28] Donth, E., Huth, H., and Beiner, M. Journal of Physics: Condensed Matter
13(22), L451 (2001).
[29] Adam, G. and Gibbs, J. H. The Journal of Chemical Physics 43(1), 139–146
(1965).
[30] Donth, E., Hempel, E., and Schick, C. Journal of Physics: Condensed Matter
12(16), L281 (2000).
[31] Saiter, A., Delbreilh, L., Couderc, H., Arabeche, K., Schönhals, A., and Saiter,
J.-M. Phys. Rev. E 81, 041805 Apr (2010).
[32] Berthier, L., Biroli, G., Bouchaud, J.-P., Cipelletti, L., Masri, D. E., L’Hôte, D.,
Ladieu, F., and Pierno, M. Science 310(5755), 1797–1800 (2005).
148
Bibliography
[33] Yildirim, Z., Wübbenhorst, M., Mendes, E., Picken, S. J., Paraschiv, I., Marcelis,
A. T., Zuilhof, H., and Sudhölter, E. J. Journal of Non-Crystalline Solids 351,
2622 – 2628 (2005). Proceedings of 3rd International Conference on Broadband
Dielectric Spectroscopy and its Applications.
[34] Schönhals, A., Goering, H., Costa, F. R., Wagenknecht, U., and Heinrich, G.
Macromolecules 42(12), 4165–4174 (2009).
[35] van den Berg, O., Sengers, W. G. F., Jager, W. F., Picken, S. J., and Wübben-
horst, M. Macromolecules 37(7), 2460–2470 (2004).
[36] Johari, G. P. and Goldstein, M. J. Chem. Phys. 53, 2372 (1970).
[37] Rivera, A. and Rössler, E. A. Phys. Rev. B 73, 212201 (2006).
[38] Krause, C., Sangoro, J. R., Iacob, C., and Kremer, F. J. Phys. Chem. B 114,
382–386 (2010).
[39] Zallen, R. The physics of amorphous solids. Wiley, New York, (1983).
[40] Angell, C. A. J. Res. Natl. Inst. Stand. Technol. 102, 171 (1997).
[41] Schirmacher, W., Schmid, B., Tomaras, C., Viliani, G., Baldi, G., Ruocco, G.,
and Scopigno, T. physica status solidi (c) 5, 862–866 (2008).
[42] Hong, L., Novikov, V. N., and Sokolov, A. P. J. Non-Cryst. Solids 90, 485–488
(1987).
[43] Zorn, R., Mayorova, M., Richter, D., Schönhals, A., Hartmann, L., Kremer, F.,
and Frick, B. AIP Conf Proc 982, 79–84 (2008).
[44] Zorn, R., Hartmann, L., Frick, B., Richter, D., and Kremer, F. J Non-Cryst
Solids 307, 547–554 (2002).
[45] Asthalter, T., Bauer, M., van Bürck, U., Sergueev, I., Franz, H., and Chumakov,
A. I. Eur. Phys. J. E.. 12, S9 (2003).
[46] Schönhals, A., Göring, H., Schick, C., Frick, B., and Zorn, R. Colloid Polym Sci
282, 882–892 (2004).
[47] Schönhals, A., Frunza, S., Frunza, L., Unruh, T., Frick, B., and Zorn, R. Eur.
Phys. J. Spec. Top. 189, 251 (2010).
[48] Schönhals, A., Zorn, R., and Frick, B. in preparation.
[49] Steinhart, M., Zimmermann, S., Göring, P., Schaper, A. K., Gösele, U., Weder,
C., and Wendorff, J. H. Nano Letters 5(3), 429–434 (2005). PMID: 15755089.
149
Bibliography
[50] Takami, S., Shirai, Y., Wakayama, Y., and Chikyow, T. Thin Solid Films 516(9),
2438 – 2442 (2008). The 7th International Conference on Nano-Molecular Elec-
tronics (ICNME 2006.
[51] Vallerien, S. U., Werth, M., Kremer, F., and Spiess, H. W. Liquid Crystals 8(6),
889–893 (1990).
[52] Groothues, H., Kremer, F., Collard, D. M., and Lillya, C. P. Liquid Crystals
18(1), 117–121 (1995).
[53] Groothues, H., Kremer, F., Collard, D. M., and Lillya, C. P. Liquid Crystals
18(1), 117–121 (1995).
[54] Elmahdy, M. M., Dou, X., Mondeshki, M., Floudas, G., Butt, H.-J., Spiess,
H. W., and Müllen, K. Journal of the American Chemical Society 130(15),
5311–5319 (2008). PMID: 18324768.
[55] Kruglova, O., Mendes, E., Yildirim, Z., Wübbenhorst, M., Mulder, F. M., Stride,
J. A., Picken, S. J., and Kearley, G. J. ChemPhysChem 8, 1338–1344 (2007).
[56] De Cupere, V., Tant, J., Viville, P., Lazzaroni, R., Osikowicz, W., Salaneck,
W. R., and Geerts, Y. H. Langmuir 22(18), 7798–7806 (2006). PMID: 16922566.
[57] Schmidt-Mende, L., Fechtenkötter, A., Müllen, K., Moons, E., Friend, R. H., and
MacKenzie, J. D. Science 293(5532), 1119–1122 (2001).
[58] Rengarajan, Gopalakrishnan T.; Enke, D. B. M. The Open Physical Chemistry
Journal 1, 18–24 (2007).
[59] Rengarajan, G. T., Enke, D., Steinhart, M., and Beiner, M. J. Mater. Chem.
18, 2537–2539 (2008).
[60] Rengarajan, G. T., Enke, D., Steinhart, M., and Beiner, M. Phys. Chem. Chem.
Phys. 13, 21367–21374 (2011).
[61] Beiner, M. Journal of Polymer Science Part B: Polymer Physics 46(15), 1556–
1561 (2008).
[62] Beiner, M., Rengarajan, Pankaj, S., Enke, D., and Steinhart, M. Nano Letters
7(5), 1381–1385 (2007).
[63] Prasad, B. R. and Lele, S. Philosophical Magazine Letters 70(6), 357–361 (1994).
[64] Jackson, C. L. and McKenna, G. B. Chemistry of Materials 8(8), 2128–2137
(1996).
150
Bibliography
[65] Alcoutlabi, M. and McKenna, G. B. Journal of Physics: Condensed Matter
17(15), R461 (2005).
[66] Stillings, C., Martin, E., Steinhart, M., Pettau, R., Paraknowitsch, J., Geuss,
M., Schmidt, J., Germano, G., Schmidt, H.-W., Gösele, U., and Wendorff, J. H.
Molecular Crystals and Liquid Crystals 495(1), 285/[637]–293/[645] (2008).
[67] Stillings, C., Pettau, R., Wendorff, J. H., Schmidt, H.-W., and Kreger, K. Macro-
molecular Chemistry and Physics 211(2), 250–258 (2010).
[68] Kopitzke, J., Wendorff, J. H., and Glüsen, B. Liquid Crystals 27(5), 643–648
(2000).
[69] Frunza, L., Frunza, S., Kosslick, H., and Schönhals, A. Phys. Rev. E 78, 051701
Nov (2008).
[70] Frunza, S., Frunza, L., Schönhals, A., Zubowa, H.-L., Kosslick, H., Carius, H.-E.,
and Fricke, R. Chemical Physics Letters 307, 167–176 (1999).
[71] Frunza, S., Frunza, L., Goering, H., Sturm, H., and Schönhals, A. EPL (Euro-
physics Letters) 56(6), 801 (2001).
[72] Frunza, L., Kosslick, H., Frunza, S., and Schönhals, A. Microporous and Meso-
porous Materials 90, 259 – 270 (2006).
[73] Grigoriadis, C., Duran, H., Steinhart, M., Kappl, M., Butt, H.-J., and Floudas,
G. ACS Nano 5(11), 9208–9215 (2011).
[74] Ha, J.-M., Hillmyer, M. A., and Ward, M. D. The Journal of Physical Chemistry
B 109(4), 1392–1399 (2005).
[75] Van Oss, C. J., Chaudhury, M. K., and Good, R. J. Chemical Reviews 88(6),
927–941 (1988).
[76] Yin, H. and Schönhals, A. Soft Matter 8, 9132–9139 (2012).
[77] Kityk, A. V., Busch, M., Rau, D., Calus, S., Cerclier, C. V., Lefort, R., Morineau,
D., Grelet, E., Krause, C., Schönhals, A., Frick, B., and Huber, P. Soft Matter
10, 4522–4534 (2014).
[78] Hassheider, T., Benning, S. A., Kitzerow, H.-S., Achard, M.-F., and Bock, H.
Angewandte Chemie International Edition 40(11), 2060–2063 (2001).
[79] Lee, W., Ji, R., Gösele, U., and Nielsch, K. Nat Mater 5(9), 741–747 Sep (2006).
[80] Havriliak, S. and Negami, S. Journal of Polymer Science Part C: Polymer Sym-
posia 14(1), 99–117 (1966).
151
Bibliography
[81] Huth, H., Minakov, A. A., and Schick, C. Journal of Polymer Science Part B:
Polymer Physics 44(20), 2996–3005 (2006).
[82] Gobrecht, H., Hamann, K., and Willers, G. Journal of Physics E: Scientific
Instruments 4(1), 21 (1971).
[83] Birge, N. O. and Nagel, S. R. Phys. Rev. Lett. 54, 2674–2677 Jun (1985).
[84] Schawe, J. Thermochimica Acta 260(0), 1 – 16 (1995).
[85] van Herwaarden, A. Thermochimica Acta 432(2), 192 – 201 (2005). Thermody-
namics and calorimetry of thin films: Papers presented at the 8th Lähnwitzsem-
inar on Calorimetry.
[86] Huth, H., Minakov, A. A., Serghei, A., Kremer, F., and Schick, C. The European
Physical Journal Special Topics 141(1), 153–160 (2007).
[87] Merzlyakov, M. and Schick, C. Thermochimica Acta 380(1), 5 – 12 (2001).
[88] Weyer, S., Hensel, A., and Schick, C. Thermochimica Acta 304 - 305, 267 – 275
(1997).
[89] S.Cheng, editor. Handbook of Thermal Analysis and Calorimetry, volume 3.
Elsevier, (2001).
[90] www.xensor.nl/pdffiles/sheets/nanogas3939.pdf.
[91] Zhou, D., Huth, H., Gao, Y., Xue, G., and Schick, C. Macromolecules 41(20),
7662–7666 (2008).
[92] Glatter, O. and Kratky, O. Small Angle X-ray Scattering. Academic press,
London, (1982).
[93] Paris, O., Li, C., Siegel, S., Weseloh, G., Emmerling, F., Riesemeier, H., Erko,
A., and Fratzl, P. J. Appl. Crystallogr 40, S466 (2007).
[94] Hammersley, A. P., Svensson, S. O., Hanfland, M., Fitch, A. N., and Hausermann,
D. High Pressure Res 14, 235 (1996).
[95] Grelet, E., Dardel, S., Bock, H., Goldmann, M., Lacaze, E., and Nallet, F. Eur.
Phys. J. E 31, 343 (2010).
[96] http://www.ill.eu/instruments-support/computing-for-science/cs-software/all-
software/tofhr/inx/.
[97] www.ill.eu.
152
Bibliography
[98] Lovesey, S. Theory of Neutron Scattering from Condensed Matter, volume 1.
Oxford University, New York, (1987).
[99] Krause, C., Yin, H., Cerclier, C., Morineau, D., Wurm, A., Schick, C., Emmer-
ling, F., and Schönhals, A. Soft Matter 8, 11115–11122 (2012).
[100] Glüsen, B., Kettner, A., Kopitzke, J., and Wendorff, J. Journal of Non-
Crystalline Solids 241, 113 – 120 (1998).
[101] Beiner, M. and Huth, H. Nat Mater 2(9), 595–599 September (2003).
[102] Schönhals, A., Goering, H., Schick, C., Frick, B., and Zorn, R. Journal of Non-
Crystalline Solids 351(33 - 36), 2668 – 2677 (2005).
[103] Schönhals, A., Goering, H., Schick, C., Frick, B., and Zorn, R. The European
Physical Journal E 12(1), 173–178 (2003).
[104] Gorbatschow, W., Arndt, M., Stannarius, R., and Kremer, F. EPL (Europhysics
Letters) 35(9), 719 (1996).
[105] Cerclier, C. V., Ndao, M., Busselez, R., Lefort, R., Grelet, E., Huber, P., Kityk,
A. V., Noirez, L., Schönhals, A., and Morineau, D. The Journal of Physical
Chemistry C 116(35), 18990–18998 (2012).
[106] Dyre, J. C. Journal of Physics C: Solid State Physics 19(28), 5655 (1986).
[107] Yelon, A., Movaghar, B., and Branz, H. M. Phys. Rev. B 46, 12244–12250 Nov
(1992).
[108] Schönhals, A., Wolff, D., and Springer, J. Macromolecules 28(18), 6254–6257
(1995).
[109] Schönhals, A., Wolff, D., and Springer, J. Polymers for Advanced Technologies
7(11), 853–857 (1996).
[110] Destrade, C., M. Mondon, C., and Malthete, J. J. Phys. Colloques 40, C3–17
(1979).
[111] Strobl, G. R. The Physics of Polymers-Concepts for Understanding Their Struc-
tures and Behavior. Springer, (2007).
[112] Purohit, P. J., Wang, D. Y., Emmerling, F., Thünemann, A. F., Heinrich, G.,
and Schönhals, A. Polymer 53, 2245 (2012).
[113] Spaar, A. and Salditt, T. Biophys J 85, 1576 (2003).
[114] Warren, B. E. Phys. Rev. 44, 969 (1933).
153
Bibliography
[115] Narros, Arbe, A., Alvarez, F., Colmenero, J., Zorn, R., Schweika, W., and
Richter, D. Macromolecules 38, 9847 (2005).
[116] Wang, T., Yan, D., Luo, J., Zhou, E., Karthaus, O., and Ringsdorf, H. Liquid
Crystals 23, 869 (1997).
[117] Bushby, R. J., Boden, N., Kilner, C. A., Lozman, O. R., Lu, Z., Liu, Q., and
Thornton-Pett, M. A. J. Mater. Chem. 13, 470–474 (2003).
[118] Andresen, T. L., Krebs, F. C., Thorup, N., and Bechgaard, K. Chem. Mater.
12, 2428 (2000).
[119] Beiner, M., Schröter, K., Hempel, E., Reissig, S., and Donth, E. Macromolecules
32, 6278 (1999).
[120] Krause, C. and Schönhals, A. J Phys Chem C 117, 19712?19720 (2013).
[121] Malinovsky, V. K. and Surovtsev, N. V. phys stat sol (c) 1, 2900–2903 (2004).
[122] Morineau, D. private communication.
[123] Krause, C., Zorn, R., Emmerling, F., Frick, B., Huber, P., Falkenhagen, J., and
Schönhals, A. Physical Chemistry Chemical Physics 16, 7324–7333 (2014).
[124] Jin, Y. and Boyd, R. H. J. Chem. Phys. 108, 9912 (1998).
[125] Schönhals, A., Göring, H., Schick, C., Frick, B., Mayorova, M., and Zorn, R.
Eur. Phys. J. Spec. Top. 141, 255 (2007).
[126] Turky, G., Wolff, D., and Schönhals, A. Macromol. Chem. Phys. 213, 2420–2431
(2012).
[127] Kanaya, T., Kaji, K., Ikeda, S., and Inoue, K. Chemical Physics Letters 150,
334–338. (1988).
[128] Cicerone, M. T. and Soles, C. L. Biophysical journal 86, 3836 (2004).
[129] SW, L. Theory of Neutron Scattering from Condensed Matter, volume 1. Oxford
University, New York, (1987).
[130] Zorn, R. Nucl. Instr. Meth. A 603, 439 (2009).
[131] Zorn, R., Frick, B., and Fetters, L. J. The Journal of Chemical Physics 116, 845
(2002).
[132] Wilms, D., Winkler, A., Virnau, P., and Binder, K. Phys. Rev. Lett. 105, 045701
(2010).
154
Bibliography
[133] Chiang, L. Y., Stokes, J. P., Safinya, C. R., and Bloch, A. N. Molecular Crystals
and Liquid Crystals 125(1), 279–288 (1985).
[134] Wuttke, J., Hernandez, J., Li, G., Coddens, G., Cummins, H. Z., Fujara, F.,
Petry, W., and Sillescu, H. Phys. Rev. Lett. 72, 3052–3055 May (1994).
[135] Cummins, H., Li, G., Hwang, Y., Shen, G., Du, W., Hernandez, J., and Tao, N.
Zeitschrift für Physik B Condensed Matter , 103, 501–519 (1997).
[136] Rössler, E., Novikov, V. N., and Sokolov, A. P. Phase Transitions 63(1-4), 201–
233 (1997).
[137] Steffen, W., Patkowski, A., Gläser, H., Meier, G., and Fischer, E. W. Phys. Rev.
E 49, 2992–3002 Apr (1994).
155
List of Figures
List of Figures
4.1 Different Phases of liquid crystals . . . . . . . . . . . . . . . . . . . . . . . 16
4.2 Discotic liquid crystals in the columnar phase . . . . . . . . . . . . . . . . 16
4.3 Overview on the dynamics ocurring at the glass transition. a) Dielectric
loss ǫ′′
versus frequencies for two different temperatures T1 and T2 b) Re-
laxation map (maximum frequency versus inverse temperature) for the
different processes c) specific heat capacity cp versus inverse temperature
(thermal glass transition). Adapted from [6]. . . . . . . . . . . . . . . . . 21
4.4 Vibrational density of states of poly(methylphenylsiloxane) (PMPS) in
the bulk and confined to Sol/Gel-Glasses with different pore sizes as
indicated taken at T=80 K at IN6. Taken from [48]. . . . . . . . . . . . 26
4.5 Vibrational density of states of the nematic liquid crystal E7 in the bulk
and confined to a molecular sieve (MCM) with a pore size of 2.5 nm.
Taken from [47]. . . . . . . . . . . . . . . . . . . . . . . . . . . . . . . . . . 26
5.1 Chemical structure of Py4CEH . . . . . . . . . . . . . . . . . . . . . . . . 29
5.2 Chemical structure of Hexakis(n-alkyloxy)triphenylene HATn. The length
n of the side chains is varied: n=5, 6, 8, 10, 12. . . . . . . . . . . . . . . . 30
5.3 Chemical structure of Hexakis(n-alkanoyloxy)triphenylene HOTn. The
length n of the side chains is varied: n=6, 8, 10, 12. . . . . . . . . . . . . 30
5.4 MALDI-TOF spectrum of HAT6 (C54H84O6). The spectra were col-
lected employing a Bruker Autoflex III (Bruker Daltonik GmbH, Bre-
men, Germany) spectrometer equipped with a SmartbeamT M laser (356
nm, frequency 200 Hz). . . . . . . . . . . . . . . . . . . . . . . . . . . . . . 31
5.5 Electron microscopy (REM) pictures (Zeiss Gemini Supra 40 courtesy
to BAM 6.4) of Smart Membranes with a pore size of (a) 25 nm, (b) 180
nm (c) 180 nm breaking edge. . . . . . . . . . . . . . . . . . . . . . . . . . 32
5.6 TG-curve of a) HAT6 in the bulk state b) Anopore Membrane (pore size
100 nm) filled with HAT6 (filling time of 24 hours at 393 K) . . . . . . . 33
5.7 Final weight loss in dependence on filling time for Anopore Membranes
(filling temperature 393 K, filling material HAT6) with different pore
sizes as indicated. . . . . . . . . . . . . . . . . . . . . . . . . . . . . . . . . 34
156
List of Figures
5.8 Electron microscopy (REM) pictures (Zeiss Gemini Supra 40 courtesy
to BAM 6.4) of a Smart Membrane with a pore size of 180 nm filled
with HAT6 breaking edge. . . . . . . . . . . . . . . . . . . . . . . . . . . . 34
5.9 Measurement techniques applied in the frequency range from 10−6 Hz to
1015 Hz. Taken from [11] . . . . . . . . . . . . . . . . . . . . . . . . . . . . 37
5.10 Real ǫ′ and imaginary part ǫ′′ of the complex dielectric function ǫ∗ in
dependence on frequency. . . . . . . . . . . . . . . . . . . . . . . . . . . . . 38
5.11 Scheme of the scattering process due to interaction of radiation with the
sample. . . . . . . . . . . . . . . . . . . . . . . . . . . . . . . . . . . . . . . . 43
5.12 The Time of Flight spectrometer IN6, picture taken from [97] . . . . . . 47
5.13 IN6 spectra of HAT6 in the bulk normalized to the height of the elastic
peak (averaged over the detector range 54...108, corresponding to a q
range of 1.1...2.0 A−1 for elastic scattering): open squares - HAT6 in
the bulk at T=80 K; open circles correspond to a measurement at 2K
representing the instrumental resolution. . . . . . . . . . . . . . . . . . . . 47
5.14 The Neutron Backscattering spectrometer IN10, picture taken from [97] 48
6.1 DSC thermogram of Py4CEH during cooling (dashed line) and heating
(solid line) with a cooling/heating rate of 10 K/min. The inset enlarges
the temperature range between 120 K and 210 K. . . . . . . . . . . . . . 51
6.2 Dielectric loss of Py4CEH in dependence on frequency and temperature
during cooling. Taken from own publication [99]. . . . . . . . . . . . . . . 53
6.3 Dielectric loss in dependence on frequency at different temperatures
(T=331 K (downward triangles), 303 K (pentagrams), 255 K squares),
233 K (circles), 221 K (upward triangles), 207 K (stars), 185 K (right tri-
angles)). Lines denote fits by the Havriliak-Negami equation to the cor-
responding data. Inset: Imaginary Part of the complex modulus M′′
at
different temperatures (353 K (squares), 357 K(circles), 361 K (upward
triangles), 365 K (downward triangles), 369 K (stars), 373 K(pentagons)) 54
6.4 Relaxation map of Py4CEH: stars (dielectric β-relaxation), circles (di-
electric α-relaxation), squares (conductivity). The dashed-dotted line
represents the α-relaxation of Polyethylene ([35]). The figure is taken
from own publication.[99] . . . . . . . . . . . . . . . . . . . . . . . . . . . . 54
157
List of Figures
6.5 (d log fmax
dT)−1/2
vs. temperature for the data of the α-relaxation of Py4CEH
in the crystalline as well as the columnar hexagonal liquid crystalline
phase - circles. The solid and the dashed lines are linear regressions to
the corresponding dielectric data in the different regions. T0 (arrows)
denote the estimated Vogel-temperatures. The dotted vertical line indi-
cates the phase transition temperature taken from DSC measurements
with a cooling rate of 10 K min−1. Taken from own publication.[99] . . 56
6.6 Temperature dependence of the dielectric strength ∆ǫα for heating (open
circles) and cooling (open triangles) for the α-relaxation. The dashed
lines are guides for the eyes. The dashed-dotted vertical lines indicate
the phase transition temperatures measured for heating and cooling by
DSC. The inset: dielectric strength ∆ǫβ for the β-relaxation. The line
is a guide for the eyes. . . . . . . . . . . . . . . . . . . . . . . . . . . . . . . 57
6.7 Real part C′p (open squares) and corrected phase angle dcorr (open cir-
cles) of the complex heat capacity versus temperature at f = 1.499×10⁻²
Hz of a TMDSC measurement. The solid line is a fit of a Gaussian to
the data of the phase angle to estimate its maximum position. The
width of the glass transition is taken from the variance of the Gaus-
sian. Inset: Normalized amplitude of the complex differential voltage
ofPy4CEH for heating at different frequencies: open stars=720 Hz, open
diamonds=560 Hz, open squares=360 Hz. Dashed-dotted vertical lines
denote the corresponding dynamic glass transition temperatures (half-
step height). . . . . . . . . . . . . . . . . . . . . . . . . . . . . . . . . . . . . 58
6.8 Temperature dependence of the α-relaxation, obtained by dielectric re-
laxation spectroscopy (circles) and by specific heat spectroscopy (trian-
gles). Dashed lines are fits of the VFT-equation (4.3) to the different
branches of the dielectric α-relaxation and to the specific heat spec-
troscopy data. The dashed-dotted line denotes data of the dielectric
α-relaxation of polyethylene (PE) taken from reference [35]. . . . . . . . 59
158
List of Figures
6.9 (d log fmax
dT)−1/2
vs. temperature for the data of the α-relaxation presented
in Figure 6.8 of Py4CEH in the crystalline as well as the columnar hexag-
onal liquid crystalline phase: circles - dielectric data; triangles - thermal
data. The solid and the dashed lines are linear regressions to the cor-
responding dielectric data in the different regions. The dashed dotted
line corresponds to the derivative of the dielectric relaxation rate of
polyethylene taken from reference [35]. T0 -arrows denote the estimated
Vogel-temperatures. The dotted vertical line indicates the phase transi-
tion temperature taken from DSC measurements with a cooling rate of
10 K min−1. Please note that the effective cooling rate for the dielectric
measurements is ca. two decades lower. . . . . . . . . . . . . . . . . . . . 60
6.10 X-ray diffractogram in the small angle range (SAXS) of Py4CEH at
T=303 K. Taken from own publication [99]. . . . . . . . . . . . . . . . . . 62
6.11 DSC Thermograms of bulk Py4CEH and Py4CEH located inside self-
ordered AAO membranes with different pore diameters as indicated
(Heating rate 10 K/min, second heating scan). The dashed lines in-
dicate the phase transitions of the bulk. . . . . . . . . . . . . . . . . . . . 64
6.12 Phase transition temperatures between the plastic crystalline and the
liquid crystalline phase versus inverse pore size as obtained by DSC
(Solid squares - main peak; Solid circles - satellite peak. The solid line
is a linear regression to the corresponding data where the line is a guide
for the eyes. . . . . . . . . . . . . . . . . . . . . . . . . . . . . . . . . . . . . 64
6.13 Phase transition temperatures between liquid crystalline and isotropic
phase as obtained by DSC versus inverse pore size. Solid squares - main
peak; Solid circles - satellite peak. The solid line is a linear regression
to the data of the main peak. The dashed line is a guide for the eyes for
the satellite peak. The open data points corresponds to literature data
of Py4CEH in AAO membranes with a pore diameter of 50 nm: star -
DSC; triangle - X-ray; diamond - SANS. Taken from own publication [99] 65
6.14 Schematic representation of the possible organization of Py4CEH inside
the pores . . . . . . . . . . . . . . . . . . . . . . . . . . . . . . . . . . . . . . 66
6.15 Transition enthalpies at the transition from the liquid crystalline to the
isotropic phase versus inverse pore diameter: full circles - sum of main
and satellite peak, empty circles -main peak. The lines are a linear
regression to the data. Inset: Transition enthalpies from the plastic
crystalline to the liquid crystalline phase versus inverse pore diameter.
The line is a linear regression to the data. . . . . . . . . . . . . . . . . . . 67
159
List of Figures
6.16 Relative transition enthalpy of the satellite peak for the phase transition
from the liquid crystalline to the isotropic phase versus inverse pore
size. The dashed line denotes a linear regression to the data under the
assumption that it goes through the point of origin. . . . . . . . . . . . . 68
6.17 Dielectric loss versus temperature for different frequencies: 1 kHz (squares),
677 kHz (circles), 1.33 MHz (triangles up) (a) for AAO membranes with
a diameter of 80 nm filled with Py4CEH. Stars indicate the dielectric
loss for the corresponding emtpy membrane at a frequeny of 1 kHZ.
Dashed lines denote polynomial fits: (b) for Py4CEH inside the pores
where the contribution of the empty AAO membrane is substracted as
described in the text. . . . . . . . . . . . . . . . . . . . . . . . . . . . . . . 70
6.18 Relaxation map of Py4CEH in the bulk (open squares) and confined to
AAO membranes with pore diameters of 180 nm (open circles) and 80
nm (open triangles). Lines are guides to the eyes. Inset: relaxation map
of Py4CEH in the bulk (open squares) and confined to AAO membranes
with pore diameters 40 nm (hexagons) and 25 nm (open stars). . . . . . 71
6.19 Apparent activation energy EA versus inverse pore size for the liquid
crystalline phase. Apparent activation energy EA versus inverse pore
size for the plastic crystalline phase. Lines are guides for the eyes. . . . 72
6.20 log f∞ versus EA for all pore sizes in the different phases: circles-liquid
crystalline phase; squares-plastic crystalline phase. The line is a linear
regression to all data . . . . . . . . . . . . . . . . . . . . . . . . . . . . . . . 73
6.21 Definition of the dielectric phase transition temperature for Py4CEH
confined to AAO membranes with a pore diameter of 80 nm. Inset:
Comparison of phase transition temperatures between the plastic crys-
talline and the liquid crystalline phase versus inverse pore size as ob-
tained by dielectric spectroscopy (solid circles) and DSC (open squares
- main peak; open circles - satellite peak.The solid line is a linear regres-
sion to the corresponding data where the dashed lines are guides for the
eyes. . . . . . . . . . . . . . . . . . . . . . . . . . . . . . . . . . . . . . . . . 74
6.22 DSC thermogram for HAT6 during cooling (blue line) and heating (red
line). Inset: DSC thermogram for cooling in the range between 180 and
220 K, the temperature where a glass transition is observed in reference
[33]. . . . . . . . . . . . . . . . . . . . . . . . . . . . . . . . . . . . . . . . . . 75
160
List of Figures
6.23 Transition temperatures for the phase transitions between plastic crys-
talline and liquid crystalline phase Tcry,colh and between liquid crystalline
and isotropic phase Tcolh,iso of the HATn materials in dependence of the
length of the side chains n for heating (red circles) and cooling (blue
down triangles). Pentagons and stars indicate phase transition temper-
atures given in the literature.[110] Inset: Temperature range of the liquid
crystalline mesophase ∆Tmeso in dependence on the length of the side
chains n. . . . . . . . . . . . . . . . . . . . . . . . . . . . . . . . . . . . . . . 76
6.24 Phase transition enthalpies for the transition from the plastic crystalline
to the liquid crystalline phase (squares) and for the transition from the
liquid crystalline to the isotropic phase (circles) in dependence on the
length n of the side chains during heating. Lines are guides for the eyes.
The errors for the transition enthalpies for the phase transition from
the liquid crystalline to the isotropic phase are smaller the size of the
symbols with regard to the scale of the y-axis. . . . . . . . . . . . . . . . 77
6.25 X-ray spectra of HAT6 in the plastic crystalline phase at T=295 K.
Inset: diffractogram of plastic crystalline HAT6 (dashed line) and semi-
crystalline polyethylene (solid line) in the q-range between 10 nm−1 and
25 nm−1. . . . . . . . . . . . . . . . . . . . . . . . . . . . . . . . . . . . . . . 78
6.26 X-ray spectra of HAT6 in the liquid-crystalline phase (T=351 K). Inset:
X-ray diffractogramm of liquid crystalline HAT6 between q = 5 nm−1
and q = 10 nm−1. . . . . . . . . . . . . . . . . . . . . . . . . . . . . . . . . . 79
6.27 X-ray spectra of HAT6 at T=423 K where the material is supposed to
be in the isotropic phase. . . . . . . . . . . . . . . . . . . . . . . . . . . . . 80
6.28 X-ray diffractogram for the HATn materials at a temperature corre-
sponding to the columnar hexagonal mesophase: T = 353 K for n = 5,
T = 351 K for n=6 and 8, T = 341 K for n = 10. The curves are shifted
on the y-scale for sake of clearness. . . . . . . . . . . . . . . . . . . . . . . 81
6.29 Core-Core Distance versus number of C-Atoms in the side chain for
HATn: red circles – the columnar hexagonal phase; blue squares –
“isotropic phase”. Error bars were given for the distance in the liq-
uid crystalline phase. In the isotropic state the error is similar. The
dashed and dashed dotted lines are linear fits to the corresponding data.
Data for triangles – Poly (n–alkyl metharylates) are taken from reference
[119]. The straight line corresponds to data for a single alkyl chain in
all trans conformation.[119] Non integer numbers for the Poly (n-alkyl
metharylates) refer to mixtures of polymers with different lengths of the
side chain. Star - Py4CEH . . . . . . . . . . . . . . . . . . . . . . . . . . . 82
161
List of Figures
6.30 DSC thermograms of bulk HAT6 and HAT6 embedded inside the pores
of self-ordered AAO membranes with pore diameters as indicated (heat-
ing rate 10 K/min, second heating scan). The dashed lines indicate the
phase transitions temperatures of the bulk. The data is shifted on the
y-axis for sake of clearness. Taken from own publication.[120] . . . . . . 83
6.31 Heat flow for HAT6 confined to AAO channels with a diameter of 25
nm in the temperature range for the transition from hexagonal ordered
liquid crystalline and to the isotropic phase during heating. The dashed
line indicates the phase transition temperature of the bulk. Inset: Heat
flow for HAT6 confined to pores with a pore diameter of 40 nm in the
temperature range between 180 K and 240 K. . . . . . . . . . . . . . . . 84
6.32 Phase transition temperatures for HAT6. Phase transition temperatures
between the plastic crystalline and the liquid crystalline phase - squares,
satellite peaks for the phase transition between the plastic crystalline and
the liquid crystalline phase- upward triangles, phase transition temper-
atures between liquid crystalline and isotropic phase - circles, satellite
peaks for the phase transition between liquid crystalline and isotropic
phase- downward triangles. The solid line is a linear regression to the
corresponding data where the dashed line is a guide for the eyes. . . . . 85
6.33 Phase transition enthalpy for the phase transition from the liquid crys-
talline to the isotropic phase (sum of main and satellite peak) for HAT6-
full circles, Phase transition enthalpy for the main peak of the phase
transition from the liquid crystalline to the isotropic phase for HAT6-
empty circles. Lines are linear regression to the data. Inset: Transition
enthalpies of the satellite peak relative to that of the main peak versus
inverse pore diameter. The dashed line is a fit of Equation (6.1) to the
data. . . . . . . . . . . . . . . . . . . . . . . . . . . . . . . . . . . . . . . . . 87
6.34 Phase transition enthalpies versus inverse pore diameter d for the transi-
tion from the plastic crystalline to the liquid crystalline phase for HAT6.
The line is a linear regression to the data. . . . . . . . . . . . . . . . . . . 88
6.35 Transition enthalpy of the phase transition at 323 K for HAT6 relative
to that of the main peak. The line is a fit of Equation (6.1) to the data. 89
162
List of Figures
6.36 Phase transition temperatures for (a) HAT5, (b) HAT10, (c) HAT12
as indicated. Phase transition temperatures between the plastic crys-
talline and the liquid crystalline phase - squares, satellite peaks for the
phase transition between the plastic crystalline and the liquid crystalline
phase- upward triangles, phase transition temperatures between liquid
crystalline and isotropic phase - circles, satellite peaks for the phase
transition between liquid crystalline and isotropic phase- downward tri-
angles. The solid line is a linear regression to the corresponding data
where the dashed line is a guide for the eyes. . . . . . . . . . . . . . . . . 91
6.37 Surface tension for the phase transition between plastic crystalline and
liquid crystalline phase -black squares- and between liquid crystalline
and isotropic phase - red circles in dependence on the chain length. . . 91
6.38 Phase transition enthalpy for the phase transition from the liquid crys-
talline to the isotropic phase for HAT5 (sum of main and satellite peak)
- full squares. Phase transition enthalpy for the main peak of the phase
transition from the liquid crystalline to the isotropic phase for HAT5-
empty squares. Lines are linear regression to the corresponding data. . 92
6.39 Phase transition enthalpy for the phase transition from the liquid crys-
talline to the isotropic phase (sum of main and satellite peak) for HAT10-
full triangles. Phase transition enthalpy for the main peak of the phase
transition from the liquid crystalline to the isotropic phase for HAT10-
empty triangles. Lines are linear regression to the corresponding data. . 93
6.40 Phase transition enthalpy for the phase transition from the liquid crys-
talline to the isotropic phase for HAT12 (sum of main and satellite peak)
- full stars. Inset: Phase transition enthalpy for the main peak of the
phase transition from the liquid crystalline to the isotropic phase for
HAT12- empty stars. Lines are linear regression to the corresponding
data. . . . . . . . . . . . . . . . . . . . . . . . . . . . . . . . . . . . . . . . . 93
6.41 Critical pore size for the phase transition from the liquid crystalline to
the isotropic phase dcri,iso for the main peak - circles and the overall phase
transition - squares in dependence on the chain length. Inset: Difference
in the critical diameter dcri,ges − dcri,main for the phase transition of the
sum (main and satellite peak) and the phase transition of the main peak
for the transition between liquid crystalline and isotropic phase. . . . . 94
163
List of Figures
6.42 Phase transition enthalpies versus inverse pore diameter d for the tran-
sition from the plastic crystalline to the liquid crystalline phase. The
dashed line is a linear regression to the data: open squares - HAT5,
open circles - HAT6 Inset: Phase transition enthalpies versus inverse
pore diameter d for the transition from the plastic crystalline to the
liquid crystalline phase: open triangles - HAT 10, open stars - HAT 12. 95
6.43 Dielectric spectra of HAT6 in dependence on frequency and temperature
in a 3D representation while cooling. . . . . . . . . . . . . . . . . . . . . . 96
6.44 Dielectric loss ǫ′′ versus frequency for the α-relaxation of HAT6 at dif-
ferent temperatures: blue stars T=234 K, green triangles T=219 K, red
circles T=204 K, black squares T=183 K. Lines denote fits of equation
(5.10) to the data. . . . . . . . . . . . . . . . . . . . . . . . . . . . . . . . . 97
6.45 Relaxation map of HAT6: red stars - dielectric β - relaxation, red cir-
cles - dielectric α-relaxation, red squares - conductivity, black squares
- α-relaxation as observed in reference [33]. Straight lines are a linear
regression to the data in the corresponding temperature range. Dashed
lines denote a guide to the eyes. . . . . . . . . . . . . . . . . . . . . . . . . 97
6.46 (d log fmax
dT)−1/2
vs. temperature for the data of the α-relaxation of HAT6.
Straight lines denote a linear regression to the data. The arrow denotes
the Vogel-Temperature T0. Dashed lines are guides to the eyes. . . . . . 98
6.47 Dielectric strength ∆ǫα in dependence on temperature for the α-relaxation
of HAT6. Inset: Dielectric strength ∆ǫβ in dependence on temperature
for the β-relaxation of HAT6. The dashed and straight lines are guides
for the eyes. . . . . . . . . . . . . . . . . . . . . . . . . . . . . . . . . . . . . 99
6.48 Activation Plot for HATn for the α-and the β-relaxation: squares -
HAT5, red circles - HAT6, green triangles - HAT8, blue pentagons -
HAT10, pink stars - HAT12. Solid lines are fits of the Arrhenius equa-
tion to the data of the β-relaxation. Dashed lines denote relaxation rates
of PE to the corresponding process taken from reference [35]. . . . . . . 101
6.49 (d log fmax
dT)−1/2
versus temperature for HAT5 - black squares and HAT8 -
green triangles. Lines are a linear regression to the data. . . . . . . . . . 101
6.50 Activation energy EA,αfor the α-relaxation in dependence on the chain
length for HAT8, HAT10 and HAT12. The line is a guide for the eyes. 103
6.51 Activation energy for the β-relaxation for all HATn in dependence on
the chain length. The dashed line denotes the activation energy of the
β-relaxation of PE taken from reference [35]. The line is a guide to the
eyes. . . . . . . . . . . . . . . . . . . . . . . . . . . . . . . . . . . . . . . . . 104
164

List of Figures
6.52 Activation Plot for HATn for the conductivity process: squares - HAT5,
red circles - HAT6, green triangles - HAT8, blue pentagons - HAT10,
pink stars - HAT12. Solid lines denote fits of the Arrhenius equation to
the data. . . . . . . . . . . . . . . . . . . . . . . . . . . . . . . . . . . . . . . 104
6.53 Vibrational density of states (VDOS) of HAT5 measured at T=80 K
at IN6. Inset: Vibrational density of states for HAT5 - red circles, the
nematic mixture E7 - blue stars [47] and for polymeric glass poly (methyl
phenyl siloxane) (PMPS) [45] - upward green triangles. Measurements
were carried out at T=80 K. The data for the different materials were
not normalized. . . . . . . . . . . . . . . . . . . . . . . . . . . . . . . . . . . 105
6.54 Vibrational density of states of HAT5 (empty red circles) and of “amor-
phous” polyethylene (PE) (filled circles) given by Kanaya et al. in refer-
ence [127]. The data for PE are scaled to collapse at the high frequency
side with the HAT5 data. . . . . . . . . . . . . . . . . . . . . . . . . . . . . 106
6.55 VDOS at T= 80 K for HAT. for different lengths of the alkyl chains:
HAT5 -circles, HAT10 -stars, HAT12 - diamonds. Inset: Boson Peak
for HAT5 - circles and HAT6 - squares. Lines are guides for the eyes.
Taken from own publication.[123] . . . . . . . . . . . . . . . . . . . . . . . 107
6.56 Frequency of the Boson peak ωBP versus the number of carbon atom in
the side chains. Taken from own publication.[120] . . . . . . . . . . . . . 108
6.57 VDOS of HATn with different lengths of the side chains: diamonds -
HAT12, triangles - HAT8, circles - HAT5. . . . . . . . . . . . . . . . . . . 109
6.58 Vibrational density of states of HAT6 in the bulk (black squares) and
confined to self-ordered AAO membranes with pore sizes 80 nm (green
circles), 40 nm (red stars) and 25 nm (blue diamonds). The lines are
guides to the eyes. Inset: frequency of the Boson peak ωBP versus inverse
pore size. . . . . . . . . . . . . . . . . . . . . . . . . . . . . . . . . . . . . . . 110
6.59 Ratios of the VDOS according to Equation (6.4). The main graph shows
the averages of the data in the frequency range ω = 0.8...1.8 ps−1. The
error bars indicate the standard deviation of the average given in the
inset. The dashed line is a fit to the data according to Equation (6.4).
The inset gives the underlying values in dependence on ω: open squares
- 80 nm; grey circles - 40 nm. The lines indicate the averages. . . . . . . 112
6.60 Scheme of orientation of the pore axis with respect to the momentum
transfer vector q (scattering vector). ki and kf are the wave vectors of the
incident and detected neutron beam in a neutron scattering measurement.112
165
List of Figures
6.61 Vibrational density of states of HAT6 confined to self-ordered AAO
membranes with a pore sizes of 25 nm with parallel (open squares) and
perpendicular orientation (grey circles) of the pore axis with respect to
the q vector of the incident beam at T=80 K. Lines are guides to the
eyes. Inset: Temperature dependence of the mean-square displacement
⟨u2⟩ recalculated from the vibrational densities of states according to
equation (6.5): solid line - pore axis perpendicular to the q vector of
the incident beam, dashed line - pore axis parallel to the q vector of the
incident beam. The dashed-dotted line indicate ⟨u2⟩ at 80 K. . . . . . . 113
6.62 Temperature dependence of the effective mean squared displacement
⟨u2⟩eff for HAT6. The dotted lines denote the phase transition temper-
atures obtained by DSC. The inset enlarges the temperature dependence
of ⟨u2⟩eff in the low temperature range up to a temperature of 300 K.
Taken from own publication. . . . . . . . . . . . . . . . . . . . . . . . . . . 115
6.63 Temperature dependence of the effective mean squared displacement
⟨u2⟩eff for open squares - HAT5, open circles - HAT6, open pentagons
- HAT10 and open stars - HAT12 at lower temperatures in the plastic
crystalline phase. The inset enlarges the temperature range between 150
K and 250 K. . . . . . . . . . . . . . . . . . . . . . . . . . . . . . . . . . . . 116
6.64 Temperature dependence of the effective mean squared displacement
⟨u2⟩eff for open squares - HAT5, open circles - HAT6 and open triangles -
HAT8 at higher temperatures in the hexagonal ordered liquid crystalline
phase. Inset: Effective mean squared displacement ⟨u2⟩eff versus the
core-core distance in the liquid crystalline phase. . . . . . . . . . . . . . . 117
6.65 Temperature dependence of the scattered elastic intensity for HAT6 in
the bulk-red circles and in the confined state (40 nm - green triangles,
25 nm - blue stars) normalized to the elastic intensity at T=30 K. Open
black pentagons correspond to the empty membranes with a pore size of
40 nm. The dotted lines denote the bulk phase transition temperatures
obtained by DSC. . . . . . . . . . . . . . . . . . . . . . . . . . . . . . . . . 118
6.66 Temperature dependence of the effective mean square displacement ⟨u2⟩eff
for HAT6 in the bulk-red circles and in the confined state (80 nm - green
triangles, 40 nm - blue stars). The dotted lines denote the bulk phase
transition temperatures obtained by DSC. . . . . . . . . . . . . . . . . . . 119
6.67 Temperature dependence of the effective mean squared displacement
⟨u2⟩eff for HAT6 red circles - in the bulk and blue stars - confined to
the pores with a pore size of 40 nm in the low temperature range until
300K. . . . . . . . . . . . . . . . . . . . . . . . . . . . . . . . . . . . . . . . . 120
166
List of Figures
6.68 Temperature dependence of the effective mean squared displacement
⟨u2⟩eff for HAT6 red circles - in the bulk and blue stars - confined to
the pores with a pore size of 40 nm in the temperature range between
250 K and 400 K. . . . . . . . . . . . . . . . . . . . . . . . . . . . . . . . . 120
6.69 Temperature dependence of the effective mean squared displacement
⟨μ2⟩eff for HAT6 confined to the pores with a pore size of 40 nm with
parallel orientation of the pore axis with respect to the incident beam -
green stars, with perpendicular orientation of the pore axis with respect
to the incident beam - red diamonds . . . . . . . . . . . . . . . . . . . . . 121
6.70 DSC thermogram for HOT 6 in dependence on heating -red line and
cooling -blue line. . . . . . . . . . . . . . . . . . . . . . . . . . . . . . . . . . 122
6.71 Phase transition temperatures in dependence on the number n of C-
Atoms in the alkyl chain during heating: red circles- transition be-
tweeen different plastic crystalline phases, black squares-transition be-
tween plastic crystalline and liquid crystalline phases, blue triangles-
transition between different liquid crystalline phases, green pentagons
between liquid crystalline and isotropic phases. . . . . . . . . . . . . . . . 123
6.72 Phase transition temperatures in dependence on the number n of C-
Atoms in the alkyl chain during cooling: black squares - phase transition
between plastic crystalline and liquid crystalline phase, green pentagons-
phase transition between liquid crystalline and isotropic phase. . . . . . 124
6.73 Sum of the phase transition enthalpies of the phase transition between
plastic crystalline and liquid crystalline and for the phase transition be-
tween different liquid crystalline phases in dependence on the number n
of C-Atoms in the alkyl chain: Red circles - heating, open blue pentagons
- cooling. . . . . . . . . . . . . . . . . . . . . . . . . . . . . . . . . . . . . . . 124
6.74 Phase transition enthalpies for the phase transition between liquid crys-
talline and isotropic phase in dependence on the number n of C-Atoms
in the alkyl chain: Red circles - heating, open blue pentagons - cooling. 125
6.75 X-ray diffractogramm for HOT6 in the different phases: black line-
plastic crystalline phase (T=299 K), red line - liquid crystalline phase
(T=385 K) and blue line - isotropic phase (T=423 K) . . . . . . . . . . . 126
6.76 X-ray diffractogram for the HOTn materials at a temperature corre-
sponding to the columnar hexagonal mesophase: black line - n=6 (T=385
K), red line - for n=8 (T=333 K), green line - n=10 (T=345 K), blue
line n=12 (T=354 K). The curves are shifted on the y-scale for sake of
clearness. . . . . . . . . . . . . . . . . . . . . . . . . . . . . . . . . . . . . . . 127
167
List of Figures
6.77 Distance versus number of C-Atoms for HOTn -blue circles and HATn
- green triangles. The star corresponds to the value found for Py4CEH.
The straight line corresponds to data for a single alkyl chain in all trans
conformation.[119] . . . . . . . . . . . . . . . . . . . . . . . . . . . . . . . . 127
6.78 Dielectric loss ǫ′′
in dependence on frequency and temperature in a 3D
representation while heating. . . . . . . . . . . . . . . . . . . . . . . . . . . 129
6.79 Relaxation map of HOT6 in comparison to HAT6: red pentagons - α-
relaxation of HAT6, red stars - β-relaxation of HAT6, red downward
triangles - conductivity of HAT6, black circles - α-relaxation of HAT6,
black upward triangles - β-relaxation of HOT6, black squares - conduc-
tivity of HOT6. . . . . . . . . . . . . . . . . . . . . . . . . . . . . . . . . . . 130
6.80 Dielectric strength ∆ǫα for the α-relaxation of HOT6 in dependence
on temperature. Inset: Dielectric strength ∆ǫβ for the β-relaxation of
HOT6 in dependence on temperature. . . . . . . . . . . . . . . . . . . . . 131
6.81 (d log fmax
dT)−1/2
vs. temperature for the data of the α-relaxation of HOT6.
Straight lines denote a linear regression to the data. The arrow denotes
the Vogel-Temperature T0. . . . . . . . . . . . . . . . . . . . . . . . . . . . 131
6.82 Temperature dependence of the relaxation rates in dependence on 1000/T:
red circles - HOT6, green triangles - HOT8, violet pentagons - HOT10,
blue stars - HOT12 . . . . . . . . . . . . . . . . . . . . . . . . . . . . . . . 132
6.83 Activation energies for the β - relaxation for HOTn in dependence on
the chain length: red circles - HOTn, red triangles - second β-relaxation
of HOTn, blue squares - HATn. . . . . . . . . . . . . . . . . . . . . . . . . 133
6.84 Vibrational density of states (VDOS) of HOT6. Arrows are guides to the
eyes. Inset: Vibrational density of states for HOT6 - red circles, HAT6 -
open stars. The data for the different materials were normalized to the
maximum of the y-value of the Boson Peak. . . . . . . . . . . . . . . . . . 134
6.85 Vibrational density of states (VDOS) of HOT6 - red circles, HOT8 - blue
squares. Inset VDOS for HOT10 -green pentagons and HOT12 -blue stars135
6.86 Temperature dependence of the effective mean squared displacement
⟨u2⟩eff for HOT6. The dotted lines denote the phase transition temper-
atures obtained by DSC. Inset: Temperature dependence of the effective
mean squared displacement ⟨u2⟩eff for HAT6. . . . . . . . . . . . . . . . 136
168
List of Figures
6.87 Temperature dependence of the effective mean squared displacement
⟨u2⟩eff for all HOTn under study in the high temperature range between
T=250 K and T=410 K: red circles - HOT6, green triangles - HOT8, vio-
let pentagons - HOT10, blue stars - HOT12. The dotted lines denote the
phase transition temperatures for HOT6 obtained by DSC. Inset: Tem-
perature dependence of the effective mean square displacement ⟨u2⟩eff
for all HOTn under study in the low temperature range up to T=300 K:
red circles - HOT6, green triangles - HOT8, violet pentagons - HOT10,
blue stars - HOT12. . . . . . . . . . . . . . . . . . . . . . . . . . . . . . . . 137
6.88 Effective mean squared displacement ⟨u2⟩eff versus the core-core dis-
tance in the liquid crystalline phase: Square- HATn; Circles - HOTn.
Dashed lines are guides for the eyes. . . . . . . . . . . . . . . . . . . . . . 137
169


