
Structure and performance of Ethiopia’s coffee export sector Bart Minten, Seneshaw Tamru, Tadesse Kuma, and Yaw Nyarko
June 2014
WORKING PAPER 66
SUMMARY | APRIL 2010
TABLE OF CONTENTS
Abstract .................................................................................................................................................................................. 1
1. Introduction ....................................................................................................................................................................... 1
2. Coffee in Ethiopia .............................................................................................................................................................. 2
3. Data ................................................................................................................................................................................... 4
4. Structure of the coffee export sector in Ethiopia ............................................................................................................... 5
4.1. Characteristics of coffee transactions and coffee exporters ...................................................................................... 5
4.2. Firm concentration and dynamics .............................................................................................................................. 5
4.3. Seasonality ................................................................................................................................................................. 7
4.4. Private versus public coffee exporting firms ............................................................................................................... 8
5. Coffee Quality ................................................................................................................................................................... 9
6. Coffee Export destination markets .................................................................................................................................. 14
7. Performance of Ethiopia’s coffee export sector .............................................................................................................. 17
7.1. Values and quantities ............................................................................................................................................... 17
7.2. Changes in international coffee prices ..................................................................................................................... 18
7.3. Quality premiums offered for Ethiopian coffee ......................................................................................................... 19
8. Discussion and conclusions ............................................................................................................................................ 25
References ........................................................................................................................................................................... 28
LIST OF TABLES
Table 1—Ethiopia’s coffee exports – descriptive statistics .................................................................................................... 5
Table 2—Factors associated with the export of washed and certified coffee – probit model ............................................. 13
Table 3—Multinomial logistic regression model of destination markets for Ethiopian coffee .............................................. 16
Table 4—Determinants of coffee prices (log(US cents per lb)); hedonic price model ......................................................... 21
Table 5—Testing the benefits of vertical integration and traceability in the Ethiopian coffee export sector ....................... 23
Table 6—Determinants of coffee prices (log(US cents per lb)) by destination market; hedonic price model ..................... 24
Table 7—Determinants of coffee prices (log(US cents per lb)); quantile hedonic price models ......................................... 25
LIST OF FIGURES
Figure 1—Location of coffee production in Ethiopia .............................................................................................................. 2
Figure 2—Value of coffee exports from Ethiopia and year-on-year growth in coffee exports, compared to total exports, 2002/03 to 2012/13 ........................................................................................................................... 3
Figure 3—Number of exporters and annual average/median value of coffee exports per exporter, 2007 to 2012 .............. 6
Figure 4—Concentration ratios in Ethiopia’s coffee export sector, 2006 to 2013 at six-month intervals .............................. 6
Figure 5—Evolution of incumbent (present year before and after), exiter (not present year after), and entrant (not present the year before) firms in the coffee export sector, by number and by share in coffee exports ......... 7
Figure 6—Monthly seasonality index for quantity of coffee exports for period 2003 to 2012 ................................................ 8
Figure 7—Share of coffee exports by cooperatives and parastatal firms, 2006 to 2013 at six-month intervals ................... 9
Figure 8—Quality premiums for coffee certification and washing, 2006 to 2013 ................................................................ 10
Figure 9—Shares of washed coffee in total exported coffee quantities, monthly, 2006 to 2013 ........................................ 10
Figure 10—Evolution of grades within washed and unwashed market segment, 2006 to 2013 at six-month intervals ...... 11
Figure 11—Export share of the different producing regions by quantity and value, 2006 to 2013 at six-month intervals .. 12
Figure 12—Share of different destination markets for Ethiopia’s coffee exports in 2012.................................................... 14
Figure 13—Share of different destination markets in Ethiopia’s coffee exports .................................................................. 14
Figure 14—Cumulative price distribution by destination market, 2005 to 2013 .................................................................. 15
Figure 15—Share of exports of washed and unwashed coffee by export destination, 2005 to 2013 ................................. 17
Figure 16—Trends in real value and quantities of coffee exports from Ethiopia, 2003 to 2012 (Jan. 2003=100; 12-month moving average) ................................................................................................................................ 17

SUMMARY | APRIL 2010
Figure 17—Trends in Ethiopian export coffee price versus reference international coffee price, 2002 to 2013 ................. 18
Figure 18—Difference between Addis Ababa retail coffee price and the Ethiopia coffee export price, 2002 to 2013 by month ............................................................................................................................................................ 19
Figure 19—Regional coffee premiums over time, compared to Sidama coffee .................................................................. 22

1
SUMMARY | APRIL 2010
ABSTRACT
We study the structure and performance of the coffee export sector in Ethiopia, Africa’s most important coffee
producer, over the period 2003 to 2013. We find an evolving policy environment leading to structural changes in
the export sector, including an elimination of vertical integration for most exporters. Ethiopia’s coffee export earn-
ings improved dramatically over this period, i.e. a four-fold real increase. This has mostly been due to increases
in international market prices. Quality improved only slightly over time, but the quantity exported increased by 50
percent, seemingly explained by increased domestic supplies as well as reduced local consumption. To further
improve export performance, investments to increase the quantities produced and to improve quality are needed,
including an increase in washing, certification, and traceability, as these characteristics are shown to be associ-
ated with significant quality premiums in international markets.
1. INTRODUCTION
Coffee is one of the most important traded commodities in the world. The sector’s trade structure and perfor-
mance have large development and poverty implications, given the high concentration of production by small-
holders in poor developing countries. Coffee’s global value chains are quickly transforming because of shifts in
demands and an increasing emphasis on product differentiation in importing countries (Ponte 2002; Daviron and
Ponte 2005). There is a growing willingness-to-pay for premium, high quality coffee by rich consumers and the
demand for specialty and certified coffee is on the rise.1 Moreover, international coffee markets have experienced
significant price variation over the last decade – prices were five times higher in 2011 than in 2002.
These changes have important implications for a number of the poorest developing countries, as most
coffee production takes place in these countries, even though most coffee consumption is in developed countries
(Pendergrast, 2010; Ponte, 2002). While there are a number of studies that have looked at price formation for
different types of coffee at the retail consumption level in importing countries (e.g. Teuber and Herrmann, 2012),
important questions remain on who benefits from this increasing willingness-to-pay for coffee and on how
changes in global coffee markets are transmitted to producing countries. Moreover, few researchers have looked
at how domestic policy change is affecting the performance of the coffee sector in these exporting countries.
In this paper, we look at the structure and performance of the coffee export sector in Ethiopia. In 2012,
Ethiopia exported 3.2 million bags, making it the most important African coffee exporter and the tenth largest ex-
porter in the world (ICO, 2013). Its share of the international coffee trade that year was about 3 percent. Coffee is
the most important export product of the country, accounting for about a quarter of the value of all exports in
2012. Coffee is cultivated by over 4 million primarily smallholder farming households (CSA, 2013) and, with those
employed in ancillary activities to coffee production, even more households are dependent on coffee for part of
their livelihoods (LMC, 2003). Furthermore, coffee plays an important role in social gatherings and is important in
local consumption, as more than half of Ethiopia’s coffee production is consumed locally (CSA, 2013).
We study the structure and performance of Ethiopia’s coffee export sector over the last decade. First, we
document the characteristics of the sector, the policy shifts affecting the sector, and the important structural
changes that have occurred in Ethiopia’s coffee export market during the study period. We then study how price,
quantity, and quality variation is associated with export performance. Local policy changes in Ethiopia, primarily
those related to the start of the Ethiopian Commodity Exchange (ECX) at the end of 2008, as well as export li-
cense suspensions, have contributed to structural shifts in the sector. We find a lower concentration ratio in the
export sector, an inflow of smaller firms, a slowly increasing importance of cooperatives and parastatals, and a
slight diversification in the countries to which coffee is exported subsequent to these policy changes. Over the
last decade, we also note a large increase in the value of coffee exports over time. This change has mostly been
driven by increases in international prices and to a lesser degree by increased quantity and quality of exported
1 Specialty coffee and high-quality coffee are typically synonymous. However, certified coffee is not necessarily specialty coffee.

2
SUMMARY | APRIL 2010
coffee from Ethiopia. While the exported quantity has increased, this has seemingly been driven by both in-
creased production and reduced local consumption. We further note important premiums being paid in interna-
tional markets for washing, certification, vertical integration, and for geographical indications of origin. The latter
two are especially rewarded in emerging high-end markets.
The structure of the paper is as follows. First, we give some background information on the coffee sector
in Ethiopia. Thereafter, in Section 3, we describe the data used for this study. Structural characteristics of the cof-
fee sector are discussed in Section 4. We discuss quality issues in the Ethiopian coffee market and export desti-
nation markets in Sections 5 and 6, respectively. The performance of the sector over the last decade is consid-
ered in Section 7, particularly examining export prices and quality and their associations with different influencing
factors. We finish with a discussion of the findings and conclusions.
2. COFFEE IN ETHIOPIA
Ethiopia is endowed with a good production environment for growing coffee with a combination of appropriate
altitude, temperature, rainfall, soil type, and pH. Ethiopia is the center of origin for Coffea arabica. The country
possesses a diverse genetic base for this Arabica coffee with considerable heterogeneity. Ethiopia produces a
range of distinctive Arabica coffees and has considerable potential to sell a large number of specialty coffees
(Nure, 2008).2 Little of the lower-value Robusta coffee is produced in Ethiopia, being better suited for production
in lower altitude equatorial climates. Coffee production in Ethiopia is almost exclusively situated in the two regions
of Oromia and the Southern Nations, Nationalities, and People Regions (SNNPR) in the south and west of the
country (Figure 1).
Figure 1—Location of coffee production in Ethiopia
2 The Specialty Coffee Association of America (SCAA) defines specialty coffee in its green stage as coffee that is free of primary defects, contains no unripened beans, is properly sized and dried, is free of faults and taints, and has distinctive attributes (Rhinehart, 2012).

3
SUMMARY | APRIL 2010
Smallholder farmers produce 95 percent of Ethiopia’s coffee (Tefera and Tefera, 2013). It is produced un-
der several types of production systems, including forest, semi-forest, garden, and plantation coffee (Tulu, 2008).
Forest coffee is grown in the wild under natural forest cover and is gathered by farmers from trees with minor tree
maintenance. Semi-forest coffee is also grown in forest conditions, but there is some limited maintenance by
farmers, mostly annual weeding. This type of coffee has clearly delineated boundaries of ownership, although the
trees usually are located away from agricultural plots. Garden coffee is defined as coffee from trees planted by
farmers in the vicinity of their residences. It is often intercropped with other crops or trees. Plantation coffee is
grown on large commercial farms, private as well as state farms. Modern production practices – such as irriga-
tion, modern input use, mulching, stumping, and pruning - are often applied in this case. While reliable recent sta-
tistics are lacking, it is estimated that these different production systems make up about 10, 35, 50, and 5 per-
cent, respectively, of total coffee production in the country (Kufa, 2012).
Figure 2 shows the variation in the value (in nominal USD) of both overall exports and coffee exports from
Ethiopia over the last decade. The figure illustrates two main patterns. First, coffee makes up an important part of
overall exports. Second, we see strong growth rates in both over the last decade. The overall value of exports
grew at an average compounded annual rate of 21 percent, while coffee exports grew at 16 percent. This slightly
slower growth rate of coffee exports compared to overall exports implies that the share of coffee exports in total
exports has decreased over time. While coffee made up almost 35 percent of the value of total export in 2002/03,
this came down to 24 percent for the period 2012/13, which suggests that export commodities have diversified in
recent years.
Figure 2—Value of coffee exports from Ethiopia and year-on-year growth in coffee exports, compared to total ex-
ports, 2002/03 to 2012/13
There have been significant domestic policy reforms in the last decade that affected the structure and per-
formance of the coffee export sector. First, from December 2008 onwards it became mandatory for private trad-
ers to sell their coffee through the Ethiopian Commodity Exchange (ECX), a new modern commodity exchange.3
ECX trades standard coffee contracts, based on a warehouse receipt system, with standard parameters for cof-
fee grades, transaction size, payment, and delivery. The first level quality control is decentralized and undertaken
3 Producers who are exporters can bypass the ECX, as can farmer cooperatives.
-40.0
-30.0
-20.0
-10.0
0.0
10.0
20.0
30.0
40.0
50.0
60.0
70.0
0
500
1,000
1,500
2,000
2,500
3,000
3,500
per
cen
t
10
00
USD
coffeetotalgrowth coffeegrowth total

4
SUMMARY | APRIL 2010
in nine liquoring and inspection units in major production areas.4 The establishment of the ECX has led to im-
portant changes in the structure of the coffee value chain (Gabre-Madhin, 2012).
Second, the government intervened in the coffee market on several occasions in an effort to reduce
hoarding by exporters. In April 2009, six large traders were banned from exporting coffee because of their pre-
sumed excessive hoarding. The government revoked their licenses, closed down their warehouses, seized their
coffee stocks, and sold them on their behalf (Alemu, 2009). A policy was further implemented in May 2011 that
limited the amount of coffee an exporter can store. An exporter, for example, selling and buying coffee on the
ECX will have his or her right to trade on the commodity exchange revoked if found to be storing more than 500
metric tons of coffee without a shipment contract with an importer (Tefera and Tefera, 2013).5 Failing to adhere to
these regulations has led to the banning of coffee exporters, as seen in 2011 and 2013 (Araya, 2011; Ye-
wondwossen, 2014).
Third, there have been a number of changes regarding export taxes on coffee over time. Core changes
include the removal of entry barriers (Proclamation No. 70/1993); the consolidation of all taxes and duties levied
on coffee export into a single tax family (Proclamation No. 99/1998), which consolidated all taxes on coffee export
to 6.5 percent; and, following the 2002 international coffee crisis, the waiving of all export taxes on coffee exports.
Finally, an Ethiopian Fine Coffee Trademark Licensing Institute was set up in February 2005 with the pur-
pose of setting up a system to secure legal ownership in international markets of specialty coffee names (espe-
cially Sidamo, Harar, and Yirgacheffe) (Agrer, 2004). There was initial resistance against this initiative, but they
were ultimately settled. The goal of this effort was to add brand value to Ethiopian coffee. Signatories entered into
a brand management strategy with the government with the purpose of achieving better farm-gate and export
prices for coffee (Arslan and Reicher, 2010).
3. DATA
To understand Ethiopia’s coffee export sector, we relied on different sources of information and methods. First, a
large number of key informants in the sector were contacted and interviewed. These included employees of pri-
vate exporters, the Coffee Liquoring Unit (CLU), the Coffee Plantation and Development Enterprise, the Coffee
Processing and Warehouse Enterprise, government entities, ECX, coffee producers and retailers, as well as cof-
fee researchers.
In addition, we used a number of secondary data sources. First, data were obtained from the National
Bank of Ethiopia (NBE) on monthly coffee exports for the period 2002 to 2013. These data were used to calculate
trends, 12-month moving averages, as well as seasonal movements. Second, the International Coffee Organiza-
tion (ICO) calculates an international composite price for coffee based on future contract prices recorded on the
London and New York stock exchange. Historical monthly data were downloaded from their webpage.6 Third, a
database of coffee export transactions is maintained by the Ministry of Trade. This export transactions dataset for
the period July 2006 to June 2013 was used.
An important aspect in coffee exports is quality. Coffee quality assessments for exports are conducted by
the Coffee Liquoring Unit (CLU) to ensure that it meets export standards. After buying coffee on the ECX trading
floor (or, before 2009, at the coffee auction), exporters pick up the coffee from regional ECX warehouses and it
undergoes further processing to meet export standards.7 On reaching this export standard, a quality certificate is
4 Before the establishment of ECX, all first and second level quality inspection was carried out in Addis Ababa. 5 A directive requiring the shipment of coffee in bulk containers, instead of 60-kilogram jute-bags, was put in place in mid-November 2011. However, it was revoked soon after because of pressures from exporters. Such bags are widely used in international trade and help to better maintain the identity of the coffee (Tefera and Tefera, 2013). 6 http://www.ico.org/ 7 It is estimated that there are about 80 of these processing units, mostly based in Addis. The most sophisticated processing machine is held by the Coffee Processing and Warehouse Enterprise. It is estimated that they process in their unit about one-quarter of all coffee exported from Ethiopia.

5
SUMMARY | APRIL 2010
issued by the CLU. A quality inspection sheet is prepared and is attached to the lot to be exported.8 These quality
indicators, as well as others (such as washing, certification, and origin), are part of the coffee export transactions
dataset, which was used for this study. We also obtained a list of private commercial coffee farms (with cultivated
areas of 40 hectares and above) from its association. This information was integrated into the analysis as well.
4. STRUCTURE OF THE COFFEE EXPORT SECTOR IN ETHIOPIA
4.1. Characteristics of coffee transactions and coffee exporters
Table 1 gives an overview of some of the characteristics of coffee export transactions and of exporters over the
period 2006 to 2013. The average coffee export transaction over this period involved 37 metric tons with a value
of 133,000 USD. The average price was 173 US cents per pound (lb). The large standard deviations indicate sig-
nificant variations in quantity, value, and price between transactions. 51 percent of the export transactions were
destined for Europe, 14 percent for North America, 12 percent for Saudi Arabia, and 10 percent for Japan. Sudan
accounted for 4 percent of all the export transactions over that period.
Transactions were aggregated by coffee exporter for every year to give an idea of the scale of operations
of the exporters. An average exporter over that period exported 1,266 metric tons of coffee per year for a value of
4.5 million USD. Again, we see large variability in scale of operations across exporters.
Table 1—Ethiopia’s coffee exports – descriptive statistics
4.2. Firm concentration and dynamics
We note large changes over the study period in the number of exporters that are active in coffee export markets.
In the beginning of the period (2007-2008), there were about 100 active coffee exporters (Figure 3). This in-
creased to 175 exporters by 2012, an increase of 75 percent. The evolution of the median value of exports per
exporter shows a slight decline over time, seemingly indicating an inflow of smaller exporters. While the average
8 The analysis of coffee quality by the CLU is based on two measures, the raw and physical inspection and the cup inspection. The raw and physical inspection contributes for 40 percent to the final quality grade, while the cup inspection contributes for 60 percent. However, moisture and screen analysis are the two requisites before grading any coffee. The moisture content should be less than 11.5 percent, while the size of the bean should be above screen size 14 for 85 percent of the bean sample. In the case of unwashed coffee, raw quality is determined based on defect count of the beans and on odor. In the case of washed coffee, the raw quality is based on an assessment of shape and make, color, and odor. Cup quality is assessed along four criteria, including cup cleanliness, acidity, body, and flavor. Each characteristic counts for 15 percent of the 60 percent of the cup quality value. The washed coffee export standards vary between grade 1 and 2, as well as under-grade (UG) while unwashed coffee is graded 3, 4, 5, or under-grade. Within the under-grade category, a further distinction is made for under-grade type ‘inferior, but exportable’ coffee, while the worst under-grade coffee is not exportable and is destined for domestic consumption.
Mean Median Standard
Unit deviation
Transaction data (07/2006 - 06/2013)
Quantity Metric tons 37.8 19.2 36.1
Price US cents/lb 173.2 159.0 66.8
Value 1000 USD 132.7 91.5 131.4
Destination markets:
Europe % of transactions 51.2
Japan % of transactions 9.6
North-America % of transactions 13.9
Saudi-Arabia % of transactions 12.0
Sudan % of transactions 4.1
Other % of transactions 9.1
Exporters annually (01/2007 -12/2012)
Quantity exported by active exporters per year Metric tons 1,265.7 340.5 2,610.1
Value of exports by active exporters per year 1000 USD 4,516.3 1,062.5 8,966.2

6
SUMMARY | APRIL 2010
value of exports per exporter came down in 2009 (the first year of the ECX), it has rebounded since, although the
median value has not.
Figure 3—Number of exporters and annual average/median value of coffee exports per exporter, 2007 to 2012
We look at the concentration ratio of export firms in Ethiopia. Common measures used to measure the
concentration of firms in economic sectors are the CR4 and CR8, the share of business in the sector handled by
the four and by the eight largest firms in the sector, respectively. These concentration ratios have decreased sig-
nificantly over time, especially after 2008 (Figure 4). Before 2008, the CR4 on average was about 40 percent,
while the CR8 approached 60 percent. Since the ban of export licenses of six major exporters in early 2009 (Al-
emu, 2009), this share came down by 16 percent and 14 percent for the CR8 and CR4, respectively, compared to
the end of 2008.9 Over the period considered, the lowest concentration was at the beginning of 2011, but has
been slowly increasing since. At the beginning of 2013, the CR8 was almost 40 percent, while the CR4 was 25
percent.
Figure 4—Concentration ratios in Ethiopia’s coffee export sector, 2006 to 2013 at six-month intervals
9 The license ban was triggered by the perception that these exports were involved in excessive hoarding, contributing to a general lack of foreign exchange in Ethiopia (Alemu, 2009).
0
1
2
3
4
5
6
0
20
40
60
80
100
120
140
160
180
200
2007 2008 2009 2010 2011 2012
mill
ion
USD
Nu
mb
er o
f ex
po
rter
s
Number of exporters
Average value
Median value
0
10
20
30
40
50
60
70
pe
rce
nt
CR4
CR8

7
SUMMARY | APRIL 2010
The World Bank (2014) shows that the largest exporters, i.e. those selling more than 5 million USD per
year, account for nearly 80 percent of coffee exports. They further argue that the coffee market is hard to enter –
new firms have limited opportunities to enter into the coffee export business. This is illustrated in Figure 5, which
plots the share of entrants (coffee export firms that were not in business the year before), exiters (firms that were
not there the year after), and incumbents (firms that are there both the year before and after) for the period 2007
to 2012. On the left (Figure 5a), we see that a relatively large number of new entrants came into the market in
2010/11, possibly attracted by the high prices in that year. In 2007/08, we find that a large number of firms exited
the market the year after, possibly related to the start of the ECX. However, in the graph on the right (Figure 5b),
the share in total coffee exports of firms that moved in and out of the market is shown to be small, with entrants
and exit firms typically making up less than 10 percent of the market. The graph also illustrates the disruptive ef-
fect of the ban on large exporters in the year 2008/09. The six banned firms made up a large proportion of the 35
percent of firms in that year who were exiters and would not export coffee anymore.
Figure 5—Evolution of incumbent (present year before and after), exiter (not present year after), and entrant (not
present the year before) firms in the coffee export sector, by number and by share in coffee exports
a. Number of coffee export firms b. Share in coffee exports
4.3. Seasonality
As for most agricultural crops, the production, processing, and marketing of coffee is characterized by important
seasonal patterns. Coffee is mostly harvested during the period October to December. It can be sold immediately
in the form of red cherries, or farmers might dry the cherries and sell them later in the year as whole dried cher-
ries. Figure 6 shows how coffee exports vary over the year. The peak is achieved in the period from March until
June when exports are on average more than twice as high as during the lean period, i.e. October to January.10
The timing of the peak of exports indicate a significant lag between production and exports, linked to time con-
suming post-harvest and processing activities, but also due to storage. If the share of washed coffee in total ex-
ports had increased over time, one might have expected a shift forward in the timing of exports, since washed
coffee is sold slightly earlier in the season. However, such a shift is not noted. In fact, the reverse is observed.
Comparing exports for the period 2003 to 2007 to those of the period 2008 to 2012, a shift in the main export
season to about 2 months later in the year is seen (Figure 6).11 While the peak month of exports was April for the
period 2003 to 2007, this had shifted to June for the period 2008 to 2012.
10 During that period, left-over stocks of the previous year are mostly sold. It is not yet the new harvest. 11 Part of the explanation is seemingly linked to late exports in 2009. As there were wide expectations of currency depreciation and as there was a decline in international coffee prices, exporters held on longer than usual to their coffee stocks. This led the government to take the drastic measure of banning licenses of major coffee exporters in April 2009.
0
50
100
150
200
2007/08 2008/09 2009/10 2010/11 2011/12
Nu
mb
er o
f fi
rms
incumbents entrants exiters
0%
20%
40%
60%
80%
100%
2007/08 2008/09 2009/10 2010/11 2011/12Shar
e in
to
tal c
off
ee e
xpo
rts
incumbents entrants exiters

8
SUMMARY | APRIL 2010
Figure 6—Monthly seasonality index for quantity of coffee exports for period 2003 to 2012
4.4. Private versus public coffee exporting firms
Figure 7 shows the extent to which cooperatives and parastatals, including the Ethiopian Grain Trade Enterprise
(EGTE) and state farms, play a role in coffee exports from Ethiopia. Three main findings appear from the graph.
First, the share of cooperatives and parastatals in export trade is relatively small. The large majority of coffee ex-
ports is in the hands of the private sector. The lowest share in total exports for the private sector was achieved at
the end of 2009, when its share was 83 percent. However, in most years the private sector largely dominated,
with a share close to 90 percent.
Second, we see significant variation in the share of exports for cooperatives and parastatals over time. In
the case of cooperatives, we see a steadily increase from between 3 and 4 percent in 2006/07 to between 5 and
6 percent in 2012/13. The most important cooperative involved in coffee exports is the Oromia Coffee Coopera-
tive Union, which over this period accounted for 57 percent of the export transactions made by cooperatives.
Other important cooperatives include the Yirgacheffe, Sidama, and Kafa Forest Coffee Cooperatives.
Third, there also is large variation in the share of exports made by parastatal firms. They were the source
of 3 to 4 percent of all coffee exports until the end of 2008. However, their share increased to more than 10 per-
cent at the end of 2009. This was mostly driven by the seizure of coffee stocks of a number of large traders by
the government.12 These stocks were then consequently exported by EGTE on behalf of the government (Alemu,
2009). Since the end of 2009, the share of coffee exports coming from parastatals has been diminishing as many
state farms were privatized over this period. These include the Bebeka and Teppi Coffee Plantations of the Cof-
fee Plantation and Development Enterprise, which were privatized in 2011/12 and 2012/13, respectively. The
Limu Coffee Plantation was the last to be privatized in 2014. Currently, there are no more state coffee plantations
in Ethiopia.
12 Alemu (2009) states that the government received 21 million dollars from exporting the seized stock owned by the six coffee exporters.
0.0
0.2
0.4
0.6
0.8
1.0
1.2
1.4
1.6
1.8
J F M A M J J A S O N D
average 2003-2007
average 2008-2012
overall average 2003-2012

9
SUMMARY | APRIL 2010
Figure 7—Share of coffee exports by cooperatives and parastatal firms, 2006 to 2013 at six-month intervals
In short, we see a significant number of structural changes in the coffee sector over the last decade. First,
we see a decline in concentration ratios in the export sector over time. Second, seasonality in coffee exports is
pronounced with most exports being shipped between March and June. There also has been a recent shift in the
major peak of exports to a later period in the year. Third, we find variation in the share of cooperatives (increasing
over time) and parastatals (first an increase and then a decrease) in total exports over time. However, their share
in total exports is relatively small. Overall, we note an increase in the number of exporters and increasing diver-
sity of players (e.g. private sector, cooperatives, parastatals) in the export market. However, the shares of incum-
bent firms are large, possibly because of the expertise and reputation required to gain market share in the coffee
export business, as well as problematic access to trade credit for new entrant firms, especially (World Bank,
2014).
5. COFFEE QUALITY
There are several measures of coffee quality in the Ethiopian market place. They include, most importantly, certi-
fication, which affects marketability and prices, but not necessarily the intrinsic quality of the coffee; geographical
indications of origin; grades; and washing. Each is discussed in turn.
Certification and traceability have become major new requirements in the global food trade (Swinnen,
2007), with such certification schemes often implemented to add value to a product (Jena et al., 2012). By guar-
anteeing the product origin, fair prices to producers, ethical standards of production and processing, environmen-
tal sustainability in production, and safety and quality safeguards for a product, international buyers and consum-
ers are often willing to pay extra for a product. Conversely, adhering to those new requirements can be costly. In
the global coffee sector, it is estimated that around 16 percent of current coffee production is certified. This share
should reach over 25 percent by 2015 (Panhuysen and Van Reenen, 2012). There are currently a number of cer-
tification schemes in place, most importantly Fair Trade, Organic Coffee, Bird-Friendly, UTZ, and Global Forest
Alliance. In the case of Ethiopia, the share of certified coffee is increasing, but is significantly lower than in other
countries. For example, data from the Ministry of Trade show that only 2 percent of coffee transactions over the
period 2006-2013 were done under the Fair Trade scheme. This suggests that Ethiopia likely foregoes the com-
mercial rewards of the price premiums associated with these certification schemes. Figure 8a illustrates the size
of the certification premium over the period 2006 to 2013. It is observed that the density function of prices of certi-
fied coffee is distinctively to the right of non-certified coffee.
0
2
4
6
8
10
12
per
cen
t
cooperatives
parastatal

10
SUMMARY | APRIL 2010
Figure 8—Quality premiums for coffee certification and washing, 2006 to 2013
a. Premium certified coffee b. Premium washed coffee
Second, the quality of coffee can be increased by washing, i.e. processing red cherries immediately after
harvest in wet mills, instead of sun-drying the cherries (Nure, 2009). Washed coffee preserves the intrinsic quality
of the bean better than unwashed beans, and the process leads to homogenous coffee with fewer defective
beans. The washing process is carried out in washing stations where cherries are pulped immediately after har-
vesting, fermented in tanks, and washed in clean water to remove the mucilage. The wet parchment coffee is
then dried in the sun. For unwashed coffee, cherries are dried on mats or concrete floors. After drying, the outer
layer of the cherries is removed by hulling in coffee processing plants. Figure 8b (the right panel) is a graph of the
price density functions for washed and unwashed coffee over the period 2006 to 2013. The graph reflects the sig-
nificant rightward shift for the distribution of the export prices of washed coffee, illustrating the premium paid for
washed coffee over unwashed coffee. However, this price difference might be linked to other explanatory varia-
bles as well. We explore this below through the use of multivariate regression analysis.
Given the sizable premiums for washed coffee in international markets, investments in a number of coffee
producing countries have focused on setting up more wet mills. Figure 9 shows the share of coffee exports from
Ethiopia that were washed. As shown in the linear trend line, the share of washed coffee in total exports has not
changed significantly over time, remaining close to 30 percent. We see strong seasonality in the exports of
washed coffee. The importance of washed coffee is higher at the beginning of the year, reflecting the fact that
washed coffee is coming earlier to market than the unwashed coffee.
Figure 9—Shares of washed coffee in total exported coffee quantities, monthly, 2006 to 2013
0
.00
2.0
04
.00
6.0
08
Den
sity
0 100 200 300 400 500US cents/lb)
non-certified certified
0
.00
5.0
1
Den
sity
0 100 200 300 400 500US cents/lb)
unwashed washed
0
10
20
30
40
50
60
70
80
0
5,000
10,000
15,000
20,000
25,000
30,000
35,000
2006 2007 2008 2009 2010 2011 2012 2013
per
cen
t
ton
s
unwashedwashedshare washedLinear (share washed)

11
SUMMARY | APRIL 2010
The Coffee Liquoring Unit (CLU) grades the quality of each exported lot of coffee beans, for both washed
and unwashed coffee, based on physical and cup inspection. Grades range from 1 to 5, where 1 is the best and
highest grade and 5 is the lowest. Ungraded (U.G.) is the worst quality and this coffee is destined to those export
markets where there is less demand for quality or alternatively, this type of coffee quality is not allowed to be ex-
ported and is sold on the local market. Grades 1 and 2 and grades 3, 4, and 5 are assigned to washed and un-
washed coffee, respectively. Overall, we find a slight increase in quality over the study period for both washed
and unwashed coffee. For the unwashed bean market segment, the share of the worse qualities (grade 5) has
been decreasing slightly over time, while the share of grade 4 has been increasing slightly (Figure 10b). In
2006/07, 24 percent of unwashed coffee was grade 4, but this increased to 31 percent in 2012/13. We see little
changes over time in the quality grades for washed coffee (Figure 10a). However, there is a small decline in the
low quality washed U.G.
Figure 10—Evolution of grades within washed and unwashed market segment, 2006 to 2013 at six-month intervals
a. Washed b. Unwashed
Third, the geographic origin of coffee is an important quality consideration, as it is strongly related to taste.
In our analysis, we distinguish between Sidama, Jimma, Wollega (Nekempt), Yirgacheffe, Limu, Harar, and other
coffees.13 Kufa (2012) associates tastes and regions as follows: spicy for Sidama, fruity for Wollega (Nekempt),
floral for Yirgacheffe, winy for Limu and Jimma, and mocha for Harar. Figure 11a shows the export share in quan-
tity over time of the different origins of coffee. The three major coffee types that are exported are Sidama, Jimma,
and Nekempt. While our data shows significant variation of the shares of different origins over the time period,
there are no systematic trends. The combined share of these three major regions has stayed stable over the
years at around 80 percent. Figure 11b further illustrates that, while the shares of the premium quality coffees of
Harar and Yirgacheffe in total exports is relatively small in quantity, they are higher in value terms given their rela-
tively high prices.
13 It is to be noted that some coffees are put in these categories even though they might be produced in areas that are located outside these geograph-ical delineations.
0%
10%
20%
30%
40%
50%
60%
70%
80%
90%
100%
20
06-2
20
07-1
20
07-2
20
08-1
20
08-2
20
09-1
20
09-2
20
10-1
20
10-2
20
11-1
20
11-2
20
12-1
20
12-2
20
13-1
Washed U.G.
Grade 2
Grade 1
0%
10%
20%
30%
40%
50%
60%
70%
80%
90%
100%
20
06-2
20
07-1
20
07-2
20
08-1
20
08-2
20
09-1
20
09-2
20
10-1
20
10-2
20
11-1
20
11-2
20
12-1
20
12-2
20
13-1
Unwashed U.G.
Grade 5
Grade 4
Grade 3

12
SUMMARY | APRIL 2010
Figure 11—Export share of the different producing regions by quantity and value, 2006 to 2013 at six-month intervals
a. Quantity b. Value
To understand the links of different associated variables with measures of coffee quality, we ran a regres-
sion on two main quality indicators, i.e. certification and washed coffee (Table 2). In the left columns, we present
the results of a probit regression where we regress washed (1) versus unwashed (0) on a number of associates.
As expected, we find that washed coffee is exported earlier in the year. The coefficients for the dummy variables
for February, March, and April are positive and significant, while those for the rest of the year are negative. This
indicates that washed coffee is significantly less likely to be exported in the latter period of the year compared to
the default month January. We also find that there are strong linkages of washed coffee with regional dummies.
Compared to the default region Sidama, Yirgacheffe has a significantly higher likelihood to export washed coffee.
On the other hand, Jimma and Wollega (Nekempt) coffee exports are much less likely to be washed. No washed
coffee is exported from the region of Harar and no coefficient estimates are therefore available. We also note that
certification schemes as well as the type of exporters are strongly linked with washed coffee exports. Parastatals,
cooperatives, state farms, and commercial private farms are significantly more likely to export washed coffee than
are private sector traders. Fair Trade coffee is also much more likely to be washed.
0
10
20
30
40
50
60
70
80
90
100
20
06-2
20
07-1
20
07-2
20
08-1
20
08-2
20
09-1
20
09-2
20
10-1
20
10-2
20
11-1
20
11-2
20
12-1
20
12-2
20
13-1
Other
Harar
Limu
Yirgacheffe
Nekempt
Jimma
Sidama0%
10%
20%
30%
40%
50%
60%
70%
80%
90%
100%
20
06-2
20
07-1
20
07-2
20
08-1
20
08-2
20
09-1
20
09-2
20
10-1
20
10-2
20
11-1
20
11-2
20
12-1
20
12-2
20
13-1
Other
Harar
Limu
Yirgacheffe
Nekempt
Jimma
Sidama

13
SUMMARY | APRIL 2010
Table 2—Factors associated with the export of washed and certified coffee – probit model
For the factors associated with certified coffee, Yirgacheffe coffee is more likely to be certified than is
Sidama coffee, the default category of origin. Coffee from other zones of origin is less likely to be certified. We
note higher shares of certified coffee are exported at the beginning of the year, which also suggests that most
certified coffee is washed. Although there is high volatility, the prevalence of certification in general is increasing
over time, as seen by the generally increasing positive coefficients linked with the year dummy variables. Cooper-
atives and private commercial farms are significantly more likely to export certified coffee. This is presumably be-
cause they are not required to transact on the ECX platform, and trading certified coffee on the ECX platform was
not an option over the period considered.
Unit Coef. z-value* Coef. z-value*
Type of exporter (default=private)
Cooperative yes=1 0.530 8.06 3.452 61.39
Parastatal yes=1 1.042 7.53 0.000 -
State farm yes=1 1.358 9.54 0.000 -
Private commercial farm yes=1 0.389 4.85 1.924 25.34
Region of origin (default=Sidama)
Jimma yes=1 -5.098 -22.23 -0.832 -12.41
Wollega/Lekempte yes=1 -3.126 -26.51 -0.958 -8.35
Yirgacheffe yes=1 1.495 33.15 0.137 2.51
Limu yes=1 0.936 13.36 -0.852 -8.14
Harar yes=1 - - -1.016 -8.44
Other yes=1 -0.572 -8.48 -0.339 -2.43
Certificate
Fair Trade yes=1 0.799 8.06 - -
Organic yes=1 -0.131 -1.91 - -
Year (default=2006)
2007 yes=1 0.210 2.77 0.057 0.38
2008 yes=1 0.188 2.32 0.015 0.09
2009 yes=1 0.174 2.15 -0.372 -2.48
2010 yes=1 0.153 2.11 0.126 0.91
2011 yes=1 -0.123 -1.62 0.060 0.42
2012 yes=1 0.039 0.49 0.243 1.74
2013 yes=1 -0.253 -2.86 -0.067 -0.42
Month (default=January)
February yes=1 0.472 4.46 0.067 0.47
March yes=1 0.436 4.28 0.014 0.09
April yes=1 0.084 0.89 -0.024 -0.18
May yes=1 -0.290 -3.11 0.016 0.12
June yes=1 -0.332 -3.59 0.012 0.09
July yes=1 -0.351 -3.72 -0.190 -1.38
August yes=1 -0.463 -4.80 -0.567 -4.15
September yes=1 -0.435 -4.38 -0.284 -2.01
October yes=1 -0.542 -5.34 -0.170 -1.11
November yes=1 -0.549 -5.07 -0.007 -0.05
December yes=1 -0.413 -2.82 -0.352 -1.75
Intercept 0.395 3.71 -2.513 -14.07
Number of observations 28220 28893
Wald chi2(29) 3455 5716
Prob>Chi2 0 0
Pseudo R2 0.6147 0.7277
* robust standard errors; z-values in bold are significant at the 5 percent level
Washed coffee Certification

14
SUMMARY | APRIL 2010
6. COFFEE EXPORT DESTINATION MARKETS
In this section, we look more closely at the export destination markets. Ethiopian coffee was exported on average
to about 50 countries annually over the period 2005 to 2012. Figure 12 shows the share of different destination
markets for coffee exported from Ethiopia in 2012. The largest share of coffee exports went to Germany. It ac-
counts for one-third of Ethiopia’s coffee exports. The second most important importing country of Ethiopian coffee
is Saudi Arabia, accounting for 12 percent of coffee exports.
Figure 12—Share of different destination markets for Ethiopia’s coffee exports in 2012
Figure 13 shows how the share of the different destination markets has evolved over the period 2005 to
2012. We note a number of changes. While the share of Japan was almost 20 percent in the year 2005, this de-
clined to considerably lower levels in 2009, as Japan halted deliveries of coffee from Ethiopia in May 2008 after
finding abnormally high pesticide residues in a shipment of coffee beans (Oakes and Thompson, 2009). This
problem has since been addressed and the share of coffee exports to Japan is slowly increasing. We also see
some increase in diversification of destinations. While exports to countries outside Europe, North America, Japan,
and Saudi Arabia made up 5 percent of the export market in 2005, this share was more than 10 percent in 2012.
Moreover, while no coffee was exported to Sudan in 2006, its share rose to 4 percent in 2012.
Figure 13—Share of different destination markets in Ethiopia’s coffee exports
GERMANY33%
S/ARABIA12%BELGIUM
8%JAPAN
7%
U.S.A.6%
FRANCE6%
ITALY5%
SUDAN4%
SWEDEN3%
KOREA2%
JORDAN2%
AUSTRALIA2%
U.K.1%
Other9%
0%
10%
20%
30%
40%
50%
60%
70%
80%
90%
100%
2005 2006 2007 2008 2009 2010 2011 2012
Europe
Japan
North America
Saudi Arabia
Sudan
Other
15
SUMMARY | APRIL 2010
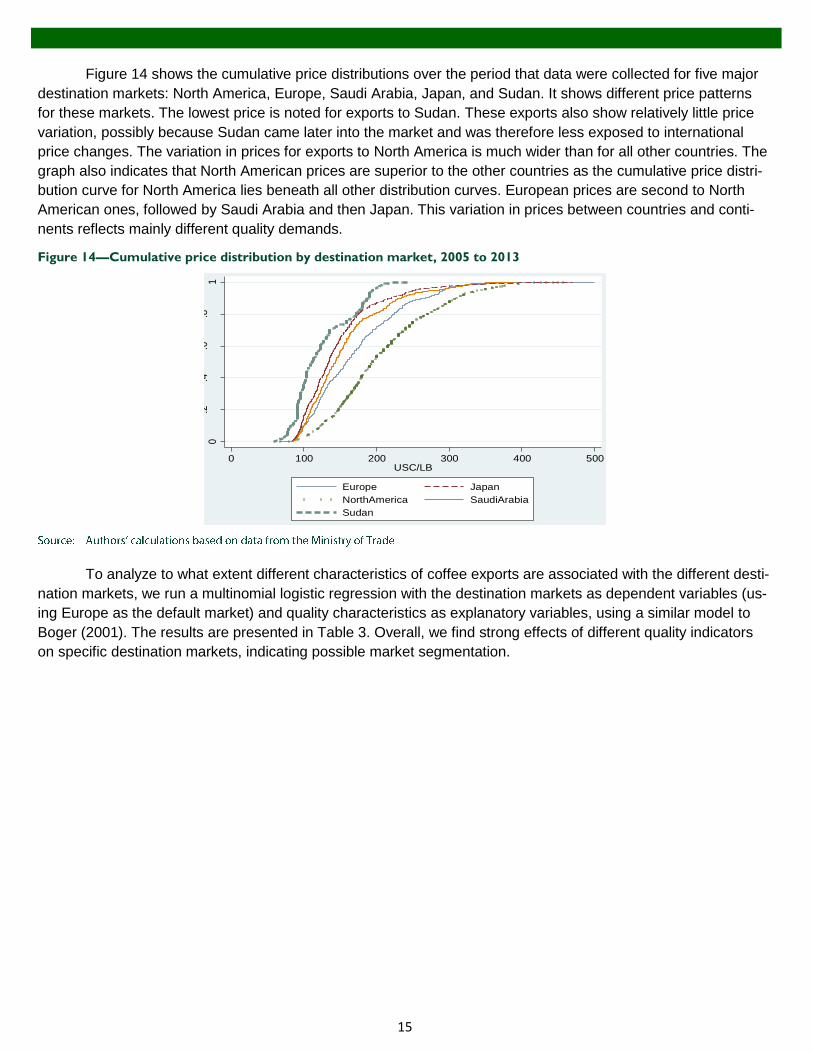
Figure 14 shows the cumulative price distributions over the period that data were collected for five major
destination markets: North America, Europe, Saudi Arabia, Japan, and Sudan. It shows different price patterns
for these markets. The lowest price is noted for exports to Sudan. These exports also show relatively little price
variation, possibly because Sudan came later into the market and was therefore less exposed to international
price changes. The variation in prices for exports to North America is much wider than for all other countries. The
graph also indicates that North American prices are superior to the other countries as the cumulative price distri-
bution curve for North America lies beneath all other distribution curves. European prices are second to North
American ones, followed by Saudi Arabia and then Japan. This variation in prices between countries and conti-
nents reflects mainly different quality demands.
Figure 14—Cumulative price distribution by destination market, 2005 to 2013
To analyze to what extent different characteristics of coffee exports are associated with the different desti-
nation markets, we run a multinomial logistic regression with the destination markets as dependent variables (us-
ing Europe as the default market) and quality characteristics as explanatory variables, using a similar model to
Boger (2001). The results are presented in Table 3. Overall, we find strong effects of different quality indicators
on specific destination markets, indicating possible market segmentation.
0.2
.4.6
.81
0 100 200 300 400 500USC/LB
Europe Japan
NorthAmerica SaudiArabia
Sudan

16
SUMMARY | APRIL 2010
Table 3—Multinomial logistic regression model of destination markets for Ethiopian coffee
(default = Europe)
First, Japan and the Middle East are more likely to import unwashed coffee than are other countries. The
impression of washed coffee being cleaner is strong in the US and Europe. Japan and the Middle East generally
prefer unwashed coffee for a presumed better and richer natural taste (Tefera and Tefera, 2013). These different
preferences for washed and unwashed coffee are illustrated in Figure 15. Second, we see significant differences
in demand for different grades. For example, Sudan is more likely to import ungraded coffee, both washed and
unwashed. Third, different destination markets import coffees from different specific regions. The Middle East is
much more likely to import coffee that originates from Harar and from Wollega (Nekempt). Japan and North
America import relatively more coffee from Yirgacheffe than do European importers. African importers focus
mostly on the lower priced coffees from Wollega and Jimma. Fourth, coffee with Fair Trade certificates are more
likely to be exported to Europe than to other destinations. Organic coffee on the other hand is in greatest demand
by North American markets. These markets also import relatively more coffee from cooperatives than the other
destination markets. Overall, these results suggest that quality differences explain an important part of the signifi-
cant differences in prices between destination markets. This will be further discussed below.
Mean
Unit share Coef. z-value Coef. z-value Coef. z-value Coef. z-value Coef. z-value
Washed coffee (grade 2 = default) 0.37
Grade 1 yes=1 0.01 2.43 10.39 1.57 7.57 -14.91 -0.01 -13.47 0.00 1.74 7.71
Un-graded yes=1 0.02 -1.20 -4.04 -0.84 -6.49 -1.03 -2.02 2.16 2.84 -1.40 -5.89
Unwashed coffee
Grade 3 yes=1 0.02 1.49 7.96 1.60 12.54 -1.07 -1.05 -14.50 -0.01 1.84 12.84
Grade 4 yes=1 0.18 2.66 37.69 0.81 12.67 1.36 9.61 -1.48 -1.07 1.73 25.02
Grade 5 yes=1 0.36 -0.23 -2.13 -1.46 -12.20 2.75 16.26 -1.75 -1.63 -0.58 -4.66
Un--graded yes=1 0.05 1.18 6.77 -0.47 -2.35 2.99 12.89 5.18 4.87 -0.39 -1.50
Region of origin (default=Sidama)
Jimma yes=1 0.24 0.55 5.57 0.93 7.92 -1.94 -12.55 4.60 4.90 0.82 6.96
Wollega/Lekempte yes=1 0.15 0.76 9.22 -0.32 -2.58 0.97 6.92 1.06 1.00 -0.31 -2.66
Yirgacheffe yes=1 0.12 0.69 7.21 1.41 25.70 -1.04 -3.12 0.74 0.86 1.39 19.75
Limu yes=1 0.05 -0.34 -1.98 0.76 9.92 -0.76 -2.04 0.66 0.58 0.89 9.22
Harar yes=1 0.07 0.02 0.11 1.90 15.96 3.53 24.76 -15.10 -0.01 1.61 13.46
Other yes=1 0.04 0.54 4.75 0.43 4.19 -0.62 -3.16 -15.87 -0.01 -0.32 -2.10
Certificate
Fair Trade yes=1 0.02 -2.19 -3.69 -0.14 -1.27 -0.65 -0.81 -14.04 -0.01 0.08 0.53
Organic yes=1 0.09 0.15 0.97 0.72 8.41 -4.70 -4.59 -15.28 -0.01 0.57 4.73
Type of exporter (default=private) 0.81
Cooperative yes=1 0.10 -0.60 -3.99 0.58 6.93 -0.09 -0.46 1.12 1.48 -0.16 -1.34
Parastatal yes=1 0.03 -1.50 -6.27 -0.76 -5.33 -1.41 -6.88 -19.58 -0.01 -0.36 -2.68
State farm yes=1 0.03 0.06 0.38 -0.63 -4.49 -0.90 -2.11 -18.37 -0.01 -0.10 -0.69
Private commercial farm yes=1 0.03 -0.09 -0.55 1.44 16.80 -0.20 -0.73 -18.36 -0.01 0.09 0.65
Intercept -2.70 -45.09 -1.93 -48.57 -3.67 -35.87 -7.34 -12.74 -2.46 -47.58
Number of observations 30354
LR chi2(106) 27945
Prob > chi2 0
Pseudo R2 0.32
* z-values in bold are significant at the 5 percent level
Japan North-America Middle East Africa Other

17
SUMMARY | APRIL 2010
Figure 15—Share of exports of washed and unwashed coffee by export destination, 2005 to 2013
7. PERFORMANCE OF ETHIOPIA’S COFFEE EXPORT SECTOR
7.1. Values and quantities
We start with a discussion of the performance of the coffee sector through an analysis of the changes in quanti-
ties and values of coffee exports. Figure 16 shows how the values, in real USD14, and quantities of coffee exports
have evolved over the last 10 years. To illustrate trends over time, we plot 12-month moving averages for value
and quantity that we equate to 100 percent for January 2003 and then add linear trend lines to these plots. There
are two main findings. First, we see large growth rates in the values and quantities of coffee exported. Figure 16
illustrates that the real value of Ethiopia’s coffee exports at the end of 2012 was four times higher than it was at
the beginning of 2003. The value of exports in nominal terms was five times as high. Quantities exported also
increased by 50 percent over the same period. Even though the growth rate in quantity terms is much smaller
than for real values, this is still an impressive performance. Second, we see a significant drop in the real value
and the quantity of exports from the trend line in 2009, indicating a bad production year as well as disruption to
coffee exports with the revocation of export licenses. However, exports have increased and remained on an up-
ward trend since then.
Figure 16—Trends in real value and quantities of coffee exports from Ethiopia, 2003 to 2012 (Jan. 2003=100; 12-month
moving average)
14 Deflated by the US CPI downloaded from http://www.usinflationcalculator.com/inflation/consumer-price-index-and-annual-percent-changes-from-1913-to-2008/
0% 20% 40% 60% 80% 100%
Europe
Japan
North-America
Middle East
Africa
Other
Washed Unwashed
0
50
100
150
200
250
300
350
400
450
Ind
ex
valuevolumeLinear (value)Linear (volume)

18
SUMMARY | APRIL 2010
The change in the real value of exports is largely driven by the increasing international prices offered for
Ethiopian coffee. In the next two sections, we explore to what extent international price changes and quality
changes (rewarded in quality premiums) in exported coffee from Ethiopia, have contributed to this change.
7.2. Changes in international coffee prices
Figure 17 compares the export prices, as reported by the Ministry of Trade, and the composite price of Brazilian
natural Arabica coffee, as constructed by the International Coffee Organization (ICO), based on coffee futures
contracts in commodity exchanges in London and New York. The graph illustrates the large variations found in
coffee prices over time. Coffee prices in 2011 were five times higher than prices in 2002, with the price in 2011 at
around 2.5 USD per lb, compared to 0.5 USD per lb in 2002. While the price has come down significantly since
its peak in 2011, prices in mid-2013 had not yet declined to the low level of 2002. This large price variability in
recent years has led both to increasingly unpredictable windfalls and losses in Ethiopia’s export sector. Several
key informants reported that a lack of hedging instruments in local coffee markets, such as futures contracts, was
a source of weakness in the coffee sector in the face of this price variability in Ethiopia. The graph further shows
a strong correlation and synchrony between export and international prices. The reported export prices are
mostly higher than the ICO composite price, reflecting the relatively good quality Arabica coffee produced in Ethi-
opia. However, a drop below the ICO price is seen in 2010 and 2011. The reasons for this are unclear, although
this pattern in the relationship of the two prices has since been reversed.
Figure 17—Trends in Ethiopian export coffee price versus reference international coffee price, 2002 to 2013
In principle, all marketed coffee in Ethiopia has to go through the ECX to determine the quality standard of
the coffee. If the quality of coffee is judged to be of export quality, then it must be exported and cannot be sold
locally. This makes the local market a residual market, where prices are in theory detached from international
prices. Given the government’s need of foreign currency to finance its ambitious development agenda, it may be
the case that this export requirement has become increasingly stringent over time and there has been less coffee
supplied to local markets. This pattern is possibly confirmed in Figure 18 where we compare the retail prices for
coffee in Addis Ababa markets, as collected by the Central Statistical Agency, with export prices for coffee. We
plot monthly differences as well as 12-month moving averages of that difference to more accurately discern the
trend.15 While the retail prices for coffee beans in Addis Ababa was 20 cents lower per pound than export prices
in the years 2002 and 2003, this difference was reversed in 2011 and 2012 when local prices in Addis Ababa
15 Unfortunately, we cannot control for changes in coffee quality over time, but it seems safe to assume that these do not explain these trends.
0
50
100
150
200
250
300
US
cen
ts p
er lb
NY/London price
export price

19
SUMMARY | APRIL 2010
were 20 cents or higher per pound than export prices. More recently, the price difference has readjusted so that
the prices are now considerably closer, possibly because of the development of a black market (Fikade, 2014).
Such informal markets are encouraged to flourish, given the possible rewards obtained from channeling export
quality coffee to domestic markets.
Figure 18—Difference between Addis Ababa retail coffee price and the Ethiopia coffee export price, 2002 to 2013 by
month
In contrast with most coffee exporting countries, Ethiopia is itself a major consumer of coffee. The im-
proved export performance over the last decade raises the important question about the extent to which this
change is linked to high international prices and a subsequent shift from domestic consumption to export mar-
kets. A negative price elasticity, as is commonly seen for most agricultural products, would suggest that part of
the total increase of coffee exports is explained by reduced consumption. This is especially the case in a situation
where prices have changed dramatically, as in the last decade.
The analysis of the data from the National Household and Income Surveys (HICES) of 2000 and of 2011,
indicate that coffee expenditures were 40 Birr per adult equivalent in 2000 and 206 Birr in 2011. When these ex-
penditures are divided by the average annual retail prices for whole dried coffee beans, this implies a consump-
tion per adult equivalent of 8.7 kg in 2000 and 5.9 kg in 2011, or a decline by one-third in coffee consumption by
Ethiopian households. However, given that different methodologies were followed for the implementation of these
surveys over time, the interpretation should be treated with caution (Stifel and Woldehanna, 2013). However, the
Ethiopian Rural Household Survey (ERHS), a comprehensive panel survey in fifteen Ethiopian villages, shows
that weekly household coffee consumption declined from 1.0 kg in 1997 to 0.7 kg in 2009, again a decline by 30
percent. Evidence from these consumption surveys therefore seem to suggest that the higher exported quantities
in the last decade are at least partly driven by reduced local consumption of coffee.
7.3. Quality premiums offered for Ethiopian coffee
To arrive at the implicit price of product attributes, the hedonic pricing method is widely used. If the marginal yield
of most characteristics and the implicit price for each attribute is assumed constant, a hedonic price regression
can be estimated where the price of a product is a function of the characteristics of the product, for example,
through variety choices or post-harvest technologies. A simple model of the following form can then be run:
k
hh XpN
0k
kh
-40
-30
-20
-10
0
10
20
30
40
50
60
US
cen
ts p
er lb
.
Dashed line is actual price difference; solid line is 12-month moving average of the price difference

20
SUMMARY | APRIL 2010
where ph is the price of the product h, Xkh is the quantity of the attribute k of the product h, βkh the implicit price,
and ν a stochastic error term. Similar approaches have been used in coffee pricing studies by, for example, Teu-
ber (2010), Teuber and Herrmann (2012), and Donnet et al. (2007, 2008). We discuss the results of similar exer-
cises below. In all the regressions that were run, robust standard errors were estimated.
In a first specification of the hedonic price model presented in Table 4, we regress the logarithm of prices
in US cents per lb on quantity exported, the origin of the coffee, certification, type of exporters, and yearly dummy
variables. We find a strong effect of origin on export prices. Compared to the Sidama default value, Jimma coffee
is exported at a 32 percent lower price. It is the least valuable export coffee in Ethiopia. Wollega (Nekempt) also
has a negative coefficient – its price is 23 percent lower than the Sidama price. In terms of place of origin, the
most valued coffees are from Yirgacheffe and Harar, with premiums of 19 percent and 7 percent, respectively,
over Sidama. We also find that certification raises prices significantly. Fair Trade and Organic certification gener-
ate premiums of about 9 percent, other things being equal. Finally, coffee exported by cooperatives and private
commercial farms obtains higher export prices compared to that exported by private exporters. The premium for
cooperatives and private commercial farms is 16 percent and 5 percent, respectively. As we control in the regres-
sion for the quality of the coffee and certification, this premium might partly reflect the willingness of buyers to pay
for vertical integration in sourcing their coffee from Ethiopia. We further note significant changes in the year dum-
mies, reflecting large international price variability over the period considered.
In a second specification, we add a dummy variable to reflect the washing of coffee. We find that washed
coffee raises the export price by a premium of 20 percent on average over the period considered. We also note
that the coefficients on the region of origins change significantly with the inclusion of the washed coffee dummy in
the hedonic price model. There is now significantly less variability between the regions. While the price range be-
tween the highest (Yirgacheffe) and the lowest (Jimma) priced regions was almost 51 percent in the first model
specification, this was reduced to 38 percent in the second specification (Harar versus Jimma), indicating that a
significant part in regional price variation is explained by the processing method followed. By controlling for wash-
ing, coffee originating from Harar is shown to be the most expensive in the country, with an average price pre-
mium of 20 percent over Sidama.
In a third specification, we add within the washed and unwashed categories the different quality grades as
measured by the CLU. We find that the grades within each segment lead to significantly different premiums, and
that the premiums attached to the grades are consistent with what would have been expected, i.e. better prices
offered for better quality grades. In the washed segment, grade 1 coffee is sold at a premium of 20 percent while
un-graded washed coffee is sold at a price that is 23 percent lower than grade 2 washed coffee. In the unwashed
segment, grade 5 is sold at a price 8 percent lower than grade 4, while grade 3 has a price that is 32 percent
higher than grade 4. Note that ungraded washed coffee is more valuable than ungraded unwashed coffee.
Fourth, we interact the washing dummy with the year dummy, reflecting the returns to washing for each
year separately. We find that washing in all years adds a premium relative to the price of unwashed coffee. In all
cases, this interacted coefficient is significant and positive. However, the premium is highly volatile between
years, seemingly linked with the high volatility of international prices. The premium was lowest during 2006 and
2007 at between 15 and 18 percent. The premium then increased to 34 percent and 24 percent in 2009 and
2010, respectively. In 2012, when prices decreased during the period of sales of the unwashed coffee, the pre-
mium of washed coffee came down but still resulted in a premium of 21 percent over unwashed coffee. This vola-
tility in the price premium associated with washing coffee leads to uncertain pay-offs to investments in coffee
washing mills.

21
SUMMARY | APRIL 2010
Table 4—Determinants of coffee prices (log(US cents per lb)); hedonic price model
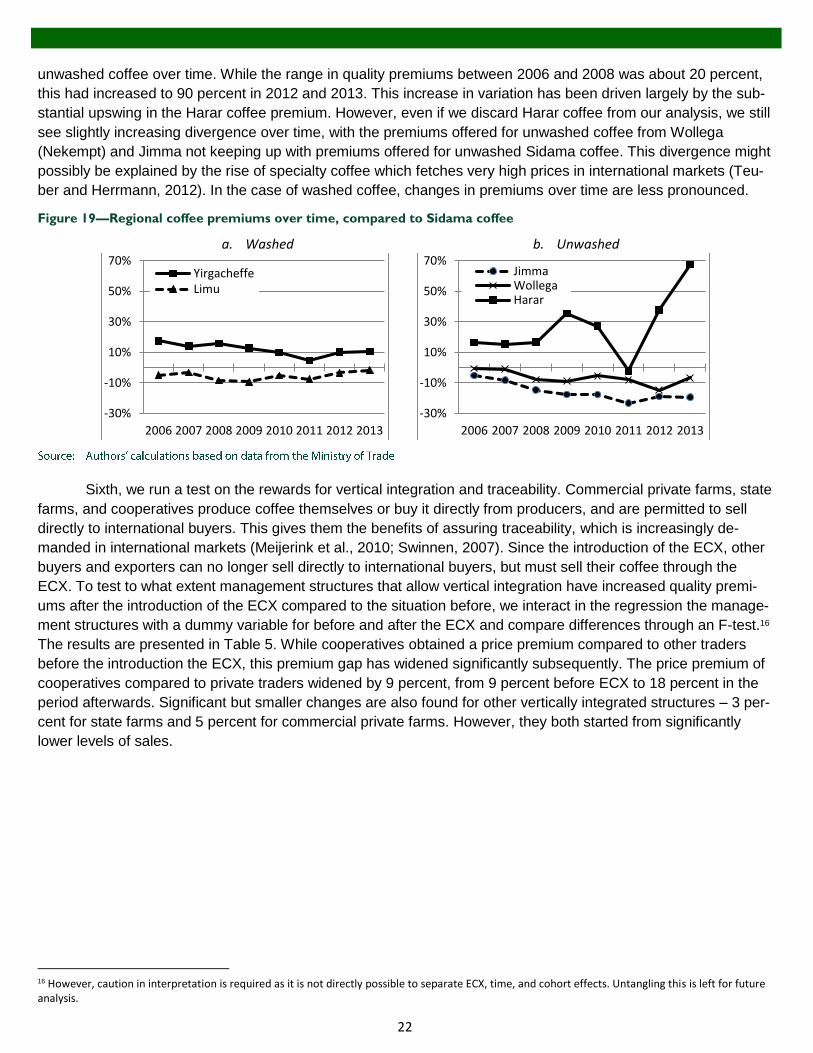
In a fifth model specification, we use the second model specification, but interacted yearly dummies with
geographical indicators and split up the regression between washed and unwashed coffee. In Figure 19, we plot
the quality premiums compared to coffee of Sidama origin. We see increasing divergence of quality premiums for
Unit Coef. t-value* Coef. t-value* Coef. t-value* Coef. t-value*
Quantity exported log() -0.038 -26.82 -0.037 -26.53 -0.023 -18.30 -0.036 -26.55
Washed coffee yes=1 0.202 55.41
Washed coffee (grade 2 = default)
Grade 1 yes=1 0.196 13.29
Un-graded yes=1 -0.230 -39.77
Unwashed coffee
Grade 3 yes=1 0.057 4.86
Grade 4 yes=1 -0.259 -88.13
Grade 5 yes=1 -0.344 -67.38
Un--graded yes=1 -0.497 -64.17
Region of origin (default=Sidama)
Jimma yes=1 -0.320 -116.37 -0.188 -52.02 -0.051 -10.00 -0.186 -52.13
Wollega/Lekempte yes=1 -0.234 -76.94 -0.106 -28.39 -0.015 -3.19 -0.103 -27.98
Yirgacheffe yes=1 0.192 55.25 0.136 37.34 0.104 35.63 0.135 37.73
Limu yes=1 0.006 1.34 -0.041 -9.26 -0.055 -13.65 -0.043 -9.83
Harar yes=1 0.068 14.04 0.200 37.10 0.290 51.52 0.202 36.65
Other yes=1 -0.071 -9.90 -0.030 -4.50 -0.011 -1.69 -0.029 -4.41
Certificate
Fair Trade yes=1 0.089 13.43 0.053 8.21 0.057 8.97 0.043 6.53
Organic yes=1 0.095 13.46 0.096 13.94 0.076 12.07 0.098 14.22
Type of exporter
Cooperative yes=1 0.157 23.21 0.146 22.01 0.154 25.38 0.146 21.79
Parastatal yes=1 -0.008 -1.44 -0.029 -6.04 -0.042 -9.24 -0.024 -5.17
State farm yes=1 -0.018 -3.04 -0.063 -11.04 -0.082 -14.02 -0.065 -11.55
Private commercial farm yes=1 0.048 6.33 0.041 5.38 0.030 5.08 0.041 5.51
Year (default=2006)
2007 yes=1 0.112 26.57 0.101 27.47 0.093 27.43 0.115 27.13
2008 yes=1 0.343 83.49 0.332 92.90 0.319 98.31 0.335 83.60
2009 yes=1 0.222 43.77 0.208 47.40 0.204 51.22 0.140 26.64
2010 yes=1 0.335 79.37 0.324 89.45 0.319 97.00 0.305 71.68
2011 yes=1 0.753 157.44 0.745 171.10 0.744 181.94 0.756 134.65
2012 yes=1 0.671 150.9 0.664 167.81 0.651 177.18 0.655 138.13
2013 yes=1 0.445 83.35 0.436 89.10 0.415 93.68 0.444 64.34
Year interacted with washing
2006 yes=1 0.183 23.21
2007 yes=1 0.155 30.43
2008 yes=1 0.180 34.29
2009 yes=1 0.345 51.42
2010 yes=1 0.237 49.16
2011 yes=1 0.160 26.09
2012 yes=1 0.212 34.68
2013 yes=1 0.174 21.33
Intercept 5.131 343.94 5.001 331.51 5.096 393.46 5.002 333.27
Number of observations 30333 30333 30207 30333
F() 6830.0 7870.6 8035.9 6239.5
Prob>F 0.00 0.00 0.00 0.00
R-squared 0.78 0.81 0.85 0.81
* robust standard errors; t-values in bold are significant at the 5 percent level
Specification 1 Specification 2 Specification 3 Specification 4
22
SUMMARY | APRIL 2010
unwashed coffee over time. While the range in quality premiums between 2006 and 2008 was about 20 percent,
this had increased to 90 percent in 2012 and 2013. This increase in variation has been driven largely by the sub-
stantial upswing in the Harar coffee premium. However, even if we discard Harar coffee from our analysis, we still
see slightly increasing divergence over time, with the premiums offered for unwashed coffee from Wollega
(Nekempt) and Jimma not keeping up with premiums offered for unwashed Sidama coffee. This divergence might
possibly be explained by the rise of specialty coffee which fetches very high prices in international markets (Teu-
ber and Herrmann, 2012). In the case of washed coffee, changes in premiums over time are less pronounced.
Figure 19—Regional coffee premiums over time, compared to Sidama coffee
a. Washed b. Unwashed
Sixth, we run a test on the rewards for vertical integration and traceability. Commercial private farms, state
farms, and cooperatives produce coffee themselves or buy it directly from producers, and are permitted to sell
directly to international buyers. This gives them the benefits of assuring traceability, which is increasingly de-
manded in international markets (Meijerink et al., 2010; Swinnen, 2007). Since the introduction of the ECX, other
buyers and exporters can no longer sell directly to international buyers, but must sell their coffee through the
ECX. To test to what extent management structures that allow vertical integration have increased quality premi-
ums after the introduction of the ECX compared to the situation before, we interact in the regression the manage-
ment structures with a dummy variable for before and after the ECX and compare differences through an F-test.16
The results are presented in Table 5. While cooperatives obtained a price premium compared to other traders
before the introduction the ECX, this premium gap has widened significantly subsequently. The price premium of
cooperatives compared to private traders widened by 9 percent, from 9 percent before ECX to 18 percent in the
period afterwards. Significant but smaller changes are also found for other vertically integrated structures – 3 per-
cent for state farms and 5 percent for commercial private farms. However, they both started from significantly
lower levels of sales.
16 However, caution in interpretation is required as it is not directly possible to separate ECX, time, and cohort effects. Untangling this is left for future analysis.
-30%
-10%
10%
30%
50%
70%
2006 2007 2008 2009 2010 2011 2012 2013
YirgacheffeLimu
-30%
-10%
10%
30%
50%
70%
2006 2007 2008 2009 2010 2011 2012 2013
JimmaWollegaHarar

23
SUMMARY | APRIL 2010
Table 5—Testing the benefits of vertical integration and traceability in the Ethiopian coffee export sector
Seventh, to understand international market segmentation, different hedonic regression models for differ-
ent destination markets are required (Teuber and Herrman, 2012). The results of these regression models are
presented in Table 6. A number of interesting findings are obtained. First, similar patterns to those detected in
Table 4 emerge over different countries – better grades are associated with higher prices; there are significant
differences in prices for coffee from different regions; and certification raises the price of coffee. However, the
size of these coefficients differs over destination markets. Second, ungraded coffee has the lowest negative pre-
mium in the case of exports to other African countries. The ungraded coffee that is exported to Japan gets the
best price of all ungraded exported coffee. Third, organic certificates are rewarded the highest prices in the Mid-
dle Eastern and North American markets, while Fair Trade coffee gets the best prices in Europe. Fourth, com-
pared to Europe, price rises over time have been higher in Japan. Prices for coffee exported to North America, on
the other hand follows, the prices for coffee exported to European markets more closely, while Middle Eastern
and African markets follow them less closely, other things being equal. Fifth, while vertical integration is rewarded
in the European, Japanese, and North American markets, this is seemingly not the case in the Middle East.
Unit Coef. t-value* Coef. t-value*
Regression coefficients
Type of exporter
Cooperative yes=1 0.091 13.72 0.181 23.38
Private commercial farm yes=1 -0.007 -0.49 0.055 6.30
State farms yes=1 -0.082 -11.93 -0.047 -6.22
Control variables similar as in specification 2
F-test of differences between period before ECX and after ECX
F() Prob>F
Cooperative 200.62 0.00
State farms 15.28 0.00
Private commercial farm 15.26 0.00
* robust standard errors; t-values in bold are significant at the 5 percent level
Before ECX After ECX

24
SUMMARY | APRIL 2010
Table 6—Determinants of coffee prices (log(US cents per lb)) by destination market; hedonic price model
Eighth, we run a simultaneous quantile regression in order to understand the relative importance of different price
determinants at lower and higher ends of the markets (e.g. Costanigro et al., 2010). The results for 5 quantile - at
0.10, 0.25, 0.50, 0.75 and 0.90 quantiles - regressions are presented in Table 7. We find that quality premiums
for indications of origins are increasing from lower to higher quantiles, indicating the greater importance of origin
effects in high-end markets. While the difference between the lowest (Limu) and the highest (Harar) coefficients
for the 0.10 quantile regression shows a difference of 27 percent, this gap increases to 44 percent for the 0.90
quantile regression. We also note increasing willingness to pay for vertical integration at the higher end of the
market as shown by higher positive coefficients for cooperatives (17 percent and 11 percent for the 0.90 and 0.10
quantile regression respectively) and for commercial private farms (7 percent and 2 percent for the 0.90 and 0.10
quantile regressions, respectively). Parastatals are less able to compete at the high end of the market as shown
Unit Coef. t-value* Coef. t-value* Coef. t-value* Coef. t-value* Coef. t-value*
Quantity exported log() -0.02 -13.43 -0.02 -6.24 -0.02 -7.08 0.00 -0.20 -0.01 -1.45
Washed coffee (grade 2 = default)
Grade 1 yes=1 0.23 6.55 0.12 3.79 0.19 9.63
Un-graded yes=1 -0.24 -41.60 -0.16 -2.73 -0.23 -9.25 -0.27 -2.58 -0.61 -6.66
Unwashed coffee
Grade 3 yes=1 0.06 2.23 -0.03 -0.62 0.06 3.93 -0.32 -20.05
Grade 4 yes=1 -0.29 -65.52 -0.25 -33.87 -0.19 -22.61 -0.18 -8.57 -0.58 -46.67
Grade 5 yes=1 -0.32 -37.59 -0.32 -19.69 -0.28 -11.42 -0.34 -13.59 -0.63 -12.92
Un--graded yes=1 -0.40 -28.30 -0.21 -8.93 -0.44 -7.11 -0.43 -13.76 -0.68 -14.21
Region of origin (default=Sidama)
Jimma yes=1 -0.08 -9.46 -0.01 -0.87 -0.13 -5.42 -0.08 -3.81 -0.09 -2.56
Wollega/Lekempte yes=1 -0.05 -5.50 0.02 3.18 -0.12 -6.18 -0.05 -2.61
Yirgacheffe yes=1 0.15 34.60 0.09 6.19 0.06 10.10 0.10 2.37 0.06 3.54
Limu yes=1 -0.06 -12.71 -0.05 -1.94 -0.07 -8.28 0.01 0.29 -0.69 -17.24
Harar yes=1 0.33 18.38 0.30 11.68 0.22 19.49 0.25 12.72
Other yes=1 -0.06 -7.01 0.10 5.80 -0.06 -3.62 0.01 0.43
Certificate
Fair Trade yes=1 0.08 9.21 -0.12 -2.15 0.03 2.20 0.00 -0.02
Organic yes=1 0.05 5.49 0.06 2.78 0.08 7.17 0.13 2.62
Type of exporter
Cooperative yes=1 0.16 18.28 0.12 6.02 0.15 14.01 0.02 0.53 0.25 15.37
Parastatal yes=1 -0.04 -7.36 -0.06 -3.50 -0.07 -3.84 -0.10 -4.18
State farm yes=1 -0.07 -11.42 -0.20 -9.49 -0.06 -2.90 -0.06 -0.77
Private commercial farm yes=1 0.00 0.03 0.07 2.34 0.05 4.22 -0.04 -1.23
Year (default=2006)
2007 yes=1 0.08 19.49 0.13 27.54 0.03 1.84 0.13 12.19 0.09 4.54
2008 yes=1 0.31 79.35 0.35 63.99 0.30 16.34 0.34 39.33 0.20 9.54
2009 yes=1 0.19 40.08 0.38 28.49 0.23 11.72 0.22 21.61 -0.07 -2.08
2010 yes=1 0.31 80.24 0.43 47.79 0.32 17.07 0.36 40.91 0.06 2.65
2011 yes=1 0.75 157.49 0.83 61.03 0.69 35.64 0.74 56.82 0.56 20.48
2012 yes=1 0.62 144.74 0.60 61.85 0.68 35.06 0.72 64.85 0.58 25.06
2013 yes=1 0.37 72.32 0.43 41.52 0.44 21.58 0.56 37.82 0.24 10.51
Intercept 5.10 306.68 5.03 156.20 5.14 127.53 4.85 91.39 5.34 63.84
Number of observations 15540 2885 4167 3643 1229
F() 4834 872 966 . .
Prob>F 0 0 0 . .
R-squared 0.87 0.87 0.84 0.76 0.60
* robust standard errors; t-values in bold are significant at the 5 percent level
Europe Japan North-America Middle East Africa

25
SUMMARY | APRIL 2010
by its larger negative coefficient in that market segment when compared to other exporters as well as to lower
market segment. Rewards to grades and certificates decline from low to high quantiles, possibly indicating abso-
lute (a fixed amount) instead of relative rewards.
Table 7—Determinants of coffee prices (log(US cents per lb)); quantile hedonic price models
8. DISCUSSION AND CONCLUSIONS
We study the structure and performance of the coffee export sector over the period from 2003 to 2013 in Ethio-
pia. Important structural changes are happening in coffee markets internationally and locally within Ethiopia with
significant implications on performance and, ultimately, on the livelihoods of local smallholder coffee producers,
given their high dependence on coffee as a major source of income. However, few studies have looked at the
impact of these changes on the organization of export markets for coffee exporting countries.
Unit Coef. t-value* Coef. t-value* Coef. t-value* Coef. t-value* Coef. t-value*
Quantity exported log() -0.013 -12.05 -0.018 -15.53 -0.018 -17.39 -0.021 -18.49 -0.031 -14.88
Washed coffee (grade 2 = default)
Grade 1 yes=1 0.125 5.87 0.181 10.51 0.205 13.19 0.227 8.16 0.245 6.42
Un-graded yes=1 -0.232 -39.49 -0.244 -48.99 -0.243 -34.07 -0.211 -29.54 -0.187 -22.17
Unwashed coffee
Grade 3 yes=1 -0.144 -12.95 -0.012 -0.54 0.087 4.82 0.151 19.24 0.179 12.41
Grade 4 yes=1 -0.296 -103.60 -0.289 -90.16 -0.267 -67.19 -0.229 -59.69 -0.226 -34.63
Grade 5 yes=1 -0.363 -48.59 -0.379 -66.64 -0.350 -56.46 -0.314 -48.32 -0.319 -28.49
Un--graded yes=1 -0.624 -37.02 -0.570 -60.64 -0.495 -51.87 -0.415 -43.74 -0.406 -29.55
Region of origin (default=Sidama)
Jimma yes=1 -0.015 -2.04 -0.024 -4.41 -0.048 -8.07 -0.053 -8.21 -0.040 -3.99
Wollega/Lekempte yes=1 0.012 1.63 0.008 1.81 -0.012 -1.89 -0.011 -1.77 0.002 0.17
Yirgacheffe yes=1 0.101 20.25 0.114 28.65 0.102 32.47 0.116 28.36 0.177 16.30
Limu yes=1 -0.067 -9.17 -0.046 -10.74 -0.048 -13.40 -0.061 -13.75 -0.065 -11.11
Harar yes=1 0.202 21.95 0.266 46.92 0.271 46.20 0.290 38.80 0.380 29.15
Other yes=1 -0.060 -7.35 -0.035 -3.83 -0.041 -5.51 -0.003 -0.28 0.048 3.44
Certificate
Fair Trade yes=1 0.106 15.42 0.051 4.79 0.052 5.44 0.037 7.17 0.034 3.45
Organic yes=1 0.067 6.52 0.059 7.74 0.073 10.49 0.065 11.35 0.038 4.58
Type of exporter
Cooperative yes=1 0.115 10.42 0.161 21.79 0.170 27.44 0.177 33.22 0.175 23.99
Parastatal yes=1 -0.010 -1.34 -0.020 -4.71 -0.043 -6.76 -0.041 -6.82 -0.071 -14.01
State farm yes=1 -0.069 -8.32 -0.089 -10.94 -0.077 -13.94 -0.052 -8.57 -0.077 -8.21
Private commercial farm yes=1 0.019 2.62 0.008 1.52 0.016 2.75 0.066 7.55 0.069 6.72
Year (default=2006)
2007 yes=1 0.070 14.33 0.070 27.72 0.089 29.31 0.112 34.14 0.136 16.94
2008 yes=1 0.286 53.22 0.315 119.94 0.318 106.88 0.327 109.20 0.341 42.27
2009 yes=1 0.085 14.64 0.138 21.83 0.227 46.38 0.264 64.55 0.296 28.34
2010 yes=1 0.268 54.24 0.292 88.15 0.313 125.15 0.349 97.27 0.370 45.14
2011 yes=1 0.621 102.36 0.690 160.71 0.775 182.57 0.833 198.02 0.852 114.84
2012 yes=1 0.552 111.04 0.584 177.93 0.631 106.36 0.732 175.36 0.747 97.58
2013 yes=1 0.339 67.26 0.352 117.12 0.383 84.56 0.449 89.70 0.513 52.33
Intercept 4.918 416.91 5.004 412.17 5.044 465.55 5.098 385.94 5.253 231.49
Number of observations 30207
Pseudo R2 0.60 0.63 0.64 0.64 0.62
* smultaneous quantile regressions; standard errors with 100 bootstrap replications;
t-values in bold are significant at the 5 percent level
quantile 0.10 quantile 0.25 quantile 0.50 quantile 0.75 quantile 0.90
26
SUMMARY | APRIL 2010
Major changes have been seen in international coffee markets in recent years. First, the specialty coffee
market has quickly grown in global markets. Coffee differentiation, often based on product origin, is becoming
increasingly important (Reuber, 2010). Second, there has been high price variability in global coffee markets with
prices on international markets increasing five-fold between 2000 and 2012. Third, the demand for certified coffee
is on the rise (Jena et al., 2012; Meijerink et al., 2010). Domestically, there have also been important policy
changes related to the start of the Ethiopian Commodity Exchange (ECX), a modern marketing system based on
warehouse receipts, interventions by the government in the issuing of export licenses, and changes in the export
tax structure.
We note important structural changes in the export sector in Ethiopia. We see a larger number of export-
ers and an increasing diversification in the types of exporters – such as cooperatives and commercial farms - in
the export sector, with lower concentration ratios in the export sector overall. On the other hand, the share of the
incumbents in the local coffee market is large. This is possibly driven by reputation effects in these international
markets (Macchiavelo, 2010), the complications of understanding coffee markets, as well as lack of access to
credit for emerging exporters (World Bank, 2014). There is over time relatively little change in the countries that
Ethiopia exports to, except for a small increase of exports to Sudan. We also note the small but increasing share
of parastatals and cooperatives in the coffee export sector as well as more emphasis on certification of coffee,
although the share of coffee exports from Ethiopia that is certified is still small compared to other producing coun-
tries.
We have seen an impressive performance of Ethiopia’s coffee export sector over the last decade with the
real value of coffee exports rising four-fold between 2003 and 2012. The increases in export values have largely
been driven by increases in international coffee prices between 2003 and 2012. However, it should be noted that
increases in quantity also have played a role, as the quantity exported has gone up as well – exported quantities
from Ethiopia were 50 percent higher in 2012 than 10 years earlier. The increasing quantity exported may have
partly come at the expense of local consumption, with coffee in local markets becoming increasingly rationed
over time, as shown in relatively important domestic price increases. We also note a small increase in the quality
of the coffee exported, reflected in the share of certified coffee as well as in the better quality of unwashed coffee.
The share of the premium washed coffee in total exports, however, has not changed over time.
We show that the coffee export market is highly differentiated in Ethiopia, with quality premiums being of-
fered for washing, grades, certification, and specific geographical indications. About 30 percent of the coffee is
washed, leading to high but variable (due to international price variation) premiums compared to unwashed cof-
fee. There are strong effects of geographic indications of origin with Yirgacheffe and Harar coffee commanding
large premiums over coffees originating from elsewhere in Ethiopia. Certified coffee and coffee marketed by co-
operatives are being sold at higher prices than coffee sold by the private sector. We also find that all exporters
that are vertically integrated are able to obtain significantly higher prices over time than those that do not. This is
especially valued in the differentiated high-end market.
The findings from this research point to a number of important implications for efforts to stimulate Ethio-
pia’s coffee export sector. First, emphasis on stimulating washing of coffee by creating the right investment incen-
tives is important, as it leads to significantly higher export prices and, thus, higher foreign exchange earnings for
the country. As only part of the exported coffee is sold as washed coffee, there is still room for growth in this area.
However, profitability for the setting up of wet mills needs to be carefully assessed, as does the environmental
implications of more widespread washing (Beyene et al., 2012; Endris et al., 2008). Improved processing meth-
ods, relying on ecological pulpers which reduce water demand significantly, should be more widely adopted. The
growth of washing coffee in Ethiopia may have been constrained because of regulations and the difficulty of ac-
cess to foreign exchange to import wet milling machines. However, due to climatic constraints, coffee cherries
produced in some areas of Ethiopia are not suitable for washing, thus limiting spatial growth in wet milling ser-
vices to coffee producers.

27
SUMMARY | APRIL 2010
Second, it has been estimated that between 20 and 30 percent of Ethiopian coffee could qualify as spe-
cialty coffee17, opening up important export opportunities (Chemonics, 2010). Greater efforts to gain increased
access for Ethiopian coffee to global specialty coffee markets could be made. Ethiopia could also benefit from
increasing the profile of the Ethiopian coffee brand, increased participation in certification schemes, and empha-
sizing trade in traceable coffee products. This is especially important given the growing emphasis of international
markets on certification of sustainable coffee production practices.18 However, as certification is often a costly
process that might also limit benefits for producers (Jena et al., 2012; Cramer et al., 2014), setting up cheaper
local certification schemes that would be credible in international markets and that would benefit local producers
directly should be considered. Furthermore, as many of these international certification schemes require collabo-
ration with cooperative institutions, further capacity building of these institutions will be required.
Finally, coffee yields are very low in Ethiopia compared to other countries. There seemingly are significant
opportunities for productivity growth (Adugna et al., 2008; Kufa, 2012). Increasing support at the farm level and
training towards higher adoption of improved technologies, such as mulching, pruning, rejuvenation of trees,
planting of improved varieties, and modern input use, have been shown to be associated with higher productivity
(Adugna et al., 2008) and could lead to higher local supply and, therefore, quantities of coffee exported. Moreo-
ver, more efforts should be done with the research and agricultural extension services to address widespread
concerns related to coffee diseases and adaptation and mitigation of climate change that are likely to have major
impacts on the coffee sector in Ethiopia (Davis et al., 2012).
17 Carl Cervone, Technoserve, personal communication 18 For example, the Sustainable Trade Initiative has an agreement with major roasters towards increasing global sustainable coffee sales to 25 percent in 2016. See http://www.idhsustainabletrade.com/koffie-news

28
SUMMARY | APRIL 2010
REFERENCES
Adugna, G., B. Bellachew, T. Shimber, E. Taye, and, T. Kufa. 2008. Coffee diversity & knowledge. Ethiopian Institute of Agri-
cultural Research. Addis Ababa, Ethiopia
Agrer, 2014. Formulation of Coffee Development Strategy for Ethiopia, mimeo.
Alemu, H. 2009. Through the grinds, Fortune, Edition of 06/21/2009, downloaded from: http://www.addisfor-
tune.com/vol%2010%20no%20476%20archive/Through%20the%20Grinds.htm
Araya, E. 2011. Ethiopia: Trade Ministry bans 16 coffee exporters from exchange floor, Addis Fortune, November 21st, 2011,
accessed at http://allafrica.com/stories/201111240122.html
Arslan, A., and, C.P. Reicher. 2010. The effects of the coffee trademarking initiative and Starbucks publicity on export prices
of Ethiopian coffee. Kiel Institute for the World Economy, Kiel Working Paper 1606
Beyene, A., Kassahun, Y., Addis, T., Assefa, F., Amsalu, A., Legesse, W., Kloos, H., and, Triest, L. 2012. The impact of tra-
ditional coffee processing on river water quality in Ethiopia and the urgency of adopting sound environmental practices.
Environmental Monitoring and Assessment, 184(11): 7053–7063. doi:10.1007/s10661-011-2479-7
Boger, S. 2001. “Quality and contractual choice: A transaction cost approach to the Polish hog market.” European Review of
Agricultural Economics 28(3): 241-261
Chemonics. 2010. Ethiopia coffee industry value chain analysis: Profiling the actors, their interactions, costs, constraints and
opportunities, COMPETE/USAID, mimeo
CSA (Central Statistical Agency). 2013. Agricultural Sample Survey 2012/2013 (2005 E.C.), Report on area and production
of major crops. Central Statistical Agency, Addis Ababa
Costanigro, M., J. McCluskey, and, Goemans, C. 2010. “The economics of nested names: Name specificity, reputations, and
price premia”. American Journal of Agricultural Economics 92(5): 1339–1350
Cramer, C., Johnston, D., Oya, C., Sender, J. 2014. Fair trade, employment and poverty reduction in Ethiopia and Uganda,
Final report submitted to DfID, SOAS, University of London, April 2014
Daviron, B., and, S. Ponte. 2005. The Coffee Paradox, Global Markets, Commodity Trade and the Elusive Promise of Devel-
opment. Zed Books, London, New York.
Davis, A.P., Tadesse, W., Baena, S., Moat, J. 2012. The impact of climate change on indigenous Arabica coffee (Coffee ara-
bica): Predicting future trends and identifying priorities. PLoS ONE 7(11):e4798. Accessed at doi:10.1371/jour-
nal.pone.0047981
Donnet, M.L., Weatherspoon, D.D., Hoehn, J.P. (2008), Price determinants in top-quality e-auctioned specialty coffee, Agri-
cultural Economics, 38:267-276
Donnet, M.L., D.D. Weatherspoon, and, Hoehn, J.P. 2007. “What adds value in specialty coffee? Managerial implications
from hedonic price analysis of Central and South American E-auctions”. International Food and Agribusiness Manage-
ment Review 10(3):1-18
Endris, S., T. Kebede, B. W/Sember, W. Legesse, Y. Kassahun, T. Yakob, and A. Sualeh. “Environmental contamination
from by-products of wet coffee processing.” in edited by G. Adugna, B. Bellachew, T. Shimber, E. Taye, T. Kufa. 2008.
Coffee diversity & knowledge. Ethiopian Institute of Agricultural Research. Addis Ababa, Ethiopia: 335-344
Fikade, B. 2014. Trouble brewing for coffee exporters, Fortune, February 1st, 2014, accessed on June 1st, 2014 at
http://www.thereporterethiopia.com/index.php/news-headlines/item/1572-trouble-brewing-for-coffee-exports
International Coffee Organization (ICO) (2013), http://www.ico.org/new_historical.asp
Gabre-Madhin, E.Z. 2012. A market for Abdu: Creating a Commodity Exchange in Ethiopia. Occasional Essays Series.
Washington, DC: International Food Policy Research Institute (IFPRI).

29
SUMMARY | APRIL 2010
Jena, P.R., B.B. Chichaibelu, T. Stellmacher, and U. Grote. 2012. “The Impact of Coffee Certification on Small-Scale Pro-
ducers’ Livelihoods: A Case Study from the Jimma Zone”. Ethiopia, Agricultural Economics 43(4): 429-440.
Kufa, T. 2012. Recent coffee research development in Ethiopia, Presentation at the “Ethiopian Coffee Export Conference:
Strengthening the Legacy of Our Coffee”, November 8-9, 2012, Hilton, Addis Ababa
LMC. 2003. Review of the Ethiopian Coffee Market. Report prepared for DFID, Programme of Advisory Support Services for
Rural Livelihoods. LMC International Ltd, Oxford. December 2003.
Macchiavelo, R. 2010. Development uncorked: Reputation acquisition in the new market for Chilean wines in the UK, mimeo
Meijerink, G.W., Alemu, D., Van der Mheen-Sluier, J., Wijnands, J. (2010). Institutional innovation in African markets: Can
commodity exchanges address sustainability issues? Paper presented at the 119th EAAE seminar, Capri, Italy June 30th-
July 2nd, 2010
Nure, D. 2008. Mapping quality profiles of Ethiopian coffee by origin, in Eds. Adugna, G., Bellachew, B., Shimber, T., Taye,
E., Kufa, T. 2008. Coffee diversity & knowledge, Ethiopian Institute of Agricultural Research, Addis Ababa, Ethiopia: 317-
227
Oakes, N., and, M. Thompson. 2009. Ethiopian coffee: Brewing a recovery, The Africa Group, accessed at: http://www.theaf-
ricagroup.com/static/django_sites/consulting/cms_page_media/8/Ethiopian%20Coffee.pdf
Panhuysen, S., and, M. Van Reenen, 2012. Coffee Barometer 2012, Tropical Commodity Coalition
Pendergrast, M. 2010. Uncommon grounds: The history of coffee and how it transformed our world, Basic Books, New York,
424p.
Petit, N. 2007. “Ethiopia’s coffee sector: A better or bitter future?” Journal of Agrarian Change. 7(2): 225-263
Ponte, S. 2002. “The ‘Latte Revolution’? Regulation, Markets and Consumption in the Global Coffee Chain”. World Develop-
ment 30(7): 1099-1122
Rhinehart, R. 2012. What is special about specialty coffee? Paper presented at the SCAA symposium, April 18/19th 2012,
accessed on May 1st, 2014 at http://www.scaaevent.org/PDF/Press%20Kit/2012/What%20is%20spe-
cial%20about%20specialty.pdf
Stifel, D., and, T. Woldehanna. 2013. Utility-consistent poverty in Ethiopia, 2000-2011: Welfare improvements in a changing
economic landscape, paper prepared for the UNU-Wider Growth and Poverty Project, 2012-2013
Swinnen, J. 2007. Global supply chains, standards and the poor. Wallingford, UK: CABI Publishing.
Tefera, A., and T. Tefera. 2013. Ethiopia: Coffee Annual Report, Gain report ET-1302, USDA
Teuber, R. 2010. “Geographical Indications of origin as a tool of product differentiation: The case of coffee”. Journal of Inter-
national Food and Agribusiness Marketing 22: 277-298
Teuber, R., and, R. Herrmann. 2012. “Towards a differentiated modeling of origin effects in hedonic analysis: An application
to auction prices of specialty coffee”. Food Policy 37: 732-740
World Bank. 2014. 'Economic Update III: Strengthening Export Performance through Improved Competitiveness', Washing-
ton D.C.
Yewondwossen, M. 2014. Two major coffee traders suspended from ECX, Capital, February 10th 2014 accessed at
http://www.capitalethiopia.com/index.php?option=com_content&view=article&id=4028:two-major-coffee-traders-sus-
pended-from-ecx&catid=35:capital&Itemid=27

SUMMARY | APRIL 2010
About the Authors
Bart Minten is a Program Leader of the Ethiopia Strategy Support Program, and a Senior Research Fellow in the Development Strat-
egy and Governance Division of the International Food Policy Research Institute (IFPRI). Seneshaw Tamru is a PhD Candidate of
LICOS, Center for Institutions and Economic Performance of the University of Leuven. Tedesse Kuma is a Senior Researcher in
Agirulture and Rural Development of the Ethiopian Development Research Institute (EDRI). Yaw Nyarko is a Professor of Economics
at New York Universirty, and Director in Center for Technology and Economic Development.
ACKNOWLEDGMENTS
The authors benefited from comments of participants at seminars at the Ethiopian Development Research Institute (EDRI) and
the Ministry of Agriculture (MoA) in Addis Ababa. They would like to thank John Mellor and Carl Cervone for useful comments
on earlier drafts of the paper, Ibrahim Worku for the analysis on consumption patterns, and Helina Tilahun for making the
maps. However, the authors are solely responsible for content.
About ESSP
The Ethiopia Strategy Support Program is an initiative to strengthen evidence-based policymaking in Ethiopia in the areas of
rural and agricultural development. Facilitated by the International Food Policy Research Institute (IFPRI), ESSP works closely
with the government of Ethiopia, the Ethiopian Development Research Institute (EDRI), and other development partners to pro-
vide information relevant for the design and implementation of Ethiopia’s agricultural and rural development strategies. For
more information, see http://www.ifpri.org/book-757/ourwork/program/ethiopia-strategy-support-program or http://essp.ifpri.info/
or http://www.edri-eth.org/.
About these working papers
The ESSP Working Papers contain preliminary material and research results from IFPRI and/or its partners in Ethiopia. The
papers are not subject to a formal peer review. They are circulated in order to stimulate discussion and critical comment.
The opinions are those of the authors and do not necessarily reflect those of their home institutions or supporting organiza-
tions.
INTERNATIONAL FOOD POLICY RESEARCH INSTITUTE
2033 K Street, NW | Washington, DC 20006-1002 USA | T: +1.202.862.5600 | F: +1.202.457.4439 | Skype: ifprihomeoffice | [email protected] | www.ifpri.org
IFPRI–ESSP ADDIS ABABA
P.O. Box 5689, Addis Ababa, Ethiopia | T: +251.11.617.2000 | F: +251.11.646.2318 | [email protected] | http://essp.ifpri.info
ETHIOPIAN DEVELOPMENT RESEARCH INSTITUTE
P.O. Box 2479, Addis Ababa, Ethiopia | T: +251.11.550.6066 ; +251.11.553.8633 | F: +251.11.550.5588 | [email protected] | www.edri-eth.org
This Working Paper has been prepared as an ESSP output, and has not been peer reviewed. Any opinions stated herein are
those of the author(s) and do not necessarily reflect the policies or opinions of IFPRI.
Copyright © 2014, International Food Policy Research Institute. All rights reserved. To obtain permission to republish, contact


