
Structural Transformation, Biased Technical Change and Labor
Demand in Viet Nam
Second 2013
Asian Development Review ConferenceManilla, 1-2 August 2013
by
Phil Abbott, Ce Wu
and
Finn Tarp

Background and general context• UoC – CIEM collaboration starting in 2000• SAM/CGE and associated work• Household and enterprise studies• Nature of domestic policy discussions in Viet Nam and international observers
• Present paper an example aiming to add to an ongoing debate in Viet Nam
2

A couple of literature references
• Krugman (1994), Young (1995), others – Asian miracle due more to capital accumulation than to TFP growth– Vietnamese case of low TFP growth is not unusual
• Rodrik (1997) – TFP estimates low – Estimates of technical change are biased, as labor saving technological change not captured
• Howard Pack & John Page and others

Point of Departure… Stagnant Labor Demand?
• Vietnamese economy has been growing rapidly– GDP growth from 1990 to 2009 7.5%/year
• Labor demand has grown much more slowly2005‐07 1992‐97 2000‐08
GDP growth 8.4% 8.5% 7.3%Employment growth 2.0% 2.1% 2.2%
• Significant pessimism about employment generation
4
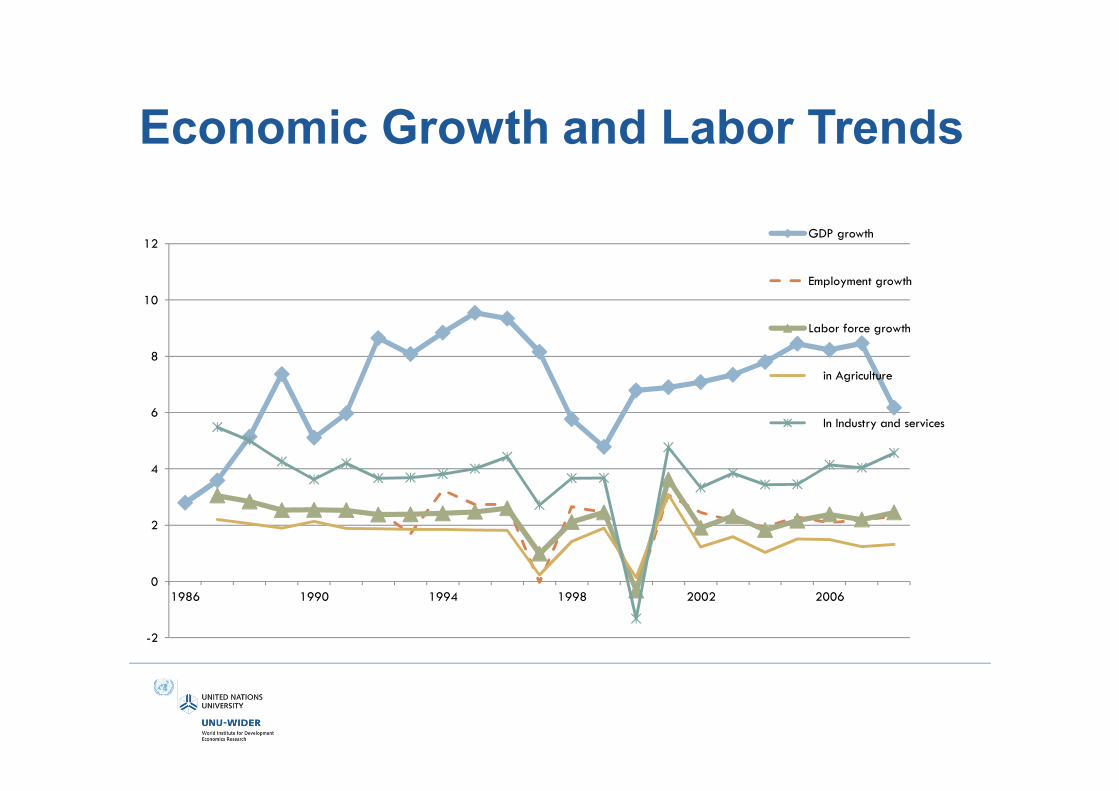
Economic Growth and Labor Trends
-2
0
2
4
6
8
10
12
1986 1990 1994 1998 2002 2006
GDP growth
Employment growth
Labor force growth
in Agriculture
In Industry and services

Elasticity of Employment wrt GDP
• Elasticity = Employment growth/GDP growth– Measuring stagnant labor demand
• From 2000 to 2008 this Elasticity = 0.28 in Vietnam
• MOLISA and ILSSA state this elasticity was 0.7‐0.8 in other Asian economies at comparable stage of development (Bangladesh, Pakistan, Indonesia, Rep. South Korea)

Labor Market Issues … a view from ILO and MOLISA (2010)
• Restructuring the economy is going too slowly– Urban‐rural, ag‐manufacturing, public‐private
• Growth reflects capital accumulation
– Little technical innovation taking place (discounted)• Development has been excessively capital intensive (inefficient)
– Minimum wage foster capital intensive growth– SOEs and foreign invested firms more capital intensive– And incremental capital‐output ratios are high
• Rising population poses difficulties for the future– Unskilled labor supply may race ahead of demand– Shortages of highly skilled labor may have constrained
growth in the past, or may constrain growth in the future
7

Structural transformation underway
8
0
10
20
30
40
50
60
70
2000 2002 2004 2006 2008
Sect
oral
Empl
oym
ent S
hare
s (%
)
Year
Agriculture
Industry
Services
In 2008, agriculture < 20% of GDP but ≈ 50% of employment

Huge productivity differences across sectors
9
0
5000
10000
15000
20000
25000
1986 1990 1994 1998 2002 2006
Val
ue a
dded
per
wor
ker
Year
Agriculture
Industry
Services

But is Vietnam so different from some other East Asian countries (WDI data)?
• World Bank (in 1999) and MOLISA (in 2009) may have had it wrong when they suggested labor demand kept up elsewhere in Asia– Employment Elasticities comparable elsewhere!– Big numbers for Thailand, Philippines & Indonesia: declines during
recession – Asian crisis!
1986‐90 1991‐95 1996‐2000 2001‐05 2006‐08China 0.28 0.11 0.13 0.10 0.06Korea, Rep. 0.33 0.29 0.25 0.24 0.16Thailand 0.25 0.04 1.58 0.33 0.25Indonesia 0.35 0.30 2.91 0.42 0.30Philippines 0.57 1.42 0.58 0.55 0.40Viet Nam 0.53 0.28 0.30 0.27 0.32
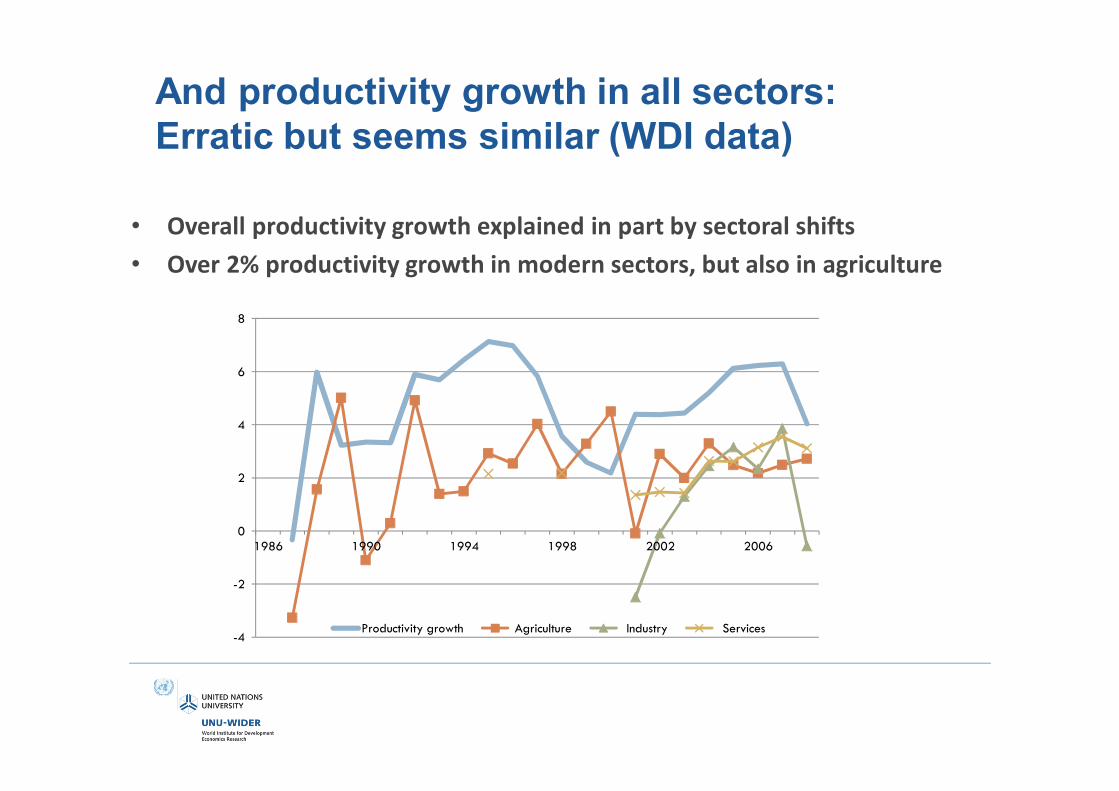
And productivity growth in all sectors: Erratic but seems similar (WDI data)
• Overall productivity growth explained in part by sectoral shifts• Over 2% productivity growth in modern sectors, but also in agriculture
-4
-2
0
2
4
6
8
1986 1990 1994 1998 2002 2006
Productivity growth Agriculture Industry Services

Three hypotheses:to explain slow labor demand (i.e. difference between GDP and labor demand growth)
• Structural transformation – i.e. moving labor out of agriculture and into industry and services – Shifting from low productivity traditional sectors (agriculture) to high productivity modern
sectors
• Technological progress– TFP or labor saving
• Excessive capital intensive development (institutional biases)?– Minimum wage distorts wage‐rental ratio?– State and foreign investment overly capital intensive?
12

Research Agenda• Labor demand growth decomposition and structural
transformation– How far does structural transformation get us?
• Technical change: estimating biased TFP/Production functions– TFP growth evidence has been mixed, inconclusive– Labor‐efficiency enhancing biased technical change?– Need production functions to assess TFP versus institutional issues
• Price incentives and capital intensity ‐‐ institutional bias information– Strong institutional and market wage growth
• But do minimum wages or inflation drive market wage growth?• And do wages affect input use?
– Institutional (state) investment allocation
13

Labor Demand Growth Decomposition
14

Labor Demand (eq 1)
= labor demand=labor requirement per unit output in sector I (i.e. labor efficiency)
=sector i’s share of output=overall economic output (e.g. GDP or gross
output)
15

Decomposition (eq. 4)
∑ Technical change and institutional wage bias
+∑ Structural transformation and investment biasEconomic growth
gL =labor demand growth gaLi =change in sectoral labor requirement (technological change, wage biases)gSi =sectoral share growth rates (structural transformation, state investment policies)gY =GDP growth
Weighted by: , . .
Note: / ∑ (overall labor‐output ratio)
16
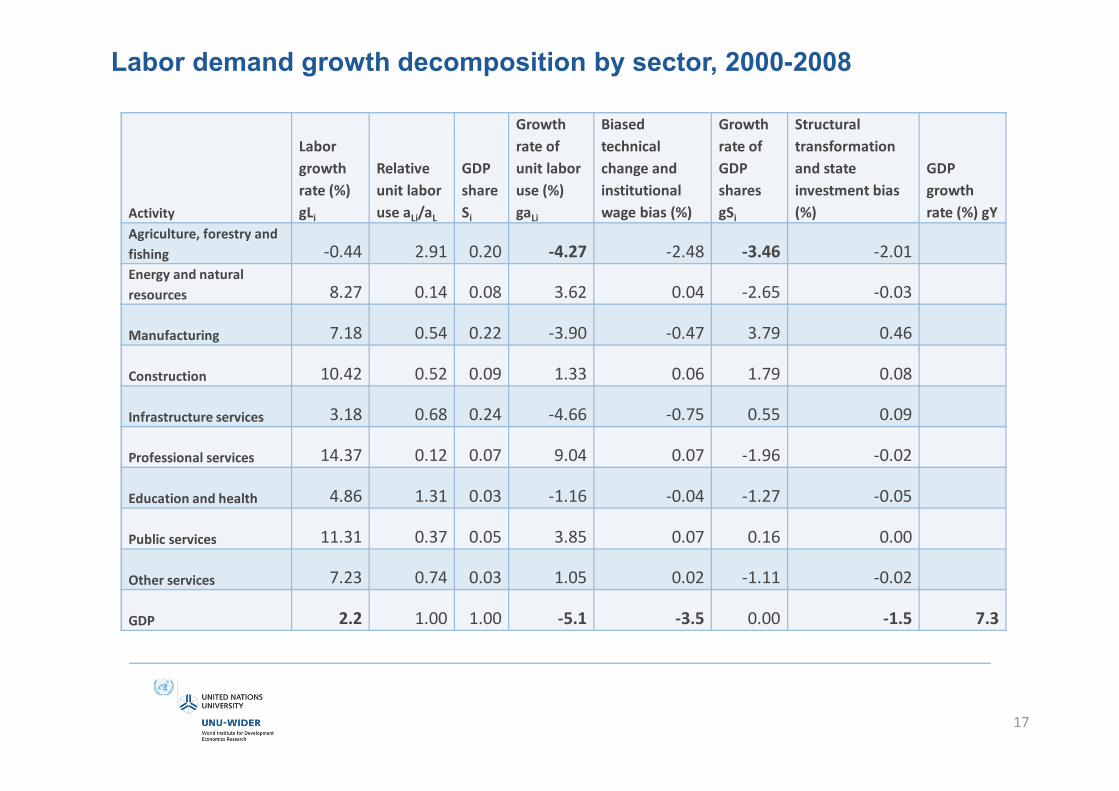
Labor demand growth decomposition by sector, 2000-2008
17
Activity
Labor growth rate (%) gLi
Relative unit labor use aLi/aL
GDP share Si
Growth rate of unit labor use (%) gaLi
Biased technical change and institutional wage bias (%)
Growth rate of GDP shares gSi
Structural transformation and state investment bias (%)
GDP growth rate (%) gY
Agriculture, forestry and fishing ‐0.44 2.91 0.20 ‐4.27 ‐2.48 ‐3.46 ‐2.01Energy and natural resources 8.27 0.14 0.08 3.62 0.04 ‐2.65 ‐0.03
Manufacturing 7.18 0.54 0.22 ‐3.90 ‐0.47 3.79 0.46
Construction 10.42 0.52 0.09 1.33 0.06 1.79 0.08
Infrastructure services 3.18 0.68 0.24 ‐4.66 ‐0.75 0.55 0.09
Professional services 14.37 0.12 0.07 9.04 0.07 ‐1.96 ‐0.02
Education and health 4.86 1.31 0.03 ‐1.16 ‐0.04 ‐1.27 ‐0.05
Public services 11.31 0.37 0.05 3.85 0.07 0.16 0.00
Other services 7.23 0.74 0.03 1.05 0.02 ‐1.11 ‐0.02
GDP 2.2 1.00 1.00 ‐5.1 ‐3.5 0.00 ‐1.5 7.3

Labor Demand Growth Decomposition
• Structural transformation + state investment bias contribute 30%– Agriculture and manufacturing most important
• Biased technical change + institutional wage bias contribute 70%– Agriculture, manufacturing and institutional services are all lowering labor use per unit output at 3.9% or more per year
• Need further analysis to sort between institutional factors and either structural transformation or technical change
18

Technological Change
19
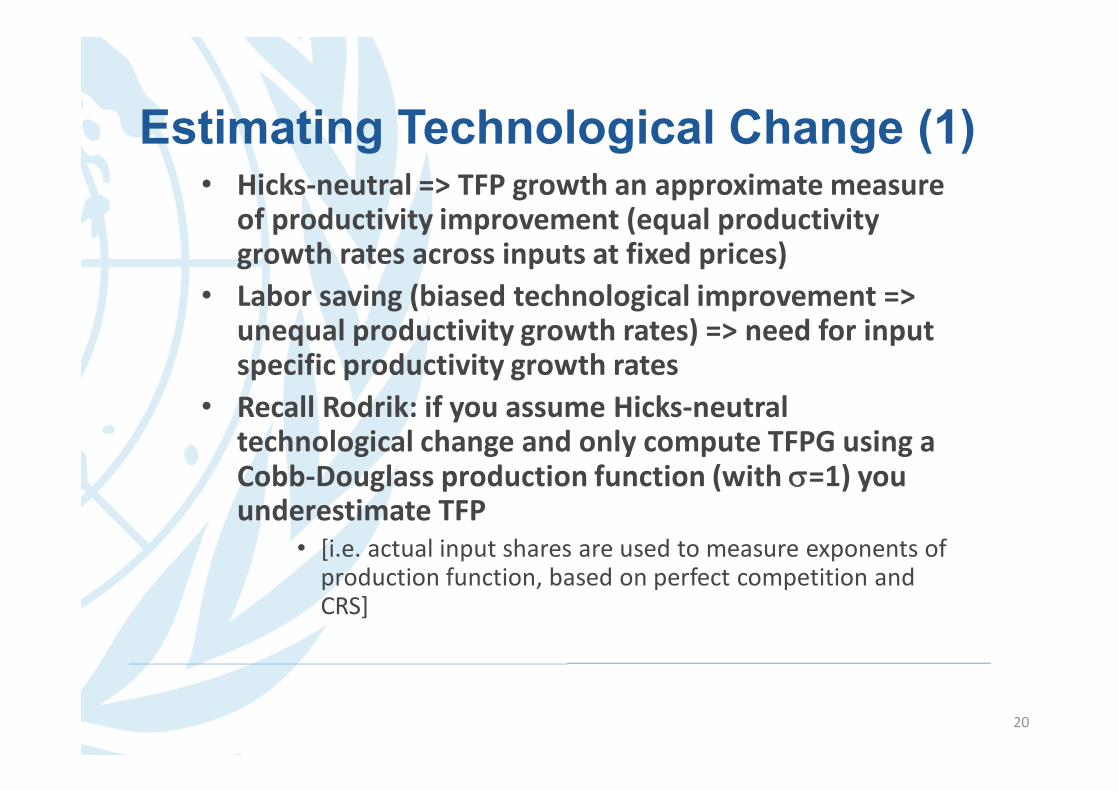
Estimating Technological Change (1)• Hicks‐neutral => TFP growth an approximate measure
of productivity improvement (equal productivity growth rates across inputs at fixed prices)
• Labor saving (biased technological improvement => unequal productivity growth rates) => need for input specific productivity growth rates
• Recall Rodrik: if you assume Hicks‐neutral technological change and only compute TFPG using a Cobb‐Douglass production function (with =1) you underestimate TFP
• [i.e. actual input shares are used to measure exponents of production function, based on perfect competition and CRS]
20

Estimating Technical Change (2)• To address these problems we:
– Estimated productivity growth for 18 aggregated sectors and for overall economy
– Allowing for both Hicks neutral and factor‐augmenting technological change using
• Cobb‐ Douglas (=1) – cannot identify bias• CES• Leontief (=0)
21

Cobb-Douglas Theory
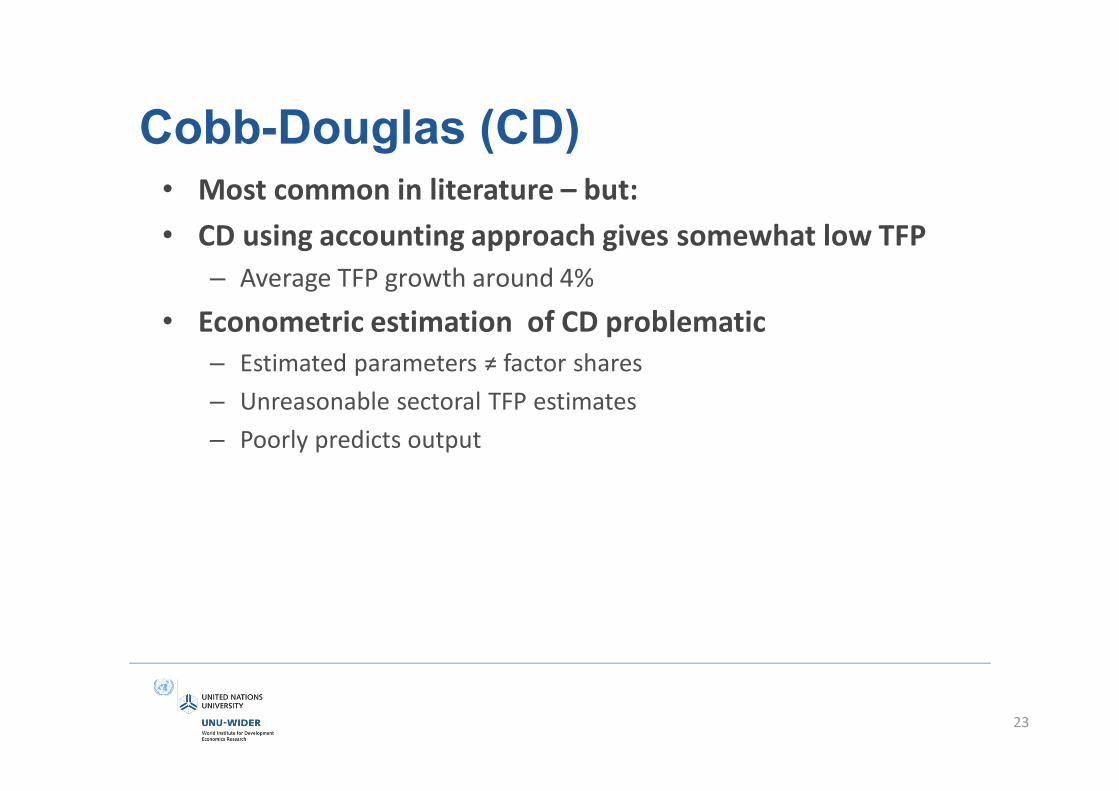
Cobb-Douglas (CD)• Most common in literature – but:• CD using accounting approach gives somewhat low TFP
– Average TFP growth around 4%
• Econometric estimation of CD problematic– Estimated parameters ≠ factor shares– Unreasonable sectoral TFP estimates– Poorly predicts output
23

CES• Method identified to address bias
– Different estimates from alternative methods– Difficult to sort between substitution due to changes in wage‐rental ratio versus technical change
• For some sectors significantly > 0– But some factor efficiency estimates seem unreasonably large!
24

Leontief
• Most reasonable estimates of technical efficiency improvement!– 2% for capital, 5.8% per year for labor overall
• Labor efficiency enhancing technical change sems evident in many sectors
• But CES > 0 for some sectors
25

Predicting Output and Labor Demand• Root Mean Square (RMSE) computed for output based on production functions: Leontief dominates
• Leontief results the most “economically plausible”– In sum: We suspect there may have been significant labor augmenting technical progress
26
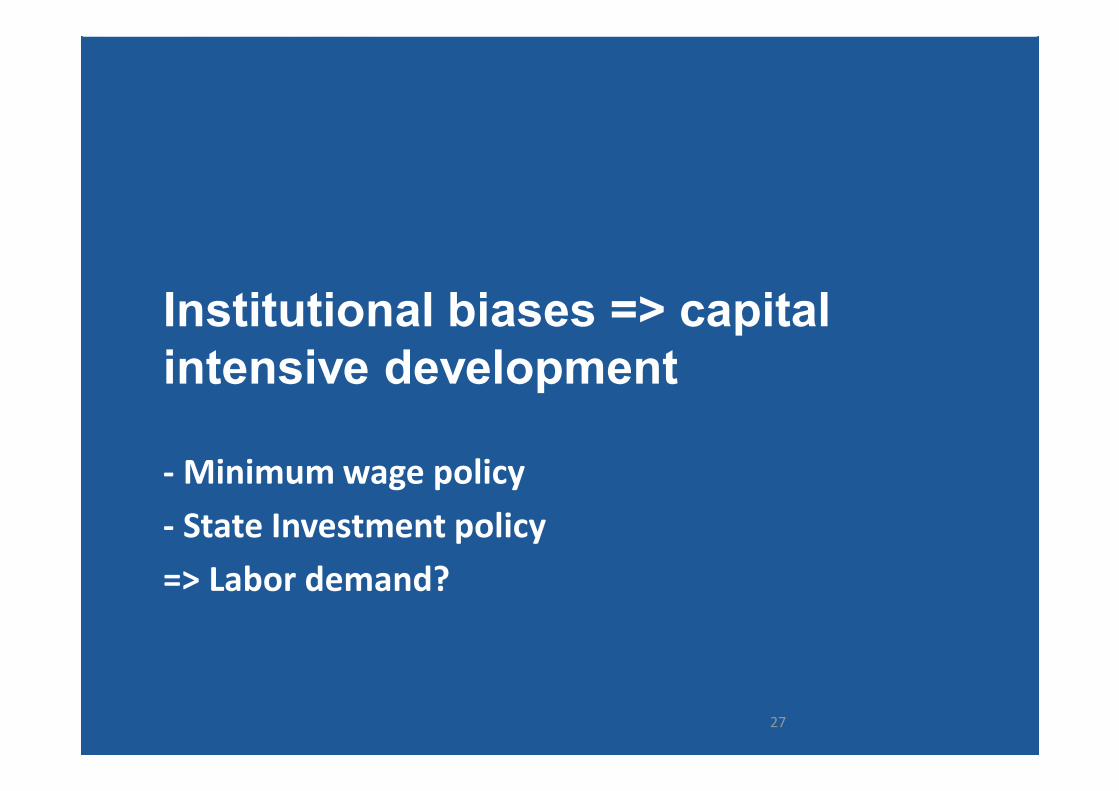
Institutional biases => capital intensive development
‐Minimum wage policy‐ State Investment policy=> Labor demand?
27

Minimum Wage• Two key linkages to have impact
– Do minimum wages determine market wages?– From market wages to actual factor usage
• Nominal minimum wages increased 300% from 2000 to 2008 – Real minimum wage up 68%, CPI up 78%– But real state wages only up 60% – And real (imputed) market wages up 50%– Inflation a more powerful determinant of nominal market wages
28
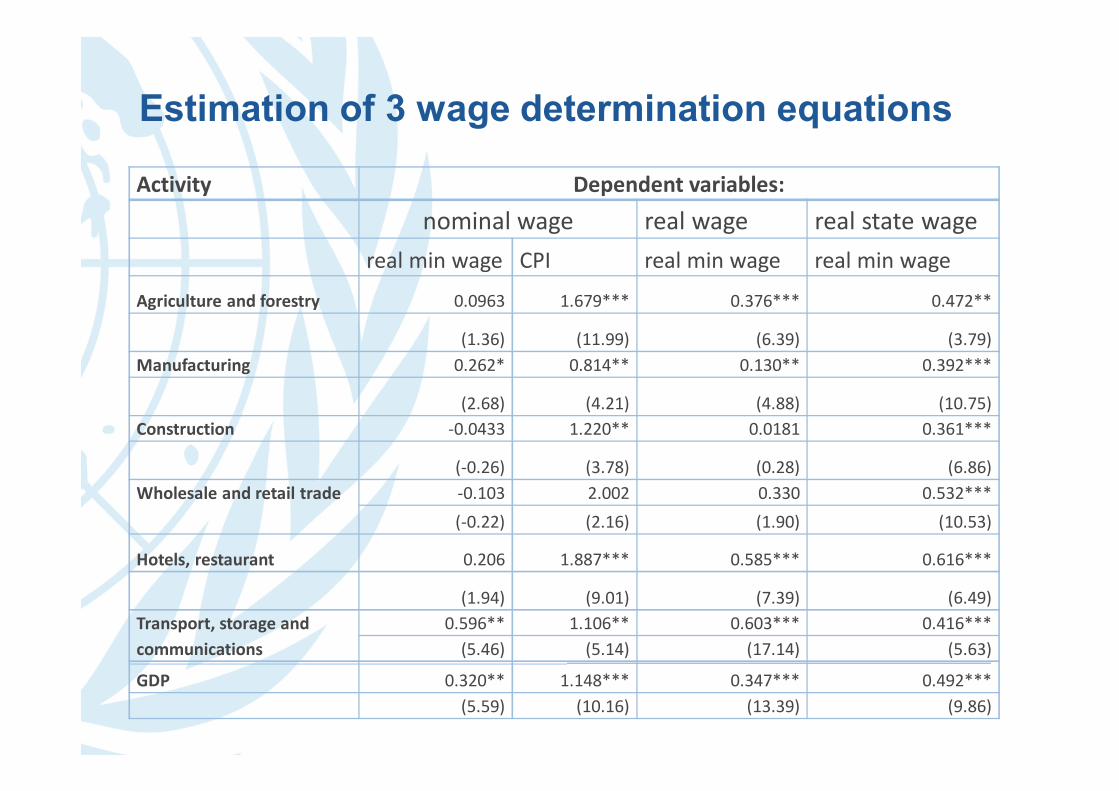
Estimation of 3 wage determination equations
Activity Dependent variables:nominal wage real wage real state wage
real min wage CPI real min wage real min wage
Agriculture and forestry 0.0963 1.679*** 0.376*** 0.472**
(1.36) (11.99) (6.39) (3.79)Manufacturing 0.262* 0.814** 0.130** 0.392***
(2.68) (4.21) (4.88) (10.75)Construction ‐0.0433 1.220** 0.0181 0.361***
(‐0.26) (3.78) (0.28) (6.86)Wholesale and retail trade ‐0.103 2.002 0.330 0.532***
(‐0.22) (2.16) (1.90) (10.53)
Hotels, restaurant 0.206 1.887*** 0.585*** 0.616***
(1.94) (9.01) (7.39) (6.49)Transport, storage and communications
0.596** 1.106** 0.603*** 0.416***(5.46) (5.14) (17.14) (5.63)
GDP 0.320** 1.148*** 0.347*** 0.492***(5.59) (10.16) (13.39) (9.86)

Quantative impact• Estimates from regression of real minimum wage on real market wage rate=>changes in real market wage rate
• Use predicted wage with CES conditional labor demand function to estimate impact on the labor‐output coefficient
30

The (relatively smaller) impact of institutional wage bias on labor-output coefficient, 2000-2008
31
Activity Percentage change in:Unit labor use due to institutional wage bias (%)
Overall unit labor use (%)
Agriculture, forestry and fishing ‐1.05 ‐4.27
Manufacturing ‐0.11 ‐3.90
Infrastructure services ‐1.37 ‐4.66
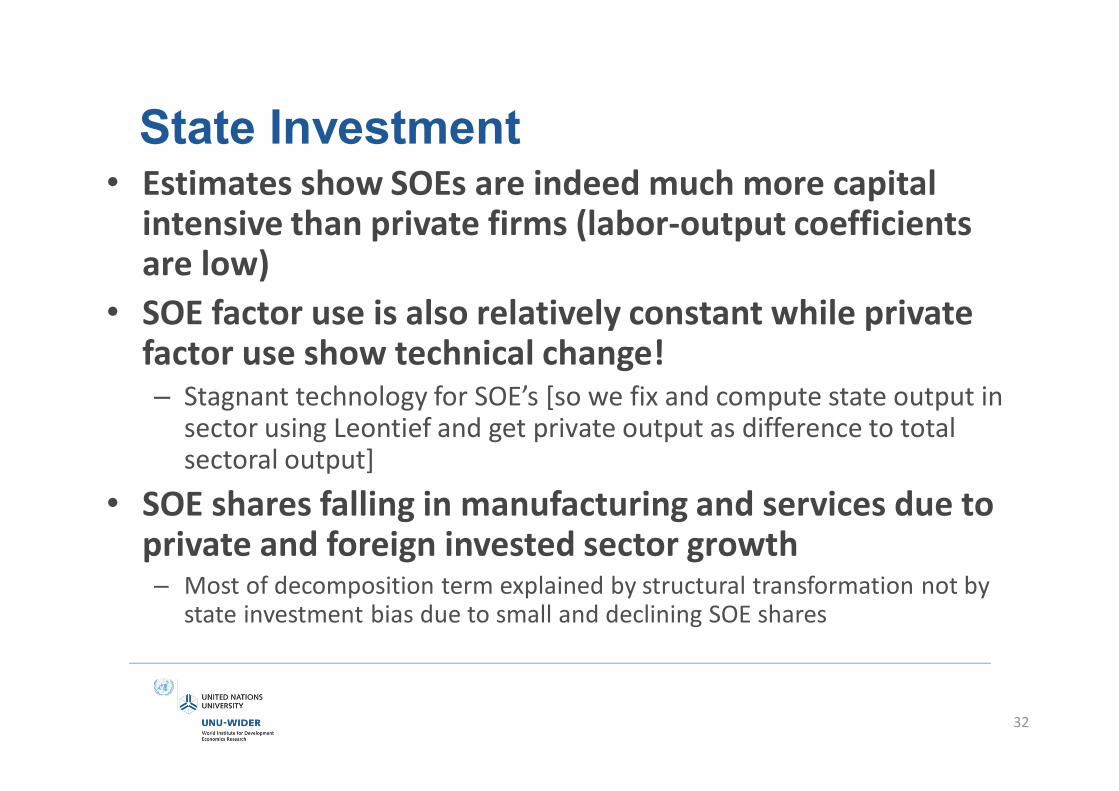
State Investment• Estimates show SOEs are indeed much more capital intensive than private firms (labor‐output coefficients are low)
• SOE factor use is also relatively constant while private factor use show technical change!– Stagnant technology for SOE’s [so we fix and compute state output in
sector using Leontief and get private output as difference to total sectoral output]
• SOE shares falling in manufacturing and services due to private and foreign invested sector growth– Most of decomposition term explained by structural transformation not by
state investment bias due to small and declining SOE shares
32

Impact of state investment bias on labor demand from 2003 to 2008
33
SectorGrowth rate of output shares gSi
relative unit labor use aLi/aL
GDP share Si
Impact on labor demand (%)
ManufacturingOverall 3.65 0.59 0.24 0.51State ‐12.49 0.04 0.04 ‐0.02Non‐state 7.83 0.64 0.19 0.98
ConstructionOverall 0.55 0.61 0.09 0.03State ‐12.44 0.39 0.03 ‐0.15Non‐state 8.71 0.72 0.06 0.37Infrastructure servicesOverall 1.03 0.75 0.24 0.18
State ‐9.81 0.10 0.09 ‐0.09
Non‐state 8.51 1.13 0.15 1.46

Lessons• Structural transformation only a partial explanation of stagnant labor demand in Viet Nam
• Institutional biases do exist, but technicalinnovation is found – arguments that Viet Nam not doing so well do not appear well founded: the idea that one needs to drastically change economic policy for this set of reasons not valid
• A new approach to estimating TFP, that can address labor biased technical change, is needed to identify properly technical change in Vietnam– Likely to find labor bias elsewhere, so technical innovation is
also behind the Asian miracle
34

www.wider.unu.eduHelsinki, Finland


