THESIS FOR THE DEGREE OF DOCTOR OF PHILOSOPHY
Structural Modifications in Spruce Wood
during Steam Explosion Pretreatment
Experimental and Numerical Investigation
MUHAMMAD MUZAMAL
Department of Chemistry and Chemical Engineering
CHALMERS UNIVERSITY OF TECHNOLOGY
Gothenburg, Sweden 2016
ii
Structural Modifications in Spruce Wood during Steam Explosion
Pretreatment
Experimental and Numerical Investigation
Muhammad Muzamal
© MUHAMMAD MUZAMAL, 2016
ISBN: 978-91-7597-422-4
Doktorsavhandlingar vid Chalmers tekniska högskola
Ny serie nr 4103
ISSN: 0346-718X
Department of Chemistry and Chemical Engineering
Chalmers University of Technology
SE-412 96 Gothenburg
Sweden
Telephone +46 (0)31-772 1000
Cover:
[Steam explosion equipment and schematic of experiments]
Printed by Chalmers Reproservice
Gothenburg, Sweden 2016

iii
Structural Modifications in Spruce Wood during Steam Explosion
Pretreatment
Experimental and Numerical Investigation
MUHAMMAD MUZAMAL
Department of Chemistry and Chemical Engineering
Chalmers University of Technology, Gothenburg, Sweden 2016
ABSTRACT
The rising price of petroleum and environmental concerns regarding CO2 emissions have
increased interest in alternative renewable resources. Biomass can be considered as an excellent
alternative raw material. A biorefinery uses biomass and produces fuel, energy, and value-
added chemicals. The biorefinery is an emerging industry and requires much development to
compete with established petroleum-based industries. One of the greatest challenges to the
biorefinery is that the raw material; biomass, has a complex chemical composition and physical
structure. Enzymatic hydrolysis of native biomass for the production of biofuel yields very
small amounts of product. A pretreatment process is necessary to induce physico-chemical
changes in the biomass and transform it into easily hydrolysable material. The main factor
limiting enzymatic digestion of biomass is accessibility to chemical constituents. Steam
explosion pretreatment is a promising pretreatment that modifies both the physical and chemical
structure of biomass and significantly enhances the subsequent enzymatic hydrolysis of the
pretreated material.
Steam explosion pretreatment can be studied as a three-step process that involves; (i) the
treatment of wood with pressurized steam for a specific period of time, (ii) the rapid release of
pressure which causes vapours inside the wood cells to expand, and (iii) the discharge of the
wood chips into a blow tank which results in collisions between wood chips and impact with
vessel walls. This thesis is based on experimental and modelling studies performed with the
aim of gaining knowledge of the basic mechanisms of the steam explosion process.
In the experimental part, the three steps of steam explosion pretreatment were carefully isolated,
and the effect of these steps on the structural changes in spruce wood pieces was studied. The
study revealed that all the steps of the steam explosion process contribute to structural changes
in the wood material, which increases the enzymatic hydrolysis of the material. It was found
that wood chips disintegrate into small fragments and that the microstructure of the wood is
vigorously destroyed as a result of the collision between wood chips and vessel walls.
The deformation in the cellular structure of softwood due to the rapid decompression of vapour
inside the wood cells was modelled using the Finite Element Method. Simulations identified
the regions where microcracks were likely to appear. These regions showed much resemblance
to the experimentally obtained steam-exploded wood. Simulations of collisions between wood
chips and impact with a steel wall were also performed. It was found that the wood chip that
moves at high velocity and impacts with the steel wall in the radial direction acquires the most
damage.

iv

v
ACKNOWLEDGMENTS
I would like to take the opportunity to express my gratitude to all the people who have made
this thesis possible.
First of all, I am very grateful to my supervisor Anders Rasmuson and co-supervisor Hans
Theliander for their guidance, encouragement, and inspiration.
Thank you
Prof. Kristofer Gamstedt, without your guidance Papers I and V would not have been
possible.
Kerstin Jedvert, it was nice working with you; your help in performing dangerous steam
explosion experiments was greatly needed.
Jenny Arnling Bååth and Lisbeth Olsson are thanked for contributing to the enzymatic
hydrolysis of wood.
All of my colleagues at the Chemical Engineering and Forest Product Division are
acknowledged for making my time at the department nice and pleasant.
Chalmers Energy Initiative is gratefully acknowledged for financial support.
Finally, my family; my brothers, my wife, and above all, my mother, your love and prayers
made my work much easier.

vi

vii
LIST OF PUBLICATIONS
Paper I
Modeling wood fiber deformation caused by vapor expansion during steam explosion of
wood
Muhammad Muzamal, E. Kristofer Gamstedt, Anders Rasmuson
Wood Sci. Technol. 2014, 48: 353-372
Paper II
Structural changes in spruce wood during different steps of steam explosion pretreatment
Muhammad Muzamal, Kerstin Jedvert, Hans Theliander, Anders Rasmuson
Holzforschung 2015, 69(1): 61-66
Paper III
Dynamic simulation of disintegration of wood chips caused by impact and collisions
during the steam explosion pretreatment
Muhammad Muzamal, Anders Rasmuson
Wood Sci. Technol. 2016, DOI: 10.1007/s00226-016-0840-2
Paper IV
Contribution of structural modification to enhanced enzymatic hydrolysis and 3-D
structural analysis of steam-exploded wood using X-ray tomography Muhammad Muzamal, Jenny Arnling Bååth, Lisbeth Olsson, Anders Rasmuson
Submitted
Paper V
Mechanistic study of microstructural deformation and stress in steam-exploded softwood
Muhammad Muzamal, E. Kristofer Gamstedt, Anders Rasmuson
Submitted

viii
CONTRIBUTION REPORT
Paper I
Main author, performed and planned all simulations. Interpreted results and drafted the
manuscript.
Paper II
Main author, performed and planned all experiments together with second author. Interpreted
results and drafted the manuscript together with second author.
Paper III
Main author, performed and planned all simulations. Interpreted results and drafted the
manuscript.
Paper IV
Main author, performed steam explosion pretreatment, acid hydrolysis experiments. Conducted
post-processing of the raw data obtained from high-resolution X-ray tomography. Contributed
to performing enzymatic hydrolysis and sugar analysis. Interpreted results and drafted the
corresponding sections of manuscript.
Paper V
Main author, performed and planned all simulations. Interpreted results and drafted the
manuscript.

ix
TABLE OF CONTENTS
1. INTRODUCTION ........................................................................................................................... 1
1.1. Background ............................................................................................................................. 1
1.2. Objectives ................................................................................................................................ 3
1.3. Outline of the thesis ................................................................................................................. 3
2. BACKGROUND ............................................................................................................................. 5
2.1. Wood ....................................................................................................................................... 5
2.1.1. Structure of softwood ...................................................................................................... 5
2.1.2. Cell structure ................................................................................................................... 6
2.1.3. Constituents of wood ....................................................................................................... 8
2.2. Biorefinery .............................................................................................................................. 8
2.2.1. Factors limiting enzymatic hydrolysis ............................................................................. 9
2.2.2. Pretreatment processes .................................................................................................... 9
2.2.3. Alkali pretreatment ........................................................................................................ 10
2.2.4. Acid pretreatment .......................................................................................................... 10
2.2.5. Liquid hot water pretreatment ....................................................................................... 10
2.2.6. Steam explosion pretreatment ....................................................................................... 10
3. EXPERIMENTAL ........................................................................................................................ 13
3.1. Steam explosion experiments and apparatus ......................................................................... 13
3.2. Material and sample preparation ........................................................................................... 14
3.3. Acid hydrolysis (Paper IV) .................................................................................................... 15
3.4. Enzymes and enzymatic hydrolysis (Paper IV) ..................................................................... 15
3.5. High Performance Anion-Exchange (HPAE) chromatography (Paper IV) .......................... 15
3.6. Scanning electron microscopy (Paper II, V) ......................................................................... 16
3.7. High-resolution X-ray tomography (Paper IV) ..................................................................... 16
3.8. Mercury porosimetry analysis of wood (Paper II)................................................................. 16
4. MODELLING THE EXPLOSION STEP ..................................................................................... 19
4.1. Background ........................................................................................................................... 19
4.1.1. Fibre-reinforced composite material and composite layups .......................................... 20
4.1.2. Linear elastic orthotropic material ................................................................................. 20
4.2. Finite Element Model ............................................................................................................ 22
4.2.1. Geometry ....................................................................................................................... 22
4.2.2. Elastic properties of wood cell ...................................................................................... 25
5. MODELLING THE IMPACT STEP ............................................................................................ 29
5.1. Background ........................................................................................................................... 29

x
5.2. Finite Element Model (Paper III) .......................................................................................... 30
5.2.1. Geometry and mesh ....................................................................................................... 30
5.2.2. Linear elastic deformation ............................................................................................. 31
5.2.3. Hashin’s damage initiation criteria ................................................................................ 31
5.2.4. Damage evolution using the Material Property Degradation model ............................. 32
5.2.5. Element deletion ............................................................................................................ 32
5.3. Material properties ................................................................................................................ 32
6. EXPERIMENTAL RESULTS AND DISCUSSION .................................................................... 35
6.1. Sugar composition of the wood samples (Paper IV) ............................................................. 35
6.2. Enzymatic hydrolysis (Paper IV) .......................................................................................... 36
6.3. Physical appearance .............................................................................................................. 37
6.4. Scanning electron microscopy ............................................................................................... 37
6.5. High-resolution X-ray tomography (Paper IV) ..................................................................... 38
6.6. Mercury porosimetry analysis (Paper II) ............................................................................... 42
7. MODELLING RESULTS AND DISCUSSION ........................................................................... 45
7.1. Modelling the explosion step ................................................................................................ 45
7.1.1. Single-cell model (Paper I) ............................................................................................ 45
7.1.2. Model consisting of earlywood and latewood cells (Paper V) ...................................... 48
7.1.3. Model consisting of ray cells and pits (Paper V)........................................................... 50
7.2. Modelling the impact step (Paper III) ................................................................................... 51
7.2.1. Simulation results and comparison with experiments ................................................... 51
7.2.2. Effect of velocity and steam treatment on damage parameter ....................................... 53
8. CONCLUSIONS ........................................................................................................................... 55
9. REFERENCES .............................................................................................................................. 57

xi
Abbreviations
FEM Finite element model
FSP Fibre saturation point
MC Moisture content
MFA Micro fibril angle
MPD Material property degradation
P Primary layer
S1, S2, S3, S4 Secondary layer
SEIW Steam exploded and impacted wood
SEM Scanning electron microscopy
SEW Steam exploded wood
STEX Steam explosion
STW Steam treated wood
SV Sub-volume
UTW Untreated wood
Symbols in equations
𝐴 Area (m2)
𝑪 Compliance matrix in local coordinates (Pa)
𝑪d Degraded material compliance matrix (Pa)
�̂� Compliance matrix after transformation (Pa)
𝐷 Diameter (m)
𝑑p Damage parameter
𝐸i Elastic modulus in i direction (Pa)
𝐺ij Shear modulus in ij plane (Pa)
𝑃 Pressure (Pa)
𝑃lm Material property at ambient conditions
𝑃lm′ Material property at elevated conditions
𝑅 Severity factor
𝑆lm Shear strength in lm plane (Pa)
𝑉 Volume (m3)
𝑋lc Compressive strength in l direction (Pa)
𝑋lt Tensile strength in l direction (Pa)

xii
Greek symbols
𝑎MC Degradation factor to include effect of elevated moisture content
𝑎T Degradation factor to include effect of elevated temperature
𝛼 Transformation angle
𝛾 Surface tension (N/m)
𝜀 Strain
𝜃 Angle
𝜈ij Poison’s ratio in ij plane
𝜎 Stress (Pa)
Subscripts
1 Direction along the micro-fibril
2 Direction perpendicular to the micro-fibril in the plane of the cell wall
3 Direction perpendicular to the micro-fibril and plane of cell wall
L Longitudinal direction
R Radial direction
T Tangential direction
x Direction along the cell
y Direction perpendicular to cell in the plane of the cell wall
z Direction perpendicular to cell and perpendicular to plane of cell wall

1. INTRODUCTION
1.1. Background
Everyday growing numbers of vehicles and industries increase the demand for fossil fuels.
Extensive use of fossil fuels has brought to the fore economic and environmental issues,
which has steered the attention of researchers to the utilization of sustainable and renewable
resources for the production of bio-fuels and other useful chemicals. Lignocellulosic
biomass is a widely available low-cost renewable resource that can be an excellent
alternative (Goldstein 1981; Claassen et al. 1999). It is a promising solution to the
environmental problems and the rise in CO2 production caused by the increased use of
petroleum products (Hamelinck et al. 2005; Sun and Cheng 2002).
The conversion of lignocellulosic biomass, e.g. wood, to ethanol is typically carried out
through enzymatic hydrolysis and fermentation (Romaní et al. 2013; Xu and Huang 2014).
This is technically difficult because the digestibility of cellulose and hemicelluloses is
hindered by the complex physical and chemical structure of wood (Sánchez and Cardona
2008). The enzymatic hydrolysis of native wood produces a negligible amount of glucose
(Martin-Sampedro et al. 2014). In order to make the hydrolysis process feasible, efficient
utilization of the raw material to obtain high product yield should be considered. A
pretreatment process that induces certain physical and chemical modifications in the wood
and improves the subsequent hydrolysis is necessary (Mosier et al. 2005). However, the
pretreatment process has been considered as one of the most expensive process steps in the
conversion of lignocelluloses to ethanol based on enzymatic hydrolysis (Mosier et al.
2005). Many pretreatment technologies have been investigated for different biomass types,
and several review articles have been published (Alvira et al. 2010; Carvalheiro et al. 2008;
Mosier et al. 2005; Xu and Huang 2014).
Steam Explosion (STEX) is one of the pretreatment processes that significantly improves
the enzymatic hydrolysis of pretreated wood. It is a widely employed physico-chemical
pretreatment for lignocellulosic biomass (Alvira et al. 2010). It has some major advantages
as compared to the alternatives, for instance a significantly lower environmental impact,
lower capital investment, greater energy efficiency, and less hazardous process chemicals
and conditions (Avellar and Glasser 1998). Several researchers have observed a remarkable

2
increase in glucose yield as a result of STEX pretreatment (Grous et al. 1986; Wu et al.
1999).
Studies related to the STEX process largely include investigations of the chemical and
physical changes in the pretreated wood (Negro et al. 2003; Tanahashi et al. 1982;
Toussaint et al. 1991). Knowledge about the mechanisms behind physical structural
modifications and the contribution of these to enhanced enzymatic hydrolysis is limited.
STEX pretreatment can be studied as a three-step process:
(i) Steam treatment step: treatment of wood chips with steam at high temperature
in a pressurized vessel
(ii) Explosion step: rapid decompression of steam, which creates a difference in
pressure between the inside of the wood cells and outside them in the vessel
(iii) Impact step: discharge of the wood chips into a blow tank, which results in
collisions between the wood chips and impact with the walls of the vessel
STEX pretreatment causes both chemical and physical structural changes in the pretreated
wood. The chemical modifications that take place in wood during the steam treatment
involve the degradation of hemicelluloses and depolymerisation/repolymerization of
lignin, which exposes the cellulose to enzymes (Li et al. 2007; Wang et al. 2009). In
addition, the chemical reactions that take place in the wood during the steam treatment
have a major impact on the elastic and strength properties of the wood (Gerhards 1982;
Salmén and Fellers 1982). The wood chip becomes soft and easily deformable during the
succeeding steps. This facilitates the physical structural alterations, which include the
creation of microcracks in the cell walls and disintegration of wood chips during the
explosion and impact steps.
A number of experimental studies demonstrate the structural changes in wood caused by
STEX pretreatment (Tanahashi et al. 1982; Toussaint 1991; Zhang and Cai 2006). Most
commonly, the microstructure of wood obtained after STEX pretreatment is analysed with
Scanning Electron Microscopy (SEM) (Donaldson et al., 1988; Zhang and Cai, 2006).
However, this technique only provides 2D images of the surface of the material. The 3D
interior structure of the pretreated wood without disruption can be visualized through high-
resolution X-ray tomography (Gilani el al. 2013; Bulcke et al. 2013).
The explosion step takes place at a high rate, and an investigation of the mechanics of this
step at the microscale by means of experiments is impractical. Finite Element Modelling
(FEM) is an excellent approach that can be used to study the modifications in the cellular
structure of wood during this step. This approach has been used to study the deformation
of wood cells caused during pulp and paper processes (De Magistris and Salmén 2008;
Fortino et al. 2015). Similarly, FEM can be used to simulate wood chip disintegration
during the impact step. Damage criteria, e.g. Hashin’s damage initiation criteria (Hashin
1980), can be used to predict the damage in a wood chip as a result of collisions between

3
wood chips and impact with vessel walls. Numerical modelling of the explosion and impact
step can reveal the mechanisms and possible reasons behind the structural modifications
that take place in a wood chip. These models can provide suggestions for STEX process
improvement.
1.2. Objectives
The objective of this thesis is to study and characterize the structural changes that take
place in wood during the STEX process through experiments and modelling. The three
steps of the STEX process were isolated and studied in detail. Several experimental
techniques were utilized, which improved the understanding of the process. Finite Element
Models were developed to simulate the explosion and impact steps.
1.3. Outline of the thesis
This thesis presents a summary of the experimental and numerical studies performed to
gain better understanding of the STEX process.
The beginning of Chapter 2 first gives information about the chemical composition and
physical structure of wood. Then, the biorefinery and the need for a pretreatment process
are discussed briefly, and a detailed introduction to the STEX process is given. In Chapter
3, the experimental setup and sample preparation are discussed. The experimental
techniques utilized to characterize the untreated and pretreated wood are also introduced in
Chapter 3. Chapter 4 covers the background and basic theory behind the FEM of the
explosion step. The geometry of the modelled cellular structure is presented, and a method
for calculating the elastic properties of a wood cell is included. In Chapter 5, modelling of
the impact step is briefly summarized.
Results from the experiments are discussed in Chapter 6, and the results from modelling
are presented in Chapter 7. Finally, in Chapter 8, the conclusions from both the
experimental and numerical investigations are summarized.
The five papers on which this thesis is based are attached at the end of this thesis.

4

5
2. BACKGROUND
2.1. Wood
Wood has a very complex physical structure and chemical composition. Its structure and
chemical composition make it useful for many applications. Wood is used in construction,
furniture, paper and packaging, fuel, and for obtaining many valuable chemicals. There
are mainly two types of wood; softwood (from gymnosperm trees) and hardwood (from
angiosperm trees). Examples of softwood are Spruce, Pine, and Fir; and examples of
hardwood are Birch, Beech, and Oak. This study is focused on the softwood Norway
spruce which is commonly grown in Sweden and is readily available. Norway spruce is
a basic raw material for many biorefineries. Below are some details about the physical
structure and chemical composition of Norway spruce.
2.1.1. Structure of softwood
The outer dead layer of the wood stem (trunk) in Figure 2.1 is called bark. It protects the
wood from physical, chemical, and biological degradation. The phloem, which consists
of inner cells, serves in the transport of nutrients and the storage of products. Vascular
cambium comes after the phloem and is a thin layer of cells that produce phloem cells on
the outside and xylem cells on the inside. Xylem constitutes the bulk of wood material. It
is divided into sapwood and heartwood. Sapwood is composed of living and dead cells
and heartwood is composed of entirely dead cells. At the centre of the stem is pith. It
contains tissues produced in the initial stages of plant growth. Based on the season of the
production of wood cells, the wood contains earlywood and latewood cells. Together
earlywood and latewood form a growth ring. Earlywood cells have a larger cross-section
and thinner walls than latewood cells.

6
Figure 2.1: Hierarchical structure of softwood
2.1.2. Cell structure
Figure 2.2: Composition of wood constituents through cell wall (Panshin and deZeeuw 1970)

7
The cells in softwood are arranged in longitudinal and radial directions. Norway spruce
mainly contains two types of cells, tracheids in the longitudinal direction and ray
parenchyma, also called ray cells, in the radial direction. Cells have different cross-
sectional shapes, e.g. circular, hexagonal, square, rectangle. Figure 2.1 illustrates a
simplified cell structure. Cells are joined together with middle lamella, M. The middle
lamella is composed of hemicelluloses and lignin. A cell wall is made of primary and
secondary layers, i.e. P, S1, S2, and S3. These layers differ in chemical composition,
thickness, and micro-fibril angle (MFA). Figure 2.2 illustrates the composition
distribution in different layers of a cell wall. A cell wall layer can be considered as a
micro-composite type layup with cellulose forming the micro-fibrils and hemicelluloses
and lignin mixture forming the matrix surrounding the fibres. The cellulose micro-fibrils
are randomly oriented in the primary layer and uniformly oriented in secondary layers.
There is a large variation in MFA in different layers of a cell wall, as found in different
studies included in a review article by Brändström (2001). The thickness and MFA of
different cell layers are given in Table 2.1. Ray cells, in contrast, have a smaller cross-
sectional size, thinner cell wall, and consist of an extra secondary layer S4 (Harada and
Wardrop 1960).
Cell walls have small pores called pits for the transportation of fluid between cells. The
pits between tracheids are called bordered pits, and the pits between tracheids and ray
cells are called cross-field pits. The number of bordered pits can be as high as 144 per
tracheid (Meyer 1971). The presence of a bordered pit in a cell wall effects the MFA. The
micro-fibrils in a pit border generally curve around the pit aperture (Imamura and Harada
1973). In contrast, the local MFA of the small areas between the cross-field pits of
earlywood tracheids usually show uniform micro-fibril distribution (Sedighi-Gilani et al.
2005).
Table 2.1: Thickness and MFA of Norway spruce cell. Thickness values are taken from Fengel
and Stoll (1973). MFA values are taken from different studies included in review article by
Brändström (2001)
Cell wall layer Thickness (µm)
MFA Earlywood Latewood
M 0.05-0.16 0.04-0.16
-
P Random
S1 0.12-0.40 0.19-0.71 45-55 O
S2 0.91-2.32 1.50-5.60 5-30 O
S3 0.02-0.19 0.01-0.36 40-50 O

8
2.1.3. Constituents of wood
Cellulose is the most common compound present in wood and the most abundant organic
compound on Earth. Cellulose constitutes about 38-50% of wood. It is a polysaccharide
in which the monomers β-D-glucose units are linked together with (1-4) glucosidic bonds.
Native cellulose has a degree of polymerization of 800-10000 monomers. Cellulose
chains arrange themselves to make fibrils. Cellulose has crystalline and amorphous
regions. The crystalline regions are more stable to chemical and thermal conditions than
the amorphous regions. Cellulose is, nowadays, of great interest for the production of
many products like textiles, composite plastics, ethanol, and paper.
Hemicelluloses are heterogeneous polysaccharides with a branched structure and a degree
of polymerization of 100-200 monomers. Hemicelluloses constitute 28-32% of wood.
Common monomers of hemicelluloses are D-glucose, D-mannose, D-galactose, D-
Xylose, and L-arabinose. Small amounts of L-rhamnose, D-glucoronic acid, 4-methyl-D-
glucuronic acid, and D-galacturonic acid are also present. Common hemicelluloses
include xylan, glucuronoxylan, arabioxylan, glucomannan, and xyloglucan.
Hemicelluloses differ in different species of wood. Hemicelluloses are found in the matrix
between the cellulose fibrils in the cell wall. The chemical and thermal stability of
hemicelluloses is generally lower than that of cellulose. Hemicelluloses can be extracted
and converted to ethanol.
Lignin is a complex compound with a three-dimensional molecular structure consisting
of phenyl propane units. It is amorphous and sensitive to moisture and thermal changes.
It is present in the middle lamella and in the cell wall. Lignin acts as a bond between cells
and micro-fibrils. Lignin constitutes15-35% of wood. Its concentration is higher in
softwood than in hardwood.
2.2. Biorefinery
Biomass can be used to produce electricity by being burned directly in a furnace and
producing electricity through steam generators. However, in the current infrastructure of
vehicles in which electric vehicles are less common, the demand for liquid fuels is
essential. A biorefinery is a facility that takes biomass as a raw material and produces
liquid fuel, energy, and value-added chemicals. There are several types of biorefineries
depending on the type of raw material used. Lignocellulosic biomass can be used for the
extraction of biopolymers and the production of ethanol through the hydrolysis of
cellulose and hemicelluloses. However, access to hemicelluloses and cellulose is hindered
by the complex chemical and physical structure of biomass. The pretreatment of biomass
is essential for modifying its structural and chemical characteristics. However, this step
is one of the main economic costs in the process. There is much ongoing research focused
on identifying, evaluating, developing, and demonstrating promising pretreatment
techniques that enhance the subsequent enzymatic hydrolysis of pretreated biomass.

9
2.2.1. Factors limiting enzymatic hydrolysis
One of the main factors limiting the enzymatic hydrolysis of biomass is the accessibility
of enzymes to the polysaccharides in it. The main objective of pretreatment is to make
the polysaccharides accessible to enzymes by increasing the available surface area. The
linkages of lignin with hemicelluloses and cellulose inhibit the accessibility of enzymes
and make biomass difficult to digest (Mansfield et al. 1999). Lignin acts as a physical
barrier to enzymes and prevents hydrolysis (Chang and Holtzapple 2000). The
pretreatment process aims to break this linkage.
The removal of hemicelluloses also increases the available pore area of the biomass,
increases accessibility, and the probability that the cellulose will be hydrolysed. However,
hemicelluloses can be fermented to ethanol, and the degradation of hemicelluloses may
not be required for some applications. The pore size of the substrate in relation to the size
of the enzymes is another limiting factor. An increase in the porosity of the substrate
during the pretreatment process can significantly improve hydrolysis (Grous et al. 1986).
2.2.2. Pretreatment processes
The selection of pretreatment technology depends on several factors. Some of these
factors are an increase in the digestibility of pretreated biomass, no significant sugar
degradation, and the use of a minimum amount of toxic compounds. The reduction of
biomass size to a very small scale that increases cost should be avoided. The operation
should be of a reasonable size as well as economic with minimum heat and power
requirements (Alvira et al. 2010).
Kumar and Murthy (2011) have recently studied the economic aspects of ethanol
production using common pretreatment technologies such as dilute acid, dilute alkali, hot
water, and steam explosion. The process included feedstock handling, pretreatment,
simultaneous saccharification and co-fermentation, ethanol recovery, and downstream
processing. Their results are given in Table 2.2.
Table 2.2: Techno-economic aspects of ethanol production using common pretreatment
technologies (Kumar and Murthy 2011)
Pretreatment Ethanol yield
(L/dry MT
biomass)
Capital cost of
ethanol plant
processing
250,000 MT
biomass/year
($/L)
Ethanol
production cost
($/L)
Water use
(kg/L)
Dilute acid 252.62 1.92 0.83 5.96
Dilute alkali 255.80 1.73 0.88 6.07
Hot water 255.27 1.72 0.81 5.84
Steam explosion 230.23 1.70 0.85 4.36

10
It is necessary to adopt suitable pretreatment technologies based on the properties of the
raw material. Several pretreatment technologies are available, and the most common ones
are discussed below.
2.2.3. Alkali pretreatment
Alkali pretreatment increases cellulose digestibility by affecting the lignin in the biomass
(Yan et al. 2015). This pretreatment has been found effective in increasing enzymatic
hydrolysis of biomass (Mirahmadi et al. 2010; Park and Kim 2012). Alkaline reagents
such as ammonium hydroxide, sodium hydroxide, and calcium hydroxide have been used
as pretreatment reagents (Kim et al. 2016). The degradation of hemicelluloses and
cellulose is minor as compared to acid and hydrothermal pretreatment (Carvalheiro et al.
2008). Alkali pretreatment can be performed at room temperature, and the time ranges
from a few minutes to several hours (Park and Kim 2012). This pretreatment has been
found more effective for hardwood than for softwood (Mirahmadi et al. 2010).
2.2.4. Acid pretreatment
In acid pretreatment, hemicelluloses are solubilized to make the cellulose more accessible
to enzymes (Saha et al. 2005). Concentrated or diluted acid can be used, but the use of
concentrated acid is not suitable for ethanol production because of the degradation of
hemicelluloses and cellulose and the formation of inhibiting compounds which affects
the fermentation step (Lee et al. 2015; Zhang et al. 2013). Other drawbacks are the
problem of equipment corrosion and acid recovery (Brodeur et al. 2011). This
pretreatment is carried out at a high temperature for a short period of time or at a low
temperature for a longer period.
2.2.5. Liquid hot water pretreatment
The pretreatment of biomass with liquid hot water does not require any catalyst or
chemicals. Biomass is processed with liquid hot water at 160-240 °C. High pressure is
required to maintain the water in its liquid state. During liquid hot water processing,
hemicelluloses are solubilized, and lignin is degraded to make cellulose more accessible.
The problem of the formation of inhibitors is, thus, reduced. However, high demands for
water and energy make this process very expensive (Alvira et al. 2010; Zhuang et al.
2016).
2.2.6. Steam explosion pretreatment
Steam Explosion (STEX) is a widely employed physico-chemical pretreatment for
lignocellulosic biomass (Alvira et al. 2010). This process combines both chemical and
mechanical effects. It does not require chemicals or a catalyst, and the problem of the
formation of inhibitors is reduced. The energy requirement for this pretreatment is less
than for the liquid hot water process. The important parameters that affect the STEX
11
process are temperature, pressure, processing time, moisture content, and particle size.
Overend and Chornet (1987) have introduced a severity factor to characterize the STEX
process. The factor includes the combined effect of both temperature, T (°C), and time, t
(min), and is given by:
A large value of 𝐿𝑜𝑔(𝑅) correlates to severe process conditions (i.e. high temperature
and/or time). Wu et al. (1999) referred to 𝐿𝑜𝑔(𝑅) = 3 as low severity, 𝐿𝑜𝑔(𝑅) = 3.5 as
medium severity, and 𝐿𝑜𝑔(𝑅) = 4.2 as high severity.
2.2.6.1. Chemical modifications
As the treatment severity increases, the degradation of hemicelluloses also increases due
to an autohydrolysis reaction that results in the breakage of glycosidic linkage (Martin-
Sampedro et al. 2011; Wang et al. 2009; Boussaid et al. 2000). The acetic acid formed from
the acetyl group and the role of water as an acid at high temperature catalyses the reaction
(Ramos 2003). In combination with the partial hydrolysis and solubilisation of
hemicelluloses, a degradation of cellulose also takes place. Josefsson et al. (2002) have
observed a decrease in the molecular weight of cellulose with an increase in treatment
severity. At very high severity, furfural and hydroxyl-methylfufural are produced from
pentoses and hexoses, respectively (Li et al. 2005).
During the steam treatment step, lignin is mainly degraded through the cleavage of β-O-4
ether linkage (Martin-Sampedro et al. 2011). The depolymerisation and repolymerization
of lignin take place almost simultaneously (Li et al. 2007). The changes in lignin structure
may contribute to non-productive enzymatic adsorption (Rahikainen et al. 2013).
2.2.6.2. Physical modifications
A large amount of energy is required to reduce the size of a wood chip before pretreatment
(Hamelinck et al. 2005). Ballesteros et al. (2000) have studied the effect of chip size on
STEX pretreatment of softwood. They found that the utilization of very small chips in
STEX is not necessary, and this is one primary advantage of STEX pretreatment.
The mechanical effects caused by the explosion and impact steps during the STEX process
create microcracks in the cellular structure and disintegrate the wood chips. The
disintegration of the wood chips is caused by the impact of highly softened chips in a blow
tank (Law and Valade 1990). At the microscale, several researchers (Donaldson et al. 1988;
Tanahashi et al. 1982) have observed considerable ultrastructural rearrangements. Zhang
and Cai (2006) have found cracks in cell walls and ruptures in pits in steam-exploded Sub-
alpine fir. The STEX process increases the porosity and available surface area of the wood
with an increase in treatment pressure (Grous et al. 1986).
𝐿𝑜𝑔(𝑅) = 𝐿𝑜𝑔[𝑡𝑒𝑥𝑝{(𝑇 − 100)/14.75}] (2.1)

12
The following chapters summarise the experimental and modelling studies performed in
order to understand the basic mechanisms of the STEX process.

13
3. EXPERIMENTAL
Several experimental techniques were utilized to study the modifications in wood
structure during the different steps of STEX pretreatment. The different steps of STEX
pretreatment were carefully isolated using specially designed experimental apparatuses.
The physical structure of the pretreated wood sample was characterized using scanning
electron microscopy (SEM), high-resolution X-ray tomography, and mercury
porosimetry analysis. The contribution of the physical structural modification to an
increase in enzymatic hydrolysis was studied as well.
3.1. Steam explosion experiments and apparatus
Figure 3.1: Steam explosion equipment and schematic of experiments
Two STEX apparatuses were specifically designed for the experimental purpose (Figure
3.1). Steam was inserted through the steam inlet pipe into the steam treatment vessel and
exited through the steam explosion valve into a blow tank. The equipment was designed
for an operating pressure of 18 bar and a vessel volume of 3.8 and 18 litres. Two glass
windows were installed to watch the process during the experiment in the 3.8 L STEX
equipment. Experiments could be performed on a single wood piece and the different steps

14
of STEX could be isolated in these apparatuses. Wood chips after each different step, i.e.
steam treatment, steam explosion, and impact, were obtained as follows:
Steam-treated wood (STW)
In the small STEX apparatus (3.8 L), a wood piece was steam treated for a specific amount
of time, and then the steam release valve was opened slowly to avoid explosion, and
unexploded steam-treated wood was obtained.
Steam-exploded wood (SEW)
In the experiments in which the wood samples were subjected to only steam explosion
without impact, the wood samples were enclosed in a wire frame either in the small or the
big STEX vessel, and the pressure was rapidly released to obtain steam-exploded wood
samples.
Steam-exploded and impacted wood (SEIW)
In order to obtain steam-exploded and impacted wood, wood chips were placed in the big
steam treatment vessel. After treatment with steam, the pneumatically controlled knife gate
valve was quickly opened, and the wood chips were discharged into the blow tank (at
atmospheric pressure) and were allowed to collide with other chips and equipment walls.
In this way, it was possible to isolate the different steps during the STEX process and study
the effect of each step on a wood chip in detail. The STEX experiments were mainly
performed at 7, 10, and 14 bar pressure with treatment times of 5 and 10 minutes. These
are moderate operating conditions for STEX pretreatment, and the values of the severity
factor are between 2.7 and 3.8 (Wu et al. 1999).
The terms untreated wood UTW, steam-treated wood STW, steam-exploded wood SEW,
steam-exploded and impacted wood SEIW will be used consistently in the thesis. It should
be noted that these terms have been used differently in the individual papers attached at the
end of the thesis.
3.2. Material and sample preparation
The ultra-structure of wood is very complex and variable. In order to study and compare
the different steps of the STEX process, wood pieces with dimensions of 120 mm x 20
mm x 4 mm of Norway spruce were used as samples. These large pieces were divided
into small parts (with the dimensions 30 x 20 x 4 mm3 and 20 x 20 x 4 m3) with a band
saw. From each large wood piece, one part was saved as the reference, and the other parts
were used for the experiments. This made the samples comparable.

15
3.3. Acid hydrolysis (Paper IV)
Acid hydrolysis of UTW, STW, and SEIW samples was performed to determine the
carbohydrate and lignin composition according to Theander and Westerlund (1986). The
samples were oven-dried and ground to 1 mm sieve size. Then 200 mg of dried powder
was added to 3 mL of 72% H2SO4. The samples were evacuated for 15 min and were
placed in a water bath at 30 °C for 30 min. After adding 84g of distilled water, the samples
were heated in an autoclave at 125 °C for one hour. Next, the solution was filtered into a
100 mL round flask, and the flask was filled with distilled water up to the mark. The
monosugar contents in the solution were determined using High Performance Anion-
Exchange (HPAE) chromatography. The remaining acid insoluble solid fraction was
weighed to estimate Klason lignin. The acid soluble lignin was determined by measuring
UV absorbance values at a wavelength of 205 nm (Lin and Dence 1992) in a Specord
205, Analytik Jena.
3.4. Enzymes and enzymatic hydrolysis (Paper IV)
The cellulolytic complex Cellic® Ctec3 (Novozymes A/S, Denmark) was used for the
enzymatic hydrolysis of UTW, STW, and SEIW. Cellic® Ctec3 is a cocktail consisting
of cellulases, hemicellulases, and a high level of β-glucosidases for the conversion of
carbohydrates into monosaccharides.
The hydrolysis reactions (in triplicates) were carried out in 50 mL falcon tubes with a
total volume of 15 mL. Incubation was performed for 30 and 72 hours with an enzyme
dose of 10 % w/w (g Cellic Ctec3/100 g carbohydrate) in a rotary shaker, at 200 rpm, 45
°C and pH = 5 (using 50 mM sodium acetate buffer). The reactions were stopped by
boiling for 15 min at 100 °C. The solid residue was separated from the liquid by
centrifugation, and supernatants were filtered through 0.2 μm sterile nylon filters. The
glucose released during enzymatic hydrolysis was determined using HPAE
chromatography.
3.5. High Performance Anion-Exchange (HPAE)
chromatography (Paper IV)
Monosaccharides released after acid and enzymatic hydrolysis were analysed using a
Dionex ICS-3000 system equipped with a 4 × 250 mm Dionex Carbopac™ PA1 column
with a 4 × 50 mm guard column maintained at 30 °C and a pulsed amperometric detector
(HPAEC-PAD). Calculations were performed using the Chromeleon software (Thermo
Scientific, Sweden).

16
3.6. Scanning electron microscopy (Paper II, V)
SEM images of the outer surface of untreated and pretreated wood samples were taken
using a EVOHD15 (Carl Zeiss, UK) ESEM instrument (Paper II) and a Table-top ProX
(Phenom, Netherlands) SEM (Paper V).
3.7. High-resolution X-ray tomography (Paper IV)
High-resolution X-ray tomography was performed to construct 3D images of the internal
structure of UTW and SEIW samples. The analysis was conducted in a SkyScan 1172
(Bruker, Sweden) equipped with 11 megapixel, 12-bit dynamic range cooled charge-
coupled device (CCD) camera at Ångström laboratory Uppsala University, Uppsala,
Sweden. The 3D images of the material were reconstructed based on a set of two-
dimensional projections taken from different angles by rotating the sample 192° in the X-
ray beam at increments of 0.2° on a high precision stage. A stack of 2D images was
reconstructed from raw tomographic projections using NRecon 1.6.10.1 software
(Bruker, Sweden). These images were post-processed to obtain 3D images of internal
structures using Avizo 9.0 (FEI, France). Image post-processing included image
enhancement, noise removal, cropping to sub-volume, surface smoothening, and rotation
for the alignment of the sub-volume. Cubical sections with the approximate dimensions
of 1.4 mm were sliced from UTW and SEIW samples in wet conditions with a sharp razor
blade. Further details about the analysis are given in Paper IV.
3.8. Mercury porosimetry analysis of wood (Paper II)
The structural changes in a wood piece during the STEX process were characterized using
mercury porosimetry analysis in an AutoPore IV (Micromeritics, USA). This is a useful
technique that provides information about a sample’s total pore volume, porosity, and
pore size distribution (Moura et al. 2002). The theory behind the analysis is based on the
fact that mercury does not penetrate pores through capillary action, unless a pressure is
applied. The applied pressure is inversely proportional to pore diameter and is calculated
using the Washburn equation (Washburn 1921)
𝐷 = −4𝛾𝑐𝑜𝑠𝜃
𝑃 (3.1)
where 𝐷 is the pore diameter, 𝑃 is the pressure, 𝜃 is the contact angle, and 𝛾 is the surface
tension. A contact angle of 130° and surface tension of 0.485 N/m were used for the
calculation since these values for wood material are not known (Pfriem et al. 2009). An
average pore diameter was calculated as
𝐷𝑎𝑣𝑔 = 4𝑉 𝐴⁄ (3.2)

17
where 𝑉 is the total intrusion volume and 𝐴 is the total pore area calculated with a
cylindrical pore assumption. The wood samples were freeze-dried at -20 °C prior to
analysis.

18

19
4. MODELLING THE EXPLOSION
STEP
4.1. Background
During the steam treatment step, the wood chips are processed with steam at high pressure.
At this step of the process, equal pressure exists inside the wood sample and outside the
sample in the vessel. After the steam treatment step, the pressure in the vessel is rapidly
reduced to atmospheric pressure. The pressure drop inside the wood sample is not as fast
as it is in the vessel. This causes a difference in pressure between the inside and outside of
the wood chip. The net pressure exerted on a cell wall depends on the pressure release rate
in the vessel and inside the cell (Zhengdao et al. 2012). The stresses created during the
explosion step contribute to structural modifications at the cellular scale.
Since the stresses during the explosion step are created at the cellular scale, it is necessary
to study the mechanism at this scale to gain a better understanding of the explosion step.
Li et al. (2010) have derived an analytical model for stress distribution in a single
cylindrical-shaped cell for the application of microwave explosion pretreatment. However,
for simulation of a cellular structure with a complex geometry, FEM is an excellent
approach. Several studies have been published related to the modelling of wood cells using
FEM for different applications (De Magistris and Salmén 2008; Qing and Mishnaevsky Jr.
2009; Astley et al. 1998). De Magistris and Salmén (2008) have modelled a bundle of cells
with a square shape to study the effect of compression and combined shear and
compression during the refining process of the pulp and paper industry.
Steam treatment causes a loss of stiffness and strength of the wood material, which
facilitates the deformation of the cells during the explosion step. For the simulation of the
explosion step, elastic properties of the wood cell wall are required at high temperature and
moisture content (MC). Several experimental studies show that the stiffness and strength
of wood decreases with an increase in temperature and MC (Keunecke et al. 2007; Salmén
and Fellers 1982; Kufner 1978; Goulet 1960). However, knowledge about the effect of
combined temperature and MC on cell wall properties is limited.

20
In this attempt to model the explosion step, the cellular structure of wood was simulated
using FEM developed in the commercial software ABAQUS (Dassault Systemes, USA).
First, a single cell was modelled, and the effect of internal pressure on deformation in the
cell was studied. Then the cells were combined, and a cellular structure consisting of
earlywood and latewood cells was modelled. Finally, the effect of internal pressure on the
ray cells and tracheids containing pits was studied. The elastic properties of cell wall layers
were estimated at ambient conditions (12 % MC at 20 °C) and at elevated conditions (30
% MC and 160 °C).
4.1.1. Fibre-reinforced composite material and composite
layups
Fibre-reinforced composite material consists of fibres as a dispersed phase that is
surrounded by a matrix as a continuous phase. The composite layer has high values of
stiffness and strength in the direction parallel to the fibres and low values in the
perpendicular direction. In a composite layup, different layers of composite materials, with
varying properties and fibre directions, are joined over each other as shown in Figure 4.1.
A wood cell wall may be regarded as a biopolymer composite material in which fibres are
made of cellulose micro-fibrils, and the matrix surrounding the micro-fibrils is composed
of a hemicellulose-lignin mixture.
Figure 4.1: Fibre-reinforced composite material and composite layup
4.1.2. Linear elastic orthotropic material
The relation of stress and strain for a three-dimension orthotropic material written in the
matrix form with 1, 2, and 3 directions (local coordinates shown in Figure 4.1) is given as
{
𝜎11𝜎22𝜎33𝜎12𝜎13𝜎23}
=
[ 𝐶11𝐶12𝐶13000
𝐶12𝐶22𝐶23000
𝐶13𝐶23𝐶33000
000𝐺1200
0000𝐺130
00000𝐺23]
{
𝜀11𝜀22𝜀33𝜀12𝜀13𝜀23}
(4.1)

21
𝐶11 = 𝐸1(1 − 𝜈23𝜈32)Γ (4.2)
𝐶22 = 𝐸2(1 − 𝜈13𝜈31)Γ (4.3)
𝐶33 = 𝐸3(1 − 𝜈12𝜈21)Γ (4.4)
𝐶12 = 𝐸1(𝜈21 + 𝜈31𝜈23)Γ (4.5)
𝐶23 = 𝐸2(𝜈32 + 𝜈12𝜈31)Γ (4.6)
𝐶13 = 𝐸1(𝜈31 + 𝜈21𝜈32)Γ (4.7)
Γ = 1 (1 − 𝜈12𝜈21 − 𝜈23𝜈32 − 𝜈31𝜈13 − 2𝜈21𝜈32𝜈13)⁄ (4.8)
where 𝜎 and 𝜀 denote stress and strain, 𝐸i is the elastic modulus in the i direction, 𝐺ij is
the shear modulus in the ij plane, and 𝜈ij is the Poisson ratio in the ij plane. Direction 1
denotes along the micro-fibril, 2 denotes perpendicular to the micro-fibril in the plane of
the cell wall, and 3 denotes perpendicular to the plane (see Figure 4.1). Equation 4.1 can
be written in tensor form as
𝝈 and 𝜺 are the stress and strain written in tensor form, and 𝑪 is the compliance matrix.
The compliance matrix in global coordinates (x, y, z in Figure 4.1), �̂�, can be calculated
from the compliance matrix in local coordinates (1, 2, 3), 𝑪, using 3D transformation with
the transformation angle α as:
�̂� = 𝑻𝟐−𝟏(𝛼)𝑪𝑻𝟏(𝛼) (4.10)
The transformation matrixes 𝑻𝟏(𝛼) and 𝑻𝟐(𝛼) are given as
𝑻𝟏(𝛼) =
[
cos2 𝛼sin2 𝛼0
−(sin 2𝛼)/200
sin2 𝛼cos2 𝛼0
(sin 2𝛼)/200
001000
sin 2𝛼−sin 2𝛼
0cos 2𝛼00
0000
cos𝛼−sin 𝛼
0000
sin 𝛼cos 𝛼]
(4.11)
𝑻𝟐(𝛼) =
[ cos
2 𝛼sin2 𝛼0
−sin 2𝛼00
sin2 𝛼cos2 𝛼0
sin 2𝛼00
001000
(sin 2𝛼)/2−(sin 2𝛼)/2
0cos 2𝛼00
0000
cos 𝛼−sin 𝛼
0000
sin 𝛼cos 𝛼]
(4.12)
𝝈 = 𝑪𝜺 (4.9)

22
4.2. Finite Element Model
The wood cells were modelled with orthotropic linear elastic material properties. The
viscoelastic nature of wood and damage in the material was not modelled because the
necessary properties of the cell wall at STEX conditions were lacking. A pressure of 8.01
bar was applied inside the cell as a uniformly distributed pressure to simulate the expansion
of vapours. The cell was free to expand from the outside, and atmospheric pressure (1.01
bar) was exerted on the cell surface from the outside. In the model composed of a bundle
of cells, the same internal pressure was applied inside each cell. The elements were linear
quadrilateral shell elements. Successive simulations were performed for each model to
ensure that the mesh was sufficiently dense.
4.2.1. Geometry
4.2.1.1. Single-cell model (Paper I)
The cell was modelled with primary layer P, secondary layers S1, S2, S3, and middle
lamella M surrounding the cell as shown in Figure 4.2. Each cell layer was modelled as a
composite material in which micro-fibrils were made of cellulose, and the matrix
surrounding the micro-fibrils was composed of a hemicellulose-lignin mixture. Different
layers of the cell were connected as the composite layup. The middle lamella, M, contained
a mixture of hemicelluloses and lignin.
Figure 4.2: Representation of wood cell in FEM

23
In this study, the modelled cell was assumed to have a square cross-section. However, the
effect of the cross-sectional shape of the cell on deformation was also studied by modelling
cells with circular, hexagonal, and rectangular shapes. As mentioned earlier, there is a large
variation in cell dimensions, wall thickness, MFA, and chemical composition in spruce
cells. The specifications of the modelled cell are given in Table 4.1. A cell with a diameter
of 30 µm and a length of 40 µm in the longitudinal direction was modelled. The length was
sufficient to include the longitudinal effect of cell geometry.
Table 4.1: Component percentage, thickness, and MFA of different layers of spruce cell, (Bodig
and Jayne 1982; Brändström 2001)
Wall
layers
Composition (%) Thickness
(µm) MFA
Cellulose Hemicellulose Lignin
S3 46 36 18 0.09 -40°
S2 48 30 21 2.3 10°
S1 26 30 44 0.26 -50°
P 14 30 55 0.09 Random
M 0 40 59 0.45 0°
4.2.1.2. Model with earlywood and latewood cells (Paper V)
Single cells were joined to construct a bundle of cells consisting of earlywood and
latewood cells. The earlywood cells had a larger cross-sectional dimension and thinner
cell walls than the latewood cells, as shown in Figure 4.3. The individual cells were joined
using the Tie constraint, which restricts the joining surfaces from slip.
A wood chip with the dimension of a few centimetres has several thousand cells. It is
computationally very expensive to simulate a model consisting of several thousand cells.
Therefore, a computationally cheap model was simulated, and the effect of increasing the
number of cells in both the radial and tangential directions on the stresses in the cells was
studied. The model shown in Figure 4.3 has 11 columns of cells in the tangential direction,
T, and 24 rows of cells in the radial direction, R. The model was successively enlarged
by adding a column of cells in the tangential direction from the smallest model composed
of 7 x 24 cells to the largest model with 35 x 24 cells. On the other hand, when the model
was enlarged in the radial direction, a row of cells was added at the bottom of the model.
The model was increased from 13 x 24 to 13 x 30 cells. The cells had a width of 30 µm
in the tangential direction and a length of 30 µm in the longitudinal direction.

24
Figure 4.3: Structure, dimensions, and direction of cells in model (all values are in µm). Model
with 11 x 24 cells
4.2.1.3. Model with pits and ray cells (Paper V)
A separate model containing tracheids with bordered and cross-field pits and ray cells
was developed with a very fine mesh necessary to resolve complex geometric features.
This limited the total number of cells to 20 tracheids and 5 ray cells, as shown in Figure
4.4. It can be seen that two bordered pits exist on the wall between the tracheids. The
structure and dimensions of the bordered pit were obtained through a SEM micro-graph
of softwood (Schulte 2012). The MFA in the secondary layers (S1, S2, and S3) linearly
changed from being unidirectional in the cell wall to circular in the outer-margin, as
shown in Figure 4.4b. The bordered pit was modelled with S1, S2, and S3 layers as M
and P layers are not present in a bordered pit (Murmanis and Sachs 1969). The cross-field
pits between the tracheids and ray cells were modelled as elliptic holes at a 45° angle in
the cell walls with the dimensions taken from SEM images of Norway spruce. The micro-
fibrils in the cell wall around the cross-field pits were unidirectional (Sedighi-Gilani et
al. 2005). The cross-sectional dimension of the square tracheid was 30 µm, the length was
50 µm, and the S2 layer thickness was 2 µm. In contrast, the cross-sectional dimension
of the rectangular ray cell was 5 x 10 µm2, the length was 150 µm, and the S2 layer
thickness was 1 µm.

25
Figure 4.4: (a) Model with bordered pits, cross-field pits, and ray cells, (b) mesh and MFA of S2
layer around bordered pit.
4.2.2. Elastic properties of wood cell
The elastic properties of a wood cell differ significantly depending upon ultra-structural
features. Bergander and Salmén (2000) have experimentally determined the elastic
modulus in the transverse direction (perpendicular to the longitudinal direction) of spruce
cells and found that three cells situated in the same annual ring but at different locations
had significantly different elastic moduli (750, 1400, 3050 MPa).
The elastic properties of wood are affected by changes in temperature and MC, thus, the
elastic properties of wood after steam treatment during the STEX process are much
different from the properties at ambient conditions. In this study, the elastic properties of
wood cells at elevated temperatures and MC were estimated in two steps. First, the elastic
properties of the cell wall were calculated at ambient conditions (20 °C and 12% MC)
using the elastic properties of the basic constituents of wood (given in Table 2 in Paper
I). Then, the effect of high temperature and MC on the elastic properties of the wood
material was used to estimate the corresponding softening of the cell wall stiffness.
The elastic properties E1 and 12 of unidirectional layers, i.e. secondary wall and middle
lamella, were calculated using a simple rule of mixing, i.e. volume fraction average. The
elastic modulus perpendicular to micro-fibrils, E2, and shear modulus, G12, were
calculated using Halpin-Tsai (Halpin and Kardos 1976) equations. The properties of the
primary layer with long random micro-fibrils were calculated using the classical laminate

26
theory (see Tsai, 1992). Details about these equations are given in Paper I. Estimated
elastic properties with local coordinates at ambient conditions are given in Table 4.2.
Table 4.2: Estimated elastic properties of different layers of a cell at 20 °C and 12% MC in local
coordinates
M P S1 S2 S3
E1 (GPa) 4.2 10.3 38.8 68.3 66.0
E2 (GPa) 1.9 10.3 3.5 5.4 5.0
E3 (GPa) 1.9 2.7 3.5 5.4 5.0
G12 (GPa) 1.3 3.7 1.7 2.4 2.4
G13 (GPa) 1.3 1.5 1.7 2.4 2.4
G23 (GPa) 1.3 1.5 1.6 2.1 2.1
12 0.26 0.38 0.22 0.17 0.17
13 0.26 0.44 0.22 0.17 0.17
23 -0.29 0.44 0.08 0.31 0.19
4.2.2.1. Effect of temperature and moisture content on elastic
properties of cell
During the treatment of chips with steam, chip stiffness is reduced by a large amount.
Several experimental studies have been carried out that provide information about the
reduction in wood stiffness with an increase in temperature and MC. Keunecke et al.
(2007) have experimentally determined the effect of MC on elastic properties of Norway
spruce and found a large decrease in elastic properties due to the increase in MC (Figure
4.5a). Salmén and Fellers (1982) have measured the change in the elastic modulus of
water-soaked Norway spruce perpendicular and parallel to tracheids at temperatures up
to 140 °C (see Figure 4.5b). Table 4.3 shows the relative change in different elastic
properties of spruce wood with changes in temperature and MC.

27
Figure 4.5: (a) Effect of MC on elastic modulus. Normalized elastic modulus is 1 at 12% MC
(Keunecke et al. 2007), (b) Effect of temperature on elastic modulus. Normalized elastic modulus
is 1 at 20 °C (Salmén and Fellers 1982)
Table 4.3: Fractional change in elastic properties of spruce with change in temperature and MC
(Keunecke et al. 2007; Salmén and Fellers 1982)
Fractional change in property with change in MC from 12% to 30% at 20 °C
𝑎MC
Modulus of elasticity parallel to cell Ex -0.28
Modulus of elasticity perpendicular to cell Ey -0.36
Shear modulus parallel to cell Gxy -0.26
Fractional change in property with change in temperature from 20 °C to 160 °C
𝑎T %
Modulus of elasticity parallel to cell Ex -0.55*
Modulus of elasticity perpendicular to cell Ey -0.84*
Shear modulus parallel to cell Gxy -0.69**
*Result extrapolated from 140 °C
**Arithmetic mean of corresponding Ex and Ey
According to a study compiled by Gerhards (1982), the change in shear modulus lies in
between the change in the elastic modulus parallel to the cell and perpendicular to the cell
with an increase in temperature from 20 to 70 °C. The relative change in shear modulus
with change in temperature was taken as the arithmetic mean of the corresponding change
in the elastic moduli parallel and perpendicular to the cell. The degradation in the
properties in the z-direction was assumed to be same as in the y-direction.

28
In the second step, the elastic properties of a cell at elevated temperatures and MC were
estimated. The relative changes in elastic properties with change in temperature, 𝑎T , and
MC, 𝑎MC , are given as parallel and perpendicular to the cell in Table 4.3. In order to use
these factors, it was necessary to transform the elastic properties of the cell wall from
local coordinates to global coordinates using Equations 4.10 - 4.12. The elastic properties
of a wood cell were estimated at elevated temperatures and MC using equation
𝑃lm′ = 𝑃lm(1 + 𝑎MC)(1 + 𝑎T) (4.13)
where 𝑃lm is the elastic property in the global coordinate at ambient conditions, and 𝑃lm′ is
the corresponding elastic property at elevated conditions. The estimated elastic properties
in the local coordinates at 160 °C and 30% MC are given in Table 4.4. It should be noted
that these properties are estimates of cell wall properties and may differ from actual cell
wall properties.
Table 4.4: Elastic properties of different layers of a cell at 160 °C and 30% MC in local coordinates
M P S1 S2 S3
E1 (GPa) 1.4 3.3 1.1 9.5 2.0
E2 (GPa) 0.2 1.1 1.1 0.6 1.1
E3 (GPa) 0.2 0.3 0.4 0.6 0.5
G12 (GPa) 0.3 0.9 0.3 0.6 0.4
G13 (GPa) 0.3 0.3 0.2 0.5 0.3
G23 (GPa) 0.1 0.2 0.3 0.2 0.3
12 0.26 0.38 -0.21 0.10 -0.39
13 0.26 0.4 0.10 0.24 0.21
23 -0.29 0.4 0.09 0.30 0.19

29
5. MODELLING THE IMPACT STEP
5.1. Background
After the steam treatment step, the steam discharge valve is rapidly opened, which causes
the steam and the wood chips to escape the vessel at a very high speed. These fast moving
wood chips collide with each other and with the walls of the equipment and disintegrate
into smaller pieces. It is desirable to obtain highly damaged and disintegrated wood as it
has a large surface area and accessibility to hemicelluloses and cellulose is greater.
A FEM was developed to simulate collisions between wood chips and impact with walls
of the equipment. The macroscale FEM provided insight into the actual process without
performing expensive and time-consuming experiments.
Wood is usually modelled as a homogeneous continuum material with linear elastic
and/or viscoelastic orthotropic material properties until failure. The initiation of failure is
predicted by applying a strength-based failure criterion, e.g. Tsai–Hill, Tsai–Wu, and
Hashin’s criteria. Guindos and Guaita (2013) have compared eight different failure
criteria to model knotty wood and found that Hashin’s failure criteria show an average
absolute error of 9.8 %. Hashin’s damage criteria have been used by several researchers
for strength prediction as well as for progressive damage analysis, and have shown good
agreement with experiments (McCarthy et al. 2005; Kermanidis et al. 2000; Camanho
and Mathews 1999).
The evolution of damage is most commonly modelled by using the Material Property
Degradation model (MPD). Rubio-López et al. (2015) have used MPD to model the
progress in damage in composite materials by using the approach that when the damage
initiation criterion is satisfied in an element, it loses its corresponding stiffness
completely.
The modelled wood chips followed linear elastic deformation until failure. The failure
initiation was predicted by using the 3D Hashin’s failure initiation criteria, and the
damage evolution was modelled using the MPD model. This was achieved by developing
a user-defined subroutine and implementing it in the software ABAQUS/Explicit. The

30
elastic and strength properties of spruce wood were obtained from the literature at 12%
MC at 20 °C (ambient conditions) under quasi-static conditions, and these were used to
estimate chip properties at 30 % MC at 160 °C (elevated conditions).
5.2. Finite Element Model (Paper III)
5.2.1. Geometry and mesh
There can be uncountable combinations of collisions and impact events between wood
chips and equipment walls during the impact step. Six representative cases were simulated
as shown in Figure 5.1. The six cases differed in angle and direction of the striking wood
chip. Case A: Chip at 60° angle to the wall, longitudinal direction along the wall; Case B:
Chip at 60° angle to the wall, radial direction along the wall; Case C: Chip perpendicular
to the wall, longitudinal direction along the wall; Case D: Chip perpendicular to the wall,
radial direction along the wall; Case E: Mid-air collision between two chips in the radial
direction; Case F: Mid-air collision between two chips in the longitudinal direction.
Figure 5.1: Simulation cases; A: Chip at 60° angle to the wall, longitudinal direction along the
wall; B: Chip at 60° angle to the wall, radial direction along the wall; C: Chip perpendicular to
the wall, longitudinal direction along the wall; D: Chip perpendicular to the wall, radial direction
along the wall; E: Mid-air collision between two chips in the radial direction; F: Mid-air collision
between two chips in the longitudinal direction.
An initial velocity (ranging from 5 to 35 m/s) was applied to the striking wood chips
(dimensions of 20 x 20 x 4 mm3) to model chip impact with a steel wall. The steel wall
(dimensions of 40 x 40 x 2 mm3) was modelled as an elastic material without damage,
since the elastic modulus of steel is several orders of magnitude higher than that of spruce
wood. A fixed boundary condition was appointed on four-side faces of the steel wall.

31
The mesh was successively refined to obtain a mesh-independent solution. The final mesh
of chip and steel wall had 7623 and 7500 (8-node linear brick, reduced integration,
hourglass control C3D8R) elements, respectively. Contacts between all the exterior and
interior elements of a chip with itself or the steel wall surface were defined using the built-
in hard contact algorithm for normal contact and the frictionless formulation for tangential
behaviour in ABAQUS.
5.2.2. Linear elastic deformation
The modelled wood chips followed linear elastic deformation until failure according to
the equations described in Section 4.1.2. The relation of stress, 𝝈, and strain, 𝜺, for linear
elastic orthotropic material written in tensor form is given in Equation 4.9
where 𝑪 is the compliance matrix.
5.2.3. Hashin’s damage initiation criteria
Hashin’s damage initiation criteria was basically proposed for unidirectional fibre-
reinforced composite material. The wood material, containing tracheids mainly oriented
in the longitudinal direction acting as fibres, can be assumed to be a unidirectional fibre-
reinforced composite material. Hashin (1980) has proposed four separate failure initiation
criteria parallel and perpendicular to fibres under tensile and compressive load. The
damage in the material initiates when one of the following damage criteria just exceeds
1.
Fibre tensile damage (damage in the longitudinal direction); 𝜎L ≥ 0
𝐼𝑓 (
𝜎L𝑋Lt)
2
+𝜎LR
2 + 𝜎LT2
𝑆LR2 > 1 ; 𝑑f
t = 1 (5.1)
Fibre compressive damage (damage in the longitudinal direction) 𝜎L < 0
𝐼𝑓
|𝜎L|
𝑋Lc > 1; 𝑑f
c = 1 (5.2)
Matrix tensile damage (damage in the radial and tangential directions) 𝜎R + 𝜎T ≥ 0
𝐼𝑓
(𝜎R + 𝜎T)2
𝑋Rt 2
+(𝜎RT
2 − 𝜎R𝜎T)
𝑆RT2 +
𝜎LR2 + 𝜎LT
2
𝑆LR2 > 1; 𝑑m
t = 1 (5.3)
Matrix compressive damage (damage in the radial and tangential directions) 𝜎R + 𝜎T <
0
𝝈 = 𝑪𝜺 (4.9)

32
𝐼𝑓 [(𝑋Rc
2𝑆RT)
2
− 1] (𝜎R + 𝜎T𝑋Rc ) + (
𝜎R + 𝜎T2𝑆RT
)2
+(𝜎RT
2 − 𝜎R𝜎T)
𝑆RT2
+𝜎LR
2 + 𝜎LT2
𝑆LR2 > 1; 𝑑m
t = 1
(5.4)
where 𝑋lt, 𝑋l
c and 𝑆lm are the tensile, compressive, and shear strengths, respectively. L
refers to the longitudinal direction, R refers to the radial direction, and T refers to the
tangential direction, as shown in Figure 5.1.
5.2.4. Damage evolution using the Material Property
Degradation model
Once the damage had been identified in an element, the response of the material was
computed using a degraded compliance matrix, 𝑪d, as
𝝈 = 𝑪d𝜺 (5.5)
A detailed description of damage evolution is given in Paper III.
5.2.5. Element deletion
Elements with reduced stiffness distort easily, and these were removed based on a
maximum strain criterion in order to prevent elements from large deformations (Rubio-
López et al. 2015). An element was deleted if the maximum principal nominal strain
exceeded 1.0 or if the minimum principal nominal strain was lower than -0.8. In order to
set a criterion for a comparison between different simulated cases, a damage parameter
𝑑p was defined as
A high value of 𝑑p corresponds to a highly damaged wood chip.
5.3. Material properties
The mechanical properties of a spruce wood chip were obtained from the literature. Most
of the mechanical properties of spruce wood reported in the literature have been
determined under quasi-static ambient conditions. Uhmeier and Salmén (1996) and
Widehammar (2004) have found that the stiffness of spruce wood increases with an
increase in strain rate. However, due to the lack of experimental data on the effects of
strain rate on all the elastic and strength properties of spruce wood, strain rate effects were
neglected in this study. As discussed earlier, the steam treatment of wood chips
significantly decreases the stiffness and strength of the chips. The properties of a spruce
𝑑p =
𝑁𝑢𝑚𝑏𝑒𝑟 𝑜𝑓 𝑑𝑒𝑙𝑒𝑡𝑒𝑑 𝑒𝑙𝑒𝑚𝑒𝑛𝑡𝑠 𝑜𝑓 𝑐ℎ𝑖𝑝
𝑇𝑜𝑡𝑎𝑙 𝑛𝑢𝑚𝑏𝑒𝑟 𝑜𝑓 𝑒𝑙𝑒𝑚𝑒𝑛𝑡𝑠 𝑜𝑓 𝑐ℎ𝑖𝑝× 100 (5.6)

33
wood chip at ambient conditions were multiplied with certain degradation factors (c.f.
cell wall properties) to obtain mechanical properties at elevated conditions according to
Equation 4.13
𝑃lm′ = 𝑃lm(1 + 𝑎MC)(1 + 𝑎T) (4.13)
where 𝑃lm and 𝑃lm′ are the properties at ambient and elevated conditions, respectively.
𝑎MC and 𝑎T are factors that include the effects of MC and temperature, respectively.
Table 5.1 summarizes the estimated mechanical properties of spruce wood at 12% MC at
20 °C and at 30% MC at 160 °C along with 𝑎MC and 𝑎T. The steel wall was modelled
with Young’s modulus 180 GPa and Poisson ratio 0.3.
Table 5.1: Mechanical properties of wood at ambient and elevated conditions
Property Value at 12
% MC at 20
°C (ambient
condition)
for spruce
(MPa)
Reference 𝑎MC
Fractional
change with
increase in
MC from 12
% to 30 % at
20 °C
Reference,
wood
specie
𝑎T
Fractional
change with
increase in
temp from
20 to 160 °C
Reference,
wood specie,
MC
Value at 30
% MC at
160 °C
(elevated
condition)
(MPa)
𝐸L 11700
Keunecke et
al. (2007)
-0.28 Keunecke
et al.
(2007),
Spruce
-0.55 *Salmén and
Fellers
(1982),
Spruce, water
soaked
3790
𝐸R 1680 -0.36 -0.84 172
𝐸T 618 -0.36 -0.84 63
𝐺LR 642 -0.26 -0.69 147
𝐺LT 615 -0.26 -0.69 141
𝐺RT 51 -0.36 -0.84 5
𝜈LR 0.018 Keunecke
(2008)
0.018
𝜈LT 0.014 0.014
𝜈RT 0.21 0.21
𝑋Lt 90
Sell (1997)
-0.26
Kufner
(1978),
Douglas fir
-0.25
**Kollmann
(1940),
Spruce, 20 %
50
𝑋Lc 50 -0.47
Wilson
(1932),
Sitka
spruce
-0.50
***Ishida
(1954),
Spruce, FSP
13.3
𝑋Rt 3.6
Keunecke
(2008) -0.49
Goulet
(1960),
Spruce
-0.55
*Goulet
(1960),
Spruce, FSP
0.83
𝑋Rc 4.3
Kretschmann
(2010) -0.48
Wilson
(1932),
Sitka
spruce
-0.55 1.01
𝑆LR 6.1 Dahl and
Malo (2009)
-0.40 Leont’ev
(1960),
Spruce
-0.73 Ohsawa and
Yoneda
(1978),
Ezomatsu,
Todomatsu,
FSP
1
𝑆RT 1.64 -0.44 -0.62 0.35
*Result extrapolated from 140 °C

34
**Result extrapolated from 100 °C
***Result extrapolated from 60 °C
FSP: Fibre saturation point

35
6. EXPERIMENTAL RESULTS AND
DISCUSSION
In this chapter, the results from the experimental studies are presented and discussed.
6.1. Sugar composition of the wood samples (Paper IV)
Carbohydrates and lignin contents of UTW, STW, and SEIW were determined through
acid hydrolysis and are given in Table 6.1. The steam treatment was performed at 14 bar
pressure for 10 minutes. It can be seen that the mono-sugars present in hemicelluloses
decreased significantly in STW and SEIW because of the steam treatment. A plausible
reason for the further decrease in hemicelluloses from STW to SEIW wood is that when
the wood chips left the steam treatment vessel, they were collected at the bottom of the
blow tank along with condensed steam, which removed additional hemicelluloses.
Table 6.1: Lignin and mono-sugar contents of oven-dried solid residue of UTW, STW, and SEIW
spruce wood. The values are averages of two samples. Pretreatment conditions for STW and
SEIW: 14 bar 10 min.
UTW
(w/w %)
STW
(w/w %)
SEIW
(w/w %)
Klason lignin 27.52 29.58 33.23
Acid soluble lignin 0.48 0.61 0.45
Glucose 42.52 43.04 46.65
Xylose 5.69 5.17 3.74
Mannose 11.91 11.00 6.86
Arabinose 1.06 0.49 0.29
Rhamnose 0.06 0.00 0.00
Galactose 1.46 1.23 0.45
Others 9.30 8.89 8.32
Total
carbohydrates 62.70 60.92 57.99

36
6.2. Enzymatic hydrolysis (Paper IV)
STEX pretreatment creates physical and chemical modifications in wood. The chemical
modifications are created during the treatment of the wood chip with steam at high
temperature. The chemical modifications include degradation of hemicelluloses and
redistribution of lignin (Li et al. 2007; Wang et al. 2009). The physical modifications are
the result of the explosion and impact steps. The physical modifications include
microcracks in the cells walls, cellular structural deformation, and the disintegration of
the wood chips. The contributions of the chemical and physical modifications to the
increase in enzymatic hydrolysis were studied by comparing three wood chip samples
(i) Untreated wood, UTW (no chemical and physical modifications)
(ii) Steam-treated wood, STW (only chemical modifications)
(iii) Steam-exploded and impacted wood, SEIW (both chemical and physical
modifications)
The wood material used for enzymatic hydrolysis is shown in Figure 6.2. The glucose
release percentage (w/w %) was calculated by dividing the amount of glucose released
because of the enzymatic hydrolysis with the amount of glucose initially present in the
dried solid mass. Figure 6.1 shows that the enzymatic hydrolysis of UTW resulted in a
very low glucose yield. The glucose yield increased to 5 % because of the steam
treatment, i.e. chemical modification, and almost doubled in SEIW. This implies that the
physical modifications during the explosion and impact steps play a significant role in the
increase in the glucose yield of the wood obtained after STEX pretreatment. The
experimental techniques discussed in the next sections provide a detailed description of
the microstructural changes that took place during the explosion and impact steps, which
contributed to an increase in enzymatic hydrolysis.
Figure 6.1: Glucose released after enzymatic hydrolysis with incubation times of 30 and 72 hrs.
Standard deviations of triplicates are presented as error bars. Pretreatment conditions for STW
and SEIW: 14 bar 10 min.

37
6.3. Physical appearance
Figure 6.2: Wood samples for enzymatic hydrolysis; (a) untreated UTW, (b) steam-treated STW
(pretreatment conditions: 14 bar 10 min), (c) steam-exploded and impacted wood SEIW
(pretreatment conditions: 14 bar 10 min).
Figure 6.2 illustrates the UTW, STW, and SEIW material used for the enzymatic
hydrolysis study (Paper IV). It can be seen that the colour of the wood chips changed as
a result of the chemical reactions during the steam treatment. In addition to that, impact
and collisions caused the wood chips to disintegrate to small fragments. The pretreated
wood attained large variations in the size of and the damage to the fragments. Some wood
chips disintegrated to small fragments (Figure 6.2c) while others remained fairly intact
and less damaged, as shown in Paper III. On the other hand, the explosion step did not
result in chip breakage. The SEW sample appears similar to the STW sample, as shown
in Paper II. It can be concluded that the explosion step under moderate conditions does
not result in chip breakage, but breakage is instead a result of collisions between wood
chips and impact with the walls of the equipment.
6.4. Scanning electron microscopy
The effect of the explosion step on ultra-structural features of wood was analysed with
SEM. The STEX experiment was performed with saturated steam at 14 bar for 10 min.
Since the wood chips were obtained by saw cutting, the surface of the wood was rough
and it was difficult to differentiate the microcracks created during the explosion step from
the microcracks created during the saw cutting. Therefore, the surface of each sample
shown in Figure 6.3 was shaved and smoothened using a sharp blade prior to STEX
experiments. Although the wood chips did not break because of the explosion step, at the
microscale, several cracks were found in the SEW sample (see Figure 6.3). It seems that
the microcracks appeared in the cell wall at some angle to the longitudinal axis of the
tracheids. Small cracks seemed to join and form larger cracks oriented in the longitudinal
direction. Closer examination of the microcracks in Figure 6.3c reveals that the cracks
curve around the bordered pit and do not pass through the pit. In contrast, the microcracks
in the cell wall containing cross-field pits mostly initiated from the poles of the elliptic
pits. Similar microcracks were observed by Zhang and Cai (2006) near cross-field pits.
The microcracks in the SEW sample were mainly observed on cells close to the surface.

38
This indicates that the explosion step under moderate treatment conditions is not
sufficient to induce large structural modifications in the interior of wood. However,
microcracks have been observed in the inner cell walls of a SEW sample by Zhang and
Cai (2006) under severe operating conditions.
Figure 6.3: SEM images of (a) UTW, (b) SEW, (c) enlarged SEM image of microcracks in cell
walls of SEW, and (d) SEM image of microcracks near cross field pits of SEW sample.
Pretreatment conditions: 14 bar 10 min.
6.5. High-resolution X-ray tomography (Paper IV)
In order to visualize the structural modifications in the interior of wood that took place
during the STEX pretreatment, high-resolution X-ray tomography of the UTW and SEIW
samples was performed. The STEX experiment was performed with saturated steam at
14 bar for 10 min. The ortho-slices shown in Figure 6.4 are approximately 1 mm in size
and were obtained from a larger sample after alignment and cropping. It can be seen in
the figure that, in contrast to SEIW, the UTW sample is fairly intact and free from
damage. For X-ray tomography, two SEIW samples were selected. Sample SE-1 was
derived from fairly intact SEIW while sample SE-2 was taken from a defibrillated
fragment. To study the internal structure of these samples in detail, 3D sub-volumes (SV)
were created at random locations. The locations of SVs are also shown in Figure 6.4.

39
Figure 6.4: Ortho-slices of (a) untreated, (b) SEIW sample SE-1, (c) SEIW sample SE-2, and
locations of 3D sub-volumes (SV) and cell walls (W), pretreatment conditions: 14 bar 10 min

40
Figure 6.5 illustrates the sub-volumes extracted from the UTW sample showing a short
section of ten tracheids (SV-1) and a long section of two tracheids (SV-2). It can be seen
in the figure that the tracheids in the UTW sample are intact, and the only passage between
the tracheids is through pits visible on some tracheid walls. These untreated spruce wood
tracheids resemble those presented by Trtik et al. (2007). The X-ray tomographic
resolution could not capture the membranes in the bordered pits. In addition, the ray
parenchyma with thin walls are not resolved efficiently with this method, as can be seen
in the long section of two tracheids (SV-2).
Figure 6.5: Internal structure of untreated spruce wood. The locations of sub-volumes SV-1 and
SV-2 are shown in Figure 6.4

41
The structural modifications in the interior of the sample SE-1 are shown in Figure 6.6.
It can be seen that the cross-sectional shape of the tracheids has completely changed, and
microcracks are clearly visible in all the sub-volumes. Microcracks exist in the tracheid
walls in SV-3, but no large cracks are visible. On the other hand, SV-4 has large cracks
between the tracheids, and, in SV-5, the structure has been destroyed completely. The
SV-5 was taken from close to the edge of the disintegrated SEIW sample, and the SV-3
was taken from deep inside the same sample. This indicates that the wood was vigorously
ruptured close to the edge because of impact and collisions, while tracheids deep inside
the wood were less affected.
Figure 6.6: Internal structure of SEIW sample SE-1. The locations of sub-volumes SV-3, SV-4
and SV-5 are marked in Figure 6.4

42
It can be seen in Figure 6.7 that the tracheids visible in all of the sub-volumes have a
completely destroyed structure. The shape and connections between the tracheids have
changed as a result of the STEX process. It can be concluded that the internal structure of
the defibrillated fragment of SEIW is also ruptured. Numerous cracks and pores in the
tracheid walls are evidence of increased accessibility to the internal structure of the wood
sample, which was not readily accessible when untreated. A detailed discussion of high-
resolution X-ray tomography analysis is presented in Paper IV.
Figure 6.7: Internal structure of SEIW wood, the sub-volumes SV-6, SV-7, SV-8, and SV-9
have been extracted from SE-2. The location of these is shown in Figure 6.4
6.6. Mercury porosimetry analysis (Paper II)
Mercury porosimetry analysis was performed to study the variation in average pore size
and pore size distribution caused by the different steps of the STEX process. In order to
study the different mechanisms of the STEX pretreatment in detail, the experiments were
divided into three series. The different settings are summarized in Table 6.2. The values
of average pore diameter are average of four measurements.

43
Table 6.2: Steam explosion conditions for the different experimental series, average pore
diameters (nm)
Experiment
Time
(min)
Pressure
(bar) Explosion Impact
Avrg.
pore
diam. (nm)
Exp. series 1
UTW-1 595
SE-1 (SEW) 10 7 Yes No 680
SE-2 (SEW) 10 14 Yes No 883
UTW-2 638
SE-3 (SEW) 5 7 Yes No 970
SE-4 (SEW) 5 14 Yes No 789
Exp. series 2
UTW-3 553
SE-5 (STW) 10 14 No No 711
SE-6 (SEW) 10 14 Yes No 933
Exp. series 3
UTW-4 637
SE-7 (SEW) 10 7 Yes No 945
SE-8 (SEIW) 10 7 Yes Yes 1130
The first experimental series was performed to study the effect of steam treatment time
and operation pressure on SEW samples. The wood pieces were pretreated with saturated
steam at 7 and 14 bar and with treatment times of 5 and 10 minutes. In order to obtain
SEW samples, the wood pieces were enclosed in a small basket to prevent them from
impacting with vessel walls. Figure 6.8a shows the incremental intrusion volume for the
different pore sizes in the wood exploded at 7 and 14 bar with a treatment time of 10
minutes. A comparison with a UTW (reference) piece shows that significant structural
changes took place in the wood material after the explosion step. The average pore
diameter increased with an increase in pressure (Table 6.2). The two peaks in Figure 6.8a
are in the range of 1-2 and 3-4 µm. These correspond to the pore size of cross-field and
bordered pits in the cell wall. This means that most of the penetration into the wood
sample took place through pits in the cell walls. The basic theory behind this analysis
assumes the pores to be perfect cylinders. However, wood material has a complex internal
structure, and pores are not perfect cylinders. During mercury porosimetry analysis of a
wood sample, the mercury penetrated open cells at low pressures. With an increase in
pressure, the mercury penetrated through the pores into the inner cells and filled the
volume. Thus, the size of the pit diameters resulted in high intrusion volume peaks that
originated from the volume of the lumens. Steam treatment for 5 min led to strange
results, and it was difficult to deduce any conclusion for the 5-minute treatment time.

44
Figure 6.8: Incremental intrusion volume (ml/g) vs. pore diameter to study the effect of (a)
explosion pressure, (b) slow and rapid release of pressure, and (c) impact step
In the second series of experiments, the effect of the explosive release of pressure after
treatment with steam was studied. Wood samples were treated with steam at 14 bar for
10 minutes followed by the slow release of pressure and the rapid release of pressure to
obtain STW and SEW pieces, respectively. Figure 6.8b shows that much structural change
occurred in both exploded (SEW) and unexploded (STW) wood samples. The average
pore diameter increased from 553 nm of UTW to 711 nm of STW and 933 nm of SEW.
The structural changes in the STW sample might be due to the degradation and removal
of hemicelluloses and lignin during steam treatment. The explosive release of pressure
imparted an additional effect and further increased pore size.
The third series of experiments was conducted to investigate the effect of the impact step
on pore size distribution. As discussed earlier, the wood pieces disintegrate into small
fragments as a result of impact and collisions. Figure 6.8c shows significant change in the
pore size distribution of both SEW and SEIW samples. The disintegration of wood
samples into small pieces, as a result of the impact step, increased the average pore size
of the SEIW sample as compared to the UTW and SEW samples (Table 6.2).
To summarize, the average pore size diameter varies as follows:
UTW < STW < SEW < SEIW

45
7. MODELLING RESULTS AND
DISCUSSION
7.1. Modelling the explosion step
The mercury porosimetry results and SEM images indicated that the expansion of vapours
inside wood cells during the explosion step creates alterations to the structure of the wood
at the microscale. In the modelling part, the effect of stresses created during the explosion
step on the wood cells was studied. The elastic properties of cell wall layers at ambient
conditions (20 °C at 12% MC), given in Table 4.2, and at elevated conditions (160 °C at
30% MC), given in Table 4.4, were used in the simulations.
7.1.1. Single-cell model (Paper I)
Figure 7.1: Contour of strain perpendicular to micro-fibril direction on different layers of cell,
deformation scale factor = 3, elastic properties: elevated conditions

46
Figure 7.1 illustrates the strain perpendicular to the micro-fibril direction, ε22, in different
layers of the modelled cell. The cell wall has less stiffness and strength in the direction
perpendicular to the micro-fibrils and large deformation in this direction is expected to
form cracks in the cell walls. It can be seen in the figure that the cell has expanded and
large tensile and compressive strains are visible in some parts of the cell as a result of
internal pressure. Inside the S2 layer, high tensile strain can be observed at the corners and
compressive strain can be observed midway between two adjacent corners. On the outside
of the cell, the trend is the opposite.
The stiffness of wood decreases with increasing temperature and MC and facilitates cell
deformation. A major increase in deformation in the cell under elevated conditions was
observed in comparison to the cell modelled at ambient conditions (Fig. 7 in Paper I).
However, the trend of deformation for both cells was similar.
In order to investigate the importance of different layers of cell wall, three cases were
simulated
(i) cell with all layers,
(ii) cell with P, S1, and S2 layer, and
(iii) cell with S2 layer only
The total thickness of the cell wall was made the same in all the cases by increasing the
thickness of the S2 layer. It was found that the deformation was the highest in the cell
modelled with only the S2 layer. The average transverse strain was 22% higher in the cell
with an S2 layer only than in the cell with all layers. The S1 and S3 layers, although very
thin, prevented the cell from expanding. The stiffness of the cell layer was high in the
micro-fibril direction and a large MFA in the S1 and S3 layers increased the stiffness of
the cell in the transverse direction. However, the trend of deformation was the same in all
three cases.
Figure 7.2 illustrates the effect of MFA and thickness of the S2 layer on the average strain
(%) in the S2 layer perpendicular to the micro-fibril direction. The S2 layer had high
stiffness in the micro-fibril direction, and, with an increase in the MFA, the micro-fibrils
turned toward the transverse direction, which resulted in an increase in cell stiffness in that
direction, and a decrease in cell expansion. Furthermore, it was found that the average
strain decreased with an increase in cell wall thickness.

47
Figure 7.2: Effect of MFA (degree) and thickness (µm) of S2 layer on average strain (%)
perpendicular to micro-fibril direction, elastic properties: elevated conditions
There is great diversity in the cross-sectional shape of wood cells. To study the deformation
in cells with different cross-sectional shapes, cells with circular, square, hexagonal, and
rectangular shapes were modelled (Figure 7.3). The circumference and length of cells with
different cross-sectional shapes were kept the same in order to make all the shapes
comparable (circumference = 120 µm, length = 40 µm). It can be seen in the figure that the
cells with sharp corners experienced high tensile and compressive strains in different parts
of the cell wall. In contrast, the stresses were evenly distributed, and no point of maximum
strain is visible in the circular-shaped cell. Therefore, sharp corners in the cell cross-section
result in higher local stresses and strains, which are beneficial for the initiation of damage.
Figure 7.3: Deformation in cells with different shapes: (a) Circular, (b) Square, (c) Hexagonal,
and (d) Rectangular (deformation scale factor = 1, elastic properties: elevated conditions)

48
7.1.2. Model consisting of earlywood and latewood cells (Paper
V)
Figure 7.4a shows the model with 35 x 24 cells (1050 × 528 µm2). The model consists of
both earlywood and latewood cells. It can be seen in the figure that the earlywood cells
have deformed more than the latewood cells since earlywood cells have a larger cross-
section size and thinner cell walls. It should be noted that the radial cell walls have
experienced major deformation. Similarly, microcracks are visible predominantly in the
radial cell walls in the experimentally obtained steam-exploded wood by Zhang and Cai
(2006), see Figure 7.4c. A plausible reason for the large deformation in the radial cell walls
can be the geometric arrangement of the cells, which creates uneven stresses, whereas
stresses on the tangential cell walls are balanced as shown by the arrows in Figure 7.4b.
Figure 7.4: Simulation results (deformation scale factor = 1): (a) stress perpendicular to micro-
fibrils, σ22 (MPa), on the inside and outside of the cells shown on deformed bundle of cells
composed of 35 x 24 cells, elastic properties: elevated conditions (b) magnified section, and (c)
steam-exploded sub-alpine fir at 160
°C for 1 hour (Zhang and Cai 2006)

49
The effect of increasing the model size (number of cells) in the tangential direction from 7
× 24 cells to 35 × 24 cells on the maximum stress perpendicular to the micro-fibrils, σ22, in
the S2 layer of earlywood cells is shown in Figure 7.5. It was found that the maximum
stress increased in the outermost cell and decreased in the centre cell with an increase in
model size. However, the change in stress decreased with an increase in model size and is
expected to become independent of model size for a sufficiently large model. Furthermore,
it can be observed that major stress and deformation existed in only a few cells close to the
edge, while most interior cells had minor stresses. This indicates that the wood cells close
to the surface might break under moderate conditions, while most cells in the interior of
the wood chip would require severe conditions to break.
Figure 7.5: (a) Effect of increasing the number of cells in the tangential direction on the maximum
stress perpendicular to the micro-fibrils in the S2 layer of the cells highlighted in the small model
in (b), elastic properties: elevated conditions
Figure 7.6: Effect of increasing the number of cells in the radial direction on the maximum stress
perpendicular to the micro-fibrils in the S2 layer of the cells highlighted in the small model in (b)
also showing earlywood (EW) and latewood (LW) regions, elastic properties: elevated conditions
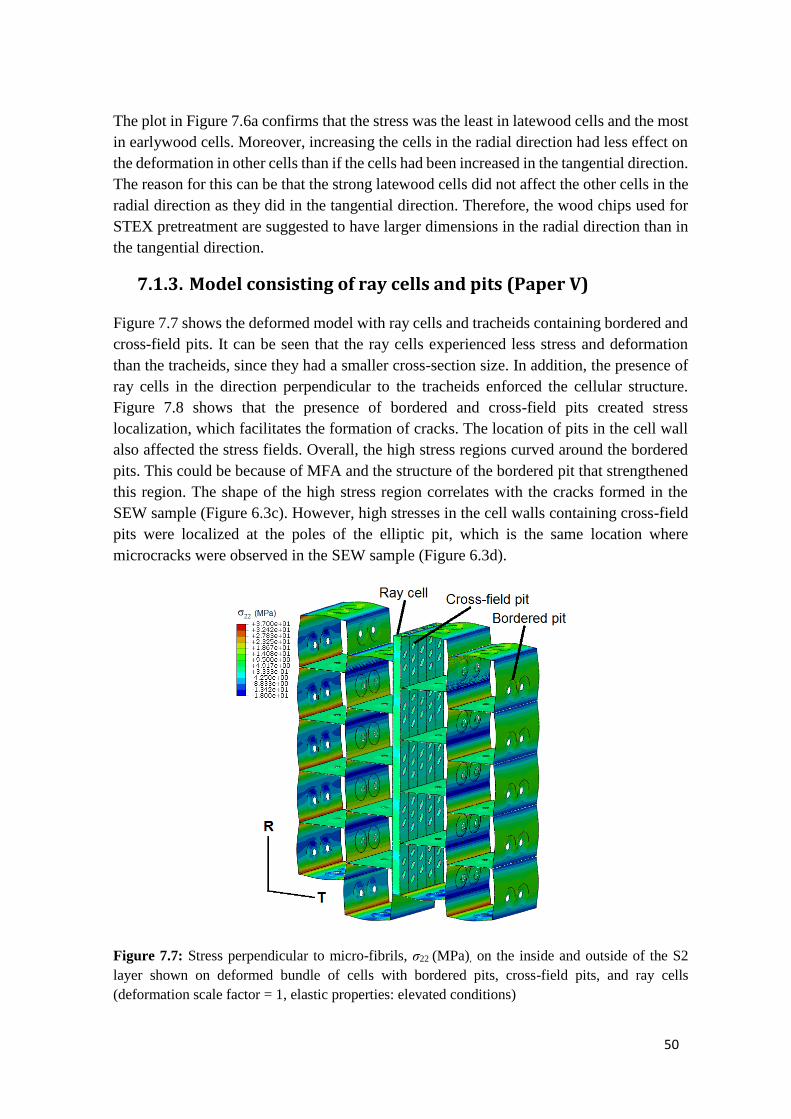
50
The plot in Figure 7.6a confirms that the stress was the least in latewood cells and the most
in earlywood cells. Moreover, increasing the cells in the radial direction had less effect on
the deformation in other cells than if the cells had been increased in the tangential direction.
The reason for this can be that the strong latewood cells did not affect the other cells in the
radial direction as they did in the tangential direction. Therefore, the wood chips used for
STEX pretreatment are suggested to have larger dimensions in the radial direction than in
the tangential direction.
7.1.3. Model consisting of ray cells and pits (Paper V)
Figure 7.7 shows the deformed model with ray cells and tracheids containing bordered and
cross-field pits. It can be seen that the ray cells experienced less stress and deformation
than the tracheids, since they had a smaller cross-section size. In addition, the presence of
ray cells in the direction perpendicular to the tracheids enforced the cellular structure.
Figure 7.8 shows that the presence of bordered and cross-field pits created stress
localization, which facilitates the formation of cracks. The location of pits in the cell wall
also affected the stress fields. Overall, the high stress regions curved around the bordered
pits. This could be because of MFA and the structure of the bordered pit that strengthened
this region. The shape of the high stress region correlates with the cracks formed in the
SEW sample (Figure 6.3c). However, high stresses in the cell walls containing cross-field
pits were localized at the poles of the elliptic pit, which is the same location where
microcracks were observed in the SEW sample (Figure 6.3d).
Figure 7.7: Stress perpendicular to micro-fibrils, σ22 (MPa), on the inside and outside of the S2
layer shown on deformed bundle of cells with bordered pits, cross-field pits, and ray cells
(deformation scale factor = 1, elastic properties: elevated conditions)

51
Figure 7.8: Stress perpendicular to micro-fibrils in the S2 layer around bordered pits in (a) and
(b), and around cross-field pits in (c)
7.2. Modelling the impact step (Paper III)
Obtaining highly damaged and defibrillated wood material, which has a large surface
area, and accessibility to the basic constituents of wood is one of the prime objectives of
STEX pretreatment. As discussed in the experimental results, the wood chips
disintegrated into small fragments during the impact step because of collisions between
wood chips and impact with the steel wall of the vessel. The 3D internal structure of the
SEIW sample showed several cracks in the cell walls. In this section, the findings from
the simulation of the impact step are presented. Different cases and parameters were
investigated in order to suggest improvements for STEX pretreatment.
7.2.1. Simulation results and comparison with experiments
Figure 7.9 shows the state of wood chips at four different time steps for all six cases
shown in Figure 5.1. The six cases differ in angle and direction of the striking wood chip.
Simulation results showed that, in Cases A and B, the wood chips impacted with the steel
wall at some angle and the striking edge attained damage. Then the wood chips rotated
and the other edge impacted with the wall and was also damaged. This type of damage in
wood chips was observed in experiments as well in which the wood chip was damaged
on both edges, as shown in Figure 7.10A. When a wood chip impacted in the radial
direction (Cases A and C) with the steel wall, it acquired more damage than with impact
in the longitudinal direction (Cases B and D). This was because wood chips had lower
stiffness and strength in the radial direction than in the longitudinal direction (see Table
5.1). The deleted elements represent the part of the wood chip that was deformed to a
large extent (Figure 10C). In Case D, the striking edge of the wood chip experienced a
brush-like opening, which was also observed in the SEIW sample (Figure 10D). In Cases
E and F, collision between two chips was modelled. In Case E, chip 2, at high velocity
(25 m/s), collided with the centre of chip 1 at low velocity (5 m/s). Because of the impact
in the centre of the chip, the lower chip broke into two large pieces. Some wood chips

52
were found after STEX experiments that had no damage on the edges but were broken
into two pieces (Figure 10E). This might be because of the impact in the centre of the
wood chip as captured by Case E. The chips in Case F were impacted with each other in
the longitudinal direction. Because of high stiffness and strength in the longitudinal
direction, the chips, in this case, experienced the least damage.
Figure 7.9: Matrix compressive damage in chips at different time steps for Cases A-F; material
properties: elevated conditions; chip velocity: Cases A-D: 20 m/s; Case E, F: chip 1 = 5m/s, chip
2 = 25 m/s
Figure 7.10: Comparison of model with SEIW sample

53
As wood has less stiffness and strength in the matrix, i.e. the radial and tangential
directions than in the fibre, i.e. the longitudinal direction, compressive damage in the
matrix direction was found to be the dominant damage mechanism. Fibre tensile and
compressive damage were only observed in Cases B, D, and F where each chip impacted
in the fibre direction (Figure 7.11).
Figure 7.11: Fibre tension, fibre compression, and matrix tension damage in wood chip at 0.175
ms for Cases A-F; material properties: elevated conditions; chip velocity: Cases A-D: 20 m/s;
Case E, F: chip 1 = 5m/s, chip 2 = 25 m/s
7.2.2. Effect of velocity and steam treatment on damage
parameter
After the steam treatment step, the discharge valve of the steam treatment vessel is
opened. The steam at high pressure leaves the vessel rapidly and exerts drag force on the
wood chips in the vessel. The wood chips during the impact step attain different velocities
depending on the drag force they experience. Simulations were performed to study the
effect of velocity (ranging from 5 to 35 m/s) on the damage parameter (Figure 7.12). As
expected, it was found that an increase in velocity increased the damage. The wood chip

54
that impacted in the radial direction (Cases A and C) experienced more damage than wood
chips that impacted in the longitudinal direction (Cases B and D). Case C was found to
be the most favourable for obtaining maximum damage to an SEIW sample.
Figure 7.12: Effect of velocity of wood chip on damage parameter estimated at 5 ms, material
properties: elevated conditions
The effect on the damage parameter of the reduction in stiffness and strength of a wood
chip because of the steam treatment is shown in Figure 7.13. The elastic properties of the
untreated (12 % MC at 20 O
C) and treated (30 % MC at 160 O
C) wood used in simulations
are presented in Table 5.1. The velocity of the wood chips upon impact was 20 m/s. As can
be seen, a large increase in the damage parameter was found in all cases (A-D) because of
the steam treatment. Steam treatment at higher temperatures would further decrease the
stiffness and strength of wood chips and facilitate damage in the wood chips.
Figure 7.13: Effect of steam treatment on damage parameter estimated at 5 ms, chip velocity: 20
m/s
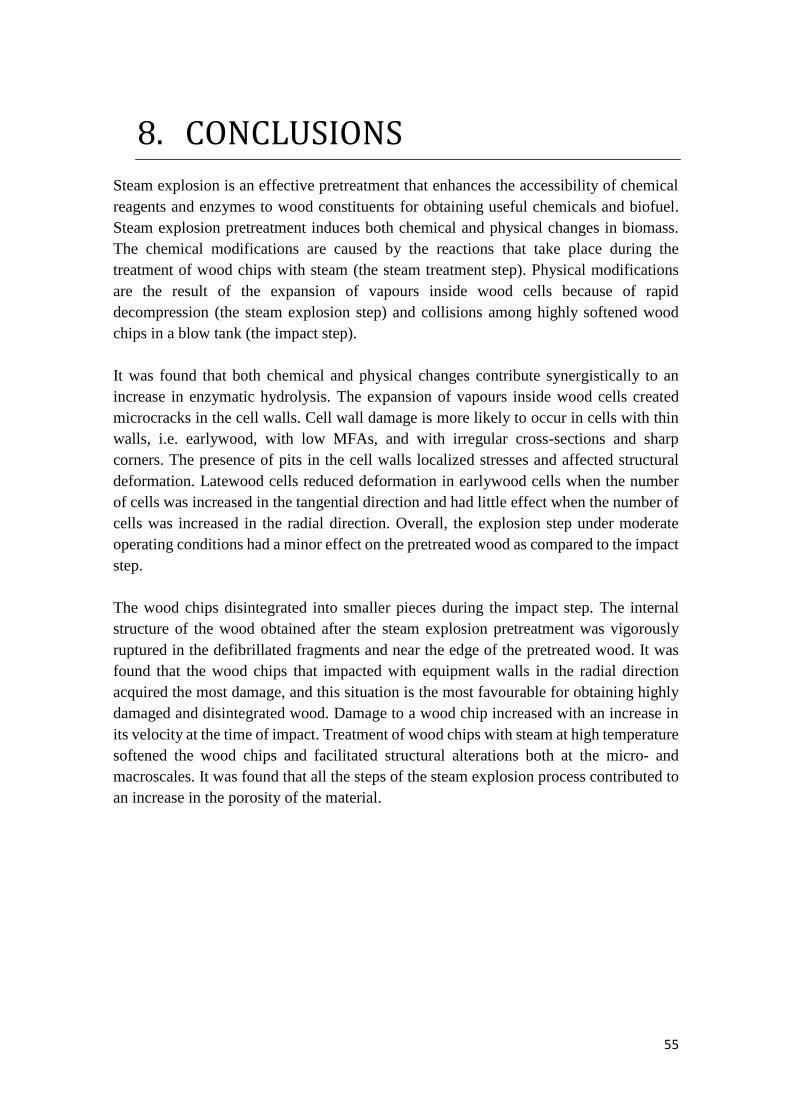
55
8. CONCLUSIONS
Steam explosion is an effective pretreatment that enhances the accessibility of chemical
reagents and enzymes to wood constituents for obtaining useful chemicals and biofuel.
Steam explosion pretreatment induces both chemical and physical changes in biomass.
The chemical modifications are caused by the reactions that take place during the
treatment of wood chips with steam (the steam treatment step). Physical modifications
are the result of the expansion of vapours inside wood cells because of rapid
decompression (the steam explosion step) and collisions among highly softened wood
chips in a blow tank (the impact step).
It was found that both chemical and physical changes contribute synergistically to an
increase in enzymatic hydrolysis. The expansion of vapours inside wood cells created
microcracks in the cell walls. Cell wall damage is more likely to occur in cells with thin
walls, i.e. earlywood, with low MFAs, and with irregular cross-sections and sharp
corners. The presence of pits in the cell walls localized stresses and affected structural
deformation. Latewood cells reduced deformation in earlywood cells when the number
of cells was increased in the tangential direction and had little effect when the number of
cells was increased in the radial direction. Overall, the explosion step under moderate
operating conditions had a minor effect on the pretreated wood as compared to the impact
step.
The wood chips disintegrated into smaller pieces during the impact step. The internal
structure of the wood obtained after the steam explosion pretreatment was vigorously
ruptured in the defibrillated fragments and near the edge of the pretreated wood. It was
found that the wood chips that impacted with equipment walls in the radial direction
acquired the most damage, and this situation is the most favourable for obtaining highly
damaged and disintegrated wood. Damage to a wood chip increased with an increase in
its velocity at the time of impact. Treatment of wood chips with steam at high temperature
softened the wood chips and facilitated structural alterations both at the micro- and
macroscales. It was found that all the steps of the steam explosion process contributed to
an increase in the porosity of the material.

56

57
9. REFERENCES
Alvira P, Tomás-Pejó E, Ballesteros M, Negro MJ (2010) Pretreatment technologies for
an efficient bioethanol production process based on enzymatic hydrolysis: A
review. Bioresour Technol 101: 4851-4861
Avellar BK, Glasser WG (1998) Steam-assisted biomass fractionation. I. Process
considerations and economic evaluation. Biomass Bioenerg 14(3): 205–218
Astley RJ, Stol KA, Harrington JJ (1998) Modelling the elastic properties of softwood.
Part II: The cellular microstructure. Holz als Roh- und Werkstoff 56: 43-50
Ballesteros I, Oliva JM, Navarro AA, González A, Carrasco J, Ballesteros M (2000)
Effect of chip size on steam explosion pretreatment of softwood. App Biochem
Biotechnol 84-86: 97-110
Bergander A, Salmén L (2000) Transverse elastic modulus of the native wood fibre wall.
J Pulp Paper Sci 26(6):234-238
Bodig J, Jayne BA (1982) Mechanics of wood and wood composites. Van Nostrand
Reinhold, New York
Boussaid A-L, Esteghlalian AR, Gregg DJ, Lee KH, Saddler JN (2000) Steam
pretreatment of Douglas-fir wood chips. Appl Biochem Biotechnol 84-86:693-705
Brändström J (2001) Micro- and ultrastructural aspects of Norway spruce tracheids: a
review. IAWA J 22(4):333–353
Brodeur G, Yau E, Badal K, Collier J, Ramachandran KB, Ramakrishnan S (2011)
Chemical and Physicochemical Pretreatment of Lignocellulosic Biomass: A
Review. Enzyme Res 2011:1-17
Bulcke JVD, Biziks V, Andersons B, Mahnert KC, Militz H, Loo DV, Dierick M,
Masschaele B, Boone MN, Brabant L, De Witte Y, Vlassenbroeck J, Hoorebeke
LV, Acker JV (2013) Potential of X-ray computed tomography for 3D anatomical
analysis and microdensitometrical assessment in wood research with focus on wood
modification. Int Wood Prod J 4(5):183-190
Camanho PP, Mathews FL (1999) A progressive damage model for mechanically
fastened joints in composite laminates. J Compos Mater 33:2248–2280
Carvalheiro F, Duarte LC, Gírio FM (2008) Hemicellulose biorefineries: a review on
biomass pretreatments. J Sci Ind Res 67: 849–864
Chang VS, Holtzapple MT (2000) Fundamental factors affecting biomass enzymatic
reactivity. App Biochem Biotechnol 84-86: 5-37
Claassen PAM, van Lier JB, Contreras AML, van Niel EWJ, Sijtsma L, Stams AJM, de
Vries SS, Weusthuis RA (1999) Utilisation of biomass for the supply of energy
carriers. Appl Microbiol Biotechnol 52: 741-755
Dahl KB, Malo KA (2009) Nonlinear shear properties of spruce softwood: experimental
results. Wood Sci Technol 43:539-558
De Magistris F, Salmén L (2008) Finite element modelling of wood cell deformation
transverse to the fibre axis. Nordic Pulp Pap Res J 23(2): 240-246

58
Donaldson LA, Wong KKY, Mackie KL (1988) Ultrastructure of steam-exploded wood.
Wood Sci Technol 22:103-114
Fengel D, Stoll M (1973) Variation in cell cross-sectional area, cell-wall thickness and
wall layers of spruce tracheids within an annual ring. Holzforsch 27: 1–7
Fortino S, Hradil P, Salminen LI, De Magistris F (2015) A 3D micromechanical study of
deformation curves and cell wall stresses in wood under transverse loading. J Mater
Sci 50:482-492
Gerhards CC (1982) Effect of moisture content and temperature on the mechanical
properties of wood: an analysis of immediate effects. Wood Fiber 14(1):4–36
Gilani MS, Fife JL, Boone MN, Wakili KG (2013) Dynamics of microcrack propagation
in hardwood during heat treatment investigated by synchrotronbased X-ray
tomographic microscopy. Wood Sci Technol 47:889-896
Goldstein IS (1981) Organic chemicals from biomass. CRC Press, Boca Raton
Goulet M (1960) Dependence of transverse tensile strength of oak, beech and spruce on
moisture content and temperature within the range of 0° to 100° C. Holz Roh
Werkst 18:325-331
Grous WR, Converse AO, Grethlein HE (1986) Effect of steam explosion pretreatment
on pore size and enzymatic hydrolysis of poplar. Enzyme Microb Technol 8: 274-
280
Guindos P, Guaita M (2013) A three-dimensional wood material model to simulate the
behavior of wood with any type of knot at the macro-scale. Wood Sci Technol
47:585-599
Halpin J C, Kardos JL (1976) The Halpin-Tsai equations: a review. Polym Eng Sci
16(5):344–352
Hamelinck CN, van Hooijdonk G, Faaij APC (2005) Ethanol from lignocellulosic
biomass: techno-economic performance in short-, middle- and long-term. Biomass
Bioenerg 28: 384–410
Harada H, Wardrop AB (1960) Cell wall structure of ray parenchyma cells of a softwood.
J Japan Wood Res Society 6(1):34-41
Hashin Z (1980) Failure criteria for unidirectional fiber composites. J Appl Mech 47:329–
334
Imamura Y, Harada H (1973) Electron microscopic study on the development of the
bordered pit in coniferous traeheids. Wood Sci Technol 7:189-205
Ishida S (1954) The effect of temperature on the strength of wood. Hokkaido Univ Res
Bull Coll Exp For 17:1-14
Josefsson T, Lennholm H, Gellerstedt G (2002) Steam explosion of aspen wood.
Characterisation of reaction products. Holzforsch 56:289-297
Kermanidis D, Labeas G, Tserpes KI, Pantelakis S (2000) Finite element modeling of
damage accumulation in bolted composite joints under incremental tensile loading.
In: Proceedings of European congress on computational methods in applied
sciences and engineering, Barcelona, Spain
59
Keunecke D (2008) Elasto-mechanical characterisation of yew and spruce wood with
regard to structure-property relationships. Dissertation, Eidgenössische Technische
Hochschule Zürich
Keunecke D, Sonderegger W, Pereteanu K, Luthi T, Niemz P (2007) Determination of
Young’s and shear moduli of common yew and Norway spruce by means of
ultrasonic waves. Wood Sci Technol 41:309-327
Kim JS, Lee YY, Kim TH (2016) A review on alkaline pretreatment technology for
bioconversion of lignocellulosic biomass. Bioresour Technol 199:42-48
Kollmann F (1940) The mechanical properties of wood of different moisture content
within -200° to + 200°C temperature range. VDI-Forschungsheft 403:1-18
Kretschmann DE (2010) Mechanical Properties of wood. Wood Handbook, Chapter 5.
General Technical Report FPLGTR-190
Kufner M (1978) Modulus of elasticity and tensile strength of wood species with different
density and their dependence on moisture content. Holz Roh Werkst 36(11):435-
439
Kumar D, Murthy GS (2011) Impact of pretreatment and downstream processing
technologies on economics and energy in cellulosic ethanol production. Biotechnol
Biofuels 4: 1-19
Law KN, Valade JL (1990) The myth of fiber liberation during explosion pulping. J Pulp
Paper Sci 16(1)
Lee C, Zheng Y, VanderGheynst JS (2015) Effects of pretreatment conditions and post–
pretreatment washing on ethanol production from dilute acid pretreated rice straw.
Biosystems Eng 137:36-42
Leont’ev NL (1960) The strength of wood at varying moisture content. Derev Prom
10:17-18
Li J, Henriksson G, Gellerstedt G (2005) Carbohydrate reactions during high-temperature
steam treatment of aspen wood. Appl Biochem Biotechnol 125:175-188
Li J, Henriksson G, Gellerstedt G (2007) Lignin depolymerization/repolymerization and
its critical role for delignification of aspen wood by steam explosion. Bioresour
Technol 98:3061-3068
Li X, Zhou Y, Yan Y, Cai Z, Feng F (2010) A single cell model for pretreatment of wood
by microwave explosion. Holzforsch 64:633–637
Lin SY, Dence CW (1992) Methods in Lignin Chemistry. Springer Verlag, Berlin
Mansfield SD, Mooney C, Saddler JN (1999) Substrate and enzyme characteristics that
limit cellulose hydrolysis. Biotechnol Prog 15: 804–816
Martin-Sampedro R, Capanema EA, Hoeger I, Villar JC, Rojas OJ (2011) Lignin changes
after steam explosion and laccase-mediator treatment of eucalyptus wood chips. J
Agric Food Chem 59:8761-8769
Martin-Sampedro R, Revilla E, Villar JC, Eugenio ME (2014) Enhancement of enzymatic
saccharification of Eucalyptus globulus: Steam explosion versus steam treatment.
Bioresour Technol 167:186-191

60
McCarthy CT, McCarthy MA, Lawlor VP (2005) Progressive damage analysis of multi-
bolt composite joints with variable bolt–hole clearances. Composites Part B
36:290–305
Meyer RW (1971) Influence of pit aspiration on earlywood permeability on douglas-fir.
Wood Fiber Sci 4:328-339
Mirahmadi K, Kabir MM, Jeihanipour A, Karimi K, Taherzadeh MJ (2010) Alkaline
pretreatment of spruce and birch to improve bioethanol and biogas production.
BioResources 5:928-938
Mosier N, Wyman CE, Dale BD, Elander RT, Lee YY, Holtzapple M, Ladisch CM (2005)
Features of promising technologies for pretreatment of lignocellulosic biomass.
Bioresour Technol 96: 673–686
Moura MJ, Ferreira PJ, Figueiredo MM (2002) The use of mercury intrusion porosimetry
to the characterization of eucalyptus wood, pulp and paper. Iberoamerican Congress
Pulp Pap Res
Murmanis L, Sachs IB (1969) Structure of pit border in Pinus Strobus L. Wood Fiber Sci
1:7-17
Negro MJ, Manzanares P, Oliva JM, Ballesteros I, Ballesteros M (2003) Changes in
various physical/chemical parameters of Pinus pinaster wood after steam explosion
pretreatment. Biomass Bioenerg 25: 301-308
Ohsawa J, Yoneda Y (1978) Shear test of woods as a model of defibration. J Jpn Wood
Res Soc 24:230-236
Overend RP, Chornet E (1987) Fractionation of lignocellulosics by steam-aqueous
pretreatments. Phil Trans R Soc Lond A 321(1521): 523-536
Panshin AJ, deZeeuw C (1970) Textbook of Wood Technology. Vol 1. 3rd ed., McGraw-
Hill, U.K
Park YC, Kim JS (2012) Comparison of various alkaline pretreatment methods of
lignocellulosic biomass. Energ 47(1):31-35
Pfriem A, Zauer M, Wagenfuhr A (2009) Alteration of the pore structure of spruce (Picea
abies (L.) Karst.) and maple (Acer pseudoplatanus L.) due to thermal treatment as
determined by helium pycnometry and mercury intrusion porosimetry. Holzforsch
63:94-96
Qing H, Mishnaevsky Jr. L (2009) 3D hierarchical computational model of wood as a
cellular material with fibril reinforced, heterogeneous multiple layers. Mech Mater
41: 1034-1049
Rahikainen JL, Martin-Sampedro R, Heikkinen H, Rovio S, Marjamaa K, Tamminen T,
Rojas OJ, Kruus K (2013) Inhibitory effect of lignin during cellulose
bioconversion: The effect of lignin chemistry on non-productive enzyme
adsorption. Bioresour Technol 133:270-278
Ramos LP (2003) The chemistry involved in the steam treatment of lignocellulosic
materials. Quim Nova 26(6):863-871
Romaní A, Garrote G, Ballesteros I, Ballesteros M (2013) Second generation bioethanol
from steam exploded Eucalyptus globulus wood. Fuel 111: 66-74

61
Rubio-López A, Olmedo A, Santiuste C (2015) Modelling impact behaviour of all-
cellulose composite plates. Compos Struct 122:139-143
Saha BC, Iten LB, Cotta MA, Wu YV (2005) Dilute acid pretreatment, enzymatic
saccharification and fermentation of wheat straw to ethanol. Process Biochem 40:
3693–3700
Salmén L, Fellers C (1982) The fundamentals of energy consumption during viscoelastic
and plastic deformation of wood. Pulp Pap Can Trans Tech 4(9): 93-99
Schulte PJ (2012) Computational fluid dynamics models of conifer bordered pits show
how pit structure affects flow. New Phytologist 193:721-729
Sedighi-Gilani M, Sunderland H, Navi P (2005) Microfibril angle non-uniformities
within normal and compression wood tracheids. Wood Sci Technol 39:419-430
Sell J (1997) Eigenschaften und Kenngrössen von Holzarten. Baufachverlag AG Zürich,
Dietikon
Sun Y, Cheng J (2002) Hydrolysis of lignocellulosic materials for ethanol production: a
review. Bioresour Technol 83: 1–11
Sánchez OJ, Cardona CA (2008) Trends in biotechnological production of fuel ethanol
from different feedstocks. Bioresour Technol 99: 5270-5295
Tanahashi M, Takada S, Aoki T, Goto T, Higuchi T, Hanai S (1982) Characterization of
explosion wood: 1. Structure and physical properties. Wood Res 69: 36-51
Theander O, Westerlund EA (1986) Studies on Dietary Fiber. 3. Improved procedures for
analysis of dietary fiber. J Agric Food Chem 34(2):330-336
Toussaint B, Excoffier G, Vignon MR (1991) Effect of steam explosion treatment on the
physico-chemical characteristics and enzymic hydrolysis of poplar cell wall
components. Animal Feed Sci Technol 32: 235-242
Trtik P, Dual J, Keunecke D, Mannes D, Niemz P, Stähli P, Kaestner A, Groso A,
Stampanoni M (2007) 3D imaging of microstructure of spruce wood. J Struct Biol
159:46-55
Tsai SW (1992) Theory of composites design. Think Composites, Dayton
Uhmeier A, Salmén L (1996) Influence of strain rate and temperature on the radial
compression behaviour of wet spruce. J Eng Mater Technol 118:289-294
Wang K, Jiang J-X, Feng X, Sun R-C (2009) Influence of steam explosion time on the
physic-chemical properties of cellulose from Lespedeza stalks (Lespedeza
crytobotrya). Bioresour Technol 2009 100:5288-5294
Washburn EW (1921) Note on a Method of Determining the Distribution of Pore Sizes
in a Porous Material. Proc Natl Acad Sci USA 7(4): 115-116
Widehammar S (2004) Stress-strain relationships for spruce wood: influence of strain
rate, moisture content and loading direction. Exp Mech 44:44-48
Wilson TRC (1932) Strength-moisture relations for wood. USDA Tech Bull No. 282, US
Dep Agric, Washington, DC
Wu MM, Chang K, Gregg DJ, Boussaid A, Beatson RP, Saddler JN (1999) Optimization
of steam explosion to enhance hemicellulose recovery and enzymatic hydrolysis of
cellulose in softwoods. Appl Biochem Biotechnol 77-79:47-54

62
Xu Z, Huang F (2014) Pretreatment methods for bioethanol production. Appl Biochem
Biotechnol 174: 43-62
Yan Z, Li J, Chang S, Cui T, Jiang Y, Yu M, Zhang L, Zhao G, Qi P, Li S (2015) Lignin
relocation contributed to the alkaline pretreatment efficiency of sweet sorghum
bagasse. Fuel 158:152-158
Zhang T, Kumar R, Wyman CE (2013) Sugar yields from dilute oxalic acid pretreatment
of maple wood compared to those with other dilute acids and hot water.
Carbohydrate Polymers 92(1):334-344
Zhang Y, Cai L (2006) Effect of steam explosion on wood appearance and structure of
sub-alpine fir. Wood Sci Technol 40:427-436
Zhengdao Y, Bailiang Z, Fuqiang Y, Guizhuan X, Andong S (2012) A real explosion:
The requirement of steam explosion pretreatment. Bioresour Technol 121(0):335-
341
Zhuang X, Wang W, Yu Q, Qi W, Wang Q, Tan X, Zhou G, Yuan Z (2016) Liquid hot
water pretreatment of lignocellulosic biomass for bioethanol production
accompanying with high valuable products. Bioresour Technol 199:68-75


