STRUCTURAL AND DEPOSITIONAL EVOLUTION, KH FIELD,
WEST NATUNA BASIN,
OFFSHORE INDONESIA
A Thesis
by
MARIA FRANSISCA MEIRITA
Submitted to the Office of Graduate Studies of Texas A&M University
in partial fulfillment of the requirements for the degree of
MASTER OF SCIENCE
August 2003
Major Subject: Geophysics

STRUCTURAL AND DEPOSITIONAL EVOLUTION, KH FIELD,
WEST NATUNA BASIN,
OFFSHORE INDONESIA
A Thesis
by
MARIA FRANSISCA MEIRITA
Submitted to Texas A&M University in partial fulfillment of the requirements
for the degree of
MASTER OF SCIENCE Approved as to style and content by: ______________________________ ___________________________ Joel S. Watkins Steven L. Dorobek (Chair of Committee) (Member) ______________________________ ___________________________ Walter B. Ayers Andrew Hajash, Jr. (Member) (Head of Department)
August 2003
Major Subject: Geophysics

i
ABSTRACT
Structural and Depositional Evolution, KH Field,
West Natuna Basin, Offshore Indonesia. (August 2003)
Maria Fransisca Meirita, B.S., Trisakti University
Chair of Advisory Committee: Dr. Joel S. Watkins
This study describes the structural and depositional evolution in the KH f
West Natuna Basin, Indonesia. Data for the study were acquired by three-dimen
(3D) seismic reflection volume and a complete suite of well logs.
The regional basin underwent transtensional, sinistral shear during the rift
that reactivated during the early to middle Miocene inversion as a traspressional, d
shear. The study identified four periods of tectonic activity in the area whic
extension, quiescence, compression and another period of quiescence.
A structural closure developed along a series of north-south trending, n
splay faults defines the area’s trap play. Understanding how this structural play fi
the regional tectonic picture may suggest new approaches to hydrocarbon explora
the area.
ii
ield in
sional
phase
extral
h are
ormal
ts into
tion in

iv
DEDICATION
To my Dad and Mom.

ACKNOWLEDGEMENTS
I would like to thank Dr. Joel S. Watkins, Chair of my Advisory Committee,
accepting me as one of his master’s students and for his advice and support. I would a
like to thank my committee members, Dr. Steven L. Dorobek and Dr. Walter B. Aye
for serving on my committee, and for their valuable comments about my thesis.
I would like to acknowledge and express my appreciation to Gulf Resourc
Indonesia for providing me the seismic and well data which made this study possible a
to Pertamina Consortium Study Abroad Program and Gulf Resources Indonesia (no
under ConocoPhillips) for giving me the scholarship. Special thanks to Mr. Chu
Caughey for his support and guidance throughout my study.
Help along the way was provided by Rachmat Mudjiono, Mufti Irfan, Mua
Chalik, Anggarsih, Anggoro, Osman Suyud, Mike Lee, Rasheed, Tran, Gabriel, Joel
Calves, Shirley, Amelia Reed, Ogtay, Choi, Rahadian, Fitrix, Munji and Yanyan.
Finally, I would like to express my sincere gratitude to my parents and m
sisters, who have provided me with endless support throughout my life.
v
for
lso
rs,
es
nd
w
ck
dz
Le
y

vi
TABLE OF CONTENTS
Page
ABSTRACT………………………………………………………………… iii
DEDICATION……………………………………………………………… iv
ACKNOWLEDGEMENTS……………………………………………….... v
TABLE OF CONTENTS…………………………………………………… vi
LIST OF FIGURES………………………………………………………… viii
CHAPTER
I INTRODUCTION………………………………………………….. 1
II BACKGROUND…………………………………………………… 6
Previous work and geologic history………………………… 6 III METHODS…………………………………………………………. 13
IV DEPOSITIONAL EVOLUTION........................................................ 15
Rift-related linked depositional systems…………................. 15 Synrift megasequence……......................................... 21 Postrift megasequence…………………………….... 26 Syninversion megasequence………………………… 26 Postinversion megasequence……………………….. 27
Isochron maps………………………………………………. 27 Basement-Lower Gabus interval……………………. 27 Lower Gabus-Upper Gabus interval………………… 27 Upper Gabus-Barat interval………………………… 30 Barat-Base Muda interval…………………………… 30 V STRUCTURAL EVOLUTION…………………………………….. 33 Time-structure maps………………………………………… 33 Basement horizon…………………………………… 33 Lower Gabus horizon……………………………….. 35 Upper Gabus horizon……………………………….. 35

vii
CHAPTER Page
Barat horizon………………………………………... 35 Base Muda Unconformity horizon………………….. 39
Basement fault……………………………………………… 39 Extension and inversion…………………………………….. 39 VI DISCUSSION………………………………………………………. 49 Model of basin development placed in regional context…… 49 Prospective traps……………………………………………. 50 VII CONCLUSIONS…………………………………………………… 51
REFERENCES CITED……………………………………………………… 53
VITA………………………………………………………………………… 56

viii
LIST OF FIGURES
FIGURE Page
1 KH field location within Natuna Sea Tertiary basin map…………… 2
2 KH field seismic lines and well locations shown in the study area ………………………………………………………. 5
3 Schematic map of Cenozoic extrusion tectonics
is modified from Tapponier et al., (1982) …………….…………..... 7
4 Schematic structural development, West Natuna Basin from Roberts (1988)………………………………………………… 9
5 Chronostratigraphic KH field modified from Gulf Resources (Kakap) Ltd., (2000)………………………………. 11
6 Four megasequences shown in the study area ……………………… 16
7 Rift initiation system tract: (a) generalized block diagram; (b) schematic cross-section from Prosser (1993)……………………. 18
8 Rift climax system tract: (a) generalized block diagram;
(b) schematic cross-section from Prosser (1993)…………………… 19 9 Immediate post-rift systems tract; (a) generalized block diagram;
(b) schematic cross-section from Prosser (1993)…………………… 20 10 Late post-rift system tract: (a) generalized block diagram;
(b) schematic cross-section from Prosser (1993)………………….... 22
11 Seismic section profile (a) and its line interpretation (b) showing rift initiation (S2), rift climax (S3), immediate post rift (S4) and late post rift (S5)………………………………………………………… 23
ix
FIGURE Page
12 Isochron map of Basement – Lower Gabus interval………………... 28
13 Isochron map of Lower Gabus – Upper Gabus interval……………. 29
14 Isochron map Upper Gabus – Barat interval ……………………….. 31 15 Isochron map Lower Gabus – Base Muda Unconformity
interval ……………………………………………………………… 32 16 Time-structure map of Basement…………………………………… 34 17 Time-structure map of Lower Gabus……………………………….. 36 18 Time-structure map of Upper Gabus……………………………….. 37 19 Time-structure map of Barat………………………………………… 38 20 Time-structure map of Base Muda Unconformity………………….. 40 21 The schematic illustration of distributed continental
deformation in the formation of extensional basins in the study area ….…............................................................................ 42
22 Block model for extension and inversion in the study area based on original concept of McKenzie and Jackson
(1986)….……………………………………………………………. 42 23 Line 1 showing fault-propagation fold or sunda fold………………. 43 24 Structural development of Sunda fold features in study area………. 44 25 Line 2 showing series of normal fault that develop during inversion
and basement fault……………………………………….................. 45
26 Line 3 showing series of normal fault and basement fault…………. 46 27 Line 4 showing synthetic and antithetic faults and
basement fault………………………………………………………. 47 28 Line 5 showing series of normal faults……………………………… 48
1
CHAPTER I
INTRODUCTION
The KH field is located in the northwest corner of the South Kakap Production
Sharing Contract area in West Natuna Basin (Figure 1), Indonesia, approximately 200
km northwest of Natuna Island and over 1000 km north of Jakarta, Indonesia. The total
area of Kakap PSC is 2006 km2 and water depth ranges from approximately 290 ft in the
southern block to 190 ft in parts of the northern block.
The West Natuna Basin located in the South China Sea is bounded on the south
and west by the Indo-Australian plate. The West Natuna Basin is dominated by a series
of nonmarine extensional grabens and half-grabens that formed in the late Eocene to
Oligocene and underwent inversion in the early to middle Miocene. The development of
those extensional rift basins may have been influenced by far-field tectonics of the India-
Australian collision. Tapponier et al. (1982) postulated that the India-Asian collision
during the middle-late Eocene had caused Indochina to extrude southeastward along
major strike-slip fault zones. The extrusion formed the extensional basins in West
Natuna Basin. This extensional event created northeast-southwest trending grabens and
half grabens.
_________________________
This thesis follows the style of the American Association of Petroleum Geologists Bulletin.

2
Figu
re 1
. KH
fiel
d lo
catio
n w
ithin
Nat
una
Sea
Terti
ary
basi
n m
ap.

3
Inversion occurred on a large scale in the Kakap area in the early and middle
Miocene inverting part of the basin. This produced many examples of what are known as
Sunda folds in the Kakap area and elsewhere in the Indonesian region.
Tectonic history and depositional response in this area closely related.
Throughout the rifting phase in the Eocene to early Oligocene the rift basin filled with
lacustrine and fluvial sediments characterized by abrupt thickness variations. Normal
faulting and basin subsidence exemplify this early stage of tectonic activity. During the
early Miocene compression, widespread compressional tectonic activity began in the
Kakap area. This era was also marked by the return of marine conditions. Marine
conditions prevailed until the late-middle Miocene, when major compressional events
terminated deposition and resulted in the regional Base Muda unconformity.
Hydrocarbons were discovered at KH field in 1980 in the upper sand of the
Upper Oligocene Gabus Formation at the KH-1X well. The KH-2X well encountered
three oil-bearing sands. Other wells also encountered hydrocarbons. Production tests in
the KH-1X well reached rates of 7527 BOPD. The upper pay horizon is overlain by a
gas cap.
The objective of this study is to describe the structural and depositional evolution
in the KH field. Knowing the depositional evolution and structural framework may yield
new ideas and approaches to exploration.

4
This study applied three-dimensional (3-D) seismic data and well logs to
interpret deposition and structural relationships within the formation in KH field. The
seismic data were acquired by Marathon Petroleum Indonesia during March and April
1992 and were provided for this study by Gulf Indonesia Resources, Ltd. The seismic
consist of 600 inline and 500 crossline with CDP is 12.5 m (Figure 2).
The well-log database for this study comprises five delineation wells within the
3-D survey area. Maximum depth is 9280 ft. Well log traces including gamma ray,
resistivity, density, and sonic logs, were integrated with the seismic data. Four lithologic
“tops” and one unconformity marker were identified on the logs.

5
Figure 2. KH field seismic lines and well locations shown in the
study area.

6
CHAPTER II
BACKGROUND
Previous work and geologic history
Previous worker in this area report, that tectonic inversion is responsible for the
modern structure. This inversion ranged from extension to compression, and it
reactivated previous structures. Some authors (Roberts, 1988 and Ginger et al., 1993)
suggested that wrench deformation of the basin controls the sediment deposition in this
area.
West Natuna Basin is bounded by the Khorat-Con Son Swell on the north, by the
Natuna Arch on the east, by the Tengol Arch on the west and by the Sunda Shelf on the
south (Figure 1). Several regional tectonic models have been proposed for development
of the basins in this Sunda shelf area. For example, Tapponier et al. (1982), proposed
extrusion tectonics and southeastward translation resulting from the collision between
India and Eurasia that caused Indochina and adjacent offshore areas to extrude and rotate
clockwise (Figure 3). Daly et al. (1990) assumed that the indentation of the Indian Plate
into the Asian Plate transmitted stress by rotation of the Sumatra Subduction zone. This
rotation generated a right-lateral strike-slip couple that resulted in extension, which in
turn created half grabens. Tjia and Liew (1996) suggested transtensional stress and
northeast-southwest sinistral shear caused by wrenching that also created Paleogene
rifting.

7
Figure 3. Schematic map of Cenozoic extrusion tectonics is modified from Tapponier et al. (1982).
Tertiary Extension Tertiary Oceanic Crust Qualitative Block Motions Extrusion Related Extension Extrusion phases: 1 50 – 20 my Intracontinental Thrusts 2 20 - 5 my 3 Most recent Subduction Zones and future WNB West Natuna Basin
8
Roberts (1988) categorized West Natuna Basin as a wrench-related basin that
developed along a major zone of transcurrent or transform fault movement extending
from northern Burma to the Junction of the Red River Fault and the North Borneo
Trench offshore Sarawak. Basin geometry was created by continuous opening of pull-
apart basins in response to extrusion tectonics. The evolving geometry and architecture
of a typical pull-apart basin at West Natuna Basin are shown in Figure 4.
Sunda folds are common central Sumatra and elsewhere on the Sunda shelf,
including in the study area. Eubank and Makki (1981) define a Sunda fold as an inverted
fold caused by wrench deformation of an earlier normal-faulted section. Sunda Folds
tend naturally to be fault-bounded, shallow anticlines that are synclinal or half graben at
depth. The characteristics of these structures are as follows:
1. Sediment thickness increases over the structure.
2. Fold amplitude decreases with depth, often becoming synclinal at basement
level.
3. Throw of the major bounding fault reverse with depth. The upper part of the
fault shows reverse movement and the lower part shows normal throw.
In their study of petroleum geology in KH field, Pollock et al. (1984) define a
structure that outlines the area as an asymmetric compressional fold that conveys to a
northwest-southwest-trending, right-lateral, strike-slip fault. This strike-slip movement is
an overprint onto the earlier rifting phase. The fold was bisected by a north-south-
trending, normal, listric fault dipping westward. Paleontological data show that the

9
Figure 4. Schematic structural development, West Natuna Basin from Roberts (1988).

10
compressional event responsible for the present structural configuration in the area is
mid-Middle Miocene.
Formation of the West Natuna Basin began during the late Eocene to the early
Oligocene which extension generated a complex of east-west to northeast-southwest half
grabens. This period is described as a synrift megasequence on the basis of the tectonic
processes active during the deposition of the various sedimentary units (Figure 5). The
rift basin filled with lacustrine to fluvio-deltaic and alluvial sediments (Lama and Benua
Formations). This is construed to have been a time for the development of lacustrine
source rocks in the rift depocentres (Gulf Resources (Kakap) Ltd., 2000).
The postrift megasequence (early to late Oligocene) consisted of a period of
tectonic quiescence. Erosion of the stable shelf area supplied relatively thick, coarse
clastics of the Gabus formation. High-energy braided fluvial systems developed at a
number of levels, while silts and shales were deposited in lower energy distal
fluvial/lacustrine environment (Gulf Resources (Kakap) Ltd., 2000).
Change in orientation of regional stress fields (early to middle Miocene) marked
the syninversion megasequence. This change in stress resulted in compressional and

11
Figure 5. Chronostratigraphic KH Field modified from Gulf Resources (Kakap) Ltd., (2000). Depositional environment:

12
transpressional stress in this basin. Tjia and Liew (1996) proposed that this change of
stress was caused by cessation of the spreading of the South China Sea basin, which
enabled the westward convergence of the Pacific plate in the middle Miocene and the
convergence of the Indian-Australian plate from the south at the end of the Miocene.
Compressional and transpressional stress inverted major basin-bounding faults
and formed anticlines over hanging-wall blocks of the reverse faults (Wirojudo and
Wongsosantiko, 1985). East-northeast trends of anticlinal folds suggest a northwest-
southeast maximum horizontal stress (Tjia and Liew, 1996). A number of transgression-
regression cycles defined the deposition during this period.
This sequence of cycles resulted in a depositional environment that fluctuated
from lacustrine (Barat) to marginal marine (Pasir) and coal-swamp dominated coastal
plain (Arang). Some of this cycle may have occurred because of inversion events
whereas other cycles were caused by changes in regional relative sea level (Ginger et al.,
1993). Inversion continued until the late Miocene, when the Base Muda Unconformity
developed.
Postinversion Muda Formation is marked by shale domination in shallow marine
to paralic sequences. Faulting was not present in this period.

13
CHAPTER III
METHODS
This project used state-of-the art computer workstation techniques to facilitate
data integration and interpretation. I used Schlumberger Geoframe Charisma software to
interpret and manipulate seismic data and well-log information.
The data used in this study are 3D seismic in KH field, which consist of 600
inlines and 500 crosslines. The seismic grid is oriented north-northeast and west-
northwest. Record length is 3.5 seconds TWT. The seismic data are zero-phase. The
polarity convention adopted for all of the seismic displays is that a positive reflection
coefficient (increase in acoustic impedance) represents a trough. Alternatively, a
negative reflection coefficient is a peak. The variable area display used for this study is
red-white-black.
I correlated a grid of data from the 3D survey consisting of approximately every
tenth crossline and inline. I also generated time slices to aid in interpretations. I did
structural interpretation by picking fault patterns and horizon continuations.
Since fault displacement can be vertical, lateral or some of each, to interpret the
fault we should know the best angle to look at it. Subvertical faulting is seen best on
vertical seismic sections, while lateral (strike slip) faults are better seen in horizontal
sections.

14
In this study, I mapped major faults in vertical sections and horizontal sections.
In vertical sections, faults are identified by aligned bed termination, abrupt dip change,
and aligned dim amplitude (fault shadow), while in horizontal sections faults are
identified by lateral displacement of amplitude bands.
Seismic horizons were picked within the data set on the basis of the lithologic
tops and unconformity markers identified on the logs. The auto track from Charisma was
used while picking the horizons. This enabled selection of the true maximum or
minimum amplitude associated with each particular horizon. I used jump correlation
when picking events across faults. When there is inconsistency with this seismic jump
correlation across faults, then well-tie correlation became a key to correct it. The final
product is a time-structure, colored-grid map. This map depicts structural highs, lows,
and fault trends, outlines potential structural trap; and helps define structural controls on
deposition. I also created the Isochron maps for every horizon interval to show the
variation of sediment thickness.
Four major tectonostratigraphic units were also identified within the study area to
highlight the different tectonic processes active during the deposition of the various
sedimentary units.

15
CHAPTER IV
DEPOSITIONAL EVOLUTION
Rift-related linked depositional systems
In the study area where fault movement is in response to extensional tectonic
forces (Pollock et al., 1984; Ginger et al., 1993), the strength of the tectonic signature
becomes the dominant factor in the control on sedimentation. In terminal asymmetric
basins, bounded by faults that move in response to extensional tectonic forces, facies
relationships include features that may be related to influences that are solely local-
tectonic in origin, and that could not be due to a more regional change in relative base
level (Prosser, 1993). The duration of each rift-related linked depositional system, and
the sequences they form part of, will depend on the rate of faulting and basin formation,
which may be highly variable. In this case where the linked depositional systems would
be tectonic in origin, tectonic systems tracts might be define (Prosser, 1993).
Four tectonostratigraphic megasequences identified in the study area showing the
different tectonic processes active during the deposition of the various sedimentary units
(Figure 6). The four megasequences are synrift, postrift, syninversion and postinversion.
A unique association of sequence geometry, facies associations and reservoir
architecture characterize each phase. A prerift sequence is deposited prior to any
extensional movement. A synrift sequence is deposited during extensional faulting or
rift-basin infill. A postrift sequence is deposited after the cessation of extensional

NE SW
Figure 6. Four megasequences shown in the study area.
16

17
faulting. The postrift sequence may be deposited after a period of non-deposition and/or
erosion marked by a break-up unconformity, which may remove part of the synrift
sequence (Williams et al., 1989). A syninversion sequence is deposited during inversion
and a post-inversion sequence is deposited after the inversion.
Prosser (1993) explains the stages of rift evolution that occur in active-fault
bounded basins. Rift initiation (S2) is the first increment of movement on a fault cause a
depression in the crust’s surface to which gravity-driven sedimentary systems will
respond (Figure 7). For the purposes of tectonic systems tract description the basin is
presumed at this stage to be sub aerial, with enough water supply to maintain perennial
fluvial systems, and the surrounding source areas to be composed of consolidated,
competent rock. A rift climax (S3) is the time of maximum rate of displacement on a
fault (Figure 8). Three stages (early, mid and late), each a separate systems tract, was
described for rift climax. Immediate post-rift or immediate late syn-rift (S4) is the end of
active tectonism and displacement on the basin-bounding fault (Figure 9). Late postrift
or late synrift (S5) is the final response to the creation and infilling of a rift basin. It will
be the gradual and slow peneplanation of the topography created through faulting. The
late synrift systems tract may be masked by subsequent tectonic events, but in some

18
ure 7. Rift initiation system tract: (a) generalized block diagram;
Fig (b) schematic cross-section from Prosser (1993).

19
igure 8. Rift climax system tract: (a) generalized block diagram; (b) schematic
F cross-section from Prosser (1993).

20
Figure 9. Immediate post-rift systems tract; (a) generalized block diagram; (b) schematic cross-section from Prosser (1993).

21
cases characteristic linked depositional systems may develop (Figure 10).
Three stages of rift evolution (rift initiation, rift climax and late synrift) were
used to seismically subdivide the synrift megasequence in the study area. Each stage
performs a distinct linkage of depositional systems and a seismic expression that enables
its recognition on reflection profiles.
Synrift megasequence
Rift initiation (S2)
The reflection geometries in the study area illustrate some of the main
characteristics of rift-initiation systems tracts on seismic section. Figure 11 shows an
overall wedge-shaped geometry. The wedge shape has thin end that lies high on the
hangingwall dip-slope. The internal reflector characteristics are generally discontinuous.
The wedge shape reflects that the sedimentation kept pace with subsidence. A small fault
scarps also shows on seismic section. This feature indicates the erosion of the footwall.
Rift climax (S3)
Generally, this stage shows the aggradation, progradation and retrogration
configuration together with the expansion of divergent forms. Three stages (early, mid
and late-rift climax), each a separate systems tract can be described. Characteristic
reflector geometries were shows mark of the onset and termination of the three different
rift climax systems tracts that described below.

22
Figure 10. Late post-rift system tract: (a) generalized block diagram; (b) schematic cross-section from Prosser (1993).

Figure 11. Seismic section profile (a) and its line interpretation (b) showing rift initiation (S2), rift climax (S3), immediate post rift (S4) and late post rift (S5).
23

Figure 11. (continued).
24

25
Early rift climax system tract
The downlap surface shows the beginning of rift climax that discriminated this
stage from the rift initiation (Figure 11). The progradation and offlap on hangingwall
and aggrading reflectors close to the footwall characterize this stage. These forms show
that transgression was occurred. The offlap on hangingwall demonstrates the successive
tilting increments in basinward direction (Hunt & Mabey 1966; Hooke 1972; Leeder &
Gawthorpe 1987) and forced shoreline regressions (Udall & Nolan 1964).
Mid-rift climax system tract
This stage in the study area is characterized by the retrogradational geometries of
the reflectors on the hangingwall dip-slope, and the continuation of aggradation of the
footwall sequences. The retrogradation reflects the low angle of dip on hangingwall and
rapid drowning. A slightly divergence form shows in this stage. The divergence has
continuous reflectors that diverge towards the fault plane. The footwall systems by
aggradation of the footwall sequences had become important in the later stages of
development (Figure 11).
Late rift climax system tract
A draping reflector shows on seismic section in the study area (Figure 11). This
draping reflector shows the decrease of sediment accumulation rates. The depositional
system predominates in a totally submerged environment.
Immediate post-rift (S4)
The infilling reflector package has the wedge-shaped geometry with the internal
architecture shows onlap updip and progradation of sediment on the hangingwall dip

26
slope (Figure 11). The discontinuous reflectors indicate the energy of deposition. This
reflector shape and architecture mark the end of tilting of rift.
Late post-rift (S5)
The late stage of synrift megasequence can be recognized by the continuation of
reflectors to onlap the hangingwall dip slope (Figure 11).
Postrift megasequence
Post-rift in the study area shows the parallel continuous reflector (Figure 6).
These thick parallel reflectors (for about 1150 ms thick) lie above the synrift sequence
and have sheet external form with almost equal thickness. The parallel pattern suggests
uniform rates of deposition. The amplitude for this sequence shows the medium to high
that interpreted to indicate interbedding of shales.
Syninversion megasequence
The syninversion sequence in the study area was recognized by the onlap of the
reflector to the post-rift sequence and also by toplap of the reflector to the unconformity
(Base Muda Unconformity) above it (Figure 6). The onlap reflection termination
indicates that it was deposited during the inversion. The inversion had uplift of the
synrift and postrift sequences along the fault that form the fault-propagation folds. The
syninversion sequence deposited during the form of fault-propagation fold that made its
reflection onlap to the previous sequence. The onlap was created on both the back-limbs
and front-limbs of the fold.

27
Postinversion megasequence
In the study area, the start of deposition of postrift megasequence was marked by
the unconformity (Base Muda Unconformity) shown in Figure 6. This sequence overlies
the crest of the fold. The sequence was deposited during a period of quiescence and is
the final sequence in the depositional evolution in the study area.
Isochron maps
Four isochron maps drawn for the Basement through Base Muda Unconformity
horizons show that the strike of the depocenter is in a west-northwest direction and the
thickest sediment for each horizon interval is placed along side of fault with north-
northeast direction.
Basement – Lower Gabus interval
This interval ranges in thickness from 379 ms to 1342 ms in the depocenter
basinward (Figure 12). The depocenter shows in blue area. The depocenter lies parallel
to the major fault with direction west-norhtwest. The thickest sediment placed at the
western part of the depocenter. The thickness increases gradually from east to the
depocenter and increases slightly rapid from west to the depocenter.
Lower Gabus – Upper Gabus interval
Isochron map shows that the thickest sediment in this interval is 295 ms (Figure
13). The map shows almost equal thickness through all the area. The blue area which
reveals the thickest sediment was deposited at the western part parallel to the north-south
fault.

28
Figure 12. Isochron map of Basement – Lower Gabus interval.

29
Figure 13. Isochron map of Lower Gabus – Upper Gabus interval.

30
Upper Gabus – Barat interval
The isochron map in this interval shows that the thickness range in all area
almost the same which is it has equal thickness like what shows in the Lower Gabus –
Upper Gabus interval (Figure 14). The interval has 249 ms for the thickest sediment.
Barat – Base Muda interval
The map shows the west-northwest closure that parallel to the major fault (Figure
15). The closure area shows in orange to red area has the same form with the depocenter
in basement – lower gabus interval. The thickness range from 849 ms through 1213 ms.
The thinnest area is in the center of closure area represent by red color that parallel to the
north-south fault. It placed at both side of the fault. The thickest area shows in blue color
are placed on the flank of the closure. These thickness patterns were affected by the
closure form from Barat horizon against the Base Muda Unconformity at the top.

31
Figure 14. Isochron map Upper Gabus – Barat interval.

32
Figure 15. Isochron map Lower Gabus – Base Muda Unconformity interval.

33
CHAPTER V
STRUCTURAL EVOLUTION
I interpreted a series of seismic profiles and time-structure maps to establish the
nature and distribution of the faults, the nature of the basement and the tectonic style that
influenced the study area.
A short glance through the data revealed a half graben structure bounded by
major basement fault with west-northwest-trend and dipping to the north, a series of
normal fault with strike trend north-south, mostly dipping to the west and few dipping to
the east and an east-west asymmetrical anticline.
Fault-propagation fold formed at the tips of a reactivated extensional fault
creating an east-west asymmetrical anticline. A series of normal faults intersect this
asymmetrical anticline.
Time-structure maps
I mapped the relationships among faults on all five horizons.
Basement horizon
The basement time structure map shows the synclinal-closure geometry (Figure
16). The deepest area is at 3379 ms, ranging to the shallower area, which is 2640 ms in
depth. This map shows the geometry of the half graben in the area bounded by the
almost east – west normal fault. This fault is dipping to the north.

34
Figure 16. Time-structure map of Basement.

35
Lower Gabus horizon
The prominent structural features seen on this horizon include the north – south
striking normal faults (Figure 17). This horizon is cut by four major normal faults which
dip to the west. The normal faults shifted a little to the west compared to the Upper
Gabus horizon. Horizon depth range is between 1879 ms to 2375 ms. Closure geometry
in this map trends northwest – southeast.
Upper Gabus horizon
I correlated the Upper Gabus horizon in the study area. The structure follows a
north – south trend. All four major normal faults in the study area cut through this
horizon (Figure 18). Horizon depth ranges between 1720 ms and 2178 ms. This horizon
also shows a closure that has a trend northwest – southeast. The highest part of this
horizon took place in the central area and was cut through by a normal fault. The closure
dips steeply to the west and gently to the east.
Barat horizon
I made a grid map of Barat horizon. The time structure map shows north-south
normal faults that cut through this horizon (Figure 19). Major normal faults at the
northern part of the area dip to the west while those at the southwest part dip toward the
east. Two closures can be found at the side of the F3 fault.
The maximum depth of this horizon is 2078 ms while the lowest depth at this
horizon is 1628 ms. The highest part of this horizon at almost the centre was cut through
by a series of north – south normal faults.

36
Figure 17. Time-structure map of Lower Gabus.

37
Figure 18. Time-structure map of Upper Gabus.

38
Figure 19. Time-structure map of Barat.
39
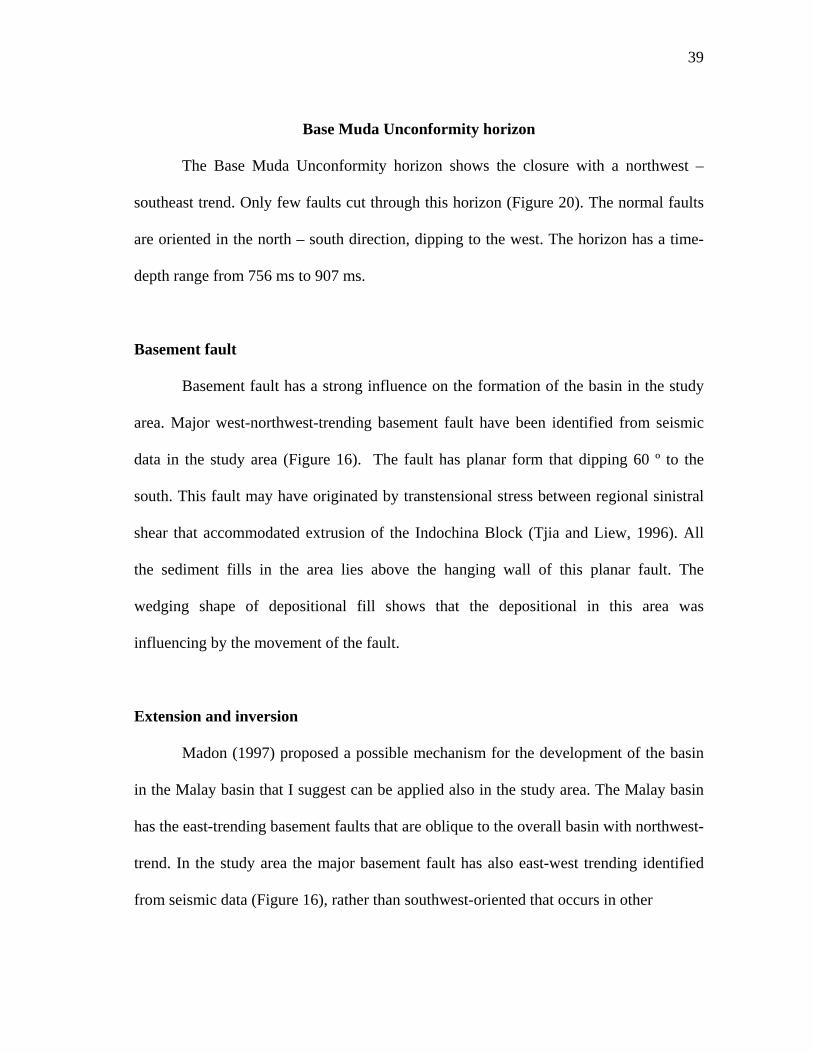
Base Muda Unconformity horizon
The Base Muda Unconformity horizon shows the closure with a northwest –
southeast trend. Only few faults cut through this horizon (Figure 20). The normal faults
are oriented in the north – south direction, dipping to the west. The horizon has a time-
depth range from 756 ms to 907 ms.
Basement fault
Basement fault has a strong influence on the formation of the basin in the study
area. Major west-northwest-trending basement fault have been identified from seismic
data in the study area (Figure 16). The fault has planar form that dipping 60 º to the
south. This fault may have originated by transtensional stress between regional sinistral
shear that accommodated extrusion of the Indochina Block (Tjia and Liew, 1996). All
the sediment fills in the area lies above the hanging wall of this planar fault. The
wedging shape of depositional fill shows that the depositional in this area was
influencing by the movement of the fault.
Extension and inversion
Madon (1997) proposed a possible mechanism for the development of the basin
in the Malay basin that I suggest can be applied also in the study area. The Malay basin
has the east-trending basement faults that are oblique to the overall basin with northwest-
trend. In the study area the major basement fault has also east-west trending identified
from seismic data (Figure 16), rather than southwest-oriented that occurs in other

40
Figure 20. Time-structure map of Base Muda Unconformity.

41
sub-basin of the West Natuna Basin (Ginger et al., 1993). The mechanism here, that the
basin was formed by distributed shear deformation of the axial shear zone (Figure 21).
Madon (1997) used the block model of McKenzie and Jackson (1986) to illustrate the
role of distributed continental deformation in the formation of extensional basins (Figure
22). The model suggests that the half grabens were formed by dextral oblique motion
between the fault-bounded blocks, as a result of sinistral transtension of the whole zone.
This extensional commenced during Eocene time (Ginger et al., 1993).
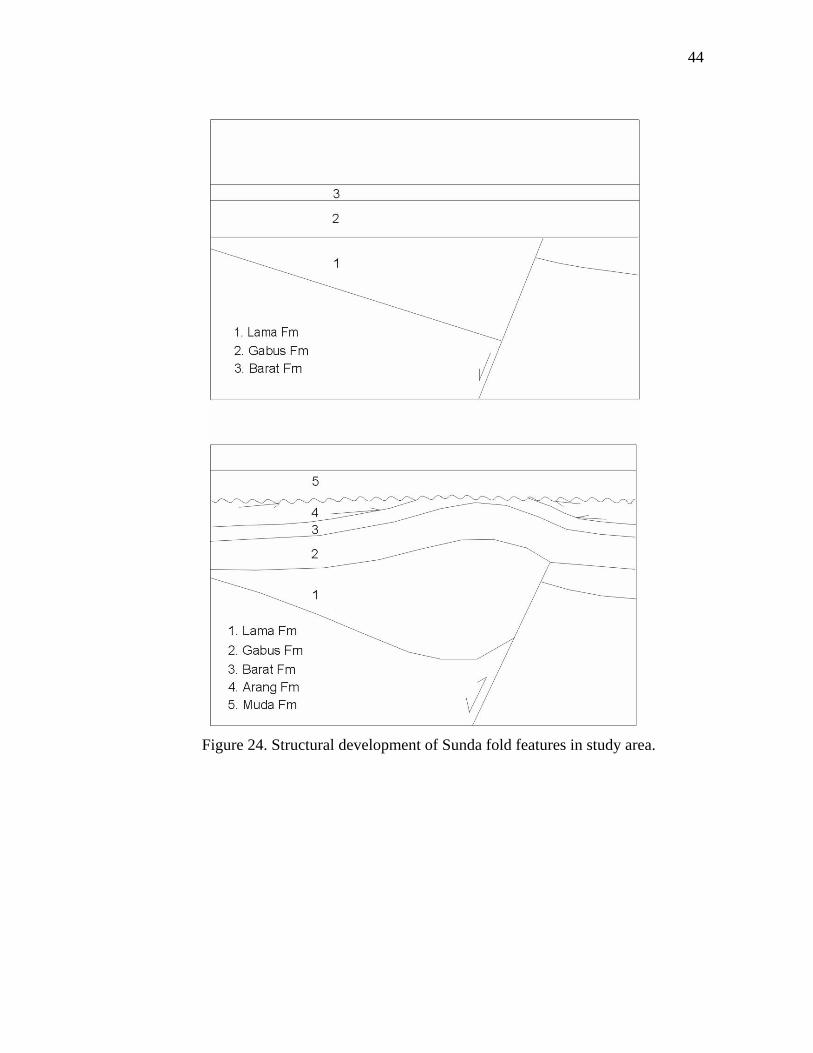
Tjia (1996) explained that the inversion in the area is caused by a reversal of the
original sinistral shear. The inversion of half graben in the study area can be explained
also by McKenzie and Jakson block model (Figure 22). As the original sinistral shear
reversed, then the crustal blocks would rotate clockwise. This rotation will generate the
north-south shortening in the graben. Fault-propagation fold was created during this
process or common (ie., Sunda folds) in Sunda shelf area (Figure 23). This fold overlies
an extensional half-graben that is bounded by the east-trending basement fault. The
structural development of the Sunda fold in study area is illustrated in Figure 24. Other
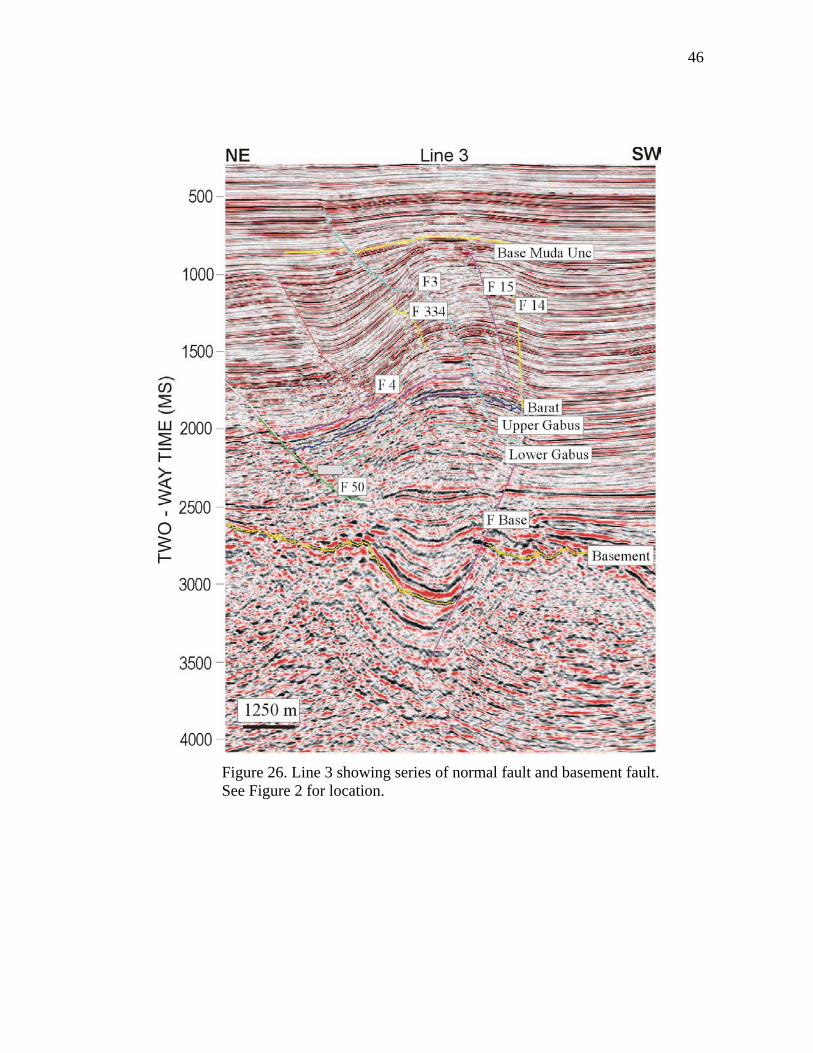
structure that suggested as inversion structure that shows in the study area was series of
normal faults (Figures 25-28). These normal faults developed as secondary faults that
develop during inversion.

42
Figure 21. The schematic illustration of distributed continental
deformation in the formation of extensional basins in the study area.
A. Transtension B. Transpension
Figure 22. Block model for extension and inversion in the study area based on original concept of McKenzie and Jackson (1986).

43
Figure 23. Line 1 showing fault-propagation fold or sunda fold. See Figure 2 for location.
44
Figure 24. Structural development of Sunda fold features in study area.

45
Figure 25. Line 2 showing series of normal fault that develop during
inversion and basement fault. See Figure 2 for location.
46
Figure 26. Line 3 showing series of normal fault and basement fault. See Figure 2 for location.

47
Figure 27. Line 4 showing synthetic and antithetic
faults and basement fault. See Figure 2 for location.

48
Figure 28. Line 5 showing series of normal faults. See Figure 2 for location.

49
CHAPTER VI
DISCUSSION
Tectonics had a great control in the expansion of the structural features and the
sedimentary column in the study area. The major features involve a half graben bounded
by a planar-normal fault with main orientation west-east. This planar-normal fault
influenced the formation of the fault-propagation fold that post-dates the graben fill.
Model of basin development placed in regional context
Extrusion of the Indochina microplate by the Indian-Asian collision caused large
blocks of continental crust to be rifted and form half grabens and grabens in West
Natuna Basin by the sinistral transtensional stress. In the study area, this extrusion
formed a half graben bounded by a west-east planar-normal fault (Figure 16). This
agrees with the Tapponnier et al. (1982) collision-extrusion model that inferred left-
lateral movement on the strike-slip faults which bounded the microplates and whose
motion formed extensional basins at their ends. Later, in the early to middle Miocene,
propagation of the South China Sea enabled the westward convergence of the Pacific
plate. The convergence of the Indian-Australian plate from the south changed as the
stress became a dextral transpressional stress that further extended the West Natuna
Basin (Tjia and Liew, 1996). Compressional and transpressional stress-inverted major
bounding faults created an asymmetric fault-propagation fold and a splay of normal

50
faults in the study area (Figure 17 - 19). These inversion structures overlie extensional
half grabens that are bounded by the west-east-trending basement faults. In the study
area, inversion structures also resemble series of north-south trending normal faults
(Figure 25 - 28), which suggests that shortening across the half-grabens create the
releasing area. A change from sinistral to dextral motion may have caused the basin to
be inverted. The development of fault-propagation folds could have formed by
deformation, occupying pre-existing west-northwest-east-southeast-trending en echelon
half-grabens in response north-south shortening associated with the dextral shear.
Prospective traps
Prospective traps in the study area placed a series of north-south trending normal
splay faults that developed by dextral transpression movement. These normal faults
bound the fold that creates a closure, making them 3-way dip traps. These kinds of traps
depend on reservoir juxtaposition on the upthrown block against the downthrown block
in a normal fault relationship. In the study area, the Gabus and Barat reservoir
formations show the development of this trap (Figure 17-19).

51
CHAPTER VII
CONCLUSIONS
The structure and sediment development in the study area are strongly influenced
by tectonic deformation in the area. In a regional context, the basin development has
undergone the transtensional sinistral shear during the rift phase, which was reactivated
during the early-mid Miocene inversion as a transpressional, dextral shear.
Four periods of tectonic activity were identified in the study area by their
sediment and structural architecture derived from the interpreted seismic section and the
resulting maps as can be described as follows:
1. A rifting process caused the formation of half grabens. The extension
stage occurred during the Eocene as indicated by Eocene sediments
filling the deep grabens that were created. The rifting is bounded by
normal faults that dip steeply to the north. Synrift deposition occurred
as indicated by the wedging sediments. Four stages of basin evolution
(rift initiation, rift climax, immediate postrift and late postrift) are
characterized by this synrift deposition. Each stages shows
sedimentation relation with the subsidence cause by the displacement
of fault. That relationship reveals by the reflector configuration.
2. During a period of quiescence, early to late Oligocene sediments were
deposited horizontally with no tectonic activity. These Postrift

52
sediments have a parallel, continuous reflection pattern and strong
amplitude.
3. A period of compression caused the inversion of sediment in structural
lows in early to middle Miocene time. This is illustrated in the
inversion structure by development of the Sunda fold shown in Figure
24. Syninversion deposition occurred, as indicated by onlap and
toplap.
4. A major erosion (Base Muda Unconformity) was followed by a period
of quiescence and deposition of postinversion sediment.
The trap play is related to the tectonic deformation across the area. A structural
closure developed along a series of north-south-trending, normal splay faults that formed
as a result of dextral transpression in mid to late Miocene time.

53
REFERENCES CITED
Daly, M. C., M. A. Cooper, I. Wilson, D. G. Smith, and B. G. D. Hooper, 1991,
Cenozoic plate tectonics and basin evolution in Indonesia: Marine and Petroleum
Geology, v. 8, p. 2-21.
Eubank, R. T., and A. C. Makki, 1981, Structural geology of the central Sumatra back-
arc basin: Indonesian Petroleum Association, 10th Ann Conv, p. 153-196.
Ginger, D. C., W. O. Ardjakusumah, R.J. Hedley, and J. Pothecary, 1993, Inversion
history of the West Natuna Basin: examples from the Cumi-Cumi PSC:
Proceedings of the 17th Annual Convention of the Indonesian Petroleum
Association, v. I, p. 635-658.
Gulf Resources (Kakap) Ltd., 2000, PSC summary and prospect and lead inventory,
Kakap PSC Offshore West Natuna, Unpublished Report.
Harding, T. P., 1990, Identification of wrench faults using subsurface structural data:
criteria and pitfalls: The American Association of Petroleum Geologists Bulletin,
v. 74, p. 1590-1609.
Longley, I. M., 1997, The tectonostratigraphy evolution of SE Asia, in Fraser, A.J.,
Matthews, S.J. and Murphy, R.W. (eds), Petroleum Geology of Southeast Asia:
Geological Society Special Publication, v. 126, p. 311-339.

54
Madon, M. B. H., 1997, The kinematics of extension and inversion in the Malay Basin,
Offshore Peninsular Malaysia: Bulletin Geological Society of Malaysia, v. 41,
p. 127-138.
Pollock, R. E., J. P. Hayes, K. P. Williams, and R. A. Young, 1984, The petroleum
geology of the KH Field, Kakap, Indonesia: Proceedings of Indonesian
Petroleum Association, v. 13, p. 407-423.
Prosser, S., 1993, Rift-related linked depositional systems and their seismic expression,
in Williams, G.D. and Dobb, A. eds., Tectonics and seismic sequence
stratigraphy: Geological Society Special Publication, no. 71, p. 35-66.
Pupilli, M., 1973, Geological evolution of South China Sea Area – tentative
reconstruction from Borderland Geology and well data: Proceedings of
Indonesian Petroleum Association, v. 2, p. 223-241.
Roberts D. G., 1988, Basin evolution and hydrocarbon exploration in the South China
Sea, in Wagner, H. C., Wagner, L. C., Wang, F. F. H., and Wong, F. L., editors,
Petroleum Resources of China and Related Subjects: Houston, Texas, Circum-
Pacific Council for Energy and Mineral Resources Earth Science Series, v. 10,
p. 157-177.
Tapponier, P., G. Peltzer, A.Y. Le dain, R. Armijo, and P. Cobbold, 1982, Propagating
extrusion tectonics in Asia: new insight from simple experiments with
plasticine: Geology, v. 10, p. 611-616.

55
Tjia H. D., and K. K. Liew, 1996, Changes in tectonic stress field in northern Sunda
Shelf basins, in R. Hall, and D. J. Blundell, eds., Tectonic evolution of Southeast
Asia: Geological Society Special Publications, London, Geological Society of
London, p. 291-306.
Wirojudo, G. K., and A. Wangsosantiko, 1985, Tertiary tectonic evolution and related
hydrocarbon potential in the Natuna Area: Energy, v. 10 (3/4), p. 433-455.
White Jr., J. M., Wing and R.S. Wing, 1978, Structural development of the South China
Sea with particular reference to Indonesia: Proceedings of Indonesian Petroleum
Association, v. 7, p. 159-174.

56
VITA Name Maria Fransisca Meirita Mailing Address Perum Pemda Jatiasih Bekasi
Blok A8 No.6 Jatiasih, Bekasi, Indonesia 17423 Working Address Exploration Department
Gulf Indonesia Resources Ltd. – CONOCOPHILLIPS Indonesia Inc. Mulia Tower 4-5th floor, Jalan Gatot Subroto, Jakarta, Indonesia Educational Background B.S. in geology,
Trisakti University, April 1998.
M.S. in geophysics, Texas A&M University, August 2003. Professional Organization American Association of Petroleum Geologist
(AAPG), Society of Exploration Geophysicist (SEG).
Experience Junior Geologist Gulf Indonesia Resources Ltd. December 1999 – July 2000


