
The Tata WayA Mutually Reinforcing Cycle of Profitability and Sustainability
Jose Ochoa, Rajiv Rammohan, Ram Sangireddy, Christopher Shields

Executive Summary
Our strategy will propel Tata to the top of global CSR leadership by:• Maximizing its initiatives by localizing them• Allowing realistic CSR comparisons across all of Tata’s companies• Considering the lifecycle impact of its products and services• Developing a groundbreaking buy-in and incentive tool• Creating measurable value for Tata and for society
Adapting to new markets New Markets Multiplier Factor
Stepping it up a notch Product Lifecycle Impact Metric
Aligning purpose with profit Internal CSR credit market
The strategy relies on our Three Pillars of Sustainability:

CSR investments have realized a 32% return to Tata’s brand equity, creating value for each Tata Group company.
Value Gained on Tata Brand Equity Due to CSR $US BN
Value of the Tata Brand $9.92
Estimated 2008 Tata CSR Contributions $0.603
Cost of CSR Contribution in Perpetuity $6.03
Value of Brand Equity – CSR Investment $3.89
Value of Brand Equity Due to CSR $1.94
ROI of CSR Investment 32%

Tata’s CSR initiatives align the interests of each of its stakeholders and strengthen its overall competitive advantage
Stakeholders Interests Leverage over Tata
Workers Safety, fair wages, etc…
Strikes, decreased productivity
Local communities
Investments in local needs
Oppose and hinder expansion plans
Investors Financial return Access to capital markets
Benefits of CSR Initiatives
A firm ‘people want to work for’
Low interference, overall support
More stable financial returns

With global expansion, Tata must adapt its CSR efforts to match the diverse needs of local communities.
Metric Germany Vietnam
GDP (PPP) per capita $34,100 $2,900
% population below poverty line 11% 22%
Adult literacy rate 99% 90.3%
HIV/AIDS prevalence rate 0.1% 0.5%
Unemployment rate 8.2% 2.9%
Tata CSR focus (proposed) • Employment• Environment
• Education• Health
Source: CIA World Fact Book
New Markets 2 3
Localize One-size-fits-all CSR strategy is neither efficient nor sustainable

New Tata
Index
NMMF enables the Tata Group to fairly compare the CSR performance of each of its companies
NMMFUse to compare
Tata Group companies’ CSR
performance
Original Tata
Index
New Markets 2 3
New Markets Multiplier Factor (NMMF) normalizes sustainability initiatives of different Tata Group companies to facilitate comparison of CSR performance
Normalize

ProfitSynergies
Incorporating PLIM in the Tata Index will put the group at the forefront of CSR
1 PLIM 3
Product Lifecycle Impact Metric (PLIM) measures the lifecycle impact of Tata Group companies’ products Measure
Product Impact
CSR Synergies PLIM

The modified Tata Index will be tied to performance against annual CSR targets.
Assessment Levels
Total Points
Tata Chemicals
2010 CSR Performance Target 600 560
Total points (before suggested modifications)
1000 534.15
Product Response – Level IV (PLIM) 100 10
(1) Value addition to society in perpetuitya) Human standard of living and purchase
capacityb) Enhanced ease of mutual existencec) Enhanced health and safety conditionsd) Other considerations
(0 to 100)30203020
40
(2) Lifetime Ecological Impacta) Environmental pollutionb) Material wastec) Human health and safetyd) Other considerations
(-100 to 0)-30-20-30-20
-30
Total Points (including PLIM) 1100 544.15
OriginalIndex Score
Modified Index Score
PLIM Score
1 PLIM 3
Target Target Index Score

Firm meet profit
target?
NO
YES
NO
TATA Group Internal CSR
Market
• Not eligible for incentives• Not allowed CSR trading
Allowed to tradeCSR credits YES
Sell CSR credits?
Buy CSR credits?
• Eligible for incentives• Maximize profitability
NONot eligiblefor incentives
YES
Eligible forincentives
Internal CSR market will align each company’s financial incentives with the double bottom line of responsibility and profitability
Firm meet CSR
target?
Firm meet CSR
target?
1 2 CSR Market

Phased in rollout will enable flexible and scalable implementation of a strategy sustainable in the long term
Task 2011 2012 2013 2014 2015 2016 2017 2018 2019 2020
Create Local Task Force
Revise Internal Sustainability
System
Increase Coordination
with all Stakeholders
Rollout PLIM
Commence CSR internal trading
Implement and Revise CSR
internal market
Early : Anticipated leadership change
Year Three: Group wide rollout
Year Six: CSR market is fully operational

An annual investment in CSR Trading Market bonus pool will generate an additional profit margin of 0.829%.
Corporate Social Responsibility Performance
Intangible resources*
Innovation
Human Capital
Reputation
Culture
Corporate Financial Performance
Figure adapted from Surroca, Jordi, Josep Tribo, and Sandra Waddock. "Corporate Responsibility and Financial Performance: The Role of Intangible Resources." Strategic Management Journal, 2010: 463-490.
Intangible resources*
Innovation
Human Capital
Reputation
Culture
PV of Perpetual Investment = $1BPV of Perpetual Profit Generated = $8.29MCSR Profit Margin = 0.829%
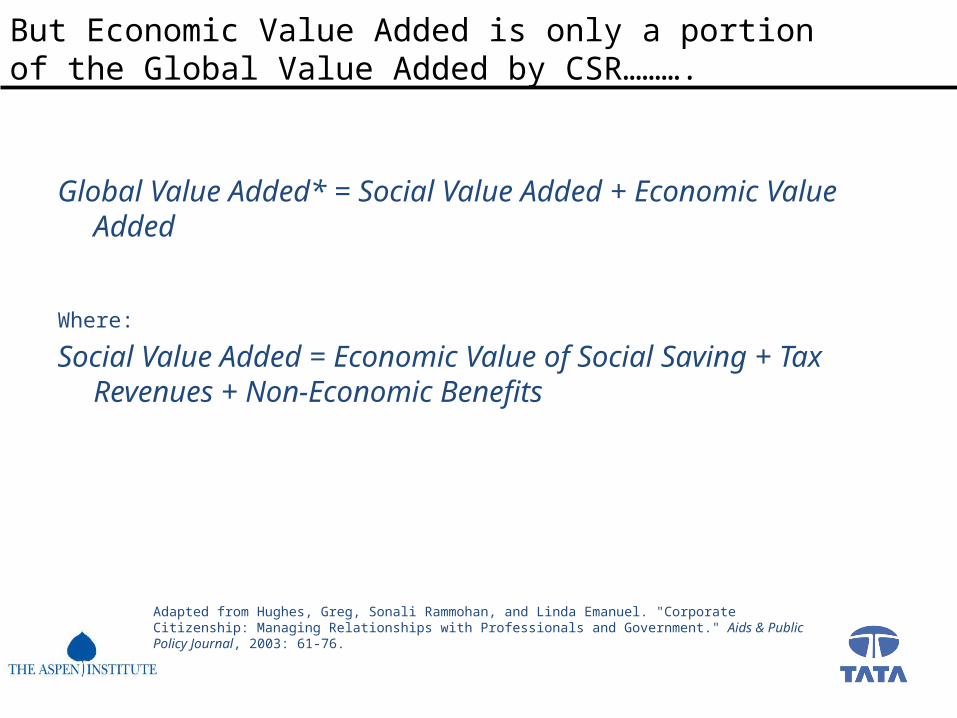
But Economic Value Added is only a portion of the Global Value Added by CSR……….
Global Value Added* = Social Value Added + Economic Value Added
Where:
Social Value Added = Economic Value of Social Saving + Tax Revenues + Non-Economic Benefits
Adapted from Hughes, Greg, Sonali Rammohan, and Linda Emanuel. "Corporate Citizenship: Managing Relationships with Professionals and Government." Aids & Public Policy Journal, 2003: 61-76.

Local application of Tata Index, PLIM, and CSR Credit Trading Market are key to Tata’s corporate strategy.
This CSR Strategy is Key to Corporate Strategy:• Aligns profitability with sustainability• Enhances brand equity• Erects barriers to entry for competitors• Anticipates future regulatory changes• Further enables a smooth leadership transfer• Further institutionalizes Tata’s culture for future generations
Next Steps:• Create leadership task force composed of Group Corporate Sustainability VP, Group
CFO, Group COF, CMO, and other relevant executives to solidify strategy• Commence the creation of local task forces• Work with governments, NGO’s, the UN, and local residents to identify CSR needs
within each target market• Further investigate how to maximize both profits and social performance*• Move forward with this strategy!
* Husted, Bryan, and Jose de Jesus Salazar. "Taking Friedman Seriously: Maximizing Profits and Social Performance." Journal of Management Studies, 2006: 75-91. We suggest this merely as a starting point, the Tata group must optimize profits and social performance according to the needs of all Tata stakeholders.

Thank You
Questions?
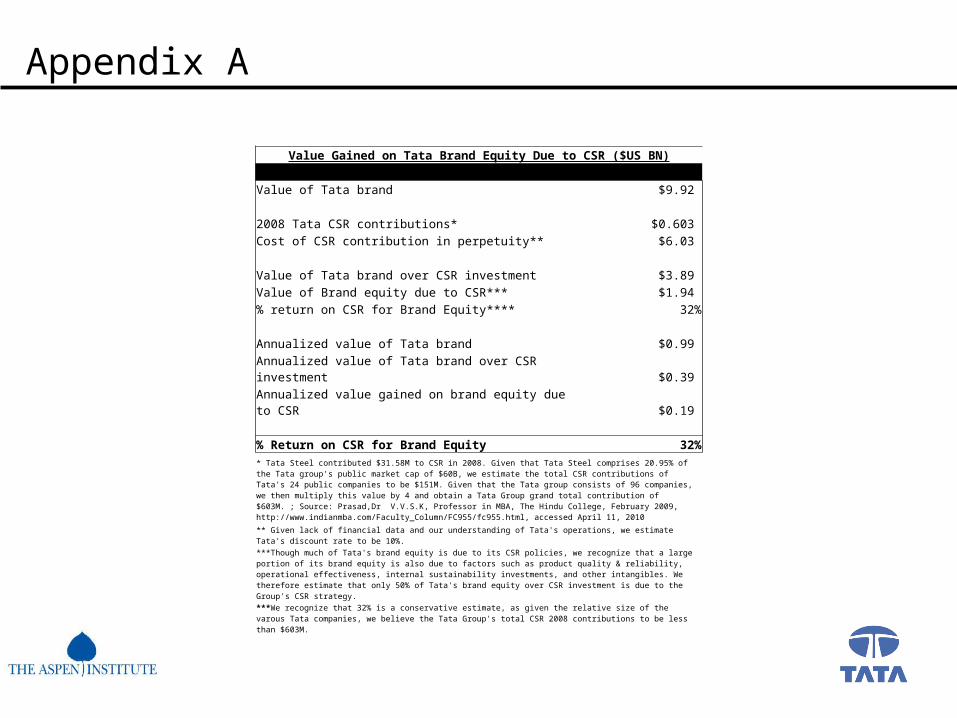
Appendix A
Value Gained on Tata Brand Equity Due to CSR ($US BN)
Value of Tata brand $9.92 2008 Tata CSR contributions* $0.603 Cost of CSR contribution in perpetuity** $6.03 Value of Tata brand over CSR investment $3.89 Value of Brand equity due to CSR*** $1.94 % return on CSR for Brand Equity**** 32% Annualized value of Tata brand $0.99 Annualized value of Tata brand over CSR investment $0.39 Annualized value gained on brand equity due to CSR $0.19 % Return on CSR for Brand Equity 32%
* Tata Steel contributed $31.58M to CSR in 2008. Given that Tata Steel comprises 20.95% of the Tata group's public market cap of $60B, we estimate the total CSR contributions of Tata's 24 public companies to be $151M. Given that the Tata group consists of 96 companies, we then multiply this value by 4 and obtain a Tata Group grand total contribution of $603M. ; Source: Prasad,Dr V.V.S.K, Professor in MBA, The Hindu College, February 2009, http://www.indianmba.com/Faculty_Column/FC955/fc955.html, accessed April 11, 2010
** Given lack of financial data and our understanding of Tata's operations, we estimate Tata's discount rate to be 10%.
***Though much of Tata's brand equity is due to its CSR policies, we recognize that a large portion of its brand equity is also due to factors such as product quality & reliability, operational effectiveness, internal sustainability investments, and other intangibles. We therefore estimate that only 50% of Tata's brand equity over CSR investment is due to the Group's CSR strategy.
***We recognize that 32% is a conservative estimate, as given the relative size of the varous Tata companies, we believe the Tata Group's total CSR 2008 contributions to be less than $603M.

Appendix B
CSR Investment Profit Margin ($US M)
Initial CSR Investment $100 Discount rate 10%Value of CSR Investment in Perpetuity $1,000
Δ in innovation due to CFP 860.00
Δ in Human capital due to CFP 530.00
Δ in Repuation due to CFP 640.00
Δ in Culture due to CFP 89.00
Δ in CSR rating in perpetuity 423.55
Δ in innovation due to CSR 59.30
Δ in Human captial due to CSR 127.07
Δ in Reputation due to CSR 160.95
Δ in Culture due to CSR 173.66 Additional Profit due to CSR in perpetuity $8.29 Annual Additional Profits due to CSR $0.83 Profit margin 0.829%

Appendix C
Relationship between CSR and Financial Performance
Effects of CSR on Intangible Resources β Innovation 0.140β Human Capital 0.300β Reputation 0.380β Culture 0.410 Effects of Intangible Resources on CFP β Innovation 0.031β Human Capital 0.021β Reputation 0.008β Culture 0.014 Effects of CFP on Intangible Resources β Innovation 0.860β Human Capital 0.530β Reputation 0.640β Culture 0.089 Effects of Intangible Resources on CSR β Innovation 0.220β Human Capital 0.318β Reputation 0.087β Culture 0.121
Obtained from Surroca, Jordi, Josep Tribo, and Sandra Waddock. "Corporate Responsibility and Financial Performance: The Role of Intangible Resources." Strategic Management Journal, 2010: 463-490.

NMMF enables the Tata Group to fairly compare the CSR performance of each of its companies
NMMF
Compare Tata Group
companies’ CSR performance
Tata Index
NMMFTata Index
Vietnam
Germany
1 2 3

Incorporating the Product Lifecycle Impact Metric (PLIM) in the Tata Index will put the group at the forefront of CSR
Positive Externalities:• Bene
fits rural farmers
• Reduces malnutrition by increasing crop yields
Negative Externalities:• Leads
to soil and water pollution
Product Impact Synergies PLIM
Global CSR
Group
Company
Tata Chemicals• Gains
exposure to working with low income farmers
Tata Kissan Sansar• Can
utilize this knowledge in selling XXX in similar markets1 2 3


