Download - STRATEGIC ENROLLMENT MANAGEMENT 2020 2021
RECRUITMENT RETENTION GRADUATION
STRATEGIC ENROLLMENT MANAGEMENT
2020-2021
Introduction: Lincoln University is experiencing a renaissance. Lincoln University is now ranked in the top 20 among all HBCUs. This is an improvement of eight‐points over our previous year’s standing. Among all ranked HBCUs, Lincoln University is 12th and 11th for retention and graduation rates and 7th for alumni giving. The latter being a great indicator of how much Lincoln graduates continue to invest in the legacy of this great institution. Other rankings of note are that, for the first time, our University is ranked among the top public universities in the Northern region, landing at number 40 and 41st among all northern region institutions for social mobility (percentage of Pell recipients graduated). In another social mobility ranking, Lincoln is number 1 among all 4‐year institutions in Pennsylvania for moving individuals from the lowest to the highest socio‐economic level. Lincoln was also ranked third in the region in post‐secondary education mobility by Social Innovations Journal. Social mobility accolades singled the great return on investments made towards a Lincoln University degree. Reaffirmation with commendations by the Middle‐States Commission on Higher Education also signals revitalization at Lincoln. Being reaffirmed signals that Lincoln University continues to meets strict and rigorous quality standards which help in maintaining a valid, credible reputation among fellow institutions, students and the public.
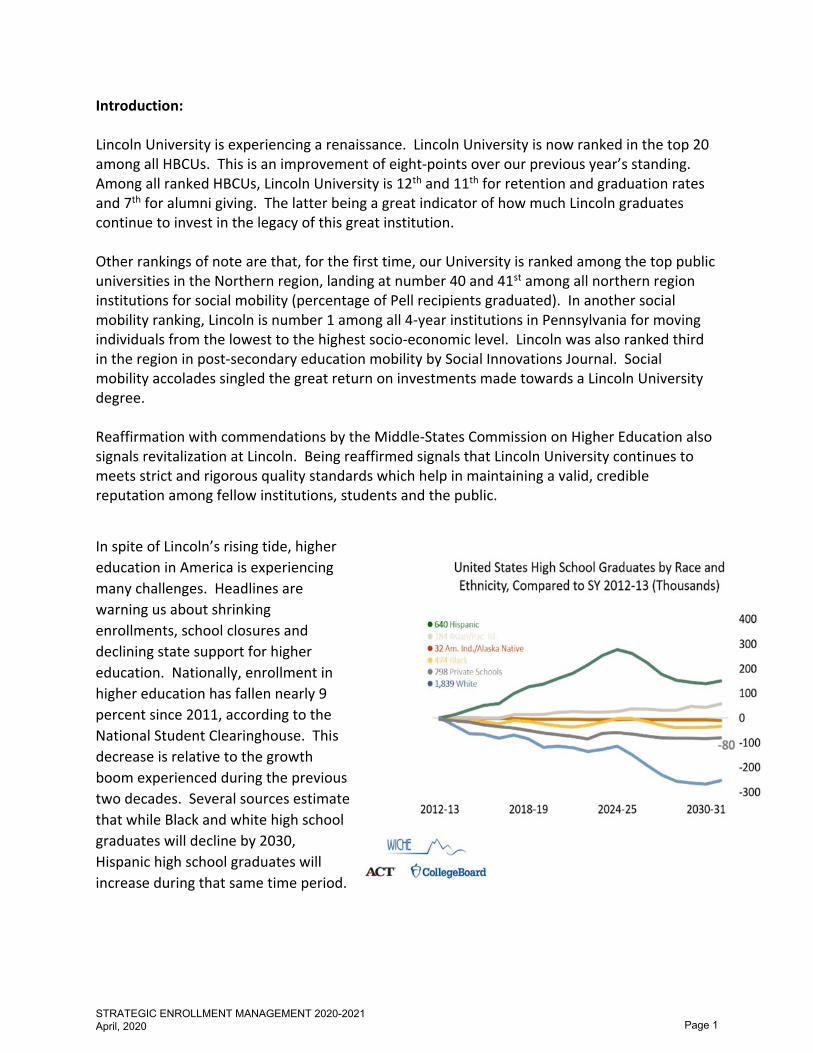
In spite of Lincoln’s rising tide, higher
education in America is experiencing
many challenges. Headlines are
warning us about shrinking
enrollments, school closures and
declining state support for higher
education. Nationally, enrollment in
higher education has fallen nearly 9
percent since 2011, according to the
National Student Clearinghouse. This
decrease is relative to the growth
boom experienced during the previous
two decades. Several sources estimate
that while Black and white high school
graduates will decline by 2030,
Hispanic high school graduates will
increase during that same time period.
STRATEGIC ENROLLMENT MANAGEMENT 2020-2021 April, 2020
Page 1
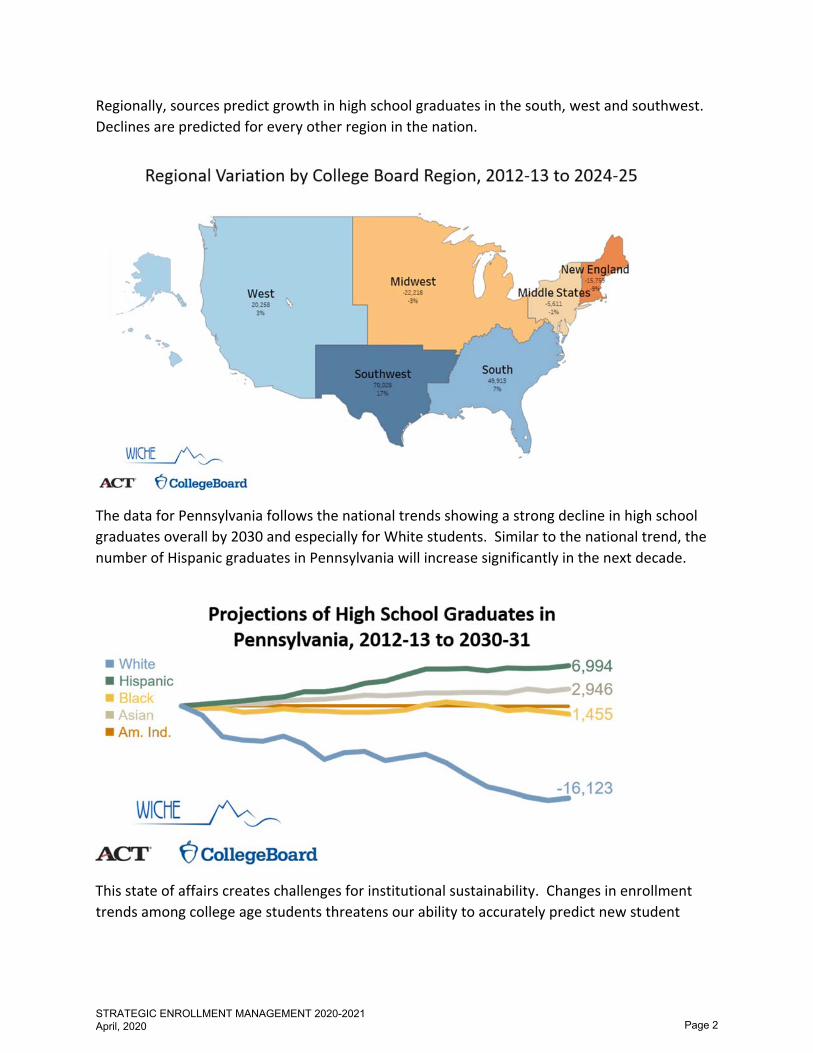
Regionally, sources predict growth in high school graduates in the south, west and southwest.
Declines are predicted for every other region in the nation.
The data for Pennsylvania follows the national trends showing a strong decline in high school
graduates overall by 2030 and especially for White students. Similar to the national trend, the
number of Hispanic graduates in Pennsylvania will increase significantly in the next decade.
This state of affairs creates challenges for institutional sustainability. Changes in enrollment
trends among college age students threatens our ability to accurately predict new student
STRATEGIC ENROLLMENT MANAGEMENT 2020-2021 April, 2020
Page 2

yield. This in turn effects our ability to plan financially long‐term as models for sustaining size
as well as predicting growth are becoming more challenging.
The Strategic Enrollment Management Plan (SEM) is designed to use the state of enrollment
trends nationally and regionally as well as internal recruitment, retention, graduation and
financial aid data to devise a long‐term scheme for achieving the enrollment goals of the
University. The SEM plan considers Lincoln’s enrollment goals in the context of its mission as a
small, historically Black, liberal arts institution with opportunity to grow in the areas of
graduate, continuing and on‐line education.
RECRUITMENT‐Traditional Undergraduate Population
New First‐Time Freshmen and New Transfer Students
New First‐Time Freshmen enrollment grew at Lincoln from 448 in Fall 2014 to 664 in 2017
representing a 48% positive change. Since then, new first‐time student enrollment has been on
a steady decline. The Fall 2019 class of 445 reflects a loss of the 48% gain witnessed just two
years prior.
New first‐time first‐year enrollment
Fall 2014 Fall 2017 Fall 2019
Total 448 664 445
Female 60% 68% 66%
Male 40% 32% 34%
In‐state 35% 38% 43%
Out‐of‐state & International 65% 62% 57%
Nonetheless, average SAT scores and high school GPAs have increased for the applicant,
admitted, and enrolled student pools since 2015. The average SAT for enrolled students has
increased about 100 points between 2015 and 2019. The average GPA for enrolled students
has shown a slight increase from 2.83 to 2.99 during that same period.
New first‐time first‐year enrollment
Avg. High School GPA Avg. SAT Score
Fall 2015 Fall 2019 Fall 2015 Fall 2019
Applicants 2.76 2.97 823 932
Admits 2.81 3.12 833 970
Enrolled 2.83 2.99 845 944
STRATEGIC ENROLLMENT MANAGEMENT 2020-2021 April, 2020
Page 3

Lincoln’s enrollment trends have been accompanied by steady increases in applications.
Applications grew by 33% between 2015 and 2019 and admit rates decreased by 8%. The yield
rate however has remained mostly flat at about 18% with the exception of one outlier year.
Lincoln’s yield rate is considerably lower than the national average of 35%.
New transfer student enrollment has also declined over the past 5 years. The transfer number
hit a high of 97 in 2015 but has since declined to 79 in the Fall of 2019. This represented a 23%
decrease.
New student enrollment
Freshmen Transfer
Fall 2015 Fall 2019 Fall 2015 Fall 2019
# of applicants 3318 4429 318 215
Acceptance rate 91% 83% 69% 69%
Yield rate 15% 12% 44% 53%
Total students 458 445 97 79
Implications of Enrollment Trends for Lincoln University‐First‐Time‐Freshman and
Transfer Student Recruitment Strategies:
National trends showing a decline of high school graduates especially African Americans as well
as declines for these populations in the state of Pennsylvania provide guidance for setting
recruitment goals for Lincoln’s main campus, especially in the context of current new‐student
enrollment at Lincoln. Primarily, the data suggests that growth goals should be modest. The era
of ever larger new first‐year classes appears to be on a steady decline, nationally. Additionally,
Lincoln’s internal data shows that the decline has begun and that it has especially affected the
proportions of male students. The data is also suggesting that Lincoln is already attracting more
applicants to its pool and that those who choose to enroll are among the best prepared. Yet
yield remains a struggle. Finally, while In‐State enrollment has increased, Lincoln remains
attractive to students mostly from the surrounding states.
Taken together, the review suggests that recruitment goals over the next decade should focus
on small incremental increases in new‐first‐time students and transfer students. For these
reasons, the following recruitment goal and objectives have been established:
GOAL: Incremental increases in the number and mix of entering students on main campus
from targeted populations (freshman, males, transfers, and international) ultimately reaching
a main‐campus new student population of 750 (600 new first‐time and 150 transfer students)
by 2030 while also improving selectivity.
STRATEGIC ENROLLMENT MANAGEMENT 2020-2021 April, 2020
Page 4

Objective 1: Execute a marketing campaign built on market research and a brand platform to
demonstrate Lincoln’s Strength to the public and prospective students.
Objective 2: Improve overall service to Lincoln University prospective students and families
that are serving as barriers to student success.
Objective 3: Increase the number of freshmen enrolled from out‐of‐state markets.
Objective 4: Increase the selectivity of freshmen enrolled for international and domestic
admission.
Objective 5: Increase completed transfer applications by 10%.
Objective 6: Increase new transfer student enrollment from domestic markets.
Objective 7: Increase the number of new international students enrolled.
Objective 8: Increase the number of freshmen male students enrolled.
Objective 9: Reduce unmet student financial need.
Objective 10: Move to Test Optional Admissions and Increased GPA Requirement
RETENTION‐ Undergraduate Population
Overall undergraduate enrollment trends at Lincoln showed an overall increase between 2014
and 2019. Enrollment grew from 1,589 in 2014 to 2,122 in 2018. Enrollment dropped 4% in
2019, following the enrollment decline witnessed across the country. During the period of
growth, the percentage of male undergraduates fell from 42% to 34% increasing the gender gap
among the student body. In‐State students grew from 44% in 2011 to 48% in 2018.
International student also increased from 2% to 3% of the entire student body.
Undergraduate Enrollment
Fall 2011 Fall 2014 Fall 2018 Fall 2019
Total 1749 1589 2122 2040
Female 58% 61% 66% 66%
Male 42% 39% 34% 34%
In‐state 44% 43% 48% 48%
Out‐of‐state 54% 52% 49% 49%
International 2% 5% 3% 3%
The one‐year retention rate increased by 10% from the Fall 2016 cohort to the Fall 2017 cohort
a change from 68% to 78%. That number dropped to 71% for the Fall 2018 cohort. Much of
STRATEGIC ENROLLMENT MANAGEMENT 2020-2021 April, 2020
Page 5

the change was due to a smaller entering class. The two‐year retention rate has increased from
61% to 65% comparing the cohorts entering in 2014 to those in 2017. Lincoln’s average first
year retention rate falls somewhere in the middle when compared to competitor and
comparable schools but at the bottom when compared to more aspirational institutions.
LU Retention rate by entering Fall cohort
Fall 2014 Fall 2015 Fall 2016 Fall 2017 Fall 2018
One‐year 77.4% 72.6% 68.1% 78.3% 71.3%
Two‐year 61.1% 62.5% 57.8% 65.2%
Peer institutions average one‐year retention rates
5‐year average: Fall entering cohorts 2013‐2017
Lincoln University Competitor Comparable Aspirational
73.2% 77.3% 73.5% 88.8%
92.8 89.6 87.2 86.879.2 77.6 77 74.2 73.6 73.2 73.2 72 71.8 70 68.8 66
0
10
20
30
40
50
60
70
80
90
100
5‐year average one‐year retention rate: Competitors
STRATEGIC ENROLLMENT MANAGEMENT 2020-2021 April, 2020
Page 6
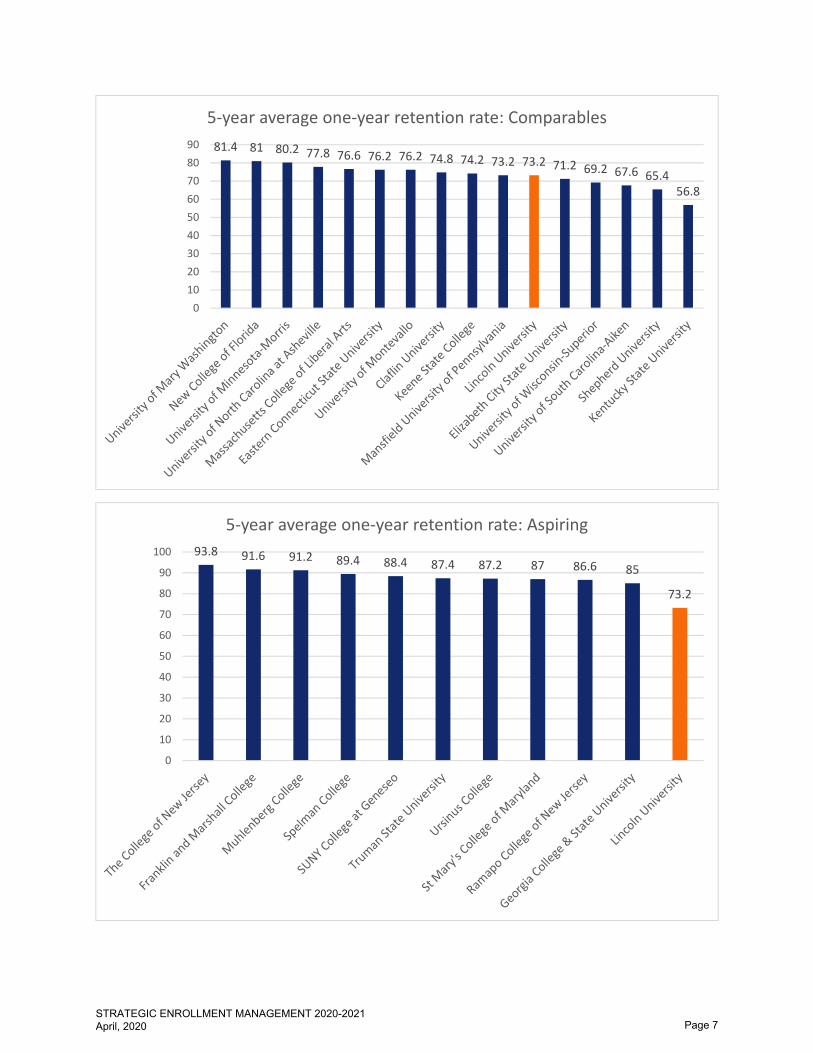
81.4 81 80.2 77.8 76.6 76.2 76.2 74.8 74.2 73.2 73.2 71.2 69.2 67.6 65.456.8
0
10
20
30
40
50
60
70
80
90
5‐year average one‐year retention rate: Comparables
93.8 91.6 91.2 89.4 88.4 87.4 87.2 87 86.6 85
73.2
0
10
20
30
40
50
60
70
80
90
100
5‐year average one‐year retention rate: Aspiring
STRATEGIC ENROLLMENT MANAGEMENT 2020-2021 April, 2020
Page 7

Transfer out data shows a decrease from 9% to 7% between Fall 2013 and Fall 2018. Forty‐five
percent of students who do not return, transfer out and typically end up attending another
university usually community college or an institution in their home state. Most of the students
who transfer out do so after freshman year. Most of the students who transfer from Lincoln,
leave in good academic standing.
Transfer out student analysis*
Fall 2013 Fall 2014 Fall 2015 Fall 2016 Fall 2017
Total # of students 146 123 162 197 136
% Freshman 71% 63% 61% 76% 71%
% in good academic standing 64% 71% 72% 71% 74%
*Students who were enrolled in Fall term but enrolled elsewhere the following year
Top transfer‐out institutions
Fall 2013 Fall 2014 Fall 2015 Fall 2016 Fall 2017 5‐year total
Comm. Coll. Of Philadelphia (PA) 16 10 19 25 15 85
Delaware County Comm. Coll. (PA) 9 8 6 9 5 37
Delaware State University (DE) 4 7 11
Temple University (PA) 4 4 8
Prince Georges Comm. Coll. (MD) 8 8
Wilmington University (DE) 7 7
Comm. Coll. of Allegheny County (PA) 5 5
Bowie State University (MD) 5 5
Fourteen of the undergraduate programs have an average time to degree of 4+ years for those
who completed between Summer 2016 and Spring 2018. Eight programs have an average time
to degree greater than 2 years for Transfer students who completed between Summer 2016
and Spring 2018.
STRATEGIC ENROLLMENT MANAGEMENT 2020-2021 April, 2020
Page 8
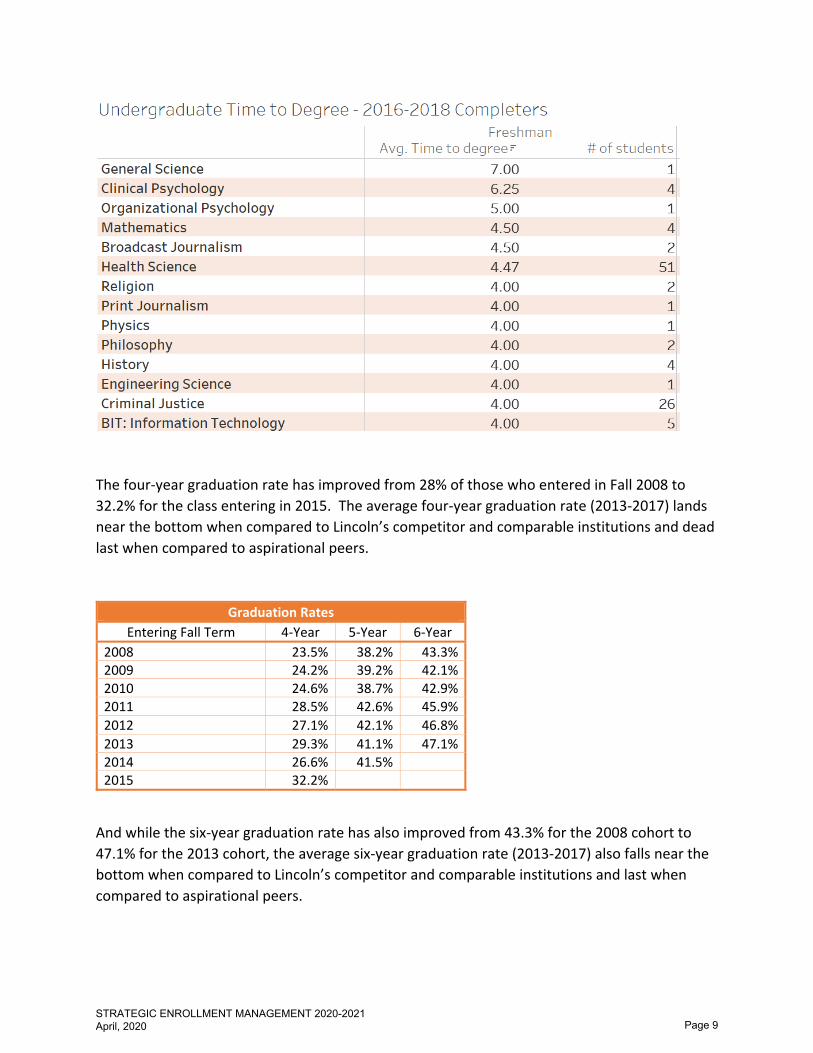
The four‐year graduation rate has improved from 28% of those who entered in Fall 2008 to
32.2% for the class entering in 2015. The average four‐year graduation rate (2013‐2017) lands
near the bottom when compared to Lincoln’s competitor and comparable institutions and dead
last when compared to aspirational peers.
Graduation Rates
Entering Fall Term 4‐Year 5‐Year 6‐Year
2008 23.5% 38.2% 43.3% 2009 24.2% 39.2% 42.1% 2010 24.6% 38.7% 42.9% 2011 28.5% 42.6% 45.9%
2012 27.1% 42.1% 46.8%
2013 29.3% 41.1% 47.1% 2014 26.6% 41.5% 2015 32.2%
And while the six‐year graduation rate has also improved from 43.3% for the 2008 cohort to
47.1% for the 2013 cohort, the average six‐year graduation rate (2013‐2017) also falls near the
bottom when compared to Lincoln’s competitor and comparable institutions and last when
compared to aspirational peers.
STRATEGIC ENROLLMENT MANAGEMENT 2020-2021 April, 2020
Page 9

86
68.8 6862.8 61.4 58.4 56.8 56.6
52.244.4 43.8
40.2 39.6 3834.6
30.6
0
10
20
30
40
50
60
70
80
90
100
Average 6‐year graduation rate 2013‐2017: Competitors
72.868.6
63 61.4 60
53 52.2 51.244.8 43 41.6 41.4 40.6 40.2 38.6
19
0
10
20
30
40
50
60
70
80
Average 6‐year graduation rate 2013‐2017: Comparable
STRATEGIC ENROLLMENT MANAGEMENT 2020-2021 April, 2020
Page 10

The proportion of students attending Lincoln University who come from families making
$40,000 or less has grown to nearly half of the student body over the past five years. Almost
two‐thirds of our undergraduate students have a family income less than $60,000. Sixty‐five
percent of all Lincoln students are Pell recipients and almost 90% receive some form of
scholarship or grant. Many, over 80% rely on Federal Loans to assist with the cost of
attendance. For most, the current combination of scholarships, grants and loans still leaves a
financial gap between the total aid package and full cost of attendance. The average financial
gap for an In‐State Pell eligible student is about $3000. For Out‐of‐State Pell recipients, the gap
increases to about $8000. Even more concerning is that for Non‐Pell eligible students the In‐
State gap increases to $9000 and for those Out‐of‐State the average gap is about $13,000.
Some of the gap can be closed through the Parent Plus Loan, but given the socio‐economic level
of most students, the loan application is usually denied.
2014‐15 2015‐16 2016‐17 2017‐18 2018‐19
Scholarships or Grants recipients 87% 88% 89% 91% 86%
Pell Grants recipients 63% 63% 65% 65% 65%
Federal Student Loans recipients 86% 87% 87% 81% 83%
86 86 85.879.8 79.6 78.2
73.6 72.6 72
58.8
40.2
0
10
20
30
40
50
60
70
80
90
100
Average 6‐year graduation rate 2013‐2017: Aspiring
STRATEGIC ENROLLMENT MANAGEMENT 2020-2021 April, 2020
Page 11

Household Income
2014‐15 2015‐16 2016‐17 2017‐18 2018‐19
Less than $60,000 62% 67% 66% 69% 64%
Less than $50,000 49% 59% 59% 61% 56%
Less than $40,000 38% 47% 47% 49% 44%
Less than $30,000 28% 33% 32% 34% 30%
Moreover, denied Parent Plus Loans allows an additional $4000 in loan towards the financial
gap, but in many cases this is insufficient for moving students to a zero balance. When we
juxtaposition financial data with data on the transfer out rate, it is not surprising that students
in good academic standing choose to leave Lincoln to attend less expensive community colleges
or more cost efficient colleges in their home state.
Implications of Retention Trends for Persistence, Retention, and Completion
Strategies
Our internal data analysis suggests that overall improvements in enrollment are partly due to
increases in retention over the past few years. Moreover, the data reveals that the four‐year
and 6‐year graduation rates are improving. While this is great news, when compared to both
competitor and comparable institutions, Lincoln’s retention and graduation rates are among
the bottom. Most noticeable is that when these indicators are compared to aspirational peers,
Lincoln falls way short. Further, the data reveals that while retention is improving, many
students who transfer out tend to continue their education at a less costly institution. Taken
together, this data suggests that undergraduate enrollment growth from 2040 in 2019 to 2250
by 2030 (9%) at Lincoln can occur by placing a priority on retaining and graduating students in a
timely fashion paying close attention to closing the gap between the financial aid awarded and
the total cost of attendance. Accordingly, the SEM Plan sets the following goals and objectives:
GOAL: By 2030 improve retention rates so that Lincoln University ranks first among
comparable institutions; within the top three among competitor institutions; and within the
top five among aspirational peers while growing total enrollment by 9% to 2250.
Objective 1: Develop Wrap Around services for students (using Athletics as a model)
Objective 2: Design and implement a robust withdrawal prevention program to intervene
before students withdraw.
Objective 3: Create Freshmen Interest Groups or Cohorts
STRATEGIC ENROLLMENT MANAGEMENT 2020-2021 April, 2020
Page 12

Objective 4: Ensure that all students participate in high impact learning opportunities—
internships, service learning, co‐op, alternative winter or spring breaks, international
experiences and career development
Objective 5: Forever Lions—alumni serve as mentors and create meaningful relationships with
students during their freshmen year with hopes it continues beyond graduation
Objective 6: Enhance campus life and living‐learning programming in residence halls
Objective 7: Increase number of beds and renovate existing residence halls to enhance
student engagement and create living‐learning environment
GOAL: By 2030 improve average four‐year graduation rate so that Lincoln University is first
among comparable institutions; within the top three among competitor institutions; and
within the top five among aspirational peers.
Objective 1: Review and re‐design instructional programs to ensure curriculum coherence and
achieve the mission.
Objective 2: Reduce time and credit hours to degree completion
Objective 3: Build a robust academic advising center and program model which supports
student success
Objective 4: Identify and eliminate administrative barriers to student success
GOAL: Decrease the financial gap between financial aid awarded and total cost of attendance
so that the average gap for Pell eligible students is less than $2000 annually and the average
gap for non‐Pell eligible students is $6000 annually.
Objective 1: Redesign merit scholarship formula towards saving more dollars for need‐based
grants
Objective 2: Apply donor dollars where applicable to merit scholars towards releasing more
institutional funds to be applied to need‐based grants.
Objective 3: Increase student employment towards helping students pay a portion of their
debt.
Objective 4: Redesign financial aid award letters towards offering families a better
understanding of how scholarship, grants, loans and student employment can combine to
reduce the expected contribution from parents and how payment plans can be used to better
manage paying down balances.
STRATEGIC ENROLLMENT MANAGEMENT 2020-2021 April, 2020
Page 13

Objective 5: Increase fundraising efforts towards building a robust need‐based scholarship
fund and annual unrestricted dollars.
School for Adult and Continuing Education (SACE) Goals
Enrollment Trends in Adult and Continuing Education:
National data shows that between 2015 and 2026, enrollment is projected to increase 11% for
adult learners between the ages of 25 and 34, and increase 4% for students aged 35+.
Source: National Center for Education Statistics
Graduate enrollment at SACE, however, decreased by 48% between 2011 and 2018. This was
mostly due to the elimination of the Masters in Human Services program, which offered
Masters degree opportunities for individuals without an undergraduate degree, yet several
other programs show steady declines as well.
Graduate Enrollment
Master's Program Fall 2015 Fall 2016 Fall 2017 Fall 2018 Fall 2019
Total graduate enrollment 208 268 264 254 201
Human Services 45 73 74 78 68
Early Childhood Ed. 70 30 25 28 36
Business Administration 50 57 43 43 35
Educational Leadership 27 21 28 31 26
Early Childhood Ed & Special Ed. 37 43 31 15
Counseling 12 30 30 28 14
Non‐matriculating 4 12 16 7 5
Education ‐ conditional 8 5 8 2
9262
3481 3036
11625
46953446
13592
52113594
0
2000
4000
6000
8000
10000
12000
14000
16000
18 to 24 25 to 34 35 years and older
Enrollm
ent (in thousands)
Age group
Actual and projected # for enrollment in all degree‐granting postsecondary institutions, by age group: Fall 2001, Fall 2015, and
Fall 2026
2001 (actual) 2015 (actual) 2026 (projected)
STRATEGIC ENROLLMENT MANAGEMENT 2020-2021 April, 2020
Page 14
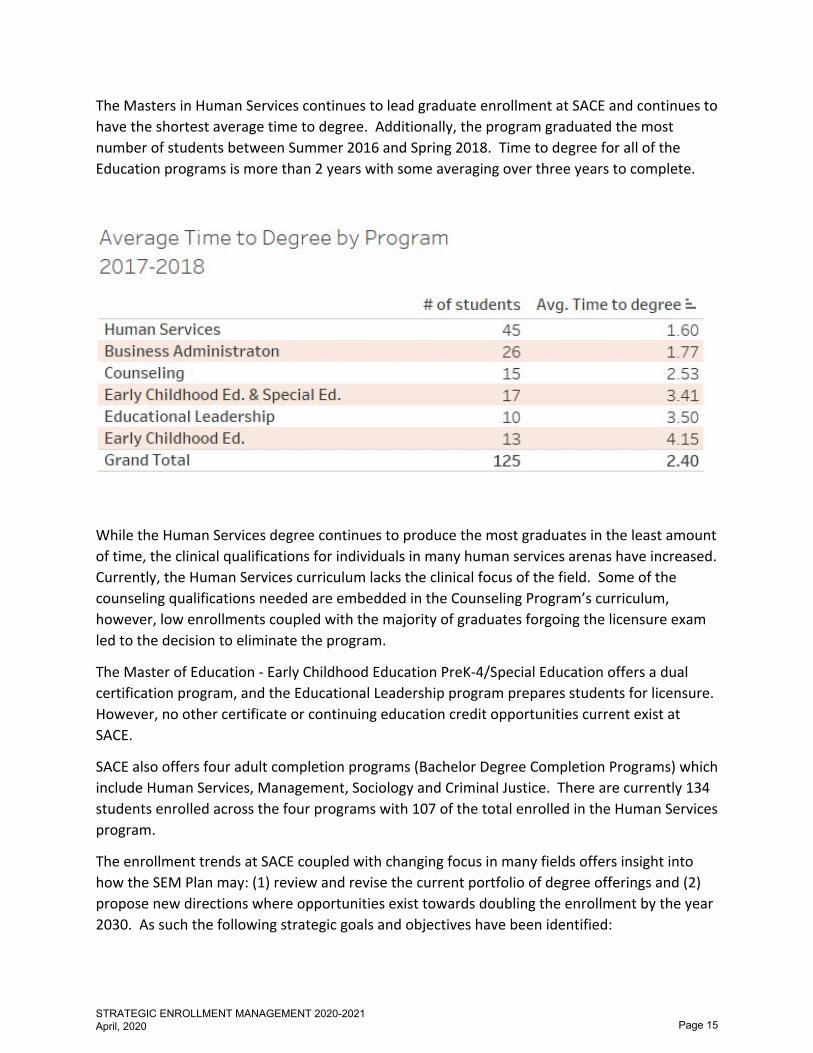
The Masters in Human Services continues to lead graduate enrollment at SACE and continues to
have the shortest average time to degree. Additionally, the program graduated the most
number of students between Summer 2016 and Spring 2018. Time to degree for all of the
Education programs is more than 2 years with some averaging over three years to complete.
While the Human Services degree continues to produce the most graduates in the least amount
of time, the clinical qualifications for individuals in many human services arenas have increased.
Currently, the Human Services curriculum lacks the clinical focus of the field. Some of the
counseling qualifications needed are embedded in the Counseling Program’s curriculum,
however, low enrollments coupled with the majority of graduates forgoing the licensure exam
led to the decision to eliminate the program.
The Master of Education ‐ Early Childhood Education PreK‐4/Special Education offers a dual
certification program, and the Educational Leadership program prepares students for licensure.
However, no other certificate or continuing education credit opportunities current exist at
SACE.
SACE also offers four adult completion programs (Bachelor Degree Completion Programs) which
include Human Services, Management, Sociology and Criminal Justice. There are currently 134
students enrolled across the four programs with 107 of the total enrolled in the Human Services
program.
The enrollment trends at SACE coupled with changing focus in many fields offers insight into
how the SEM Plan may: (1) review and revise the current portfolio of degree offerings and (2)
propose new directions where opportunities exist towards doubling the enrollment by the year
2030. As such the following strategic goals and objectives have been identified:
STRATEGIC ENROLLMENT MANAGEMENT 2020-2021 April, 2020
Page 15

GOAL: Identify the Adult Completion and Graduate Degree Programs most consistent with
University strengths and legacy.
Objective 1: Review and eliminate programs that are not supporting the mission of SACE.
Objective 2: Explore the conversion of the Masters in Human Services to a Masters of Social
Work
Objective 3: Explore a Liberal Arts Adult Completion Degree
Objective 4: Review and revise all Education degree curricula towards reducing time to degree
GOAL: SACE will increase and achieve optimal enrollment in its degree granting programs
through the following goals, objectives and strategies.
Objective 1: Increase the number of new students enrolled in existing SACE programs.
Objective 2: Develop an administrative structure that clearly supports enrollment
(recruitment) versus academic affairs versus student services (retention)
Objective 3: Enhance Student Admissions through implementing a one‐stop services to promote
student satisfaction; implementing and utilizing CRM System to develop enrollment funnel and
increasing the number and quality of applicants for each program
GOAL: Increase enrollment portfolio through micro‐credentialing programs and on‐line
course and program options
Objective 1: Develop micro‐credential options to extend SACE offering
Objective 2: Develop continuing education areas to support new enrollment at SACE
Objective 3: Create a portfolio of on‐line offerings both courses and programs to support new
SACE Enrollment
STRATEGIC ENROLLMENT MANAGEMENT 2020-2021 April, 2020
Page 16
SEM PLAN COUNCIL MEMBERS
STRATEGIC ENROLLMENT MANAGEMENT EXECUTIVE STEERING Committee
Dr. Brenda A. Allen, President
Ms. Diane Brown, Chief of Staff
Dr. Dorcas Colvin, Interim Senior Advisor to the President
Reverend Dr. Frederick Faison, Associate Dean of the College and Dean of Students
Mr. Charles Gradowski, Vice President for Finance and Administration
Dr. Patricia Joseph, Dean of Faculty
Dr. Lenetta Lee, Vice President for Student Success & Dean of the College
Mr. Justin McKenzie, Chief Information Officer
Ms. Evelyn Poe, Associate Vice President for Academic Support
Dr. Patricia Ramsey, Provost and Vice President for Academic Affairs
Mr. Harry Stinson, Director of Athletics and Recreational Services
Dr. Kimberly Taylor‐Benns, Associate Provost for Enrollment Management
Mr. Marc Partee, Director of Public Safety
Dr. Mellissia Zanjani, Vice President for Institutional Advancement
Mr. Jake Tanksley, Vice President for Human Resources
DATA AND RESEARCH TEAM
Ms. Tiffany Lee, Assistant Provost, Institutional Effectiveness, Research, and Planning (Chair)
Mr. Turan Gonul, Assistant Director, Institutional Effectiveness, Research, and Planning
Ms. Martha Spencer, Programmer and Analyst, Information Technology
Ms. Delia VanSant, Program Assistant
Dr. Melina McConatha, Assistant Professor, Psychology & Human Services
Ms. Natalya Coote, Student Research Assistant, Institutional Effectiveness, Research, and
Planning
Ms. Dunsin Fadojutimi, Student Research Assistant, Institutional Effectiveness, Research, and
Planning
STRATEGIC ENROLLMENT MANAGEMENT 2020-2021 April, 2020
Page 17

MARKETING AND RECRUITMENT TEAM
Ms. Nikoia Forde, Director, Undergraduate Admissions, (Chair)
Ms. Damaris Colon, Manager, Information Technology
Ms. Shelley Mix, Director, Marketing and Communication
Ms. Kisha Middleton, Assistant Director, Athletics
Ms. Dafina Diabate, Director, International Programs & Services
Ms. Kim Anderson, Director, Financial Aid
Ms. Taneen Legree, Assistant Bursar
Ms. Natasha Faison, Director, Office of Community Service and Engagement
Mr. Tamarkius Roby, Coordinator, Veteran Affairs
Ms. Laura King, Program Assistant, Office of the Dean
Professor Gaither‐Hardy, Psychology
Professor Brandi Berry, Mass Communication
Dr. Aqueel Dix, Health Sciences
Dr. Chasity Brown, Health Sciences
Dr. Claude Tameze, Mathematical Sciences
Mr. Christian Robinson (junior)
Ms. Mariah Stanton (sophomore)
Ms. Kinoia Fredericksen (senior)
Ms. Anya Westcott (sophomore)
PERSISTENCE, RETENTION AND COMPLETION TEAM
Dr. Marlayne Manley, Second Year, Transitional Class Dean (Chair)
Ms. Nancy Smith, Director of Assessment, Institutional Effectiveness, Research, and Planning
Mr. Fred‐Rick Roundtree, Assistant Provost and Director Center for Teaching and Learning
Ms. Evelyn Poe, Associate Vice President for Academic Support
Ms. Crystal Faison, Director of Internships
STRATEGIC ENROLLMENT MANAGEMENT 2020-2021 April, 2020
Page 18

Ms. Leonie Walters, First Year Class Dean
Mr. Gerard Garlic, Director, Office of Institutional Equity
Dr. Maripua Deas, Upper Class Dean
Ms. Danielle Smithson, Financial Aid Counselor
Ms. Nancy Evans, Director, Academic Technology Support
Mr. Brian Dubenion, Executive Director of Student & Residence Life
Ms. Carla Sarratt, Director, Langston Hughes Memorial Library
Dr. Nicole Files‐Thompson, Mass Communications
Professor Courtney Haywood, Mass Communications
Dr. Andriy Semychayevskyy, Chemistry and Physics
Ms. Kayla Wallington (sophomore)
Mr. Jalen Scott Davis (sophomore)
SCHOOL OF ADULT AND CONTINUING EDUCATION TEAM
Ms. Jernice Lea, Director, Student Services & Admissions
Ms. Morgan Shaw, Associate Director of Admissions
Dr. Oswald Richards, Business and Entrepreneurial Studies
Dr. Ihedjrika , Chair, Business and Entrepreneurial Studies
Dr. Virginia Smith, Dr. Virginia Smith, Professor, School of Adult & Continuing Education
Dr. Teresa Powell, Languages & Literature
Dr. James Wadley, Counseling & Human Services
STRATEGIC ENROLLMENT MANAGEMENT 2020-2021 April, 2020
Page 19


