
2019
Strategic and Financial Analysis. Financial Division
Institutional Presentation

Index
Our business model1
2
3
4
5
Group structure and businesses
2019 results and activity
Our three-pillar plan and medium-term goals
Grupo Santander financial information

Our business model1.

Santander, a leading financial group
People Customers
Communities Shareholders
... resulting in higher investment in the community …
... which drives profitability and sustainable growth ...
… more motivated and engaged employees ...
... make our customers more satisfied and loyal ...
Total assets (EUR billion) 1,523
Customer loans (EUR billion excluding reverse repos) 919
Customer deposits + mutual funds (EUR billion excluding repos) 966
Branches 11,952
2019 Attributable profit (EUR million) 6,515
2019 Underlying attributable profit (EUR million) 8,252
Market capitalisation (EUR billion; 31-12-19) 62
People (headcount) 196,419
Customers (millions) 145
Shareholders (millions) 4.0
Communities (million people financially empowered) 2.0
2019 Highlights
Our strategy is built around a virtuous circle based on loyalty
Simple Personal Fair

5
OUR PURPOSE
OUR AIM AS A BANK
OUR HOW
To help people and businesses prosper
To be the best open financial services platform, by acting responsibly and earning the lasting loyalty of our people, customers, shareholders and communities
Simple Personal Fair
We continue to do business in a more responsible and sustainable way
Everything we do should be
The Santander Way
6
SCALE
CUSTOMER FOCUS
DIVERSIFICATION
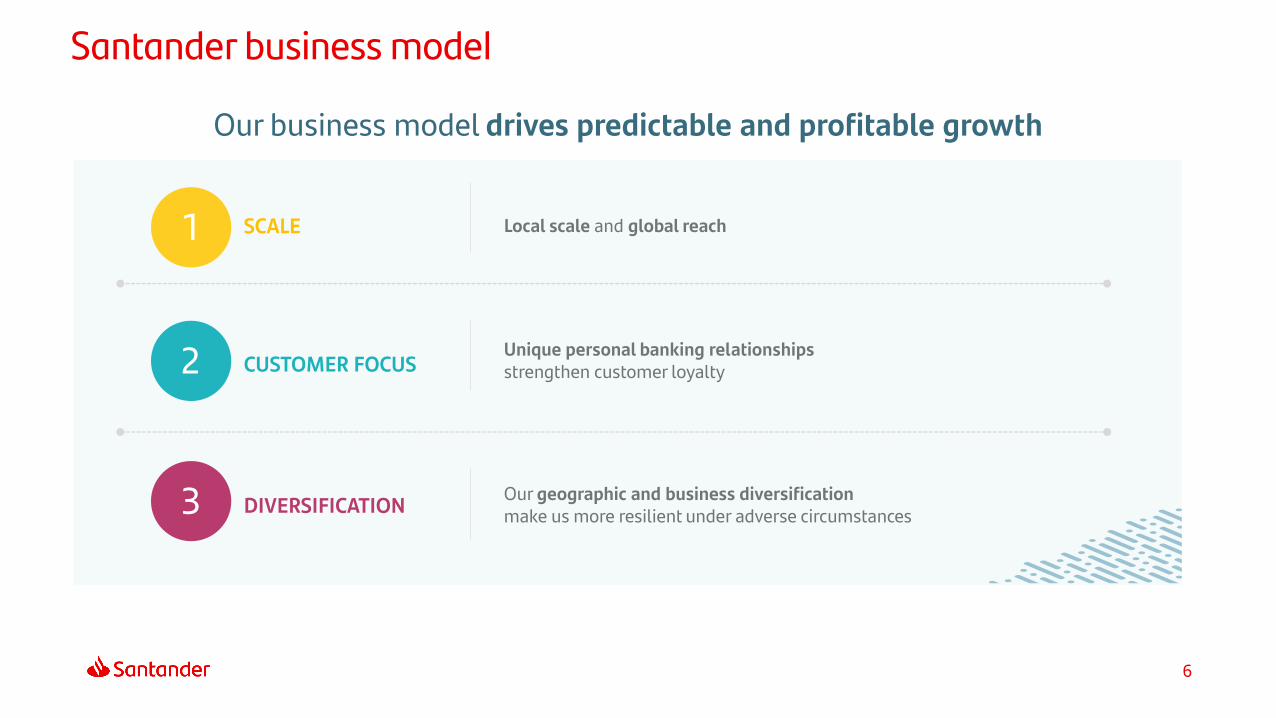
Local scale and global reach
Unique personal banking relationships strengthen customer loyalty
Our business model drives predictable and profitable growth
Santander business model
1
2
3 Our geographic and business diversification make us more resilient under adverse circumstances
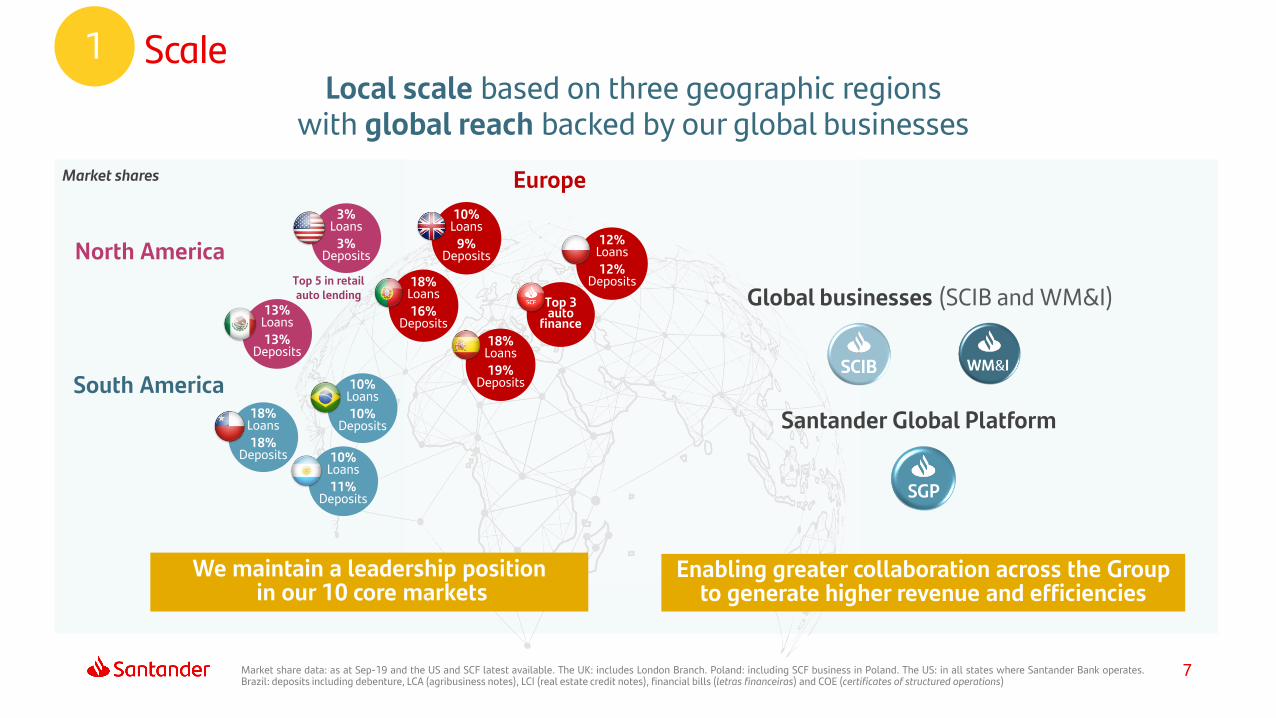
Scale1
Market share data: as at Sep-19 and the US and SCF latest available. The UK: includes London Branch. Poland: including SCF business in Poland. The US: in all states where Santander Bank operates.Brazil: deposits including debenture, LCA (agribusiness notes), LCI (real estate credit notes), financial bills (letras financeiras) and COE (certificates of structured operations)
Local scale based on three geographic regionswith global reach backed by our global businesses
Global businesses (SCIB and WM&I)
Santander Global Platform
We maintain a leadership positionin our 10 core markets
Top 3auto
finance
18%Loans
19%Deposits
18%Loans
16%Deposits
10%Loans
9%Deposits
12%Loans
12%Deposits
Europe
3%Loans
3%Deposits
13%Loans
13%Deposits
Top 5 in retail auto lending
North America
10%Loans
10%Deposits
10%Loans
11%Deposits
18%Loans
18%Deposits
South America
Enabling greater collaboration across the Group to generate higher revenue and efficiencies
Market shares
SGP
7
Spain 10%
SCF 13%
UK 17%
Poland 4%Portugal 2%
US 4%Mexico 13%
Brazil 32%
Chile 2%
Argentina 2%Others 1%
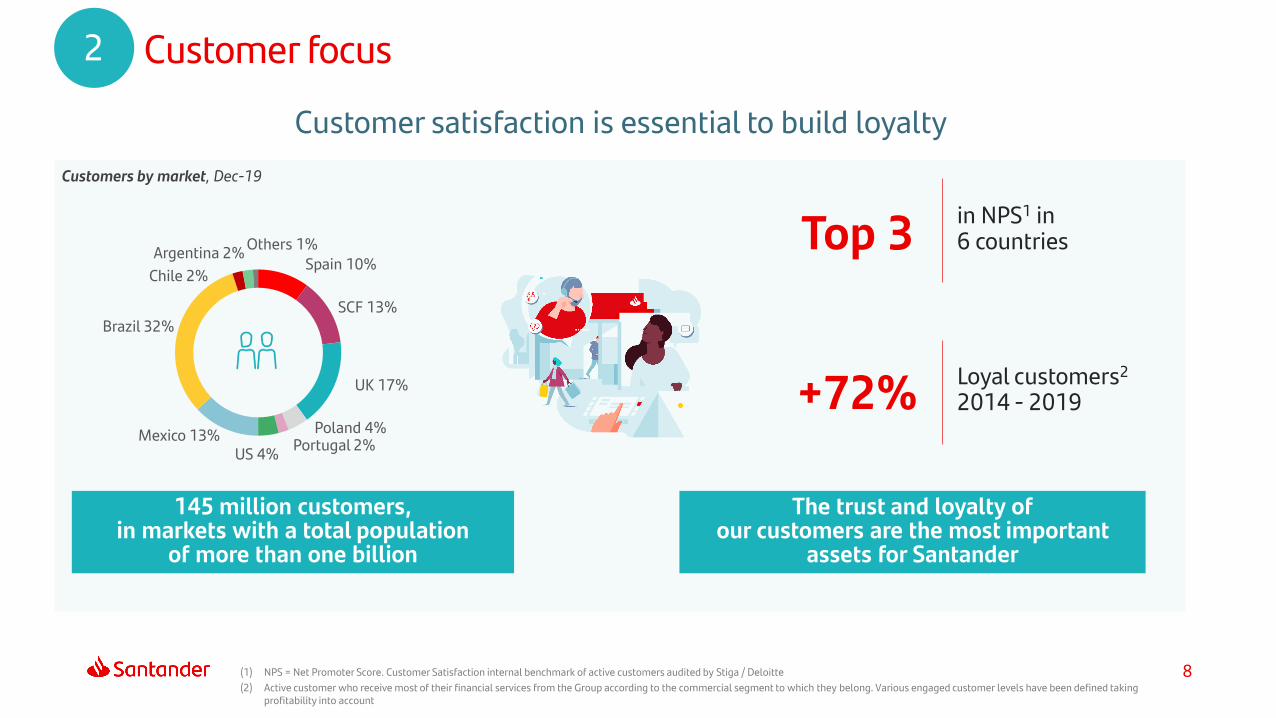
8(1) NPS = Net Promoter Score. Customer Satisfaction internal benchmark of active customers audited by Stiga / Deloitte
(2) Active customer who receive most of their financial services from the Group according to the commercial segment to which they belong. Various engaged customer levels have been defined taking profitability into account
Customer focus2
145 million customers, in markets with a total population
of more than one billion
Customers by market, Dec-19
The trust and loyalty of our customers are the most important
assets for Santander
Top 3in NPS1 in 6 countries
+72%Loyal customers2
2014 - 2019
Customer satisfaction is essential to build loyalty

Unique personal banking relationships with over 100,000 people talking to our customers every day in our branches and other customer support services
9
21.6 mn (+9%)
2 Customer focus
Loyal/activecustomers
31%
Note: data as of Dec-19 and year-on-year changes(1) Excluding Chinese banks and Sberbank of Russia
Individuals
19.8 mn (+9%)
Companies
1,794 (+3%)
Loyal customers Collaborative spaces and increased digital capabilities
Santander Smart and Ágil branches
The largest branch network in the international banking world1
Branches: c.12,000
Available anytime, anywhere, anyhow
Customer support services

10
36.8 mn (+15%)
2 Customer focus
Digital sales2
as % of total sales
36%
Note: data as of Dec-19 and year-on-year changes(1) Every physical or legal person, that, being part of a commercial bank, has logged in its personal area of internet banking or mobile phone or both in the last 30 days(2) Percentage of new contracts executed through digital channels during the period
Accesses to digital touchpoints per
customer per week
5Increase in
mobile sales vs 2018
2x
Digital customers1
Digital customers are engaging and transacting more
Digital technologyboosting financial access
Traditional bankingBranches, ATMs, retail agents, …
Digital bankingInternet, mobiles, tablets,
smartphones and smartwatches…
Guaranteeing access for all segments
Sparsely populated communities
Most vulnerable groups
Low-income communities
University students
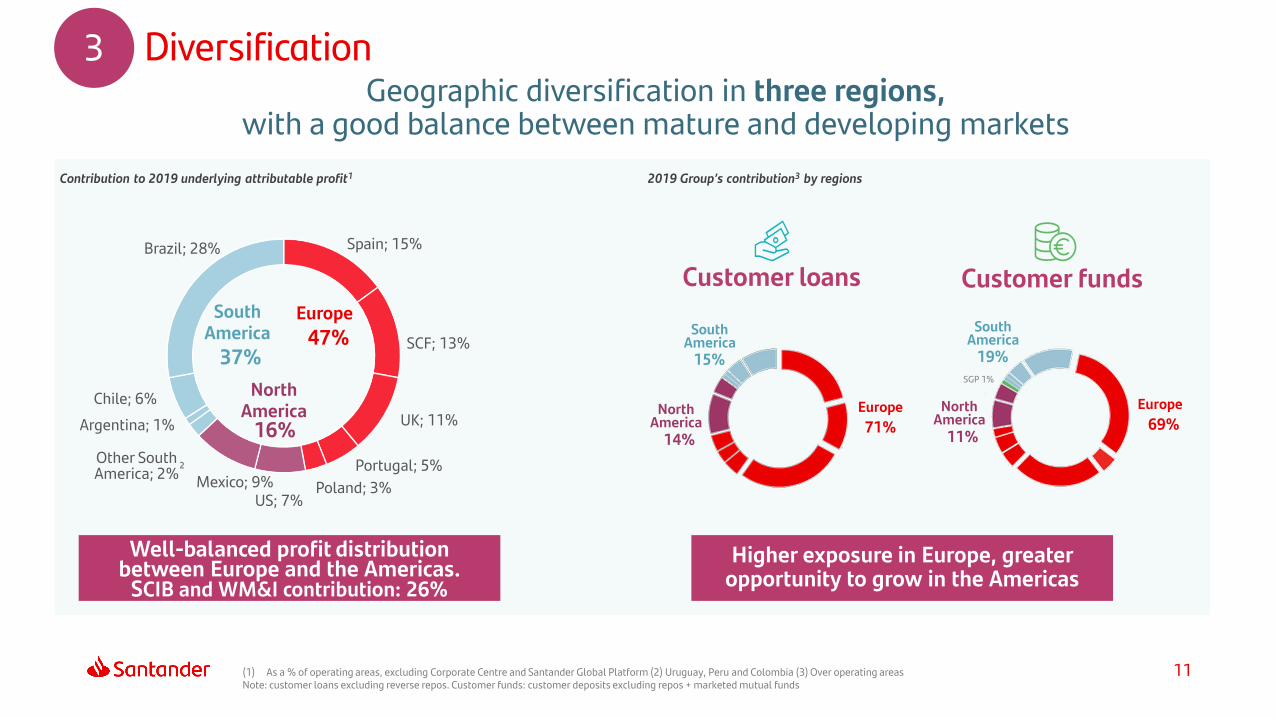
(1) As a % of operating areas, excluding Corporate Centre and Santander Global Platform (2) Uruguay, Peru and Colombia (3) Over operating areasNote: customer loans excluding reverse repos. Customer funds: customer deposits excluding repos + marketed mutual funds
47%37%
16%
EuropeSouth America
North America
2
3 DiversificationGeographic diversification in three regions,
with a good balance between mature and developing markets
Contribution to 2019 underlying attributable profit1
Customer loans Customer funds
Spain; 15%
SCF; 13%
UK; 11%
Portugal; 5%
Poland; 3%US; 7%
Mexico; 9%
Other South America; 2%
Argentina; 1%
Chile; 6%
Brazil; 28%
71%
15%
14%
Europe
South America
North America 69%
19%
11%
Europe
South America
North America
Higher exposure in Europe, greater opportunity to grow in the Americas
Well-balanced profit distribution between Europe and the Americas.
SCIB and WM&I contribution: 26%
2019 Group’s contribution3 by regions
11
SGP 1%

Individuals demand deposits, 38%
Individuals time deposits, 10%
Individuals mutual funds, 14%
Consumer, 4%
SMEs, 10%
Corporates, 14%
SCIB, 10%
Customer funds
Customer funds by business, Dec-19
12
3 Diversification
Business diversification among customer segments (individuals, SMEs, corporates and large corporates)
Note: customer loans excluding reverse repos. Customer funds: customer deposits excluding repos + marketed mutual funds
Other individuals, 10%Home mortgages,
37%
Consumer, 17%SMEs, 11%
Corporates, 13%
SCIB, 12%
Loans
Customer loans by business, Dec-19
13
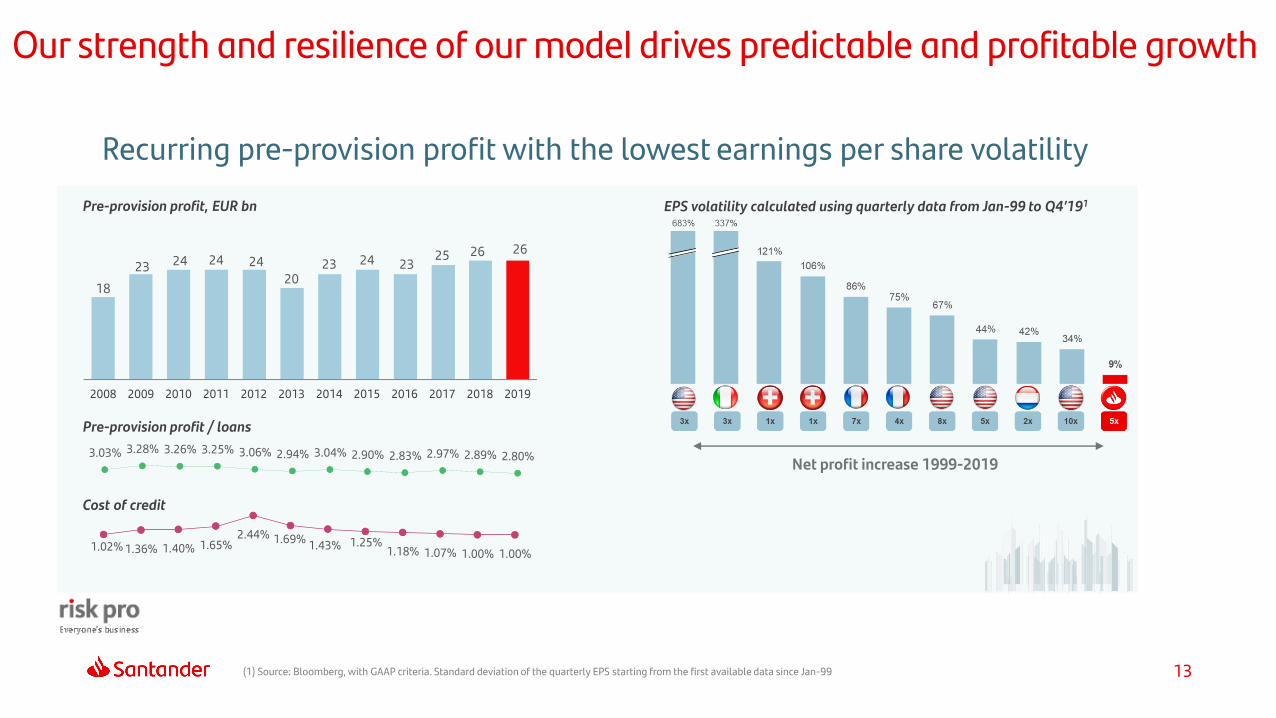
Our strength and resilience of our model drives predictable and profitable growth
Pre-provision profit, EUR bn EPS volatility calculated using quarterly data from Jan-99 to Q4’191
Net profit increase 1999-2019
(1) Source: Bloomberg, with GAAP criteria. Standard deviation of the quarterly EPS starting from the first available data since Jan-99
2008 2009 2010 2011 2012 2013 2014 2015 2016 2017 2018 2019
18
23 24 24 24
2023 24 23
25 26 26
3.03% 3.28% 3.26% 3.25% 3.06% 2.94% 3.04% 2.90% 2.83% 2.97% 2.89% 2.80%
1.02% 1.36% 1.40% 1.65%2.44% 1.69%
1.43% 1.25%1.18% 1.07% 1.00% 1.00%
Cost of credit
Pre-provision profit / loans
Recurring pre-provision profit with the lowest earnings per share volatility

14
Our model as well as successful execution of our strategic priorities, delivered strong profitability, higher generation capacity and shareholder value creation
EPS2 +22%
TNAVps3
Growth
+19%
RoTE +84 bps
RoRWA
Profitability
+34 bps
FL CET1 +EUR 22 bn4
Strength
Total dividend per share
(1) GPS= Growth, Profitability and Strength ; DPS = Dividend per share(2) In constant euros; Adjusting for share count increase coming from scrip dividends; (3) Adjusting for share count increase coming from scrip dividends (4) FL CET1 (EUR mn) accumulated since 2014; Including January 2015 ABB (EUR 7.5 bn) (5) EUR 0.20 cash dividend in 2019 compared to EUR 0.086 in 2014 (coming from the cash take-up of the 2014 EUR 0.60 scrip dividend) –Board intends to propose to the 2020 AGM that the total payment of the remuneration against 2019 results will be EUR 0.23 per share, out of which EUR 0.20 per share will be paid in cash(6) 2019 TNAVps (EUR 4.36) + Cash DPS declared in 2019 (4th 2018 dividend EUR 0.065 and 1st 2019 dividend EUR 0.10)
EUR 0.23 in 2019
Cash dividend per share
c.+3%vs 2018
2.3xvs 2014
EUR 0.20in 2019
TNAV + cash DPS
EUR 4.52 in 2019
+8%vs 20186
GPS1 targets since 2014 Shareholder value creation5
Amongst the largest banks in the Eurozoneby market capitalisation
Santander has paid dividends uninterruptedly the last 80 years

And we continue doing business in a more responsible and sustainable way
Sustainability
Financial inclusionCommunities
Culture
2.0 mnpeople financially empowered
69 kscholarships granted
1.6 mnpeople helped through our community programmes
Women
40% Group Board
23% Group leadership
(+2pp vs. 2018)
EUR 277 mncredit to microentrepreneurs3
(+73% vs. 2018)
EUR 1 bnSantander first green bond issuance
Engagement
86% of employees
proud to work for Santander(+1pp vs 2018)
EUR 19 bnmobilised in Green finance
Dow Jones index2
Leader
15
More information on Group’s Overview of our Corporate Governance presentation. See link to this presentation on page 65 Note: figures as of 2019 and changes on a YoY basis (2019 vs. 2018)(1) Dow Jones Sustainability index 2019(2) Microentrepreneurs are already included in the people financially empowered metric

Group structure and businesses2.
17
Santander Wealth Management & InsuranceRetail Banking
Communication, Corporate
Marketing and Research
UniversitiesComplianceAudit CostsTechnology
and Operations
General Secretariatand Human Resources
Financial Accounting & Control
FinanceStrategy,
Corporate Dev.& Financial Planning
Exec. Chairman´s Office & Responsible
Banking
Santander Global
PlatformSantander
Corporate & Investment Banking
Secondary segments – Global businesses
Group functions and Corporate Centre activities
10 core markets
Risk
Primary segments – Operating areas
North America
South America
Other Europe
Europe
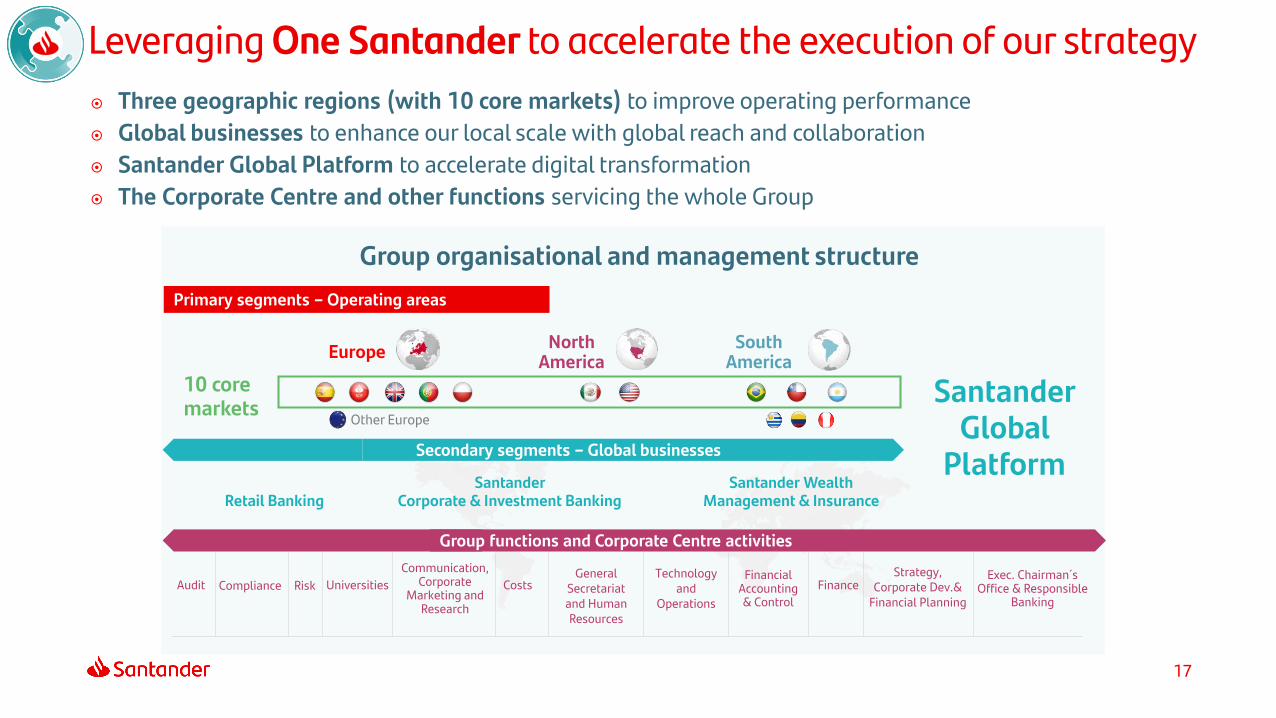
Leveraging One Santander to accelerate the execution of our strategy
Three geographic regions (with 10 core markets) to improve operating performance
Global businesses to enhance our local scale with global reach and collaboration
Santander Global Platform to accelerate digital transformation
The Corporate Centre and other functions servicing the whole Group
Group organisational and management structure

18
North America
South America
Europe
Santander Wealth Management & Insurance
Santander Corporate & Investment
Banking
Santander Global Platform
Group functions and Corporate Centre activities
Three geographic regions(with 10 core markets)

Building one European banking platform, with enhanced profitability
Europe
Simplification of our business model, reducing the number of products to gain efficiency and agility, while maintaining a full value proposition
In a lower for longer interest rate and low growth environment, we are working to simplify our European business model and structure:
Adaptation of our technological platforms and leveraging of our digital transformation to improve customer experience
2019 Highlights
Branches 5,336
Employees 86,574
Loyal customers (mn) 9.9
Digital customers (mn) 13.8
Customer loans (EUR bn) 651
Customer funds (EUR bn) 671
Underlying attributable profit (EUR mn) 4,878
Underlying RoTE 10%
Contribution to Group’s profit 47%
Continued achievement of additional synergies from the integration and transformation processes
Note.- Customer loans: Gross loans excluding reverse repos. Customer funds: customer deposits excluding repos + marketed mutual
Other Europe
Strategic priorities
19

Santander España remains committed to maintaining its leadership. In 2019, we successfully completed the integration of Popular’s branches and customers in Santander
Spain
Continue growing SMEs and corporate segments
Focus on optimising the commercial network. Acceleratethe digital transformation to improve customer experience
2019 Highlights
Develop a sustainable profit and profitability model (optimal capital allocation and focus on profitable segments & products)
Strategic priorities
Note.- Customer loans: Gross loans excluding reverse repos. Customer funds: customer deposits excluding repos + marketed mutual
Branches 3,235
Employees 27,630
Loyal customers (mn) 2.5
Digital customers (mn) 4.7
Customer loans (EUR bn) 191
Customer funds (EUR bn) 309
Underlying attributable profit (EUR mn) 1,585
Underlying RoTE 10%
Contribution to Group’s profit 15%
20
for non-residents
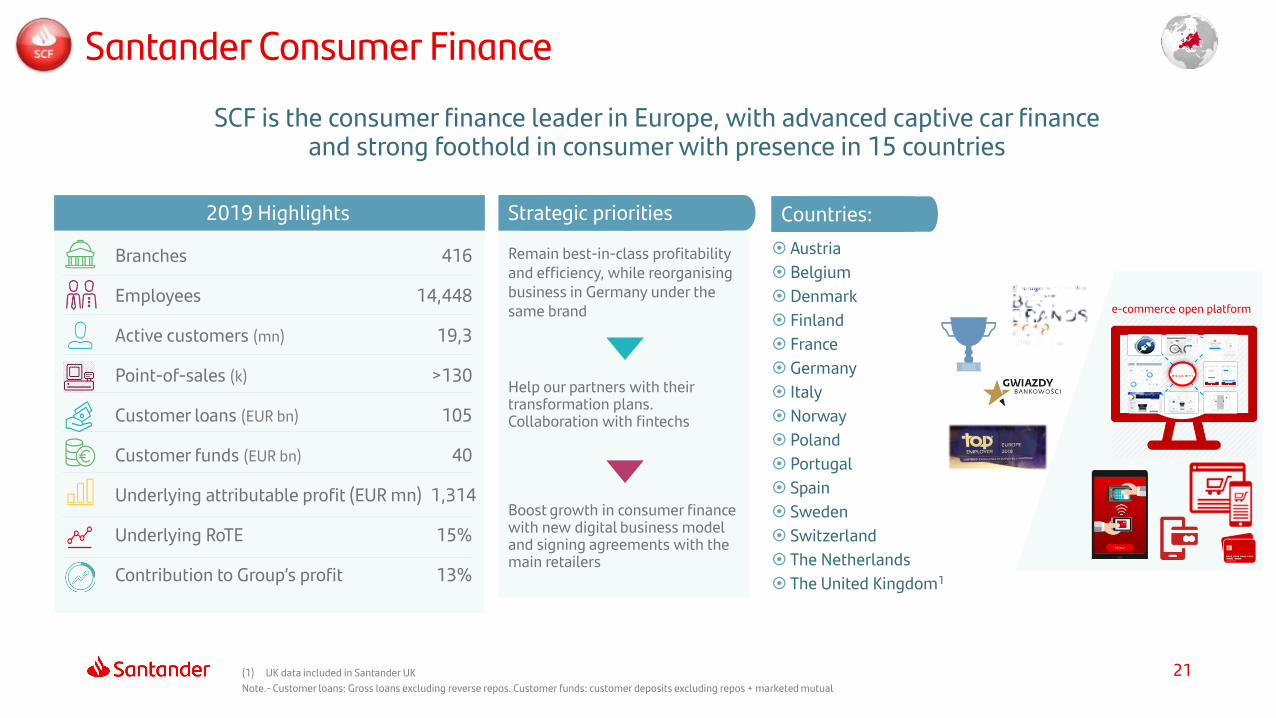
Help our partners with their transformation plans. Collaboration with fintechs
Remain best-in-class profitability and efficiency, while reorganising business in Germany under the same brand
2019 Highlights
SCF is the consumer finance leader in Europe, with advanced captive car finance and strong foothold in consumer with presence in 15 countries
Santander Consumer Finance
Boost growth in consumer finance with new digital business model and signing agreements with the main retailers
Strategic priorities
e-commerce open platform
Austria
Belgium
Denmark
Finland
France
Germany
Italy
Norway
Poland
Portugal
Spain
Sweden
Switzerland
The Netherlands
The United Kingdom1
Countries:
(1) UK data included in Santander UK
Note.- Customer loans: Gross loans excluding reverse repos. Customer funds: customer deposits excluding repos + marketed mutual
Branches 416
Employees 14,448
Active customers (mn) 19,3
Point-of-sales (k) >130
Customer loans (EUR bn) 105
Customer funds (EUR bn) 40
Underlying attributable profit (EUR mn) 1,314
Underlying RoTE 15%
Contribution to Group’s profit 13%
21

Invest in our people and ensure they have the skills and knowledge to thrive
Uniquely placed as the leading UK scale challenger bank with an innovative value proposition for retail customers and small businesses
United Kingdom
Simplify and digitalise the business for improved efficiency and returns
Grow customer loyalty by providing an outstanding customer experience
2019 Highlights
Further embed sustainability across our business
Strategic priorities
Online mortgage
Note.- Customer loans: Gross loans excluding reverse repos. Customer funds: customer deposits excluding repos + marketed mutual
Branches 616
Employees 24,490
Loyal customers (mn) 4.6
Digital customers (mn) 5.8
Customer loans (EUR bn) 249
Customer funds (EUR bn) 219
Underlying attributable profit (EUR mn) 1,077
Underlying RoTE 7%
Contribution to Group’s profit 11%
22

Santander Totta is the largest privately-owned bank in Portugal by assets and loans
Portugal
Improve efficiency and maintain low cost of credit
Progress in our digital transformation and streamlining workflow
2019 Highlights
Continue gaining profitable market share and leveraging our position in the corporate sector, especially in SMEs
Strategic priorities
Note.- Customer loans: Gross loans excluding reverse repos. Customer funds: customer deposits excluding repos + marketed mutual
Branches 542
Employees 6,582
Loyal customers (k) 778
Digital customers (k) 775
Customer loans (EUR bn) 36
Customer funds (EUR bn) 42
Underlying attributable profit (EUR mn) 525
Underlying RoTE 13%
Contribution to Group’s profit 5%
23
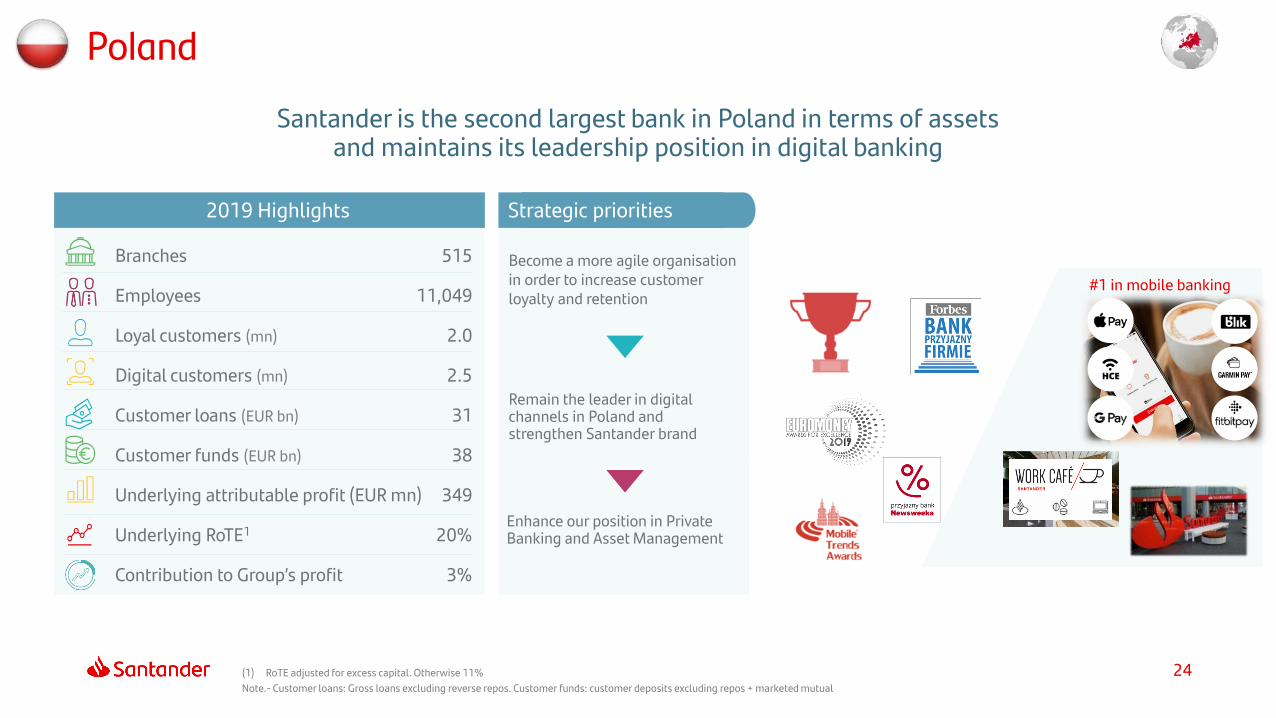
Santander is the second largest bank in Poland in terms of assets and maintains its leadership position in digital banking
Poland
Remain the leader in digital channels in Poland and strengthen Santander brand
Become a more agile organisation in order to increase customer loyalty and retention
2019 Highlights
Enhance our position in Private Banking and Asset Management
Strategic priorities
#1 in mobile banking
(1) RoTE adjusted for excess capital. Otherwise 11%
Note.- Customer loans: Gross loans excluding reverse repos. Customer funds: customer deposits excluding repos + marketed mutual
Branches 515
Employees 11,049
Loyal customers (mn) 2.0
Digital customers (mn) 2.5
Customer loans (EUR bn) 31
Customer funds (EUR bn) 38
Underlying attributable profit (EUR mn) 349
Underlying RoTE1 20%
Contribution to Group’s profit 3%
24
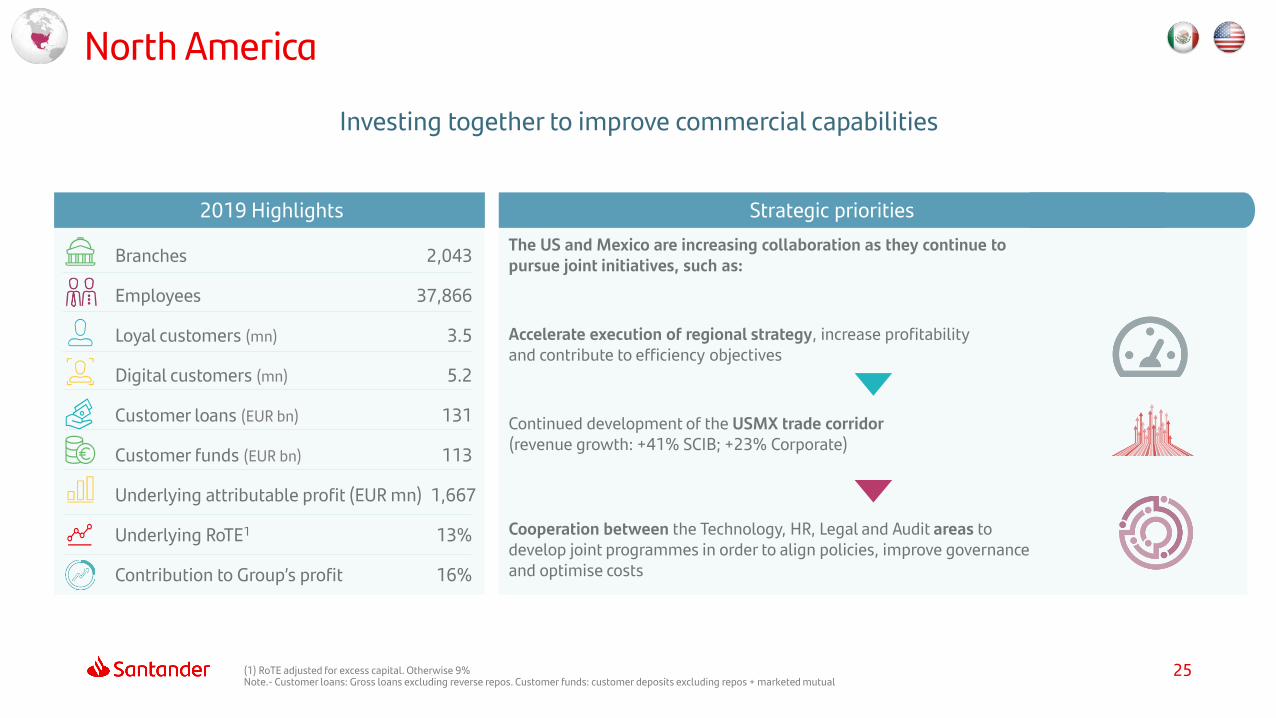
Investing together to improve commercial capabilities
North America
The US and Mexico are increasing collaboration as they continue to pursue joint initiatives, such as:
Accelerate execution of regional strategy, increase profitability and contribute to efficiency objectives
Continued development of the USMX trade corridor (revenue growth: +41% SCIB; +23% Corporate)
Cooperation between the Technology, HR, Legal and Audit areas to develop joint programmes in order to align policies, improve governance and optimise costs
2019 Highlights
(1) RoTE adjusted for excess capital. Otherwise 9%Note.- Customer loans: Gross loans excluding reverse repos. Customer funds: customer deposits excluding repos + marketed mutual
Strategic priorities
Branches 2,043
Employees 37,866
Loyal customers (mn) 3.5
Digital customers (mn) 5.2
Customer loans (EUR bn) 131
Customer funds (EUR bn) 113
Underlying attributable profit (EUR mn) 1,667
Underlying RoTE1 13%
Contribution to Group’s profit 16%
25

Santander US includes a Northeast US regional bank, a nationwide auto finance business, an international private banking operation and a broker-dealer. In 2019, strong growth in volumes and increased profitability
US
(1) RoTE adjusted for excess capital. Otherwise 5%Note.- Customer loans: Gross loans excluding reverse repos. Customer funds: customer deposits excluding repos + marketed mutualOn 21 October 2019, it was announced that Grupo Santander has agreed to sell its retail and commercial banking franchise in Puerto Rico to FirstBank Puerto Rico for approximately USD 1.1 bn.
The sale includes Santander’s 27 bank branches in Puerto Rico and total assets of USD 6.2 billion. The transaction is expected to close in the middle of 2020, subject to regulatory approvals.
Seize collaboration opportunities across our businesses in order to drive value
Improve customer experience in order to drive volume growth
2019 Highlights
Cost management and efficiency improvement and continue resolving legacy regulatory issues
Strategic priorities
Branches 621
Employees 17,372
Loyal customers (k) 332
Digital customers (k) 1,010
Customer loans (EUR bn) 96
Customer funds (EUR bn) 73
Underlying attributable profit (EUR mn) 717
Underlying RoTE1 9%
Contribution to Group’s profit 7%
26

Santander México, a leading financial group in the country, focused on commercial transformation and innovation, with strong digital customer growth
Mexico
Note.- Customer loans: Gross loans excluding reverse repos. Customer funds: customer deposits excluding repos + marketed mutualSantander Group’s stake in Santander México increased to 91.65%
Focus on attracting payrolls, drawing on our strong position in SMEs and Corporates
Continue the retail banking transformation: enhancing our attention model and expand new businesses
2019 Highlights
Enhance customer service quality across the Bank
Strategic priorities
Santander Plus
Select Me
Branches 1,422
Employees 20,494
Loyal customers (mn) 3.2
Digital customers (mn) 4.2
Customer loans (EUR bn) 35
Customer funds (EUR bn) 41
Underlying attributable profit (EUR mn) 950
Underlying RoTE 21%
Contribution to Group’s profit 9%
27

Natural reweighting and high profitable growth opportunity
South America
This region remains a growth engine and aims to generate profitable growth and export positive experiences to other countries in the region with focus on leveraging our products & services with strong expected medium-term growth, such as:
Auto financing using experience from the Group and Brazil to boost growth in other countries (e.g. Colombia has signed two alliances with digital vehicle platforms)Financing goods and services (plan to export Uruguay’s successful model to other regions)
Payments methods (we are one of the largest card issuers & merchant acquirers in the region): exploring e-commerce strategies, instant domestic and international transfers, and the roll-out of Getnet to the rest of Latin America
Further develop the retail franchise: strengthen new channels in the low income segment (Microfinance with Prospera, agribusiness, and digital - e.g. Chilean Life model) and Work Café branches opening in Chile, Brazil and Argentina in the year
2019 Highlights Strategic priorities
Note.- Customer loans: Gross loans excluding reverse repos. Customer funds: customer deposits excluding repos + marketed mutual
Branches 4,572
Employees 69,508
Loyal customers (mn) 7.9
Digital customers (mn) 17.3
Customer loans (EUR bn) 131
Customer funds (EUR bn) 171
Underlying attributable profit (EUR mn) 3,924
Underlying RoTE 21%
Contribution to Group’s profit 37%
28

Maintain operational efficiency
Maximise loyalty, increase opportunities among our business units
Leverage our business in current markets and also expand with new ventures
Santander Brasil has a strong growth strategy, underpinned by a solid and sustainable business model
Brazil
Note.- Customer loans: Gross loans excluding reverse repos. Customer funds: customer deposits excluding repos + marketed mutual
2019 Highlights
SantanderWay
SMEs Agribusiness
Attract new customers while cultivating the existing relationships
Strategic priorities
Branches 3,656
Employees 46,682
Loyal customers (mn) 5.7
Digital customers (mn) 13.5
Customer loans (EUR bn) 80
Customer funds (EUR bn) 122
Underlying attributable profit (EUR mn) 2,939
Underlying RoTE 21%
Contribution to Group’s profit 28%
29

Focus on mass market through Santander Life. Develop the acquiring business and Superdigital
Santander Chile is the country’s leading privately-owned bank by assets and customers
Chile
Note.- Customer loans: Gross loans excluding reverse repos. Customer funds: customer deposits excluding repos + marketed mutual
Improve customer service quality and grow loyal and digital customer base
Accelerate the commercial transformation via the new branch network model and digital banking
2019 Highlights Strategic priorities
Branches 375
Employees 11,580
Loyal customers (k) 704
Digital customers (k) 1,247
Customer loans (EUR bn) 40
Customer funds (EUR bn) 35
Underlying attributable profit (EUR mn) 630
Underlying RoTE 18%
Contribution to Group’s profit 6%
30

Profitable growth increasing revenue with efficient capital allocation and maintained high dollar liquidity ratio
Progressing towards a simple and more efficient model, driven by digital transformation
Customer-centric decisions, helping people and businesses prosper
Santander Argentina is the country's largest privately-owned bank by banking business
Argentina
Note.- Customer loans: Gross loans excluding reverse repos. Customer funds: customer deposits excluding repos + marketed mutual
2019 Highlights Strategic priorities
Branches 438
Employees 9,178
Loyal customers (mn) 1.4
Digital customers (mn) 2.2
Customer loans (EUR bn) 5
Customer funds (EUR bn) 8
Underlying attributable profit (EUR mn) 144
Underlying RoTE 22%
Contribution to Group’s profit 1%
31
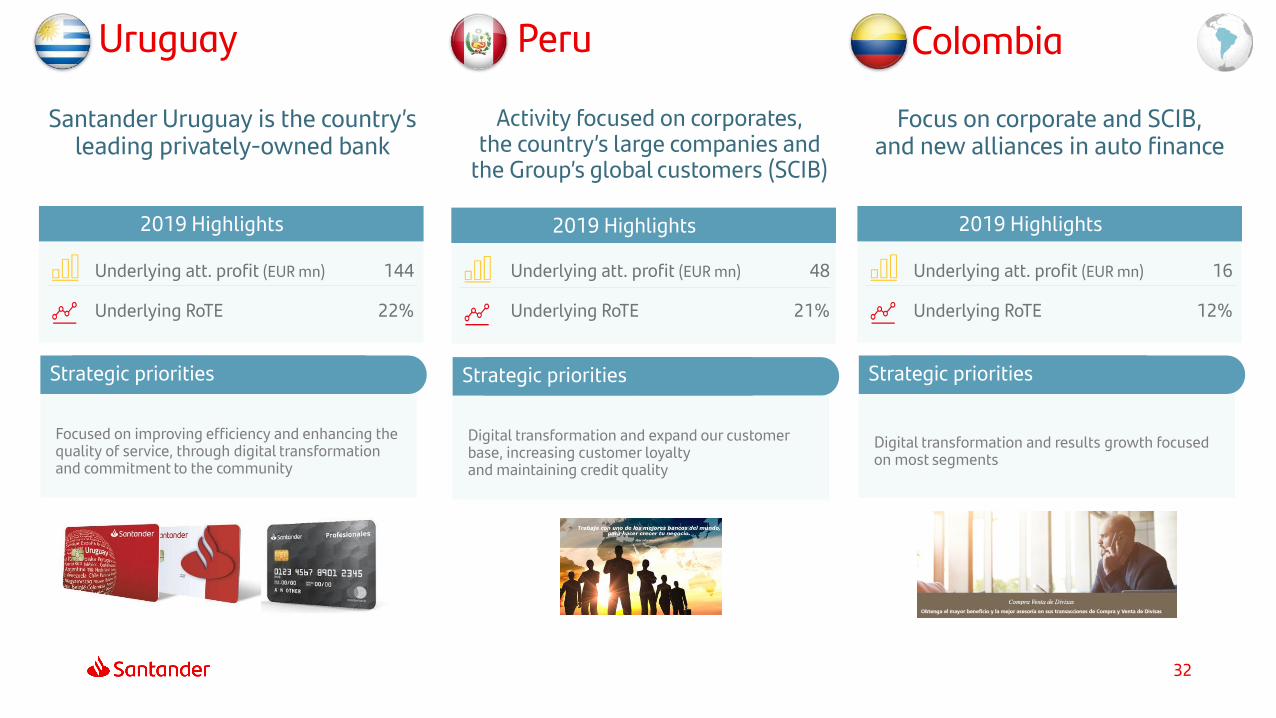
Santander Uruguay is the country’s leading privately-owned bank
Uruguay
32
2019 Highlights
Underlying att. profit (EUR mn) 144
Underlying RoTE 22%
Strategic priorities
Focused on improving efficiency and enhancing the quality of service, through digital transformation and commitment to the community
Activity focused on corporates, the country’s large companies and
the Group’s global customers (SCIB)
2019 Highlights
Underlying att. profit (EUR mn) 48
Underlying RoTE 21%
Strategic priorities
Digital transformation and expand our customer base, increasing customer loyaltyand maintaining credit quality
Peru
Focus on corporate and SCIB, and new alliances in auto finance
2019 Highlights
Underlying att. profit (EUR mn) 16
Underlying RoTE 12%
Strategic priorities
Digital transformation and results growth focused on most segments
Colombia
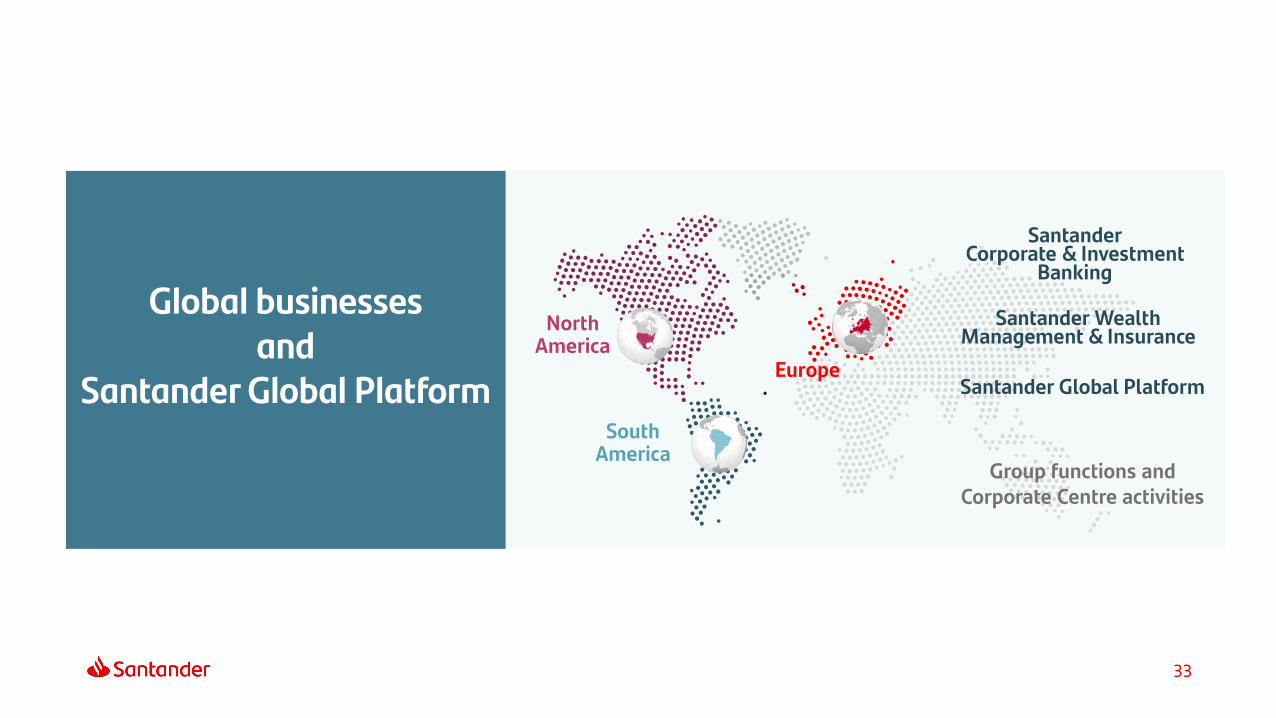
North America
South America
Europe
Santander Wealth Management & Insurance
Santander Corporate & Investment
Banking
Santander Global Platform
Group functions and Corporate Centre activities
Global businesses and
Santander Global Platform
33

Santander launched the first ever end-to-end (E2E) blockchain bond in Sep-19. Santander issued the USD 20 mn bond, opening the door to new disruptive technology that can make issuing bonds faster, more efficient and simpler
Continued transformation of the business from a lender to a strategic advisor to our global clients
Fully leverage our customer-centric model, to drive greater penetration of our franchise and faster growth in retail banking business (collaboration revenue)
Santander Corporate Investment & Banking
SCIB is the global business division for corporate and institutional customers who require a tailored service and value-added wholesale products suited to their complexity and sophistication
Strategic priorities
Strengthen the global value proposition, focusing on increasing our presence in the US, the UK and Continental Europe
Continue the implementation of the GIP1, while embracing the digital transformation
Maintain disciplined use of capital, while keeping strict cost control
Committed to the Responsible Banking agenda partnering with our clients and contributing to inclusive and sustainable growth. SCIB acted as sole Sustainable Structuring Advisor and Joint Bookrunner for the inaugural Santander Green Bond and remains at the top of renewables league tables2
(1) Implementation of the Global Infrastructure Programme (GIP) following the regulatory agenda (2) Source: Dealogic & MergeMarketNote.- Customer loans: Gross loans excluding reverse repos. Customer funds: customer deposits excluding repos + marketed mutualFor more information (awards, etc.) see https://www.santandercib.com
34
2019 Highlights
35%
30%
27%
8%
Global Transaction Banking
Global Debt Financing
Global Markets
Capital & Other
Total revenue breakdown
Customer loans (EUR bn) 114
Customer funds (EUR bn) 92
Total revenue (EUR mn) 5,284
Collaboration revenue +17% YoY
Underlying RoRWA 1.8%
Underlying attributable profit (EUR mn) 1,761
Contribution to Group’s profit 17%

• One Global value proposition
• Develop a global Private Wealth proposition to c.1,700 clients with >EUR 20 mn5 growing +18%
• Execute the digital transformation
Santander Wealth Management & Insurance
Our aim: become the best and most responsible Wealth Manager in Europe and the Americas
Strategic priorities
• Become the best local supplier – strengthening leadership and commitment in our 10 core markets
• Implement the new IT platform
• Build a competitive edge on our global capabilities + develop institutional business
New funds: alternatives, private debt and infrastructure and Santander GO» product range
Best provider of savings and investments solutions
in Ibero-america
• Reach our full potential by completing our value proposition in our core markets
• E2E digital journeys and online open platforms
First choice of insurance for Santander customers
Motor Home Health
Accidents SME Term life
Savings
Pensions and Wealth Planning
Responsible Banking;
Environmental, Social and
Governance (ESG)
(1) Total assets marketed and/or managed. Private Banking + SAM excluding AUM of Private Banking customers (2) Including fees generated by asset management and insurance transferred to the commercial network (3) Total amount as of Jan-Nov’19: c. EUR 8 bn (4) Profit after tax + net fee income generated by this business (5) Assets under management cut-off may differ in each country
For more information see http://www.santanderassetmanagement.com
Single truly global Private Banking platform
35
2019 Highlights
Assets under management1 EUR 395 bn; +13% YoY
Total fees generated as % of the Group’s total fees2 30%
Private Banking clients (k) c.200
Private banking collaboration revenue +20% YoY
SAM net sales EUR 5.7bn
SAM market shares in most core markets Higher YoY
Insurance gross written premiums3 +13% YoY
Underlying RoRWA 8.9%
Underlying attributable profit (EUR mn) 960
Contribution to Group’s profit 9%
Total contribution to Group’s profit4 (EUR mn) 2,494

Accelerating our digitalisation process by developing global digital banking solutions with payments at the core for SMEs and individuals
Santander Global Platform (SGP)SGP
SMEs Individuals
Santander Global Platform
Global Merchant Services
Global Trade
Services
Banking withouta bank
Focused on relevant
global markets…
… building on relevant
assets to accelerate
growth
Global Digital
Banking
Digital payment services as a driver of customer engagement and loyalty
1
Built with global platforms, leveraging our scale for efficiency and customer experience
2
Offered to both our banks (B2C) and to third parties (B2B2C)
3
Run autonomously, with a blend of tech and banking talent
4
(1) 50.1% stake; Transaction closing expected in mid-2020 subject to regulatory approvals
1
More information on Group’s financial report, pages 40-41. See link to this document on page 65 36

North America
South America
Europe
Santander Wealth Management & Insurance
Santander Corporate & Investment
Banking
Santander Global Platform
Group functions and Corporate Centre activities
Global T&O strategy
HR strategy
Risk management and control
Corporate governance and internal control
Our brand
37
Group functions and Corporate Centre activities

T&O strategy is aligned with our two-pronged approach: digitalising our core banks and global businesses and building SGP focusing on better serving our customers’ needs
Global T&O capabilities are key for our commercial and digital transformation
Composed of four main domains that contribute to the digital transformation
Technology
Cybersecurity
Operations
Data
Focused on five technological pillarsto respond to the changing business needs
ATMs
T&O is reducing technology costs while absorbing inflation and significant growth coming from digital transformation
RiskManagement
(incl. cybersecurity)
Agile Cloud Core systems
evolution
Deep technology
skills
Data
CommonArchitecture
Speed InnovationSecurity
by designCost
Servicequality
Open business
model
Business needs
Operating model oriented to develop global products and digital services,
guaranteeing their quality and security
c. 2,000 professionals
38
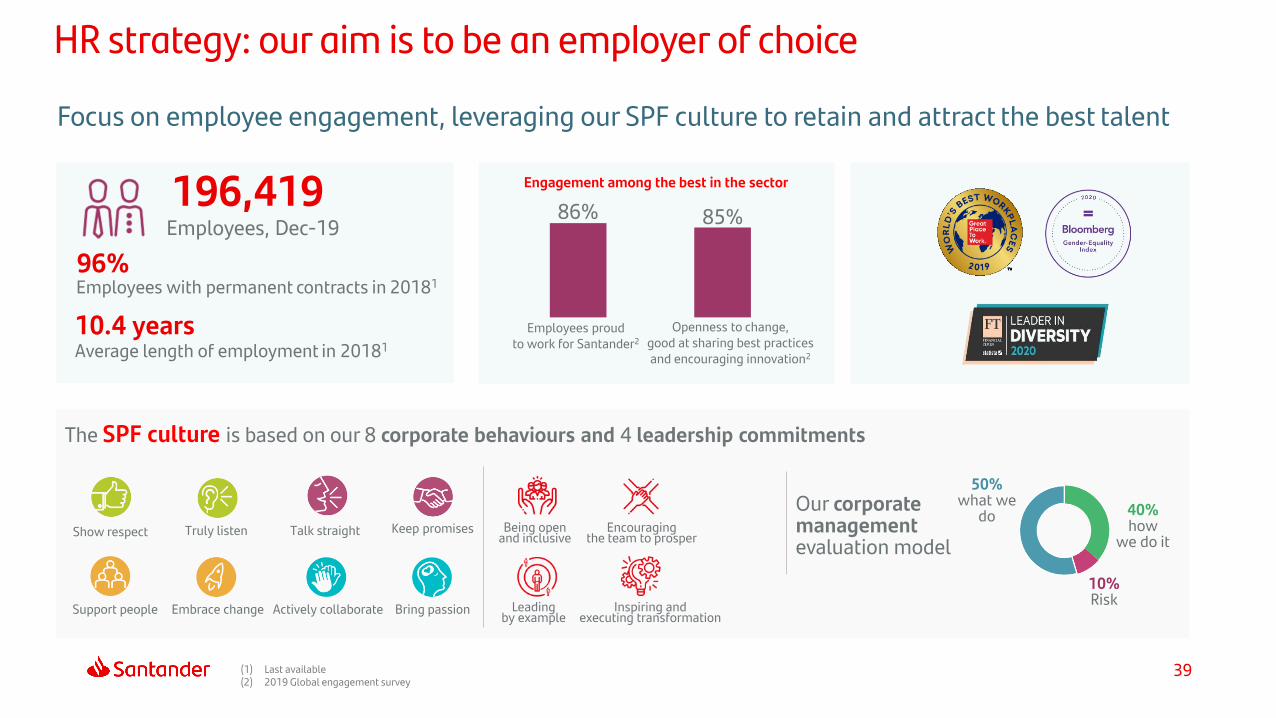
HR strategy: our aim is to be an employer of choice
Focus on employee engagement, leveraging our SPF culture to retain and attract the best talent
196,419
Employees with permanent contracts in 2018196%
Employees, Dec-19
Average length of employment in 20181
10.4 years
The SPF culture is based on our 8 corporate behaviours and 4 leadership commitments
Our corporate management evaluation model
50%what we
do 40%how
we do itShow respect Truly listen Talk straight Keep promises
Support people Embrace change Actively collaborate Bring passion
Employees proud to work for Santander2
Openness to change, good at sharing best practices and encouraging innovation2
86% 85%
Engagement among the best in the sector
(1) Last available(2) 2019 Global engagement survey
Encouraging the team to prosper
Leadingby example
Being openand inclusive
Inspiring and executing transformation
39
10%Risk
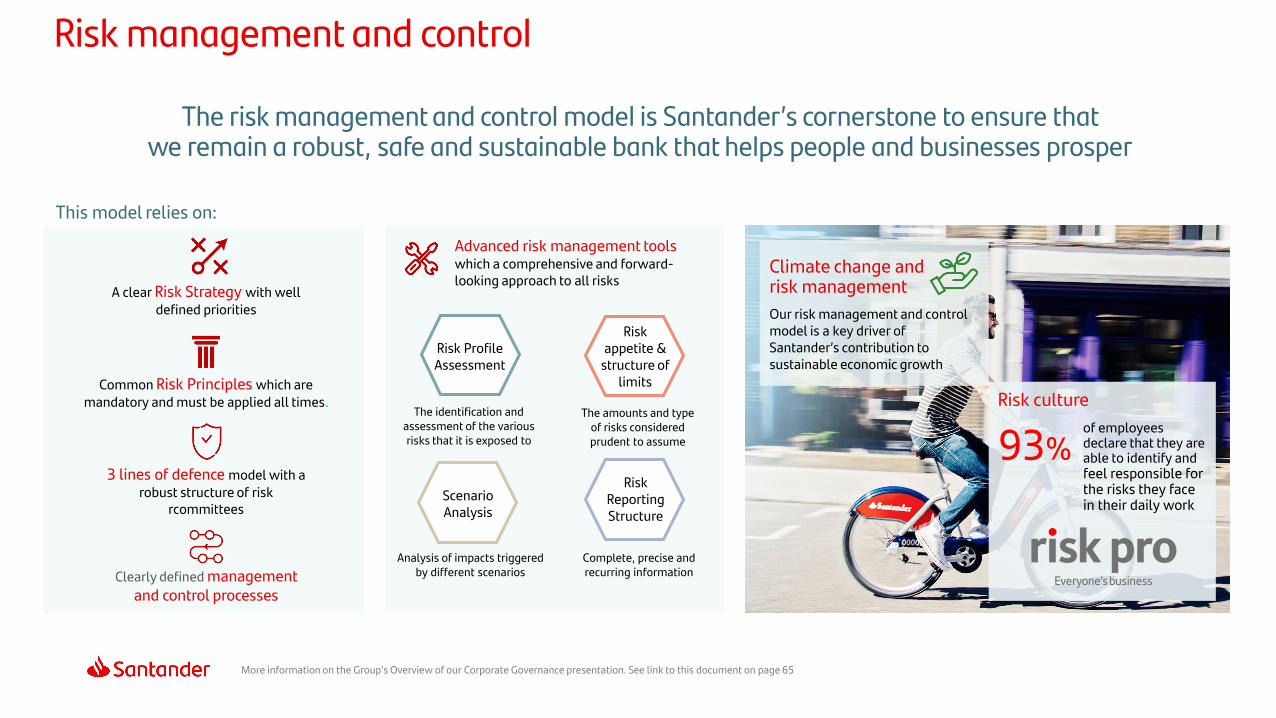
93%of employees declare that they are able to identify and feel responsible for the risks they face in their daily work
Climate change and risk management
Risk culture
Our risk management and control model is a key driver of Santander’s contribution to sustainable economic growth
3 lines of defence model with a robust structure of risk
rcommittees
A clear Risk Strategy with well defined priorities
Common Risk Principles which are mandatory and must be applied all times.
Advanced risk management tools which a comprehensive and forward-looking approach to all risks
Clearly defined management and control processes
Risk Profile Assessment
Risk appetite &
structure of limits
Scenario Analysis
Risk Reporting Structure
The identification and assessment of the various risks that it is exposed to
The amounts and type of risks considered prudent to assume
Analysis of impacts triggered by different scenarios
Complete, precise and recurring information
This model relies on:
Risk management and control
The risk management and control model is Santander’s cornerstone to ensure that we remain a robust, safe and sustainable bank that helps people and businesses prosper
More information on the Group’s Overview of our Corporate Governance presentation. See link to this document on page 65

41
As a responsible bank, we have clear and robust governance with well-defined accountability and prudent management of risks and opportunities
Corporate governance and internal control
Diversified and well-balanced shareholder base
Effective engagement with our shareholders
Focus on responsible business practices and attention to all
stakeholders’ interests
Effective board of directors
11%
33%40%
2011 2015 2019
Non-executive directors (independent)
Executive directors
Non-executive directors (neither proprietary nor independent)
60%
13%
27%
Womenon the Board
Composition of the Board, Dec-19 Board committees
External advisory boardInternational advisory board
Executive
Responsible banking, sustainability and culture
Innovation and technology
Remuneration
Audit
Nominations
Risk supervision, regulation and compliance
More information on the Group’s Overview of our Corporate Governance presentation. See link to this document on page 65

42
Group-subsidiary governance model
Group
Board of Directors
Group Executive Chairman1
Group CEO2
Regional Heads3
Control, management and business functions
• Compliance
• Audit
• Risk
• Finance
• Financial Control / Accounting
• Others4
Subsidiary B
Control, management and business functions
CEO / Country Head
Board of Directors
Subsidiary A
A
B
C
(1) First executive (2) Second executive (3) Europe, North America and South America, reporting to Group CEO (4) IT & Operations, Human Resources, General Secretariat,Marketing, Communications, Strategy, Santander Corporate & Investment Banking, Wealth Management & Insurance, Digital & Innovation and Global Platforms
• Compliance
• Audit
• Risk
• Finance
• Financial Control / Accounting
• Others4
Best practices on robust governance are channelled to all subsidiaries
Presence of Grupo Santander in the subsidiaries' Boards of Directors establishing guidelines for board structure, dynamics and effectivenessA
Reporting of the CEO / Country Heads to the Group CEO / Regional Heads and Group Executive CommitteeB
Interaction between the Group’s and the subsidiaries’ control, management and business functionsC
The Group-subsidiary governance modelenhances control and oversight through:
Corporate governance and internal control

43
Our brand embeds the essence of the Group's culture and identity
best global bank brand by BrandZ ranking, 2019
best global banking brand by BGB 2019, Interbrand Ranking
Santander is one of the most valued brands in the world
As one of our most important strategic assets, our brand helps us connect with people and businesses, demonstrating our commitment to prosperity and determination to bring it to life in a positive and sustainable manner every day
5th
More information: https://brand.santander.com/en
3.2019 results and activity

45(1) In constant euros(2) Excluding RWA inflation coming from TRIM and other regulatory impacts, otherwise +2 bps increase
(3) Board intends to propose to the 2020 AGM that the total payment of the remuneration against 2019 results will be EUR 0.23 per share split in (1) a dividend in cash of EUR 0.20 per share and (2) a scrip dividend that will entail the payment in cash, for those shareholders who so choose, of EUR 0.03 per share
Delivering Growth, Profitability and Strength in a responsible way
2019 (vs. 2018)
Loyal customers
21.6 mn (+9%)
Customer revenue
EUR 47.1bn (+4%1)
Underlying RoTE
11.8 % (-29 bps)
Underlying RoRWA
1.61% (+5 bps2)
FL CET1
11.65 % (+35 bps)
NPL ratio
3.3% (-41 bps)
ProfitabilityGrowth Strength
Proposed3 increasing cash DPS to EUR 0.20 (c.+3% YoY) and total 2019 DPS of EUR 0.23

46
Strong organic capital generation: FL CET1 at 11.65% and increasing cash DPS
Underlying profit growth +5%1 in Q4’19 vs. Q4’18
All-time record year in revenue
Profitable growth and solid organic capital generation
Note: Net capital gains and provisions amount to EUR -1,737 mn in 2019(1) In constant euros
EUR mn 2019 % % constant €
Net interest income 35,283 3 4
Net fee income 11,779 3 5
Customer revenue 47,062 3 4
Trading and other income 2,432 -6 -8
Total income 49,494 2 3
Operating expenses -23,280 2 3
Net operating income 26,214 2 3
Loan-loss provisions -9,321 5 5
Other results -1,964 -2 0
Underlying PBT 14,929 1 2
Underlying attributable profit 8,252 2 3
Attributable profit 6,515 -17 -16
Change vs. 2018

47
High quality revenue: customer revenue deliver 95% of the total and grew 4% YoY driven by the Americas and Global Businesses
Note: YoY change in constant euros(1) Including fees generated by asset management and insurance transferred to the commercial network
Other Revenue
5%
Customer Revenue(NII + Fees)
95%
South America +11%
North America +4%
Europe flat
SCIB +9%
WM&I1 +6%
+4%Customer Revenue
WM&I1: 30% ; SCIB: 13%
NII +4%
Fees
Volumes and spreads management with 8 markets growing or flat
Improved trend by global businesses, amounting to 43% of total fees
+5%

48
We continue leveraging our scale and global capabilities to improve productivity and generate new efficiencies
(1) Excluding Argentina due to high inflation. Included, South America: +10.2% nominal costs and 0.9% costs in real terms
Europe
South America1
North America
-1.3%
4.6%
5.1%
Nominal costs
-8%
-4%
-3%
2%
4%
1%
0%
-2.4%
1.0%
2.6%
Costs in real terms YoY change in constant euros
Group 3.4% -0.4%
Regional revenues
and cost management
Synergies as a region
and joint investments
Operating as
“One Europe”

49
2019 a record-high year in terms of gross capital generation, partially offset by regulatory headwinds Strength
(1) Impacts: 19 bps IFRS16; 43 bps TRIM & others(2) Not considering other elements in the CET1 YoY change: OCI, cost of FX hedges, AT1 coupons, etc.
(3) Including dividends paid to minorities by subsidiaries, otherwise dividends 3.4 bn and total capital generation EUR 8.5 bn(4) Capital consumption coming from RWA inflation
11.30%
12.27%
11.65%
+97 bps
-62 bps
2018 Gross capital
generation
2019 (excluding
headwinds)
Regulatory
headwinds
2019
EUR 3.6 bnCET1 accumulation
EUR 4.3 bnDividends3
EUR 1.5 bnRWA growth4
EUR 9.4 bn2019 capital generationpre-minorities2,3
1
+35 bps
FL CET1 2019

50
Cost of credit
NPL ratio
Lower or stable cost of credit in 8 core markets
NPL ratio fell YoY in most markets
High level of allowances to total loans
Sound credit quality underpinned by lower NPL and high coverage ratios. Cost of credit remains at very low levels
1.0% 1.0%
3.73% 3.32%
Coverage ratio 67% 68%
Better credit quality ratios
2018 2019

North America
South America
Europe
Santander Wealth Management & Insurance
Santander Corporate & Investment
Banking
Santander Global Platform
Group functions and Corporate Centre activities
51
Details by geographic regions
and global businesses

52
Strong operating performance across our regions…
Europe
South America
North America
9.9+6%
651+2%
Loyalcustomers
(mn)Loans
(EUR bn)
Underlying profit
(EUR mn)RoTE(%)
4,878-3%
10%-86 bps
3.5+22%
131+10%
1,667+21%
13%2
+112 bps
7.9+7%
131+9%
3,924+18%
21%+179 bps
(1) YoY change in constant euros. Loans excluding reverse repos. Underlying RoTE(2) Adjusted for excess of capital in the US. Otherwise 9%
Double-digit earnings growth and returns
Improving capabilities and high operational leverage
Stable revenue and executing cost synergy opportunities
20191 (vs. 2018)
53
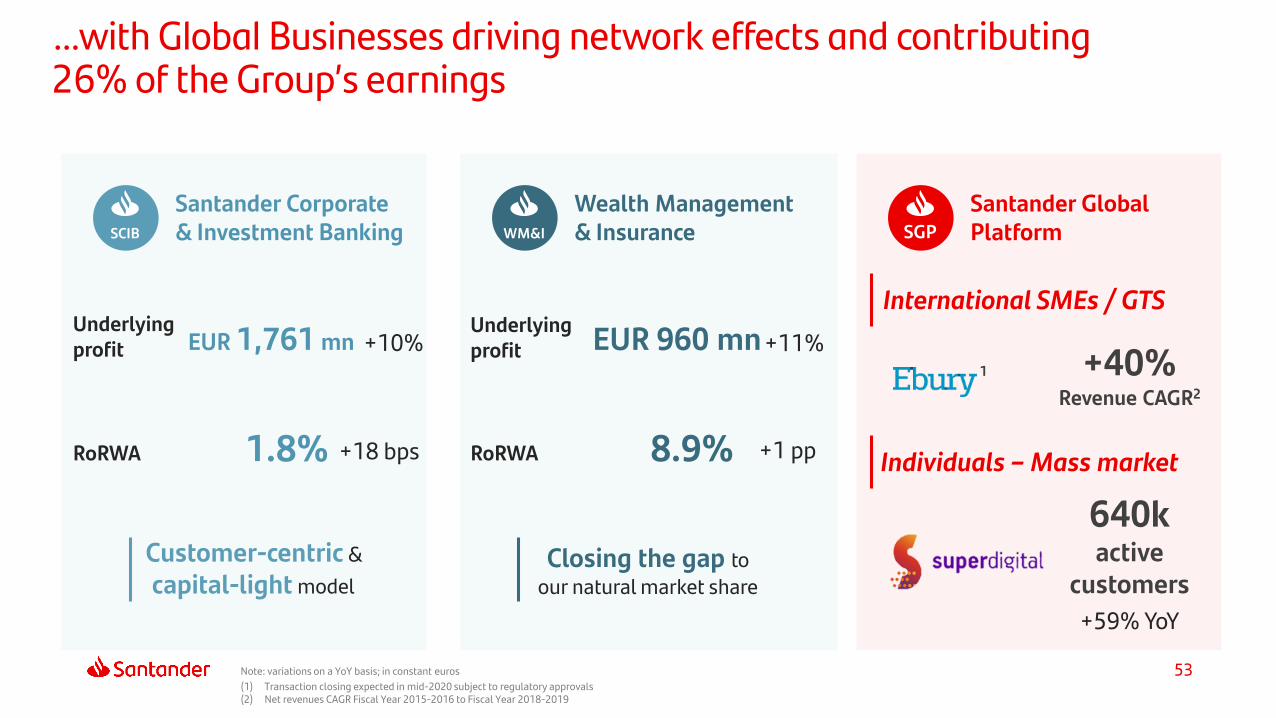
…with Global Businesses driving network effects and contributing 26% of the Group’s earnings
Customer-centric &
capital-light model
Santander Corporate & Investment Banking
Note: variations on a YoY basis; in constant euros
(1) Transaction closing expected in mid-2020 subject to regulatory approvals(2) Net revenues CAGR Fiscal Year 2015-2016 to Fiscal Year 2018-2019
RoRWA
Underlyingprofit +10%
SCIB
1.8% +18 bps
Santander Global Platform
International SMEs / GTS
SGP
+40% Revenue CAGR2
640k active
customers
+59% YoY
Wealth Management & Insurance
RoRWA
Underlyingprofit +11%
WM&I
8.9% +1 pp
Closing the gap to
our natural market share
Individuals – Mass market
1
EUR 1,761 mn EUR 960 mn
54
1,585
1,314
1,077
525
349
950
717
2,939
630
144
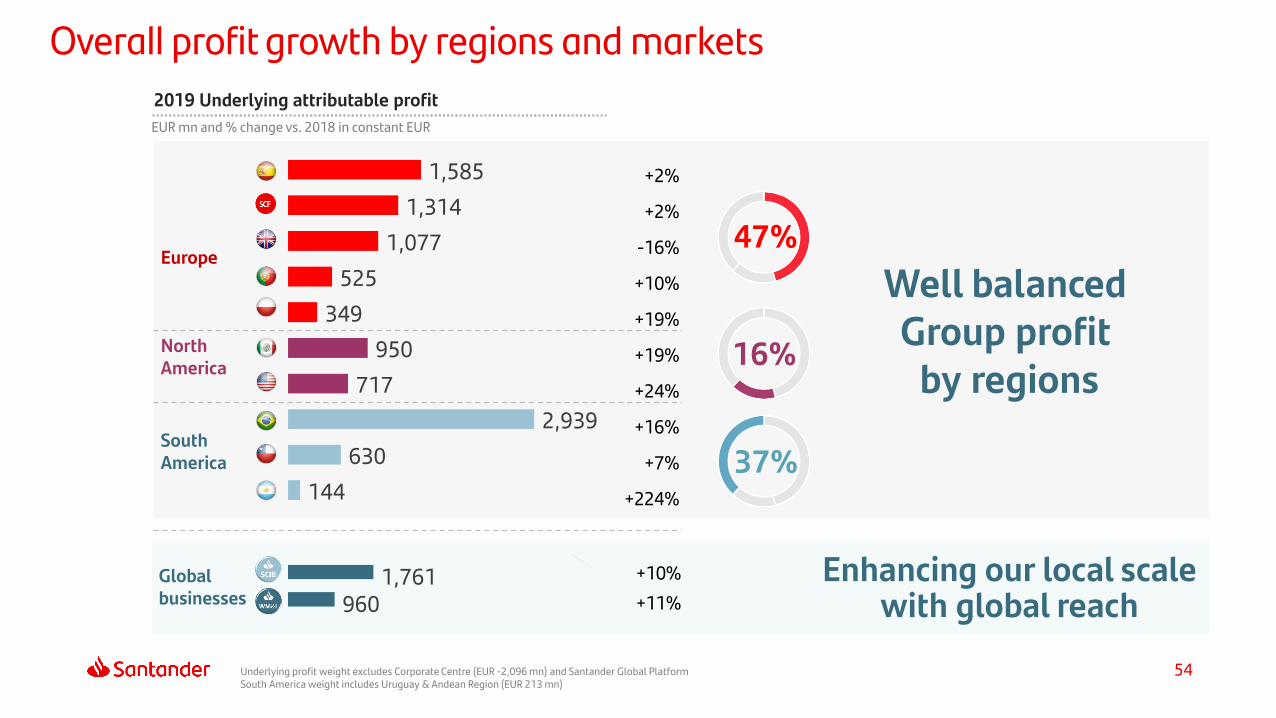
Overall profit growth by regions and markets
2019 Underlying attributable profit
EUR mn and % change vs. 2018 in constant EUR
1,761960
+10%
+11%
Europe
South America
North America
Global businesses
+2%
+2%
-16%
+10%
+19%
+19%
+24%
+16%
+7%
+224%
Well balanced Group profit
by regions
Enhancing our local scale with global reach
Underlying profit weight excludes Corporate Centre (EUR -2,096 mn) and Santander Global PlatformSouth America weight includes Uruguay & Andean Region (EUR 213 mn)
47%
16%
37%
55
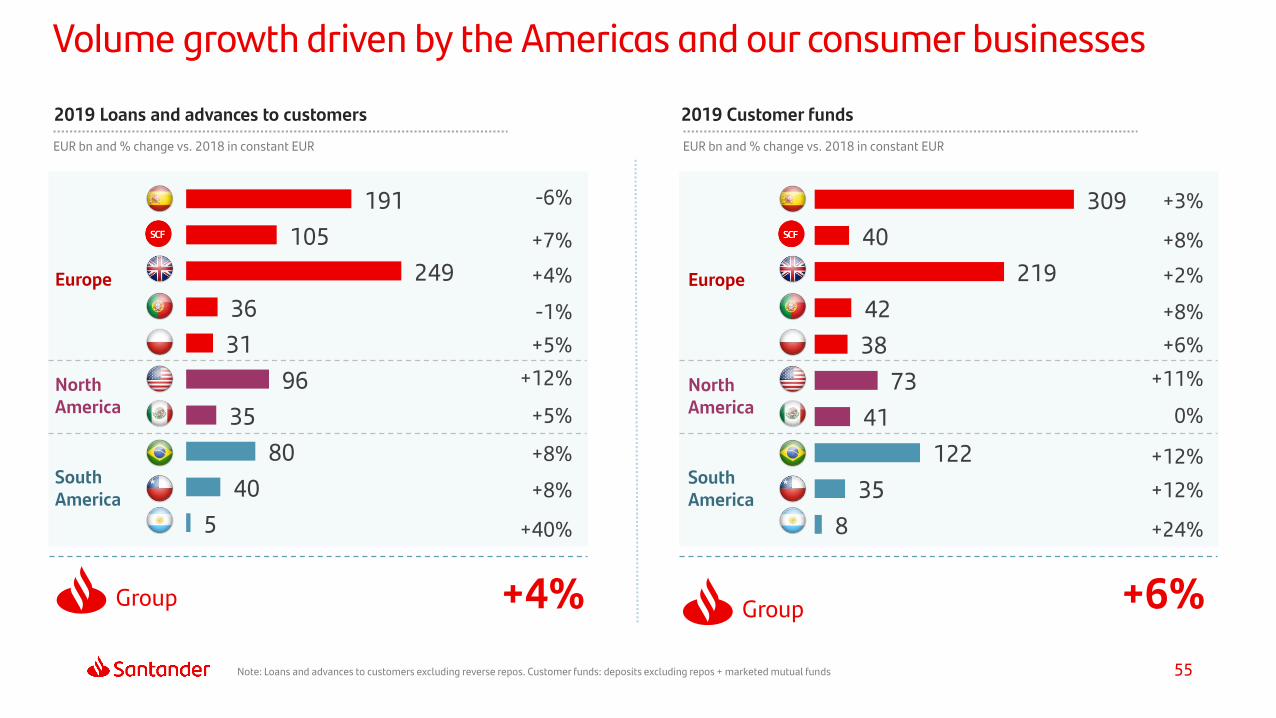
Volume growth driven by the Americas and our consumer businesses
2019 Loans and advances to customers
191
105
249
36
31
96
35
80
40
5
+4%
-1%
+5%
+12%
+5%
+8%
+8%
+40%
-6%
+7%
2019 Customer funds
309
40
219
42
38
73
41
122
35
8
+3%
+8%
+6%
+11%
0%
+12%
+12%
+24%
+8%
+2%
Note: Loans and advances to customers excluding reverse repos. Customer funds: deposits excluding repos + marketed mutual funds
EUR bn and % change vs. 2018 in constant EUR EUR bn and % change vs. 2018 in constant EUR
+4%Group +6%Group
Europe
South America
North America
Europe
South America
North America

56
Improve operating performance
Accelerate digitalisation through SGP
Optimise capital allocation
Santander Global Platform creationMexico minorities acquisition
Europe c. EUR 200 mn1 cost reduction(20% of c. EUR 1 bn plan)
Ebury strategic partnership2
(base for Global Trade Services)
Custody business partnership and Puerto Rico retail bank disposal2
High return businesses investments(eg. Insurance, acquiring, etc.)
Simplified regional management structure
Building a Responsible Bank
Recognised as the most sustainable bank in the world by Dow Jones Sustainability Index in 2019
Popular integrationsuccessfully concluded
Openbank expansion in Europe
(1) Adjusted by perimeter effects(2) Transaction closing expected in mid-2020 subject to regulatory approvals
Results also supported by a disciplined execution against our strategic priorities
Our three-pillar plan and medium-term goals4.
58
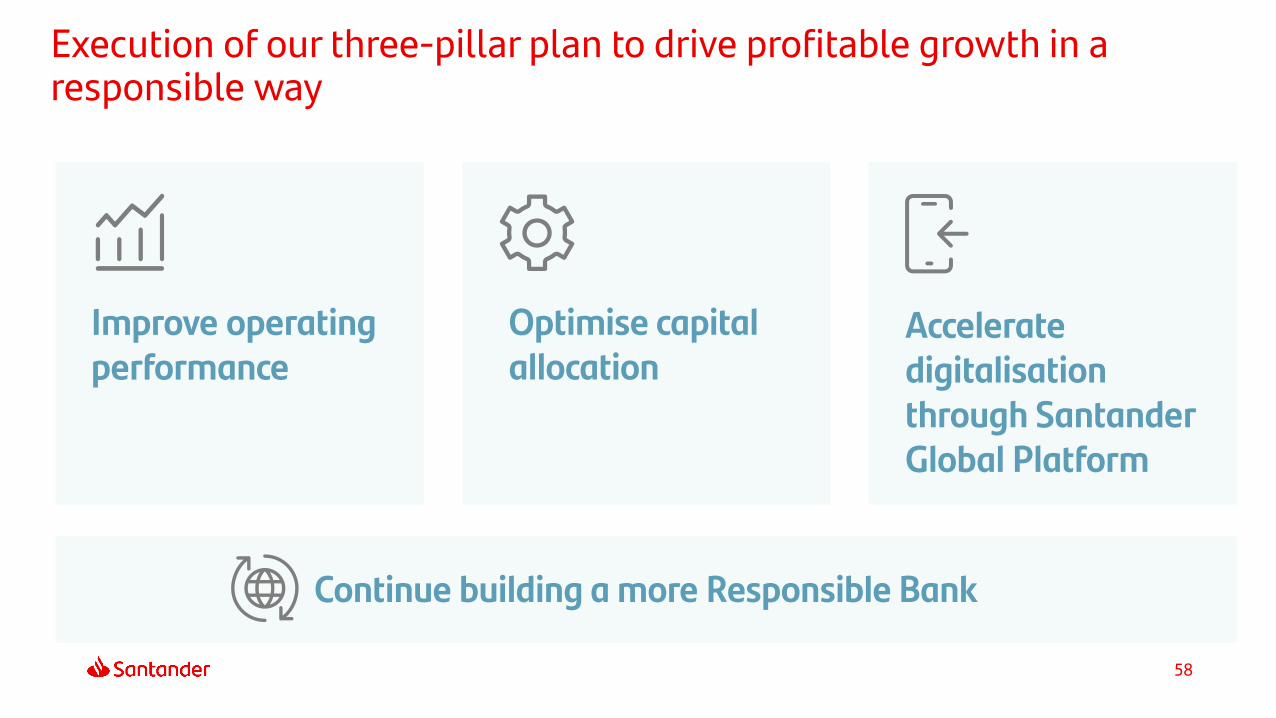
Execution of our three-pillar plan to drive profitable growth in a responsible way
Improve operating performance
Accelerate digitalisation through Santander Global Platform
Optimise capital allocation
Continue building a more Responsible Bank
59
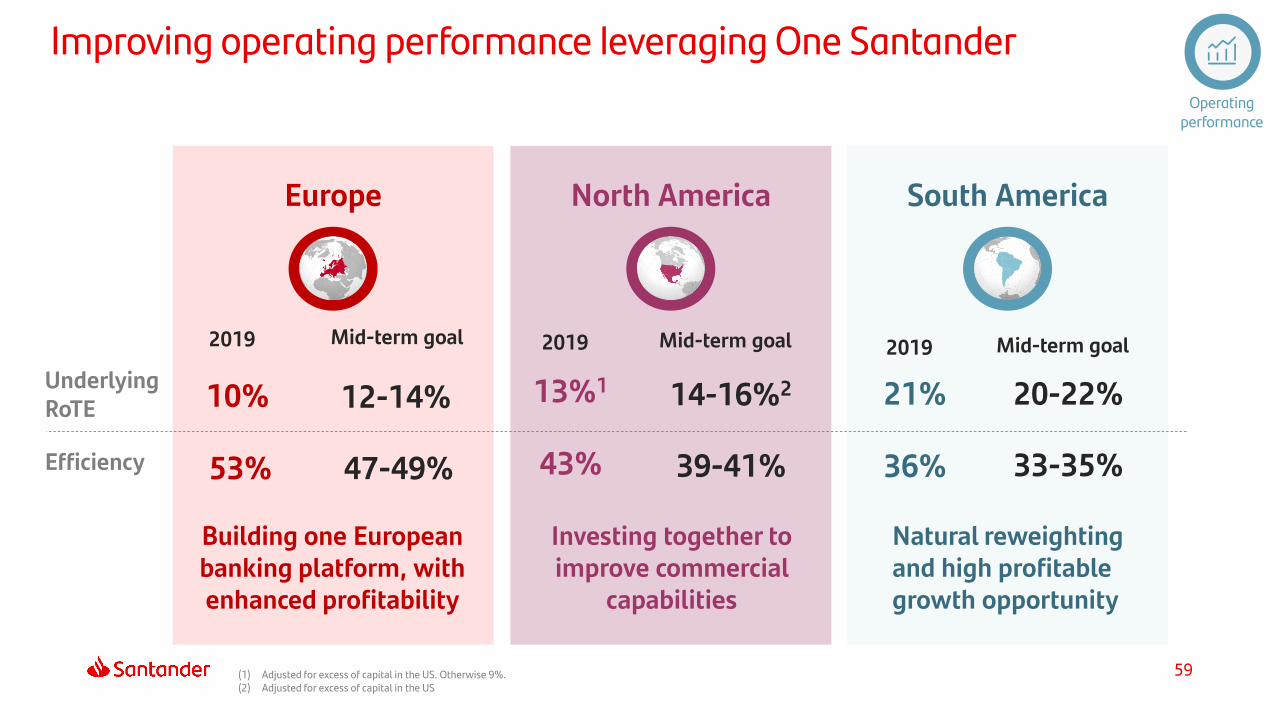
Improving operating performance leveraging One Santander
(1) Adjusted for excess of capital in the US. Otherwise 9%.(2) Adjusted for excess of capital in the US
Operating performance
South AmericaNorth America
Natural reweighting and high profitable growth opportunity
Investing together to improve commercial
capabilities
UnderlyingRoTE
Efficiency
20-22%21%
33-35%36%
Mid-term goal2019
14-16%213%1
39-41%43%
Mid-term goal2019
Europe
Building one European banking platform, with enhanced profitability
12-14%10%
47-49%53%
Mid-term goal2019

60
Ongoing capital allocation optimisation to improve profitability
Rebalancing to more profitable regions and businesses
Improved pricing, processes and governance
Active management and senior team alignment
Capital allocation
GroupRoRWA1
1.3%
1.6%
1.8-2.0%
Strong profitability improvement leading to higher capital generation capacity
2014 2019 Mid-termgoal
(1) Underlying RoRWA

61
Accelerating digitalisation and building Santander Global Platform
Accelerate the transformation
of our ‘core Banks’
Digitalisation & SGP
Moving towards ONE SANTANDER to build simpler, faster and better services
Provide faster and better global
payments and solutions

62
Customers
Shareholders
• Loyal customers3: c.26 mn
• Digital customers4: c.50 mn
• Top 3 in customer satisfaction: All markets2
• Digital sales5: >50%
• C/I: 42 - 45%
• FL CET1: 11% - 12%
• RoTE6: 13% - 15%
• RoRWA6: 1.8% - 2.0%
• Dividend pay-out: 40% - 50%8
Communities
• Financially empowered people1: 10 mn
People
• Top 10 company to work: 6 geographies
Shareholders
Customers
Communities
People
(1) Cumulative number of people whom we serve with our financial empowerment and inclusion initiatives in any of our geographies during the period 2019-2025. These initiatives target mostly unbanked, underbanked and vulnerable groups
(2) CSAT: Customer Satisfaction internal benchmark of active customers’ experience and satisfaction audited by Stiga / Deloitte. In the medium term we will be also following NPS as indicator; Ex US; (3) Active customers who receive most of their financial services from the Group according to the commercial segment to which they belong.(4) Every physical or legal person, that, being part of a commercial bank, has logged in its personal area of internet banking or mobile phone or both in the last 30 days(5) The percentage of new business carried out through digital channels in the period (6) Underlying (7) 2019-22 underlying EPS CAGR (8) Dividends charged to the results of the year divided by the
underlying attributable profit
Our business model, our track record and the three-pillar plan support the delivery of our mid-term goals while we are building a Responsible Bank
High-single digit EPS 3Y CAGR7

Santander Responsible Banking goals
We are building a more Responsable Bank aligned with our commitments
63
(1) According to relevant external indexes in each country (Great Place to Work, Top Employer, Merco, etc.)(2) Senior positions represent 1% of total workforce(3) Calculation of equal pay gap compares employees of the same job, level and function(4) People (unbanked, underbanked or financially vulnerable), who are given access to the financial system, receive tailored finance and increase their knowledge and resilience through financial education(5) Includes Santander overall contribution to green finance: project finance, syndicated loans, green bonds, capital finance, export finance, advisory, structuring and other products to help our clients in the
transition to a low carbon economy. Commitment from 2019 to 2030 is EUR 220 bn(6) In those countries where it is possible to certify renewable sourced electricity for the properties occupied by the Group(7) People supported through Santander Universities initiative (students who will receive a Santander scholarship, will achieve an internship in an SME or participate in entrepreneurship programmes supported
by the bank)(8) People helped through our community investment programmes (excluded Santander Universities and financial education initiatives)
Grupo Santander financial information5.
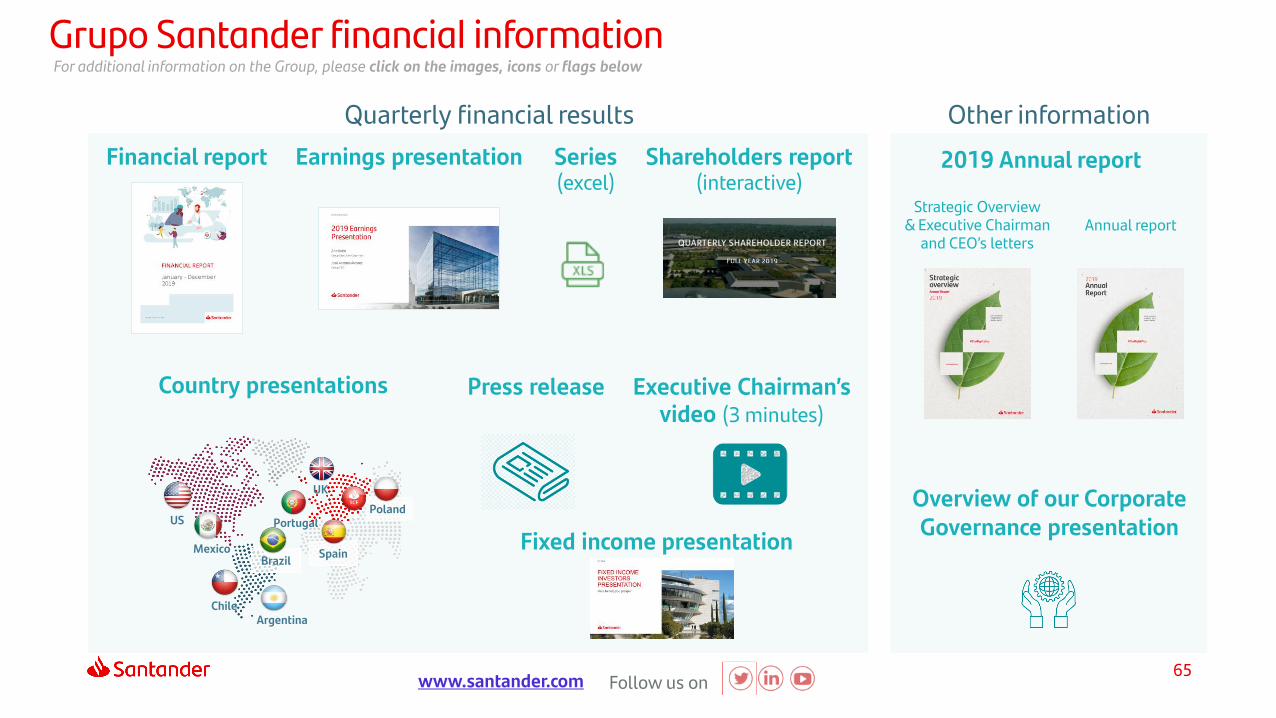
For additional information on the Group, please click on the images, icons or flags below
Financial report
Grupo Santander financial information
Quarterly financial results
Earnings presentation
Country presentations
US
Mexico
ArgentinaChile
Portugal
Spain
UK
Poland
Brazil
Other information
www.santander.com
Overview of our Corporate Governance presentation
Series(excel)
Press release Executive Chairman’s video (3 minutes)
2019 Annual report
Fixed income presentation
Follow us on
Shareholders report(interactive)
65
Strategic Overview& Executive Chairman
and CEO’s lettersAnnual report

66
Important information
Non-IFRS and alternative performance measures
In addition to the financial information prepared in accordance with International FinancialReporting Standards (“IFRS”) and derived from our financial statements, this presentation containscertain financial measures that constitute alternative performance measures (“APMs”) as definedin the Guidelines on Alternative Performance Measures issued by the European Securities andMarkets Authority (ESMA) on 5 October 2015 (ESMA/2015/1415en) and other non-IFRS measures(“Non-IFRS Measures”). The financial measures contained in this presentation that qualify asAPMs and non-IFRS measures have been calculated using the financial information fromSantander Group but are not defined or detailed in the applicable financial reporting frameworkand have neither been audited nor reviewed by our auditors. We use these APMs and non-IFRSmeasures when planning, monitoring and evaluating our performance. We consider these APMsand non-IFRS measures to be useful metrics for management and investors to facilitate operatingperformance comparisons from period to period. While we believe that these APMs and non-IFRSmeasures are useful in evaluating our business, this information should be considered assupplemental in nature and is not meant as a substitute of IFRS measures. In addition, othercompanies, including companies in our industry, may calculate or use such measures differently,which reduces their usefulness as comparative measures. For further details of the APMs andNon-IFRS Measures used, including its definition or a reconciliation between any applicablemanagement indicators and the financial data presented in the consolidated financial statementsprepared under IFRS, please see the 2019 Annual Financial Report, filed with the ComisiónNacional del Mercado de Valores of Spain (CNMV) on 28 February 2020. This document isavailable on Santander’s website (www.santander.com).
The businesses included in each of our geographic segments and the accounting principles underwhich their results are presented here may differ from the included businesses and localapplicable accounting principles of our public subsidiaries in such geographies. Accordingly, theresults of operations and trends shown for our geographic segments may differ materially fromthose of such subsidiaries
Forward-looking statements
Santander cautions that this presentation contains statements that constitute “forward-lookingstatements” within the meaning of the U.S. Private Securities Litigation Reform Act of 1995.Forward-looking statements may be identified by words such as “expect”, “project”, “anticipate”,“should”, “intend”, “probability”, “risk”, “VaR”, “RoRAC”, “RoRWA”, “TNAV”, “target”, “goal”,“objective”, “estimate”, “future” and similar expressions. These forward-looking statements arefound in various places throughout this presentation and include, without limitation, statementsconcerning our future business development and economic performance and our shareholderremuneration policy. While these forward-looking statements represent our judgment and futureexpectations concerning the development of our business, a number of risks, uncertainties andother important factors could cause actual developments and results to differ materially from ourexpectations. The following important factors, in addition to those discussed elsewhere in thispresentation, could affect our future results and could cause outcomes to differ materially fromthose anticipated in any forward-looking statement: (1) general economic or industry conditions inareas in which we have significant business activities or investments, including a worsening of theeconomic environment, increasing in the volatility of the capital markets, inflation or deflation,and changes in demographics, consumer spending, investment or saving habits; (2) exposure tovarious types of market risks, principally including interest rate risk, foreign exchange rate risk,equity price risk and risks associated with the replacement of benchmark indices; (3) potentiallosses associated with prepayment of our loan and investment portfolio, declines in the value ofcollateral securing our loan portfolio, and counterparty risk; (4) political stability in Spain, the UK,other European countries, Latin America and the US (5) changes in laws, regulations or taxes,including changes in regulatory capital and liquidity requirements, including as a result of the UKexiting the European Union and increased regulation in light of the global financial crisis; (6) ourability to integrate successfully our acquisitions and the challenges inherent in divertingmanagement’s focus and resources from other strategic opportunities and from operationalmatters while we integrate these acquisitions; and (7) changes in our ability to access liquidity andfunding on acceptable terms, including as a result of changes in our credit spreads or a downgradein our credit ratings or those of our more significant subsidiaries. Numerous factors could affectthe future results of Santander and could result in those results deviating materially from thoseanticipated in the forward-looking statements. Other unknown or unpredictable factors couldcause actual results to differ materially from those in the forward-looking statements.
67
Forward-looking statements speak only as of the date of this presentation and are based on theknowledge, information available and views taken on such date; such knowledge, informationand views may change at any time. Santander does not undertake any obligation to update orrevise any forward-looking statement, whether as a result of new information, future events orotherwise.
No offer
The information contained in this presentation is subject to, and must be read in conjunction with,all other publicly available information, including, where relevant any fuller disclosure documentpublished by Santander. Any person at any time acquiring securities must do so only on the basisof such person’s own judgment as to the merits or the suitability of the securities for its purposeand only on such information as is contained in such public information having taken all suchprofessional or other advice as it considers necessary or appropriate in the circumstances and notin reliance on the information contained in this presentation. No investment activity should beundertaken on the basis of the information contained in this presentation. In making thispresentation available Santander gives no advice and makes no recommendation to buy, sell orotherwise deal in shares in Santander or in any other securities or investments whatsoever.
Neither this presentation nor any of the information contained therein constitutes an offer to sellor the solicitation of an offer to buy any securities. No offering of securities shall be made in theUnited States except pursuant to registration under the U.S. Securities Act of 1933, as amended,or an exemption therefrom. Nothing contained in this presentation is intended to constitute aninvitation or inducement to engage in investment activity for the purposes of the prohibition onfinancial promotion in the U.K. Financial Services and Markets Act 2000.
Historical performance is not indicative of future results
Statements as to historical performance or financial accretion are not intended to mean thatfuture performance, share price or future earnings (including earnings per share) for any periodwill necessarily match or exceed those of any prior period. Nothing in this presentation should beconstrued as a profit forecast.
Third Party Information
In particular, regarding the data provided by third parties, neither Santander, nor any of itsadministrators, directors or employees, either explicitly or implicitly, guarantees that thesecontents are exact, accurate, comprehensive or complete, nor are they obliged to keep themupdated, nor to correct them in the case that any deficiency, error or omission were to bedetected. Moreover, in reproducing these contents in by any means, Santander may introduceany changes it deems suitable, may omit partially or completely any of the elements of thispresentation, and in case of any deviation between such a version and this one, Santanderassumes no liability for any discrepancy.
Important information
Thank you
Our purpose is to help people and business prosper
Our culture is based on believing that everything we do should be


