
Status of the MINOS Experiment(Brookhaven Participation)
BNL DOE HEP program review 04/27/2005
Mary Bishai
Mary Bishai, BNL 1 – p.1/40
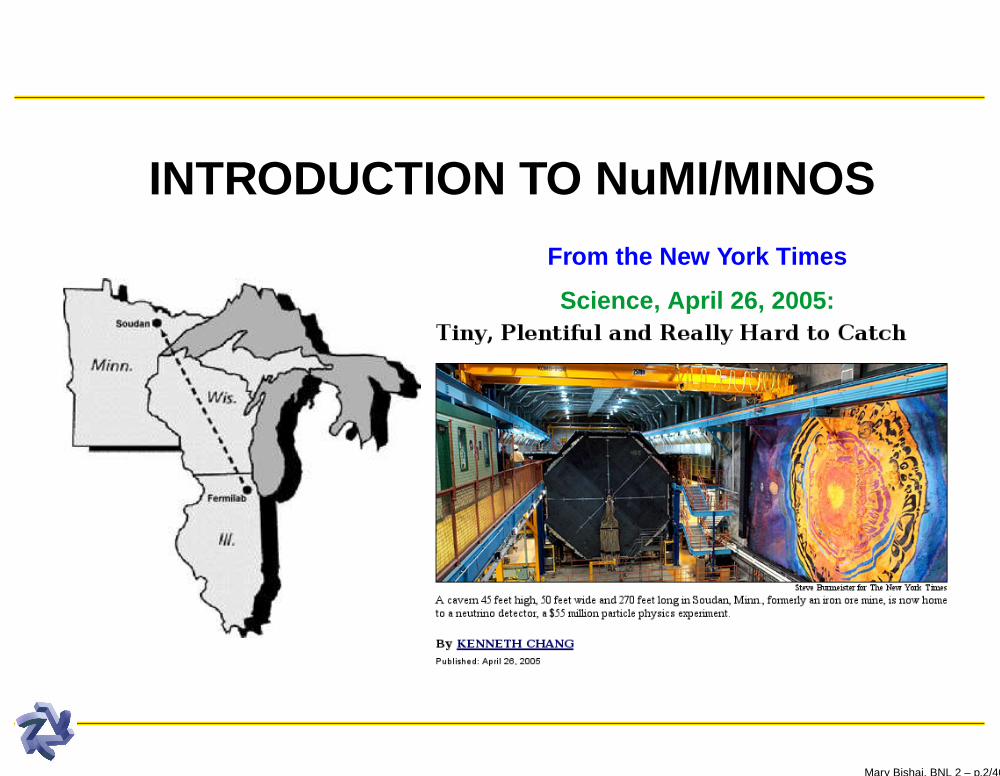
INTRODUCTION TO NuMI/MINOS
From the New York Times
Science, April 26, 2005:
Mary Bishai, BNL 2 – p.2/40

NuMI/MINOS ConceptFar Detector
735 km
11.1 km
Fermilab Soudan
Near Detector0.98 kT 5.4 kT
Fermilab’s Main Injector, Illinois
120 GeV protons, 2.5 × 10¹³ pro-
tons/ 8 µsec pulse, 1.9 sec rep rate.
⇒ 0.25 MW
Soudan Underground Lab, Minnesota
Mary Bishai, BNL 3 – p.3/40

MINOS Beam Spectrum
LE beam at 2.5 × 10²⁰ POT/yr ⇒ expect 1600 events/yr in FD
Mary Bishai, BNL 4 – p.4/40

MINOS νµ Disappearance
Plot ratio of yield at far
det. to expected from
near det.
Location and depth of dip
yield δm2 and sin2 2θ
Assume δm2 = 0.0025
eV2, sin2 2θ = 1.0
3 years at nominal intensity (top). Intensity upgrades (bot tom)
Determine δm2 to 10 % Rule out exotic oscillation models
Mary Bishai, BNL 5 – p.5/40
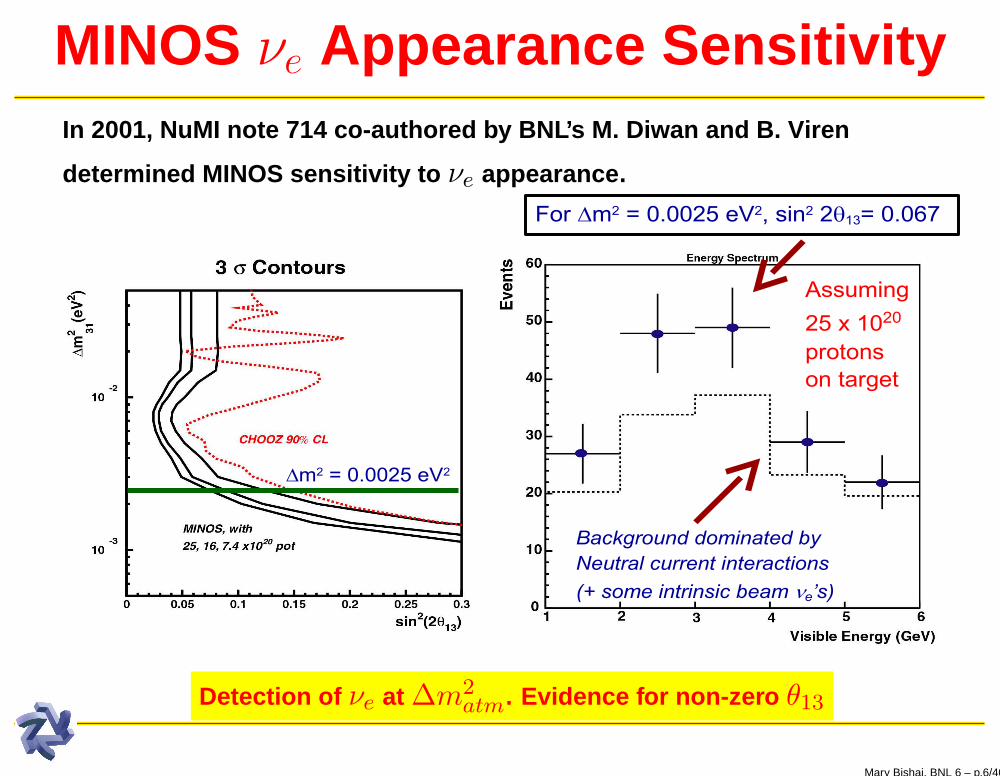
MINOS νe Appearance SensitivityIn 2001, NuMI note 714 co-authored by BNL’s M. Diwan and B. Vire n
determined MINOS sensitivity to νe appearance.
Detection of νe at ∆m2atm
. Evidence for non-zero θ13
Mary Bishai, BNL 6 – p.6/40
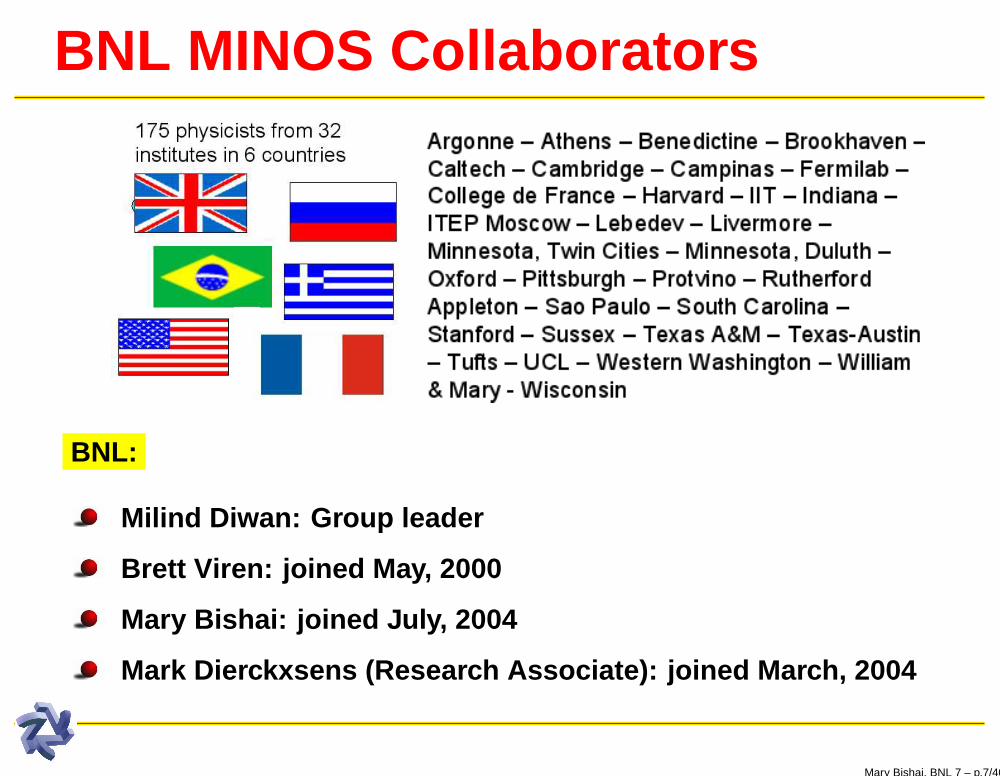
BNL MINOS Collaborators
BNL:
Milind Diwan: Group leader
Brett Viren: joined May, 2000
Mary Bishai: joined July, 2004
Mark Dierckxsens (Research Associate): joined March, 2004
Mary Bishai, BNL 7 – p.7/40

BNL Contributions to MINOSNuMI Beamline commisioning, monitoring and data logging:
Muon and hadron monitor R&D using the ATF beam (B. Viren, M.
Diwan)
Leader, MINOS beamline data logging effort (B. Viren)
Online beam monitoring software (M. Bishai, B. Viren)
Leader, NuMI beamline performance monitoring (M. Bishai)
Incorporating beamline data into MINOS analysis framework (M.
Dierckxsens, B. Viren)
Maintaining a significant presence at FermiLab (all).
MINOS databases:
MINOS hardware database framework design. Overall database
management. (M. Dierckxsens)
Mary Bishai, BNL 8 – p.8/40
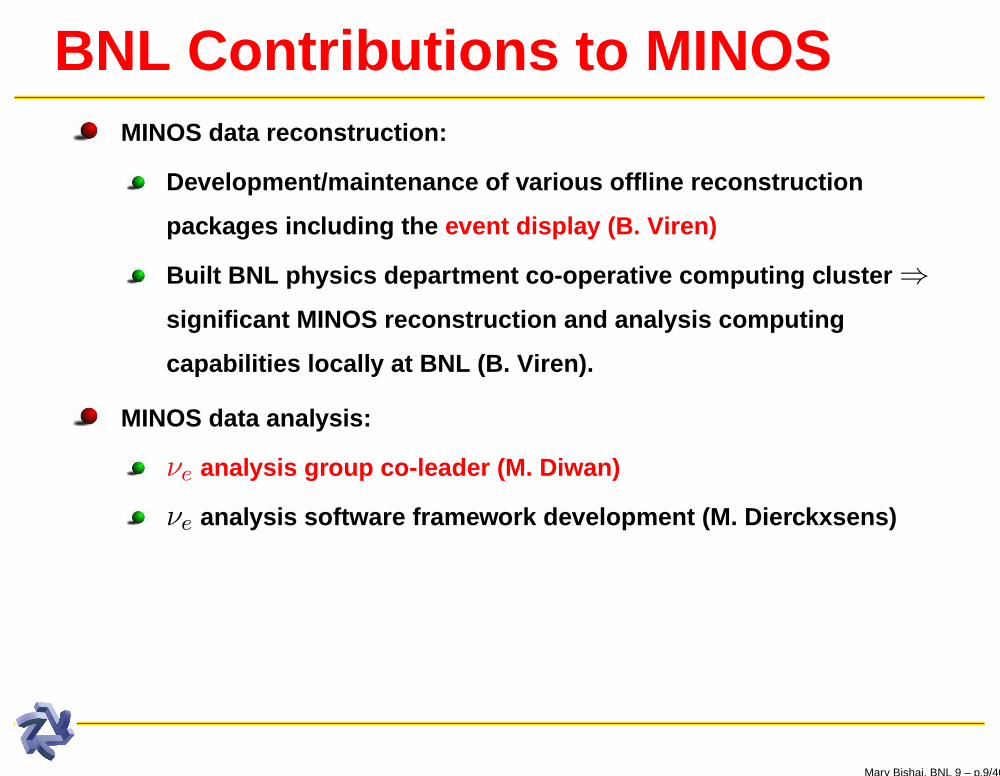
BNL Contributions to MINOSMINOS data reconstruction:
Development/maintenance of various offline reconstructio n
packages including the event display (B. Viren)
Built BNL physics department co-operative computing clust er ⇒
significant MINOS reconstruction and analysis computing
capabilities locally at BNL (B. Viren).
MINOS data analysis:
νe analysis group co-leader (M. Diwan)
νe analysis software framework development (M. Dierckxsens)
Mary Bishai, BNL 9 – p.9/40
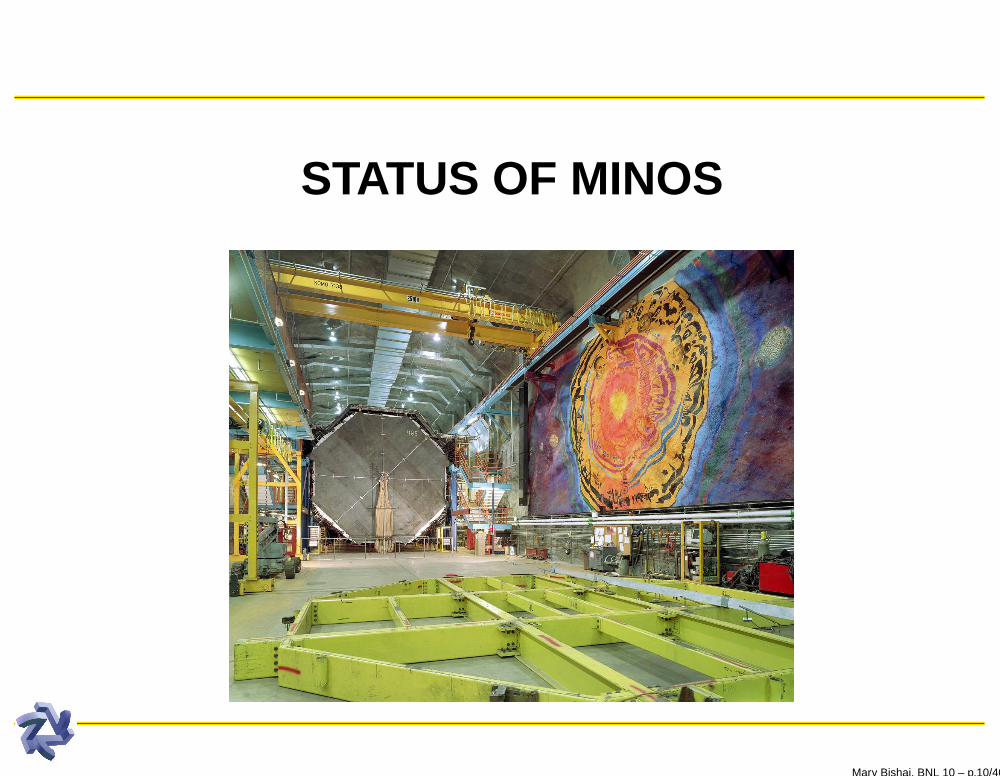
STATUS OF MINOS
Mary Bishai, BNL 10 – p.10/40

NuMI Beamline PerformancePlot from offline beam data logging by Brett Viren, BNL:
Date (2005)11/27 12/27 01/26 02/25 03/27 04/26
Date (2005)11/27 12/27 01/26 02/25 03/27 04/26
Proto
ns pe
r Spil
l (1E1
2)
0
5
10
15
20
25
30
35
40
45
50
NuMI Protons
Total
Deli
vere
d Pro
tons (
1E17
)
0
1
2
3
4
5
6
7
8
9
10
Brett Viren, 2005/04/25
Wed March 23: target vacuum compromised. Cooling water in target enclosure.
Mary Bishai, BNL 11 – p.11/40
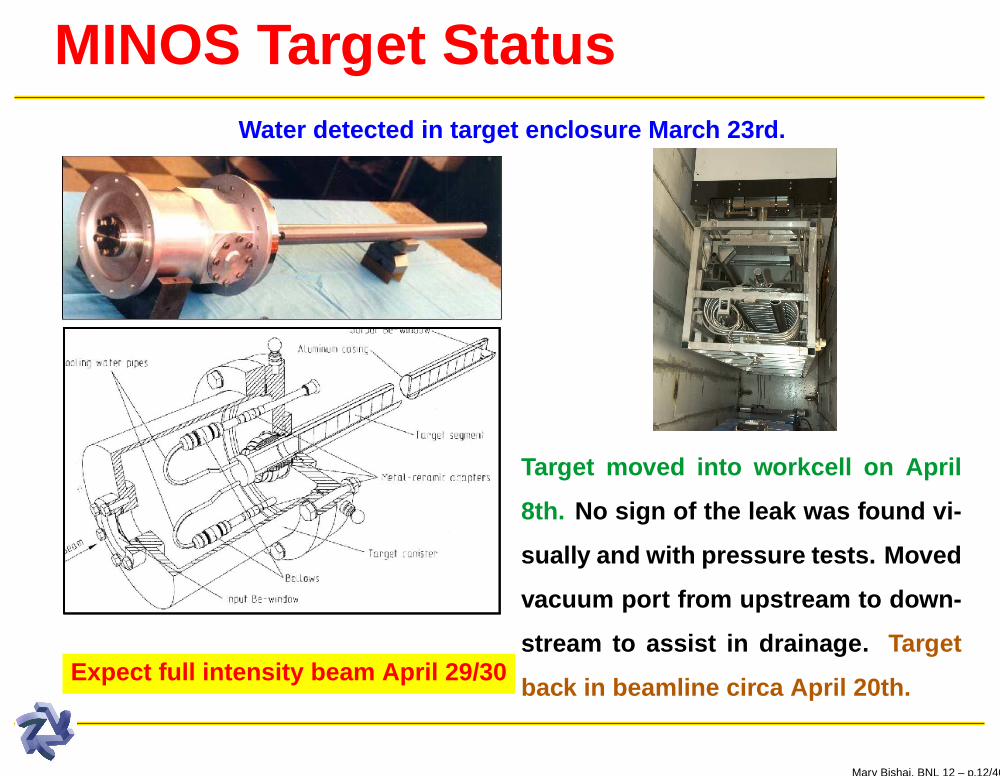
MINOS Target StatusWater detected in target enclosure March 23rd.
Expect full intensity beam April 29/30
Target moved into workcell on April
8th. No sign of the leak was found vi-
sually and with pressure tests. Moved
vacuum port from upstream to down-
stream to assist in drainage. Target
back in beamline circa April 20th.
Mary Bishai, BNL 12 – p.12/40
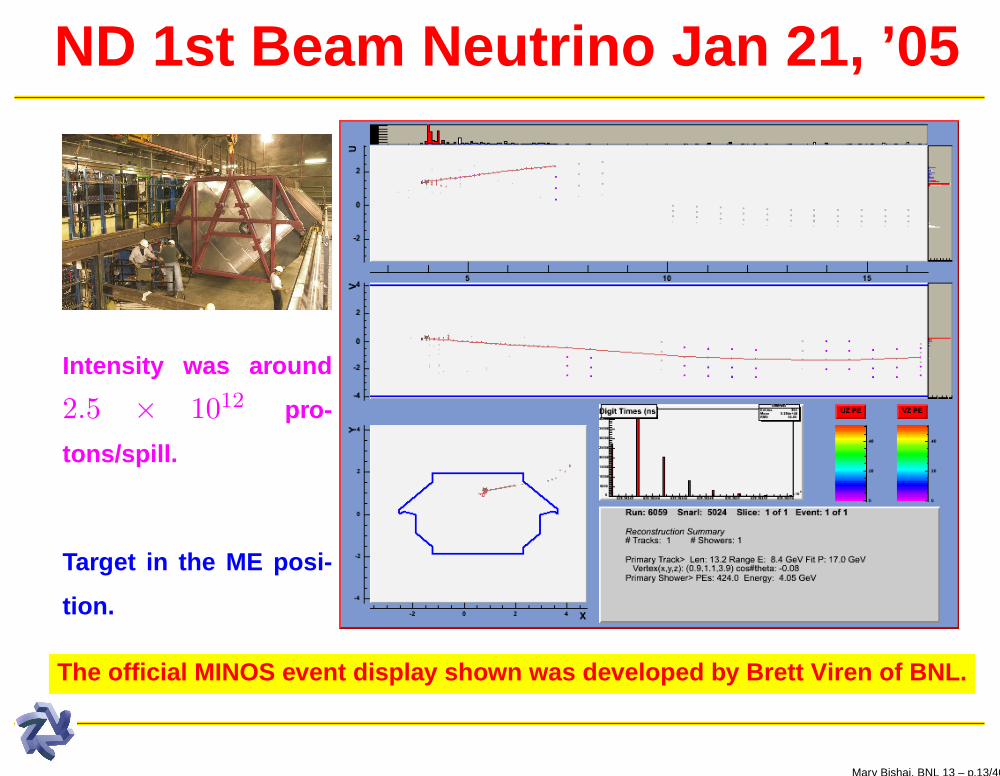
ND 1st Beam Neutrino Jan 21, ’05
Intensity was around
2.5 × 10¹² pro-
tons/spill.
Target in the ME posi-
tion.
The official MINOS event display shown was developed by Brett Viren of BNL.
Mary Bishai, BNL 13 – p.13/40

ND Lots and Lots of νs
At 2.5 × 10¹³ p/spill
Target is in ME position.
ND scintillator readout has
19ns resolution (same as
bunch length).
Timing information is used to
separate events.
Event display is a critical com-
ponent of MINOS reconstruc-
tion.
Run: 6578 Snarl: 118 All 21 Slices
Reconstruction Summary Tracks: 16 Showers: 15
AltTimeHistEntries 6689Mean 0RMS 0Underflow 0Overflow 1.146e+06
507.388 507.39 507.392 507.394 507.396 507.398 507.4 507.402 507.404
610×
-1
-0.5
0
0.5
1
AltTimeHistEntries 6689Mean 0RMS 0Underflow 0Overflow 1.146e+06
U
-4
-2
0
2
4
V
-4
-2
0
2
40 5 10 15
Y
-4
-2
0
2
4
X-2 0 2 4
0
50
100
0
50
100
UZ PE VZ PETimeHist
Entries 6689Mean 8.373e+08RMS 2900Underflow 0Overflow 0
837.332 837.334 837.336 837.338 837.34 837.342 837.344 837.346 837.348
610×
0
50
100
150
200
250
300
310× TimeHistEntries 6689Mean 8.373e+08RMS 2900Underflow 0Overflow 0
Mary Bishai, BNL 14 – p.14/40

1st FD Beam Neutrino, March 7 ’05
Mary Bishai, BNL 15 – p.15/40

Far Detector Beam Neutrino #2
Mary Bishai, BNL 16 – p.16/40
HIGHLIGHTS FROM BNL
CONTRIBUTIONS TO MINOS
Mary Bishai, BNL 17 – p.17/40
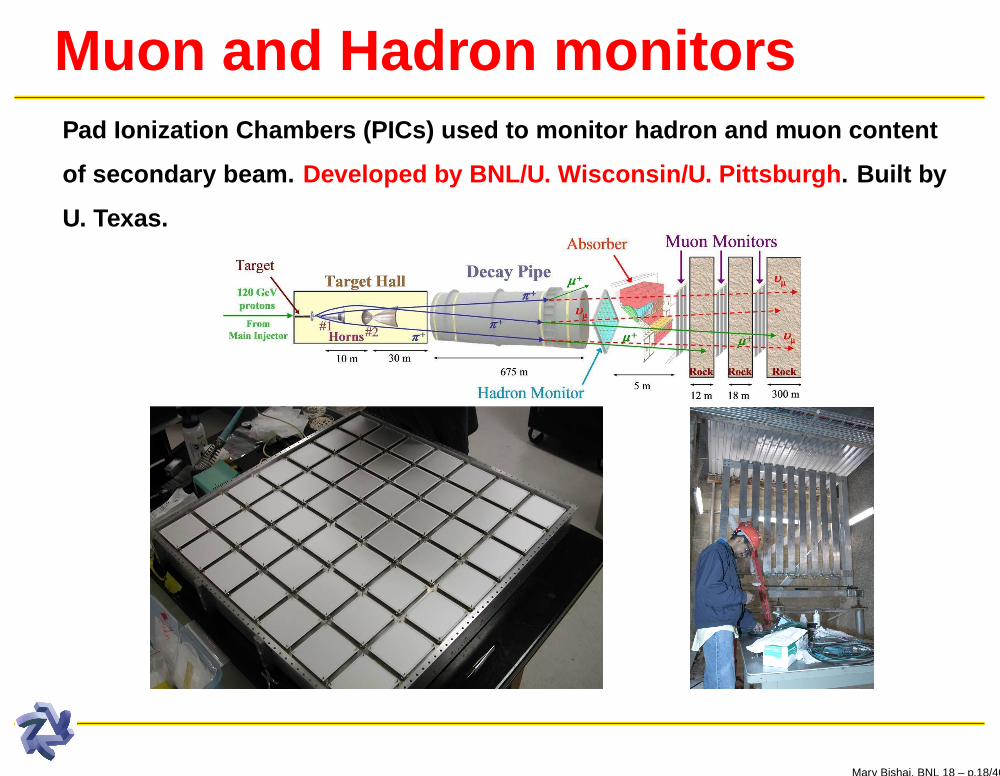
Muon and Hadron monitorsPad Ionization Chambers (PICs) used to monitor hadron and muo n content
of secondary beam. Developed by BNL/U. Wisconsin/U. Pittsburgh . Built by
U. Texas.
Mary Bishai, BNL 18 – p.18/40
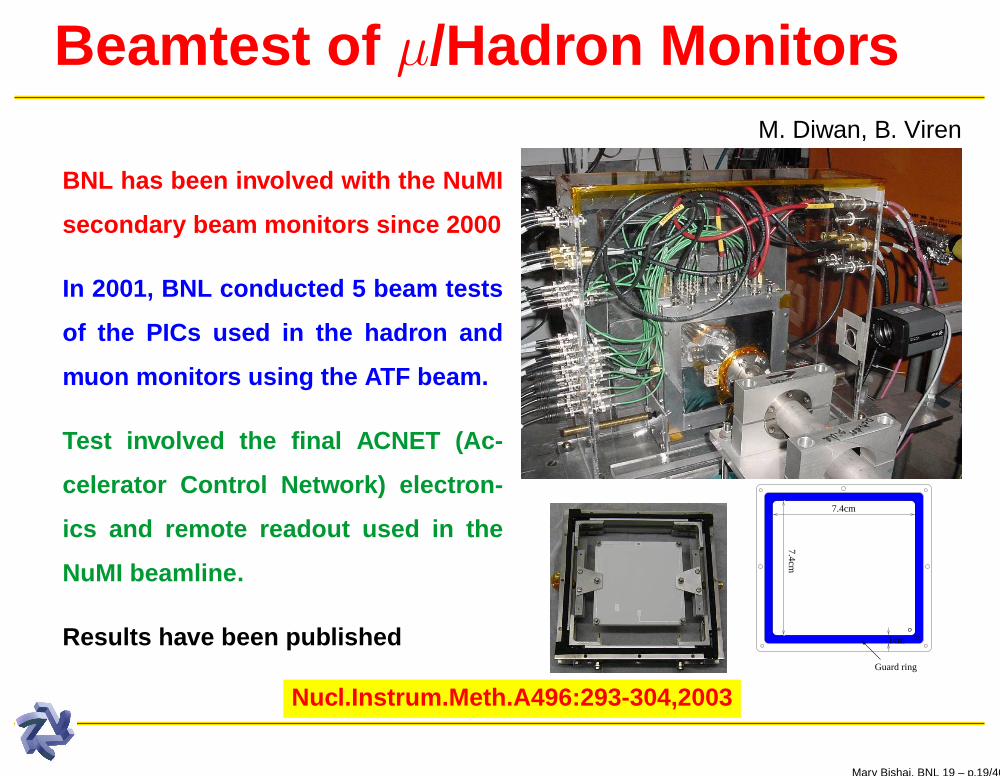
Beamtest of µ/Hadron MonitorsM. Diwan, B. Viren
BNL has been involved with the NuMI
secondary beam monitors since 2000
In 2001, BNL conducted 5 beam tests
of the PICs used in the hadron and
muon monitors using the ATF beam.
Test involved the final ACNET (Ac-
celerator Control Network) electron-
ics and remote readout used in the
NuMI beamline.
Results have been published 1cm
7.4cm
7.4cm
Guard ring
Nucl.Instrum.Meth.A496:293-304,2003
Mary Bishai, BNL 19 – p.19/40

First beam in NuMI using JAS!M. Bishai
On December 3rd, 2004 the Java Anal-
ysis Studio (JAS) NuMI Monitor devel-
oped by BNL displayed the first pro-
ton beam in NuMI at the hadron moni-
tor on the 12th pulse
The JAS monitor was crucial during NuMI commisioning.
Mary Bishai, BNL 20 – p.20/40
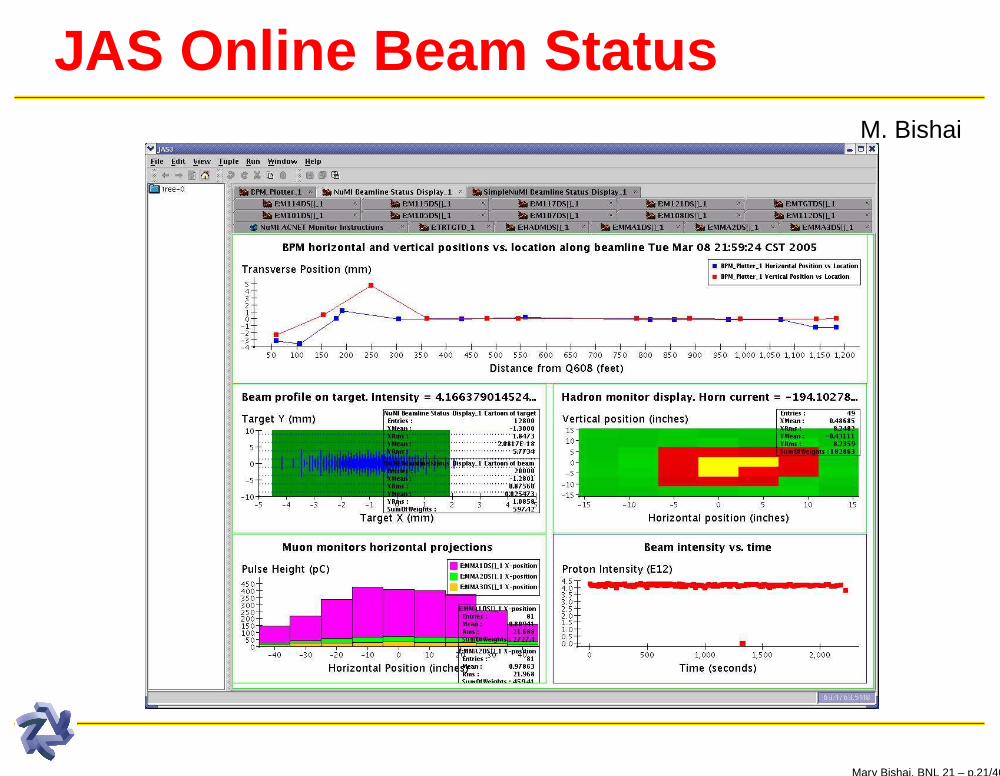
JAS Online Beam StatusM. Bishai
Mary Bishai, BNL 21 – p.21/40

NuMI beam data loggingB. Viren
Beam data is needed for beam systematics studies and flux norm alization.
There are three main MINOS
datastreams: ND, FD and
beam instrumentation .
The BeamData process, written
using PYTHON, logs data from
≈ 400 NuMI beamline devices
using the XML-RPC server →MI-
NOS data stream.
Mary Bishai, BNL 22 – p.22/40

NuMI offline beam data analysisM. Bishai
This is the first horizontal low intensity proton beam target scan taken on
Jan 21st, 2005. Detailed offline analysis first done by M. Bish ai using the
offline beamdata logged by the BeamData process:
Horizontal target position scan
-15 -10 -5 0 5 10 150
5000
10000
15000
20000
25000
Horizontal position at target center (mm)
Had
ron
Mon
. tot
al P
.H./B
eam
Inte
nsity
(m
V/E
12)
All data using PM to extrapolate to target
Run 6067
Run 6068
Pulse height in hadron monitor is maximum when beam is passin g between target and protection baffle.
Mary Bishai, BNL 23 – p.23/40
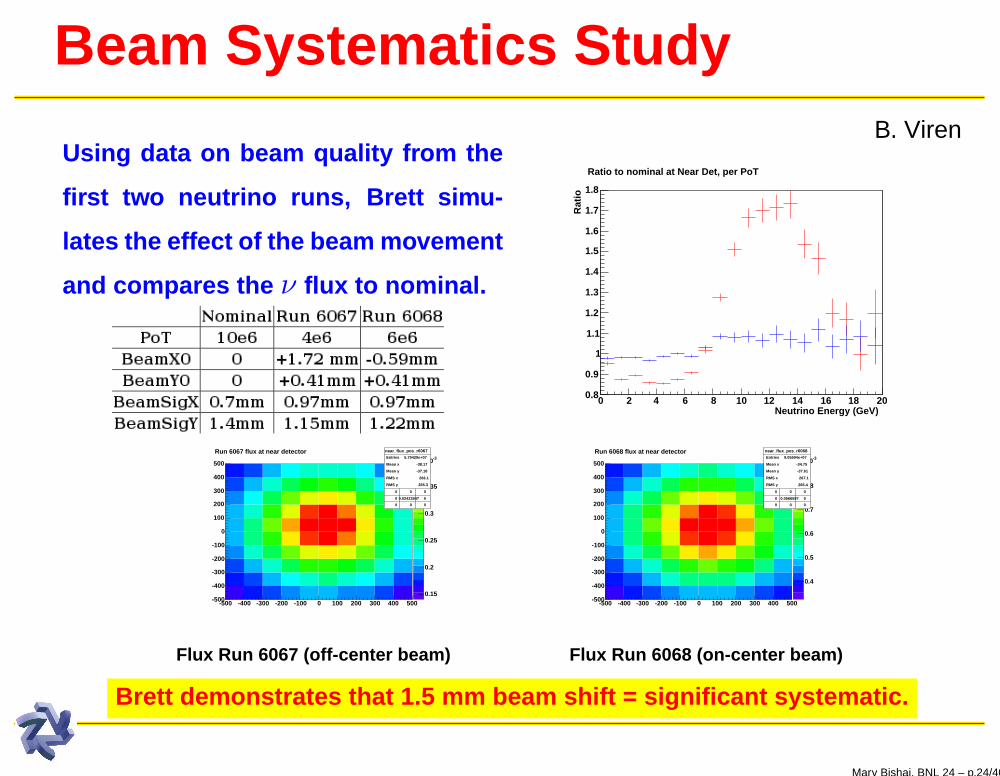
Beam Systematics StudyB. Viren
Using data on beam quality from the
first two neutrino runs, Brett simu-
lates the effect of the beam movement
and compares the ν flux to nominal.
Neutrino Energy (GeV)0 2 4 6 8 10 12 14 16 18 20
Rat
io
0.8
0.9
1
1.1
1.2
1.3
1.4
1.5
1.6
1.7
1.8
Ratio to nominal at Near Det, per PoTRatio to nominal at Near Det, per PoT
0.15
0.2
0.25
0.3
0.35
-310×
-500 -400 -300 -200 -100 0 100 200 300 400 500-500
-400
-300
-200
-100
0
100
200
300
400
500
Run 6067 flux at near detector near_flux_pos_r6067
Entries 5.79429e+07
Mean x -38.17
Mean y -37.18
RMS x 266.1
RMS y 265.3
0 0 0
0 0.02423947 0
0 0 0
Run 6067 flux at near detector
0.4
0.5
0.6
0.7
0.8
-310×
-500 -400 -300 -200 -100 0 100 200 300 400 500-500
-400
-300
-200
-100
0
100
200
300
400
500
Run 6068 flux at near detector near_flux_pos_r6068
Entries 9.05694e+07
Mean x -34.75
Mean y -37.61
RMS x 267.1
RMS y 266.4
0 0 0
0 0.0566597 0
0 0 0
Run 6068 flux at near detector
Flux Run 6067 (off-center beam) Flux Run 6068 (on-center bea m)
Brett demonstrates that 1.5 mm beam shift = significant syste matic.
Mary Bishai, BNL 24 – p.24/40

Preliminary ND rate studiesM. Dierckxsens
t(nearDAQ) - t(beamtime)-0.05 -0.04 -0.03 -0.02 -0.01 00
10
20
30
40
50
60
70
80
Time difference near - beam timedifEntries 1507Mean -0.01951RMS 0.002603
Time difference near - beam
Difference between ND and beamline timestamps
BNL pioneers matching beam con-
ditions with near detector data on a
spill-by-spill data using GPS times-
tamps.
First detailed study of ND rates vs POT:
Protons on Target/spill (1E12)0 5 10 15 20 25
Inte
ract
ions
/spi
ll
0
5
10
15
20
25
0
10
20
30
40
50
60
70
80
90
100
Mark Dierckxsens, 2005/03/18
MINOS preliminaryNear Detector
Reconstructed Interactions versus Protons on Target per Spill
<POT> (10E12)0 5 10 15 20 25
<# tr
acks
/sna
rl>
0
2
4
6
8
10
12
14
/ ndf 2χ 4.089 / 5p0 0.001275± -0.02499 p1 0.008499± 0.4458
/ ndf 2χ 4.089 / 5p0 0.001275± -0.02499 p1 0.008499± 0.4458
Mark Dierckxsens, 2005/03/17
/ ndf 2χ 0 / 0p0 0.03356± 0.455 p1 0.01214± 0.3932
/ ndf 2χ 0 / 0p0 0.03356± 0.455 p1 0.01214± 0.3932
Number of ν interactions vs POT Average #tracks/POT data and MC
Mary Bishai, BNL 25 – p.25/40

BNL MINOS GOALS/REQUIREMENTS
Mary Bishai, BNL 26 – p.26/40

Near Term GoalsBeamline monitoring and data logging:
Develop JAS program into a beam quality alarm system.
Integrate beam data histograms into online MINOS shift fram ework.
Spill-by-spill beam conditions in MINOS ntuples and databas es.
Physics goals:
Set new ν oscillation limits using observed rate in the ND as a short
baseline experiment.
νe reconstruction in the near detector.
Publications:
Joint NIM publication on NuMI beamline commisioning. BNL, U .
Texas at Austin and FermiLab.
Mary Bishai, BNL 27 – p.27/40

Summary & ConclusionsBNL’s long term MINOS goals are:
1. Normalization of the ν rate using beam data.
2. Searching for νe appearance in the far detector.
BNL has been a leading contributor to the MINOS effort since 2 000,
particularly in developing the beamline instrumentation a nd beam data
monitoring and logging software.
With the addition of two more BNL collaborators last year, we h ave also
taken a leading role in MINOS database development and manag ement and
beam data online monitoring and analysis.
BNL has pioneered matching beam conditions with near detect or data to
study ND neutrino rates. Lots of work done and lots more to do!
Mary Bishai, BNL 28 – p.28/40

BACKUP
Mary Bishai, BNL 29 – p.29/40

The Far Detector
8m × 2.54 cm thick Fe plates
4.1 × 1 × 800 cm scintillator
strips with WLS fiber readout
Toroidal B-field, 1.3 T at r = 2m
Cosmic µ veto shield
486 layers ⇒ 5.4kTon
Mary Bishai, BNL 30 – p.30/40

The Near Detector
Calorimeter region
Spectrometer region
Mary Bishai, BNL 31 – p.31/40

NuMI Primary Beamline
Mary Bishai, BNL 32 – p.32/40
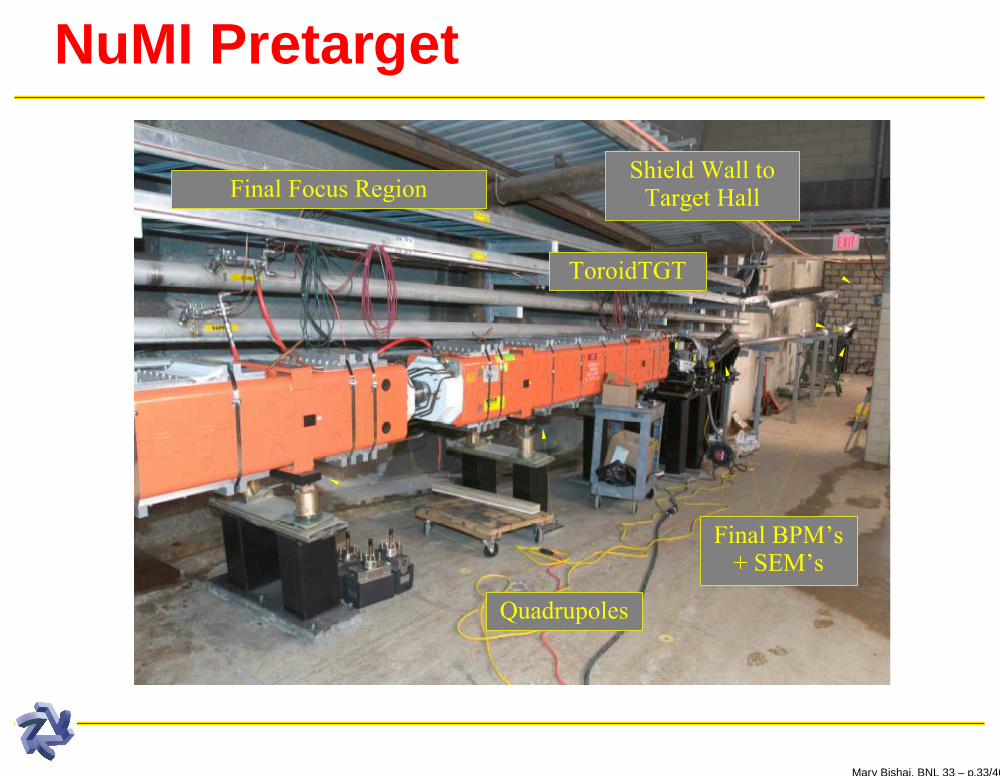
NuMI Pretarget
Mary Bishai, BNL 33 – p.33/40
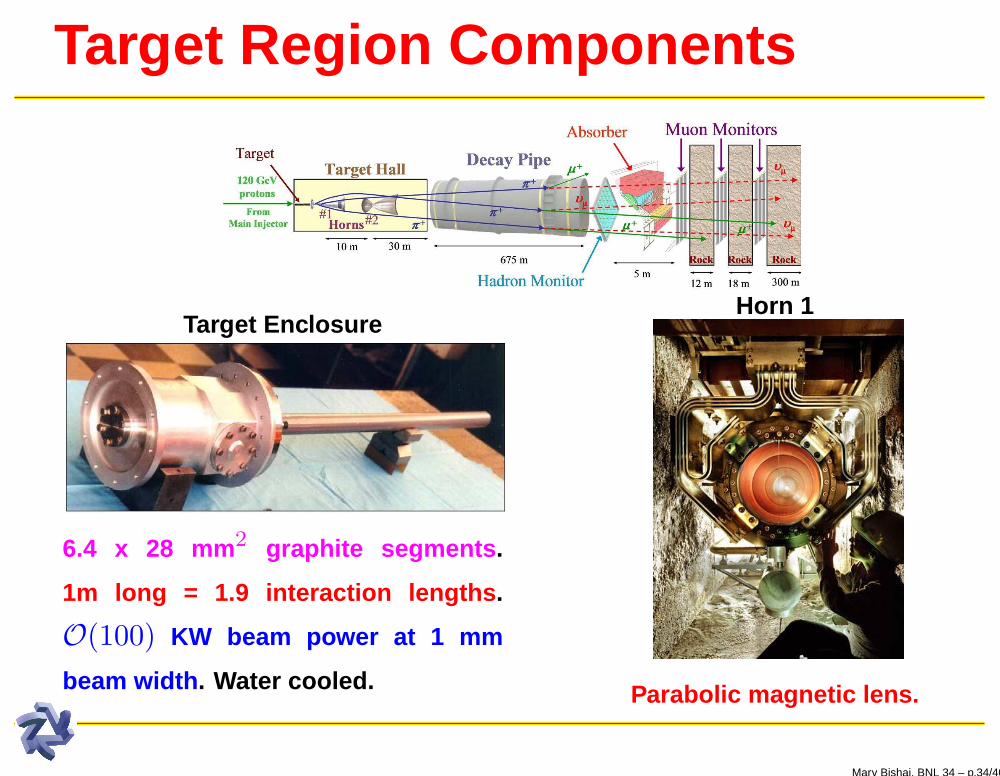
Target Region Components
Target Enclosure
6.4 x 28 mm 2 graphite segments .
1m long = 1.9 interaction lengths .
O(100) KW beam power at 1 mm
beam width . Water cooled.
Horn 1
Parabolic magnetic lens.
Mary Bishai, BNL 34 – p.34/40
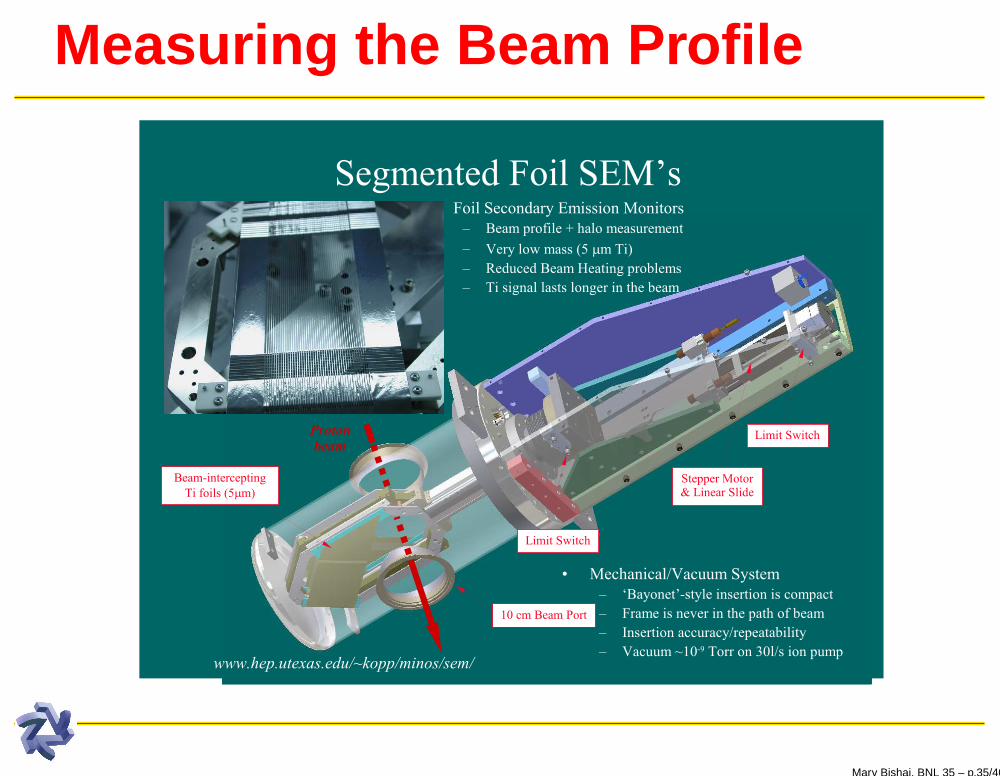
Measuring the Beam Profile
Mary Bishai, BNL 35 – p.35/40

Measuring the Beam Position
Characteristics of NuMI Beam Posi-
tion Monitors:
Software algorithm to search
400 µsec to find the beam.
NuMI bunches come in 6
batches from booster. Position
is measured batch by batch.
Linear over 15-20 mm. 50 µm
resolution.
BPMs used to auto-steer the beam to target center
Mary Bishai, BNL 36 – p.36/40

NuMI Beam Monitoring using JASM. Bishai
BNL has developed new online sophisticated monitoring soft ware for the
NuMI beamline instrumentation:
http://minos.phy.bnl.gov/˜bishai/minos/NuMIMon/
The software uses the JAVA Analysis Studio (JAS) package to monitor
NuMI beamline instrumentation data that is publicly availa ble through
FermiLab’s Accelerator Controls Division XMl-RPC webserver . Features
include:
Platform independent. Verified it runs under Windows XP, MAC, Li nux.
You can run it from any computer, any where ⇒ REMOTE MONITORING.
Mary Bishai, BNL 37 – p.37/40

Beam quality studies - exampleM. Bishai
Beam width at target should be 1mm but booster (?) instabilit ies cause
larger profiles:
Target beam profile , UTC timestamp = 1106417007.
Target beam profile, UTC timestamp = 1106420168.
Beam profile at PM101 vs PMTGT (Run 6068)
0.25 0.45 0.65 0.850.75
0.95
1.15
1.35
Horizontal width measured at PM101 (mm)
Hor
izon
tal w
idth
mea
sure
d at
PM
TG
T (
mm
)
Beam profile measured at target vs profile at Q101
Mary Bishai, BNL 38 – p.38/40
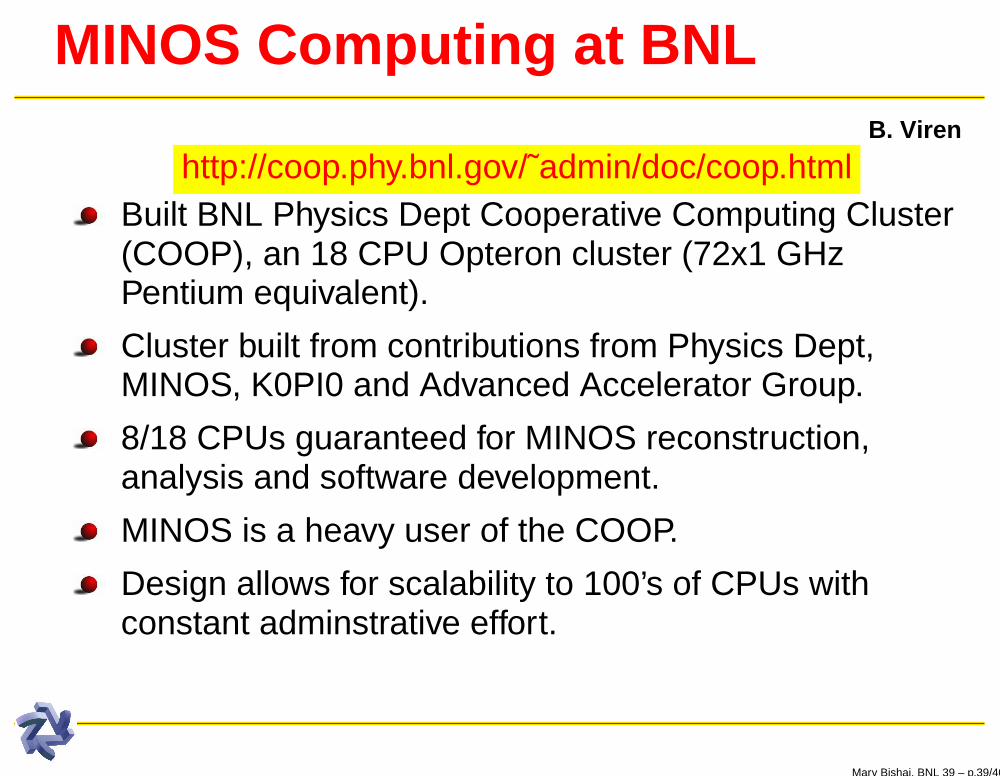
MINOS Computing at BNLB. Viren
http://coop.phy.bnl.gov/˜admin/doc/coop.htmlBuilt BNL Physics Dept Cooperative Computing Cluster(COOP), an 18 CPU Opteron cluster (72x1 GHzPentium equivalent).
Cluster built from contributions from Physics Dept,MINOS, K0PI0 and Advanced Accelerator Group.
8/18 CPUs guaranteed for MINOS reconstruction,analysis and software development.
MINOS is a heavy user of the COOP.
Design allows for scalability to 100’s of CPUs withconstant adminstrative effort.
Mary Bishai, BNL 39 – p.39/40
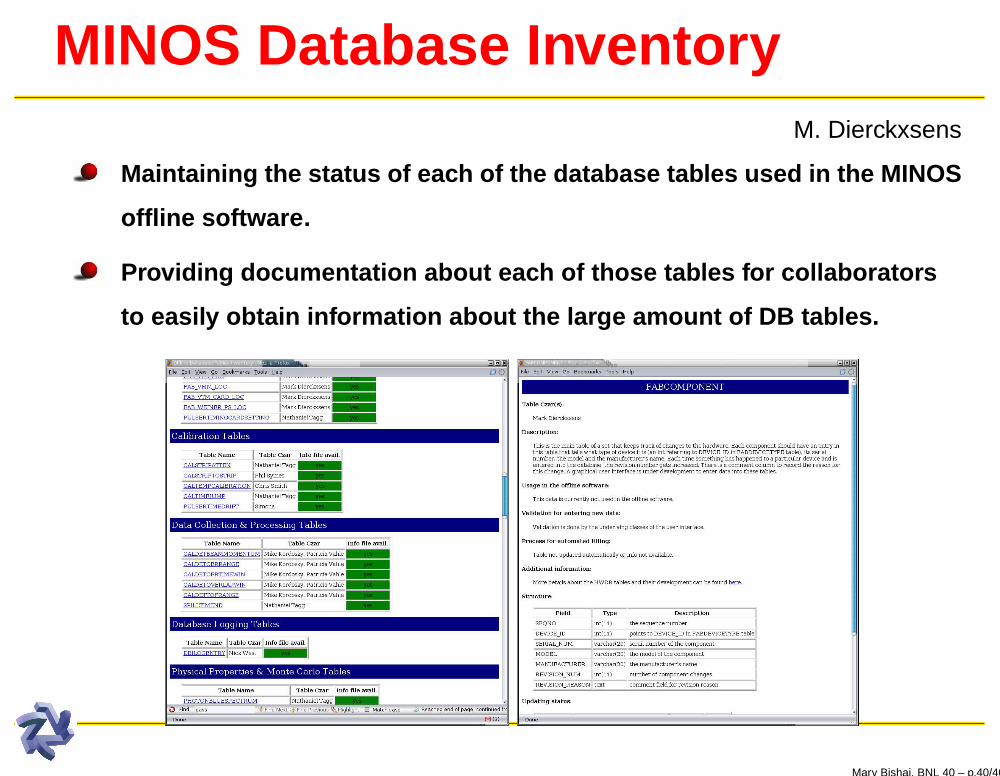
MINOS Database InventoryM. Dierckxsens
Maintaining the status of each of the database tables used in the MINOS
offline software.
Providing documentation about each of those tables for colla borators
to easily obtain information about the large amount of DB tab les.
Mary Bishai, BNL 40 – p.40/40


