
Statistical ProcessStatistical ProcessControl (SPC)Control (SPC)Graduate School of BusinessGraduate School of BusinessUniversity of ColoradoUniversity of ColoradoBoulder, CO 80309-0419Boulder, CO 80309-0419
Professor Stephen Lawrence

Process Control ToolsProcess Control Tools
Process toolsProcess tools assess conditions in existing assess conditions in existing processes to detect problems that require processes to detect problems that require intervention in order to regain lost control.intervention in order to regain lost control.
Check sheetsCheck sheets Pareto analysisPareto analysis
Cause & effect diagramsCause & effect diagrams ScatterplotsScatterplots
HistogramsHistograms Control chartsControl charts
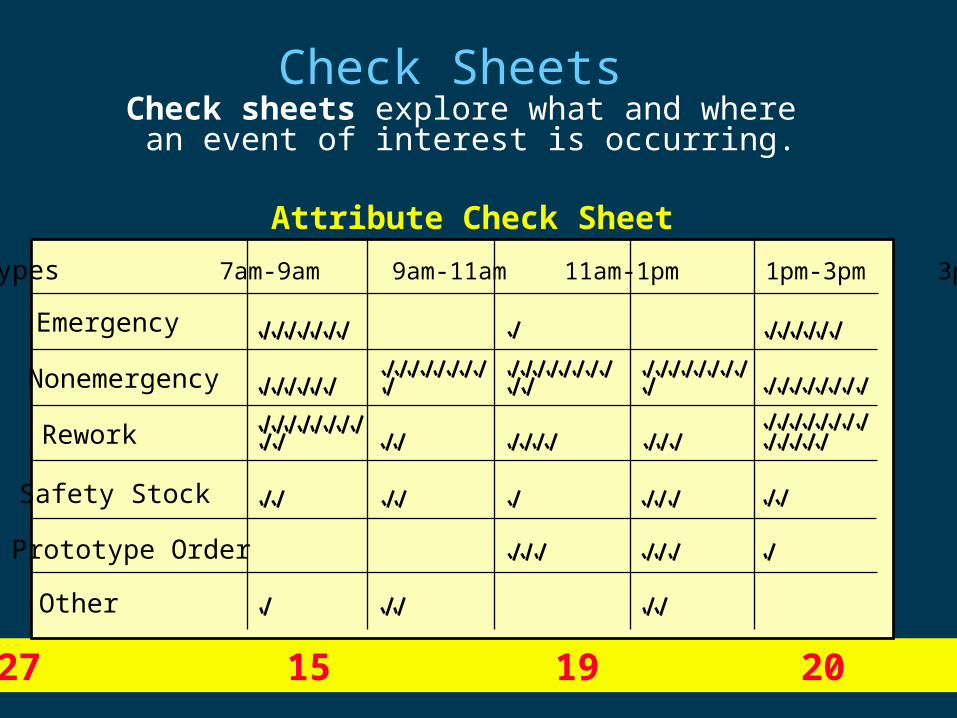
Check SheetsCheck sheets explore what and where
an event of interest is occurring.
Attribute Check Sheet
27 15 19 20 28
Order Types 7am-9am 9am-11am 11am-1pm 1pm-3pm 3pm-5-pm
Emergency
Nonemergency
Rework
Safety Stock
Prototype Order
Other

Run ChartsRun Charts
time
mea
sure
men
t

SCATTERPLOTSV
aria
ble
A
Variable B
x x x x x x xx x x x x xx x x x x x xx x xx x x x x xx x x x x x xx x x x xx xxx x x x x xx xx x x x x xx x x x xxx xx x x x x xxx x x xx x x xx xx x x x x x xx x x xxx xx xx xxx x x xx xxx x x x x x x xx x x x x x x xx x x xx x x xx x x x

PARETO ANALYSISA method for identifying and separating
the vital few from the trivial many. P
erce
nta
ge o
f O
ccu
rren
ces
Factor
AB
CD
E F G IH J

CAUSE & EFFECT DIAGRAMS
Employees
Proceduresand Methods
TrainingSpeed Maintenance
Equipment
Condition
ClassificationError
Inspection
BADCPU
Pins notAssigned
DefectivePins
ReceivedDefective
Damagedin storage
CPU Chip
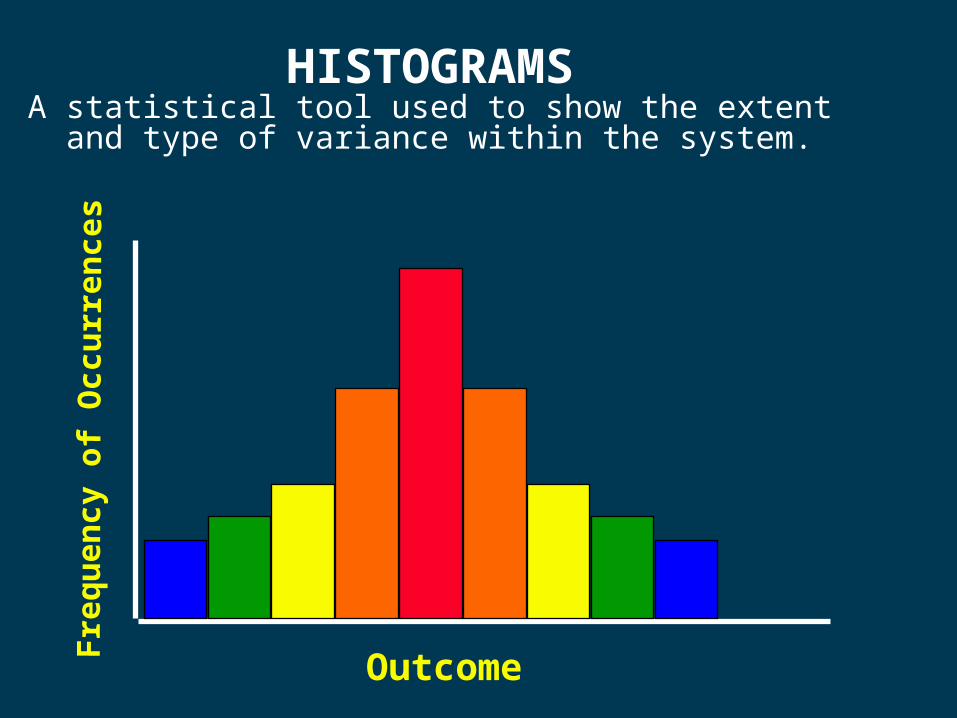
HISTOGRAMSA statistical tool used to show the extent and type of variance within the system.
Fre
qu
ency
of
Occ
urr
ence
s
Outcome

Deming’s Theory of VarianceDeming’s Theory of VarianceDeming’s Theory of VarianceDeming’s Theory of Variance
VariationVariation causes many problems for most processes causes many problems for most processes Causes of variation are either “common” or “special”Causes of variation are either “common” or “special” Variation can be either “controlled” or “uncontrolled”Variation can be either “controlled” or “uncontrolled” Management is responsible for most variationManagement is responsible for most variation
Management
Management
Management
EmployeeControlled Variation
Uncontrolled Variation
Common Cause Special Cause
Categories of Variation

Causes of VariationCauses of Variation
Natural Causes Assignable Causes
What prevents perfection?
Exogenous to processExogenous to process Not randomNot random ControllableControllable PreventablePreventable ExamplesExamples
– tool weartool wear
– ““Monday” effectMonday” effect
– poor maintenancepoor maintenance
Inherent to processInherent to process RandomRandom Cannot be controlledCannot be controlled Cannot be preventedCannot be prevented ExamplesExamples
– weatherweather
– accuracy of measurementsaccuracy of measurements
– capability of machinecapability of machine
Process variation...

Product SpecificationProduct Specificationand Process Variationand Process Variation
Product specificationProduct specification– desired range of product attributedesired range of product attribute– part of product designpart of product design– length, weight, thickness, color, ...length, weight, thickness, color, ...– nominal specificationnominal specification– upper and lower specification limitsupper and lower specification limits
Process variabilityProcess variability– inherent variation in processesinherent variation in processes– limits what can actually be achievedlimits what can actually be achieved– defines and limits process defines and limits process capabilitycapability
Process may not be capable of meeting Process may not be capable of meeting specification!specification!

Process CapabilityProcess CapabilityLSL USLSpec

Process CapabilityProcess Capability Measure of capability of process to meet (fall within) Measure of capability of process to meet (fall within)
specification limitsspecification limits Take “width” of process variation as 6Take “width” of process variation as 6 If If 66 < (USL - LSL) < (USL - LSL), then at least , then at least 99.7%99.7% of output of of output of
process will fall within specification limitsprocess will fall within specification limits
LSL USLSpec

Process Capability RatioProcess Capability Ratio
Define Process Capability Ratio Cp as
CpUSL LSL
6
If If Cp > 1.0, Cp > 1.0, process is... process is... capablecapable If If Cp < 1.0, Cp < 1.0, process is... process is... not capablenot capable
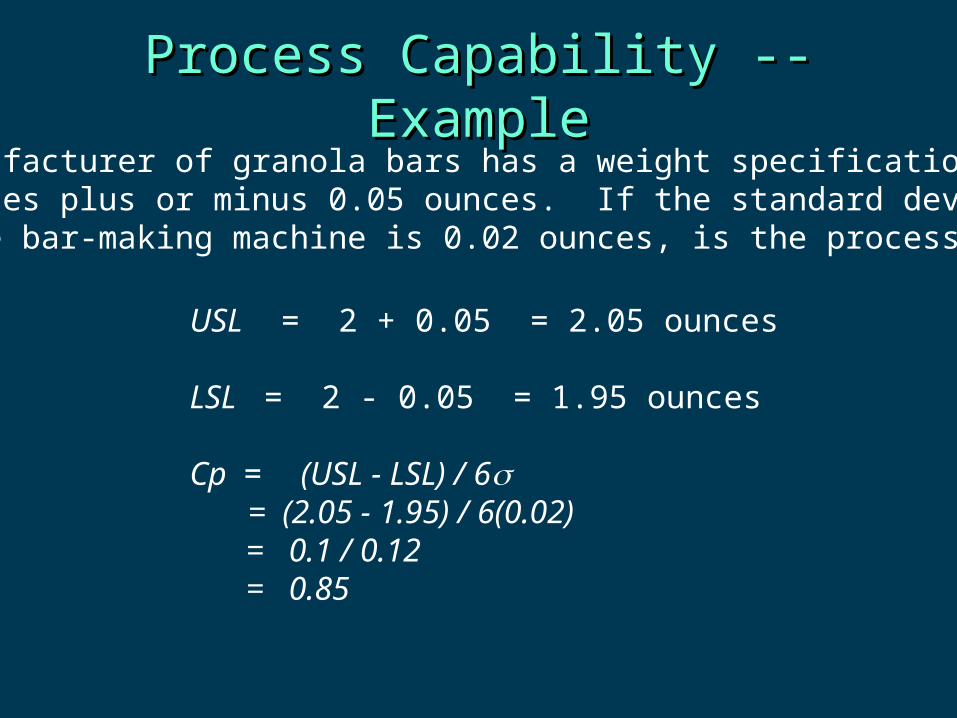
Process Capability -- ExampleProcess Capability -- ExampleA manufacturer of granola bars has a weight specification2 ounces plus or minus 0.05 ounces. If the standard deviationof the bar-making machine is 0.02 ounces, is the process capable?
USL = 2 + 0.05 = 2.05 ounces
LSL = 2 - 0.05 = 1.95 ounces
Cp = (USL - LSL) / 6 = (2.05 - 1.95) / 6(0.02)
= 0.1 / 0.12 = 0.85

Process CenteringProcess CenteringLSL USLSpec

Process Centering -- ExampleProcess Centering -- ExampleFor the granola bar manufacturer, if the process is incorrectly centered at 2.05 instead of 2.00 ounces, whatfraction of bars will be out of specification?
2.0LSL=1.95 USL=2.05
_____ of production will be out of specification!
Out of spec!

Process Capability Index Process Capability Index Cpk
3
,3
minUSLLSL
C pk
If If CCpkpk > 1.0, > 1.0, process is... process is... Centered & capableCentered & capable
If If CCpkpk < 1.0, < 1.0, process is... process is... Not centered &/or not capable Not centered &/or not capable
Mean
Std dev

Process Capability Index -- ExampleProcess Capability Index -- ExampleA manufacturer of granola bars has a weight specification2 ounces plus or minus 0.05 ounces. If the standard deviationof the bar-making machine is = 0.02 ounces and the process mean is = 2.01, what is the process capability index?
USL = 2.05 oz LSL = 1.95 ounces
Cpk = min[( -LSL) / 3(USL- ) / 3 = min[(–1.95) / 0.06(2.05 – 2.01) / 0.06 = min[1.0 0.67
= 0.67
Therefore, the process is not capable and/or not centered !

Process Control ChartsProcess Control Charts
EstablishEstablish capabilitycapability of process under of process under normalnormal conditionsconditions
Use normal process as benchmark to Use normal process as benchmark to statistically identify statistically identify abnormalabnormal process process behaviorbehavior
CorrectCorrect process when signs of abnormal process when signs of abnormal performance first begin to appearperformance first begin to appear
Control the process rather than inspect the Control the process rather than inspect the product!product!
Statistical technique for tracking a process anddetermining if it is going “out to control”

Upper Control Limit
Lower Control Limit
6
3
Target Spec
Process Control ChartsProcess Control Charts
Upper Spec Limit
Lower Spec Limit

UCL
Target
LCL
Time
Process Control ChartsProcess Control Charts
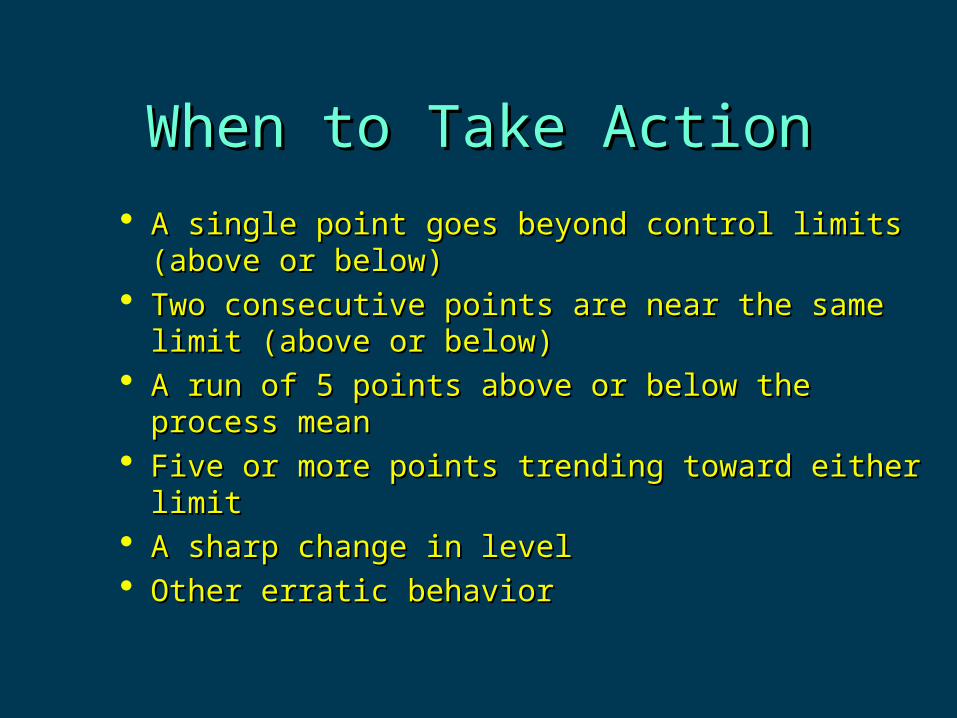
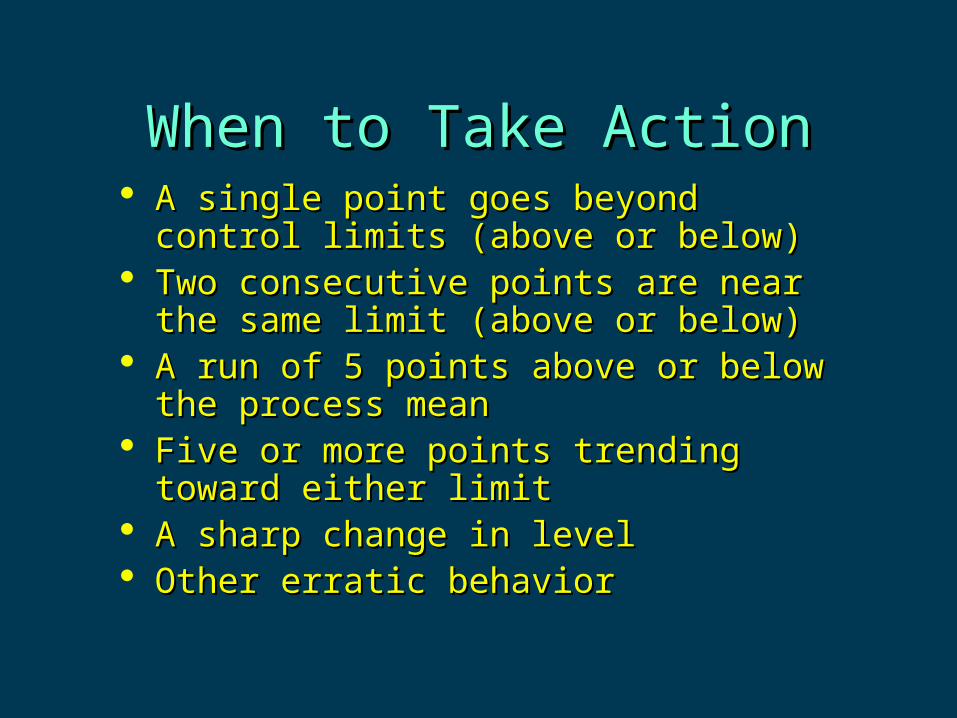
When to Take ActionWhen to Take Action
A single point goes beyond control limits A single point goes beyond control limits (above or below)(above or below)
Two consecutive points are near the same limit Two consecutive points are near the same limit (above or below)(above or below)
A run of 5 points above or below the process meanA run of 5 points above or below the process mean Five or more points trending toward either limitFive or more points trending toward either limit A sharp change in levelA sharp change in level Other erratic behaviorOther erratic behavior

Types of Control ChartsTypes of Control Charts
1.1. Attribute control chartsAttribute control charts– monitors frequency (proportion) of defectivesmonitors frequency (proportion) of defectives– p - p - chartscharts
2.2. Defects control chartsDefects control charts– monitors number (count) of defects per unitmonitors number (count) of defects per unit– c – c – chartscharts
3.3. Variable control chartsVariable control charts– monitors continuous variablesmonitors continuous variables– x-bar x-bar and and R R chartscharts
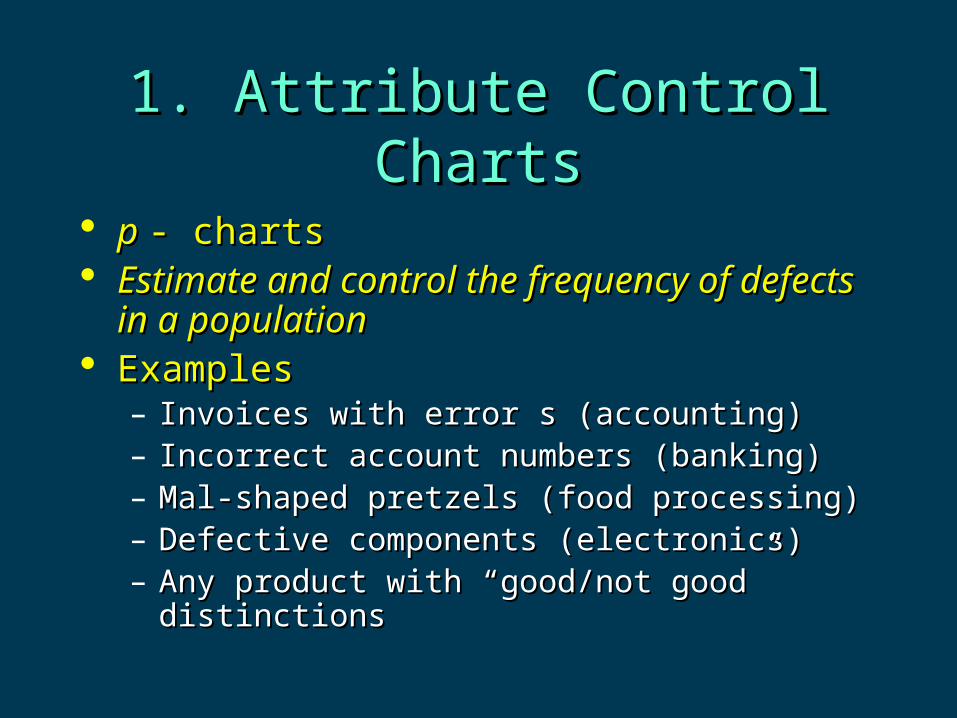
1. Attribute Control Charts1. Attribute Control Charts
p p - charts- charts Estimate and control the frequency of defects in a Estimate and control the frequency of defects in a
populationpopulation ExamplesExamples
– Invoices with error s (accounting)Invoices with error s (accounting)– Incorrect account numbers (banking)Incorrect account numbers (banking)– Mal-shaped pretzels (food processing)Mal-shaped pretzels (food processing)– Defective components (electronics)Defective components (electronics)– Any product with “good/not good” distinctionsAny product with “good/not good” distinctions

Using Using pp-charts-charts
Find long-run proportion defective (Find long-run proportion defective (p-barp-bar) ) when the process is when the process is in controlin control..
Select a standard sample size Select a standard sample size nn Determine control limitsDetermine control limits
p
p
pLCL
pUCL
3
3
n
ppp
)1(

2. Defect Control Charts2. Defect Control Charts
c-c-chartscharts Estimate & control the number of defects per unitEstimate & control the number of defects per unit ExamplesExamples
– Defects per square yard of fabricDefects per square yard of fabric
– Crimes in a neighborhoodCrimes in a neighborhood
– Potholes per mile of roadPotholes per mile of road
– Bad bytes per packetBad bytes per packet
– Most often used with continuous process (vs. batch)Most often used with continuous process (vs. batch)

Using Using cc-charts-charts
Find long-run proportion defective (Find long-run proportion defective (c-barc-bar) ) when the process is when the process is in controlin control..
Determine control limitsDetermine control limits
c
c
cLCL
cUCL
3
3
cc

3. Control Charts for Variables3. Control Charts for Variables
x-bar x-bar and R chartsand R charts Monitor the condition or state of continuously Monitor the condition or state of continuously
variable processesvariable processes Use to control continuous variablesUse to control continuous variables
– Length, weight, hardness, acidity, electrical resistanceLength, weight, hardness, acidity, electrical resistance ExamplesExamples
– Weight of a box of corn flakes (food processing)Weight of a box of corn flakes (food processing)– Departmental budget variances (accountingDepartmental budget variances (accounting– Length of wait for service (retailing)Length of wait for service (retailing)– Thickness of paper leaving a paper-making machineThickness of paper leaving a paper-making machine
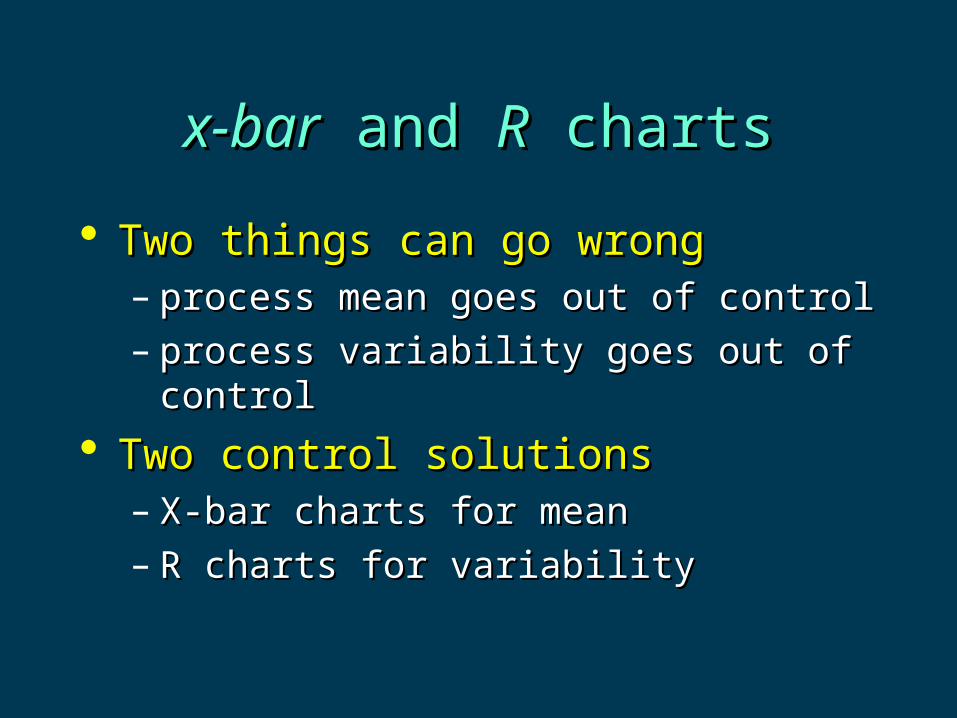
x-barx-bar and and RR charts charts
Two things can go wrongTwo things can go wrong– process mean goes out of controlprocess mean goes out of control– process variability goes out of controlprocess variability goes out of control
Two control solutionsTwo control solutions– X-bar charts for meanX-bar charts for mean– R charts for variabilityR charts for variability

Problems with Continuous VariablesProblems with Continuous Variables
Target
“Natural” ProcessDistribution Mean not
Centered
IncreasedVariability

Range (Range (RR) Chart) Chart
Choose sample size Choose sample size nn Determine average in-control sample ranges Determine average in-control sample ranges
R-barR-bar where where R=max-minR=max-min Construct Construct RR-chart with limits:-chart with limits:
nRR /
RDUCLRDLCL 43

Mean (x-bar) ChartMean (x-bar) Chart Choose sample size Choose sample size n n (same as for (same as for R-R-charts)charts) Determine average of in-control sample Determine average of in-control sample
means (means (x-double-barx-double-bar))– x-bar = x-bar = sample meansample mean– k = k = number of observations of number of observations of nn samples samples
Construct Construct x-barx-bar-chart with limits:-chart with limits:
kxx /
RAxLCLRAxUCL 22

x & R Chart Parametersx & R Chart Parametersn d(2) d(3) A(2) D(3) D(4)2 1.128 0.853 1.881 0.000 3.2693 1.693 0.888 1.023 0.000 2.5744 2.059 0.880 0.729 0.000 2.2825 2.326 0.864 0.577 0.000 2.1146 2.534 0.848 0.483 0.000 2.0047 2.704 0.833 0.419 0.076 1.9248 2.847 0.820 0.373 0.136 1.8649 2.970 0.808 0.337 0.184 1.81610 3.078 0.797 0.308 0.223 1.77711 3.173 0.787 0.285 0.256 1.74412 3.258 0.778 0.266 0.284 1.71616 3.532 0.750 0.212 0.363 1.63717 3.588 0.744 0.203 0.378 1.62218 3.640 0.739 0.194 0.391 1.60919 3.689 0.734 0.187 0.403 1.59720 3.735 0.729 0.180 0.414 1.58621 3.778 0.724 0.173 0.425 1.57522 3.819 0.720 0.167 0.434 1.56623 3.858 0.716 0.162 0.443 1.55724 3.895 0.712 0.157 0.452 1.54825 3.931 0.708 0.153 0.460 1.540
When to Take ActionWhen to Take Action A single point goes beyond control limits A single point goes beyond control limits
(above or below)(above or below) Two consecutive points are near the same limit Two consecutive points are near the same limit
(above or below)(above or below) A run of 5 points above or below the process A run of 5 points above or below the process
meanmean Five or more points trending toward either limitFive or more points trending toward either limit A sharp change in levelA sharp change in level Other erratic behaviorOther erratic behavior

Control Chart Error Trade-offsControl Chart Error Trade-offs Setting control limits too tight (e.g., Setting control limits too tight (e.g., ± 2 ± 2) means ) means
that normal variation will often be mistaken as an that normal variation will often be mistaken as an out-of-control condition out-of-control condition (Type I error).(Type I error).
Setting control limits too loose (e.g., Setting control limits too loose (e.g., ± 4 ± 4) means ) means that an out-of-control condition will be mistaken as that an out-of-control condition will be mistaken as normal variation normal variation (Type II error)(Type II error)..
Using Using control limits works well to balance Type I control limits works well to balance Type I and Type II errors in many circumstances.and Type II errors in many circumstances.


