
Statistical Decision Making

History of the Student’s t Distribution and the t Test
Guinness and statistics
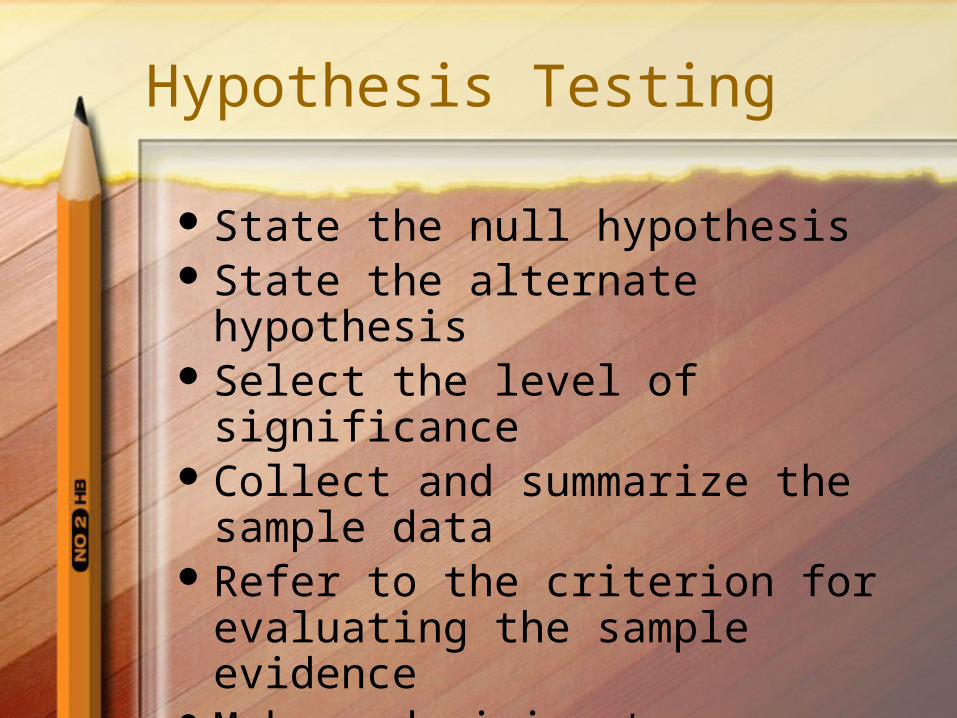
Hypothesis Testing
State the null hypothesisState the alternate hypothesisSelect the level of significanceCollect and summarize the sample
dataRefer to the criterion for evaluating
the sample evidenceMake a decision to discard/retain the
null hypothesis
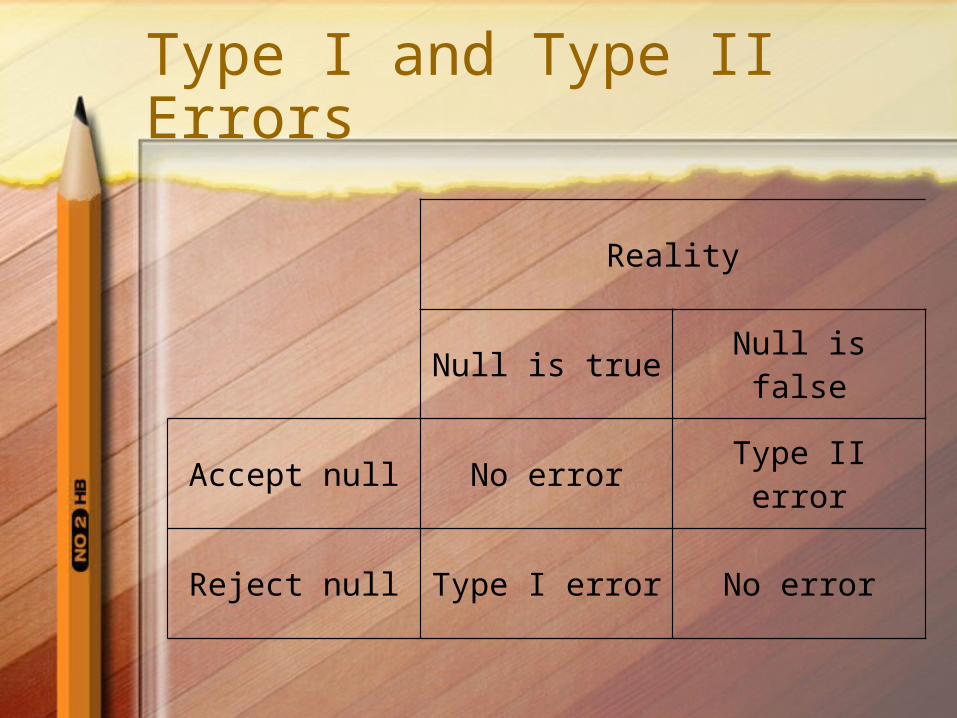
Type I and Type II Errors
Reality
Null is true Null is false
Accept null No error Type II error
Reject null Type I error No error
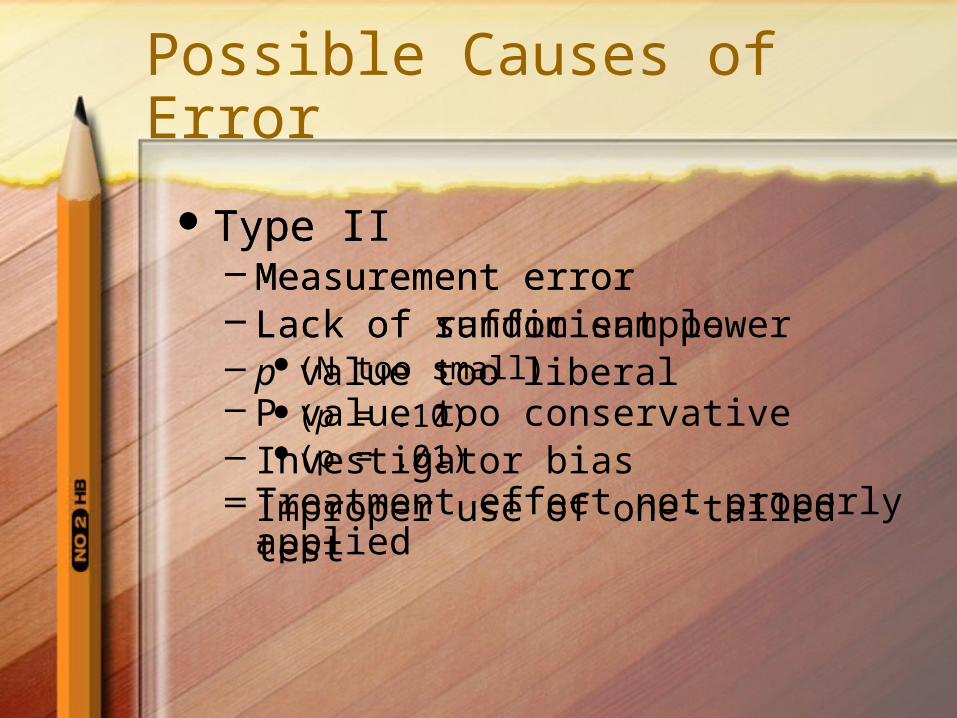
Possible Causes of Error
Type I– Measurement error– Lack of random sample– p value too liberal
(p = .10)– Investigator bias– Improper use of one-tailed test
Type II– Measurement error– Lack of sufficient power
(N too small)– P value too conservative
(p = .01)– Treatment effect not properly applied

The Alpha and p Levels
p value - probability with which the difference in means could occur by chance
Alpha () level - p value set prior to the experiment
Indication of risk willing to take in making a wrong decision to reject the null hypothesis
Smaller p values do not indicate greater importance of findings– Only indicates a smaller probability that the
findings occurred by chance

Two-Tailed Test
When direction of outcome is uncertain we use the null hypothesis
Ho is tested with a two-tailed test If t does not reach p = .05, we know
sample mean falls within the normal curve that includes 95% of all possible differences– Accept Ho with a 5% chance of being wrong– 5% rejection area divided between the 2 tails
of the curve Each area is 2.5% of the area under the curve

One-Tailed Test
Use when direction of difference is know– Not sure what the size
of difference is Most likely trying to
test H1 Difference to be
tested is always positive– Only use positive side
of normal curve
Why Use Statistical Decision Making?
Make decisions about differences between groups
Not necessarily that the 2 groups are different from each other
Did the two groups come from different populations?
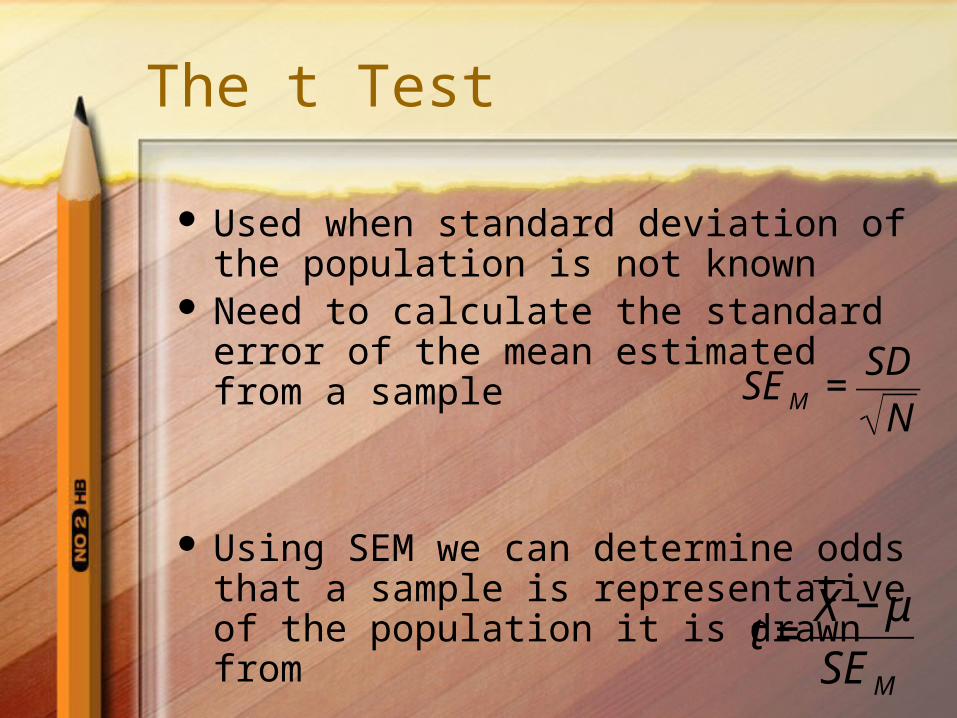
The t Test
Used when standard deviation of the population is not known
Need to calculate the standard error of the mean estimated from a sample
Using SEM we can determine odds that a sample is representative of the population it is drawn from €
SEM =SD
N
€
t =X −μ
SEM
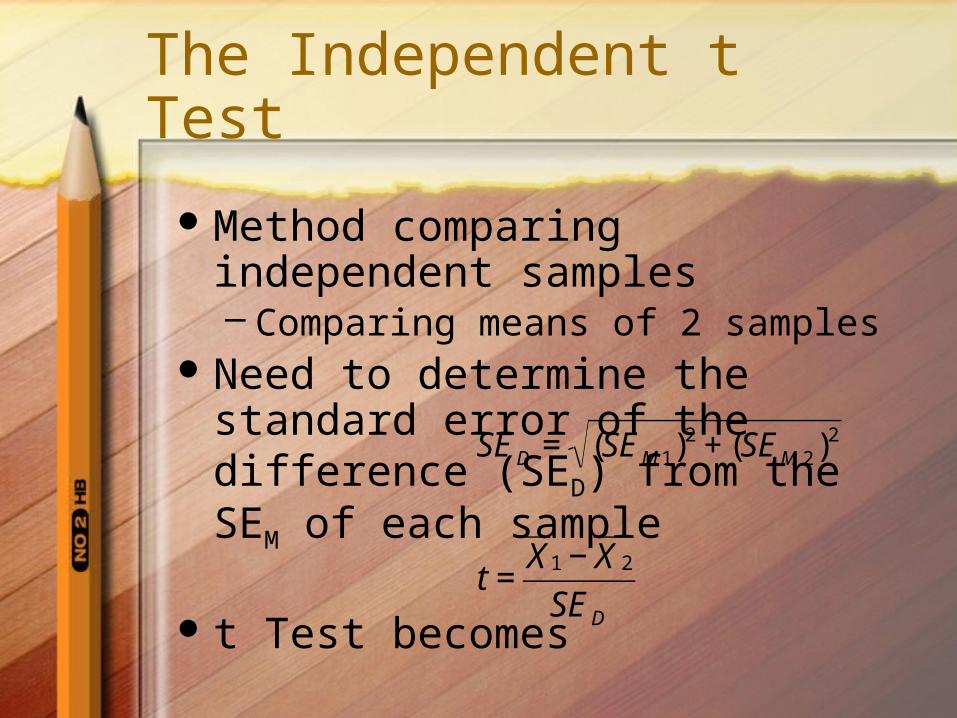
The Independent t Test
Method comparing independent samples– Comparing means of 2 samples
Need to determine the standard error of the difference (SED) from the SEM of each sample
t Test becomes€
SED = (SEM 1)2 + (SEM 2)2
€
t =X1 − X 2
SED
Independent t Test
Software packagesCalculate t value and p value
– p typically = .05 as standard for rejecting null hypothesis5 times in 100
Assumptions for the t Test
t Test produces reasonably reliable results– Robust measure
4 assumptions– Population from which sample are drawn is
normally distributed– Sample or samples are randomly selected from the
population– Homogeneity of variance
Variance of one group should not be more than twice as large as the variance of the other
– Data must be parametric Interval or ratio measurement scale
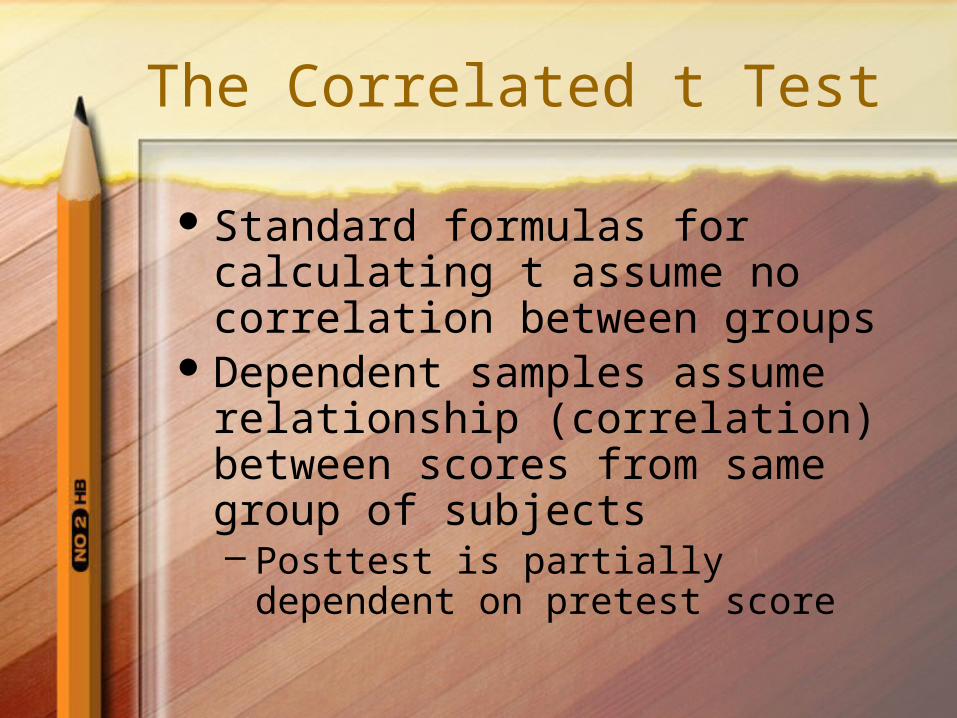
The Correlated t Test
Standard formulas for calculating t assume no correlation between groups
Dependent samples assume relationship (correlation) between scores from same group of subjects– Posttest is partially dependent on pretest
score
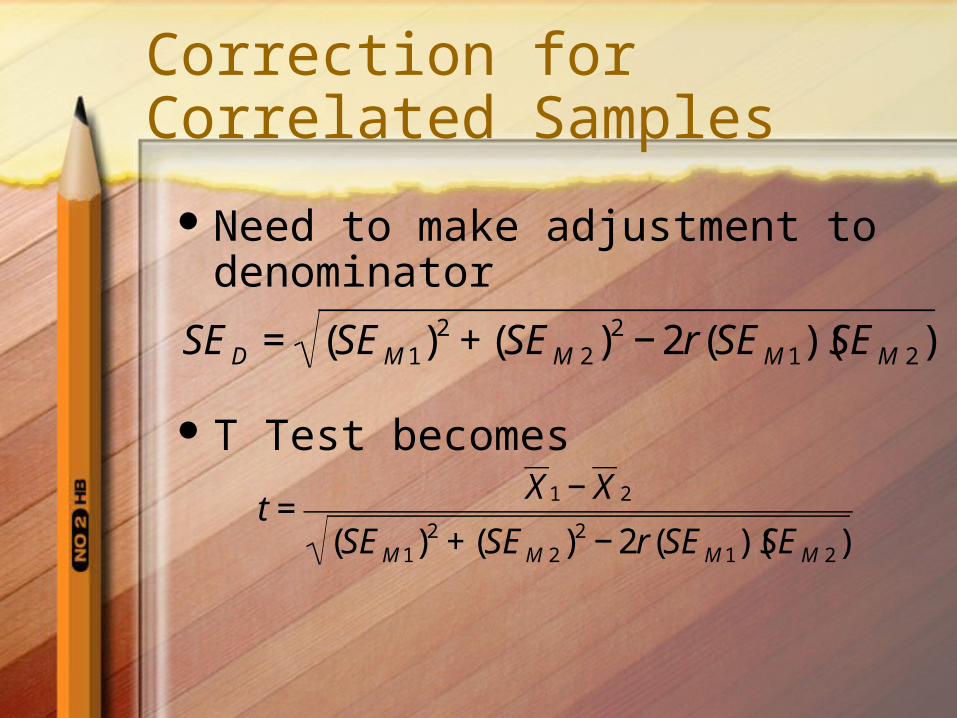
Correction for Correlated Samples
Need to make adjustment to denominator
T Test becomes
€
SED = (SEM 1)2 + (SEM 2)2 − 2r(SEM 1)(SEM 2)
€
€
t =X1 − X 2
(SEM 1)2 + (SEM 2)2 − 2r(SEM 1)(SEM 2)
Reading the Statistical Output
Figure 12-2– Independent t Test
Figure 12-3– Dependent t Test
Paired samples

Statistical Power
Power - Ability of a test to correctly reject a false null hypothesis
Since critical t values are lower for one-tailed test, it is considered more powerful at a given p value
1- is area of power

Power
Power is dependent on 4 factors– Z level set by researcher– The difference between the 2 means
being compared– The standard deviation of the 2 groups
Determines the spread of the curve– The sample size (N) of the 2 groups
Only N and Z are under your control
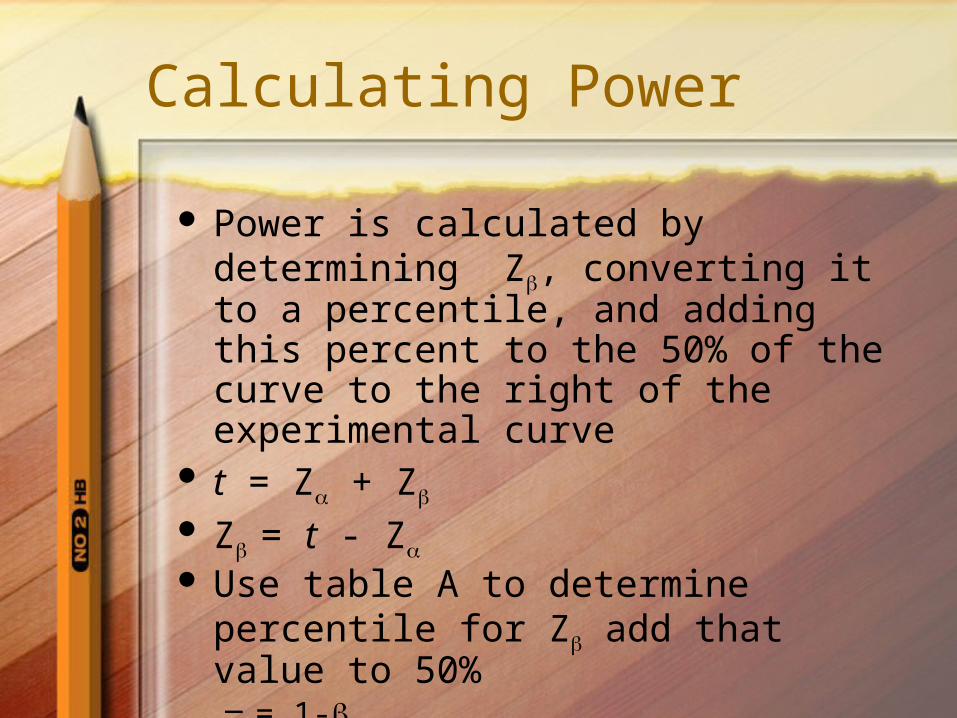
Calculating Power
Power is calculated by determining Z, converting it to a percentile, and adding this percent to the 50% of the curve to the right of the experimental curve
t = Z + Z
Z = t - Z
Use table A to determine percentile for Z add that value to 50%– = 1-
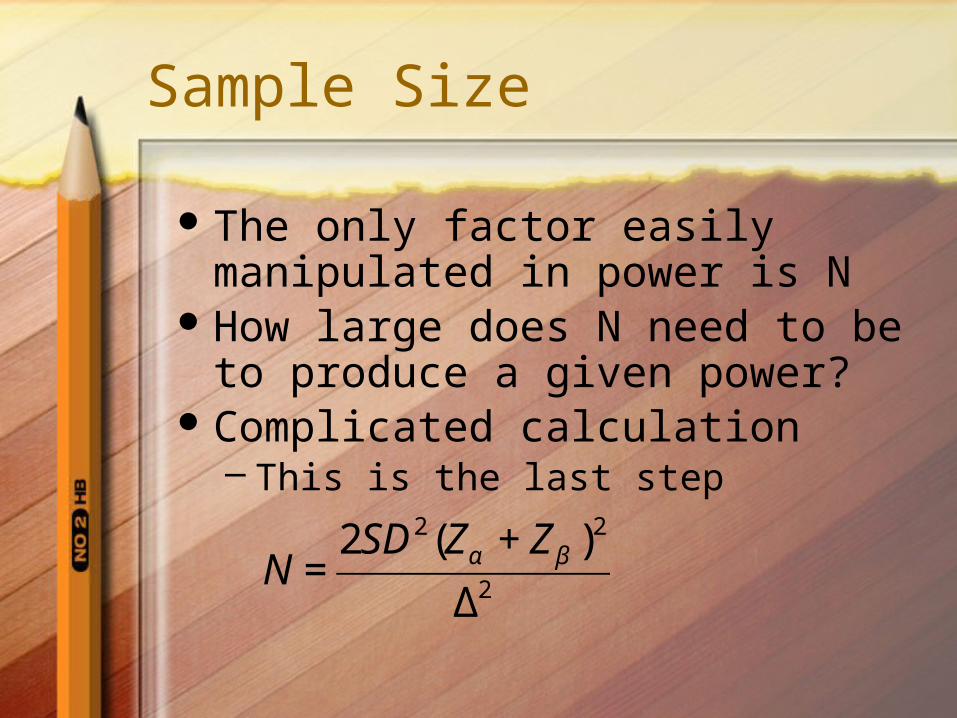
Sample Size
The only factor easily manipulated in power is N
How large does N need to be to produce a given power?
Complicated calculation– This is the last step
€
N =2SD2(Zα + Zβ )2
Δ2
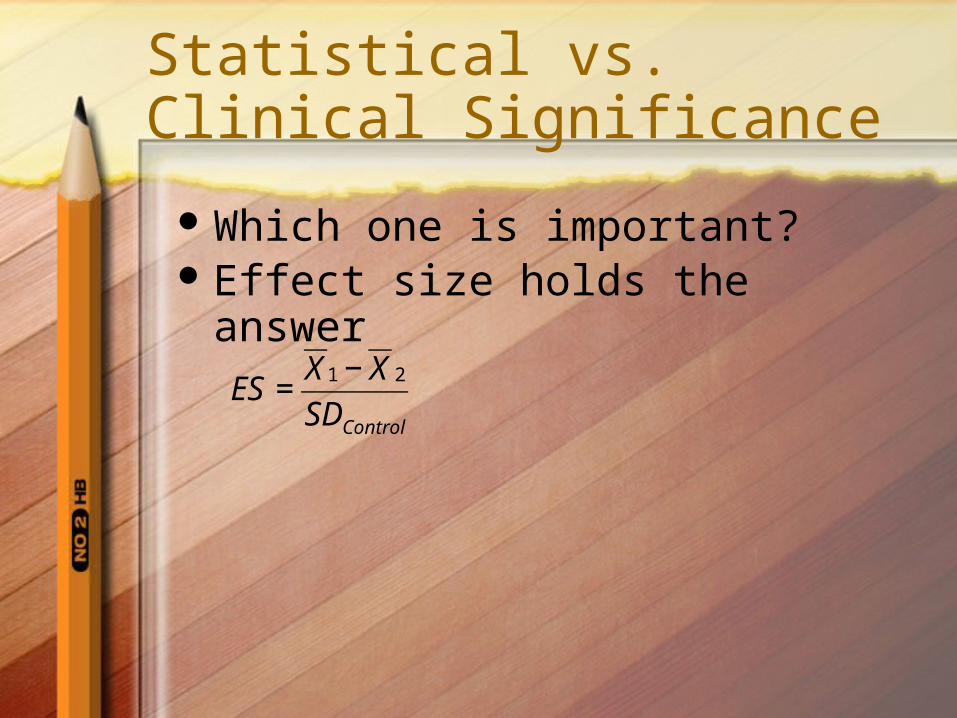
Statistical vs. Clinical Significance
Which one is important?Effect size holds the answer
€
ES =X1 − X 2
SDControl
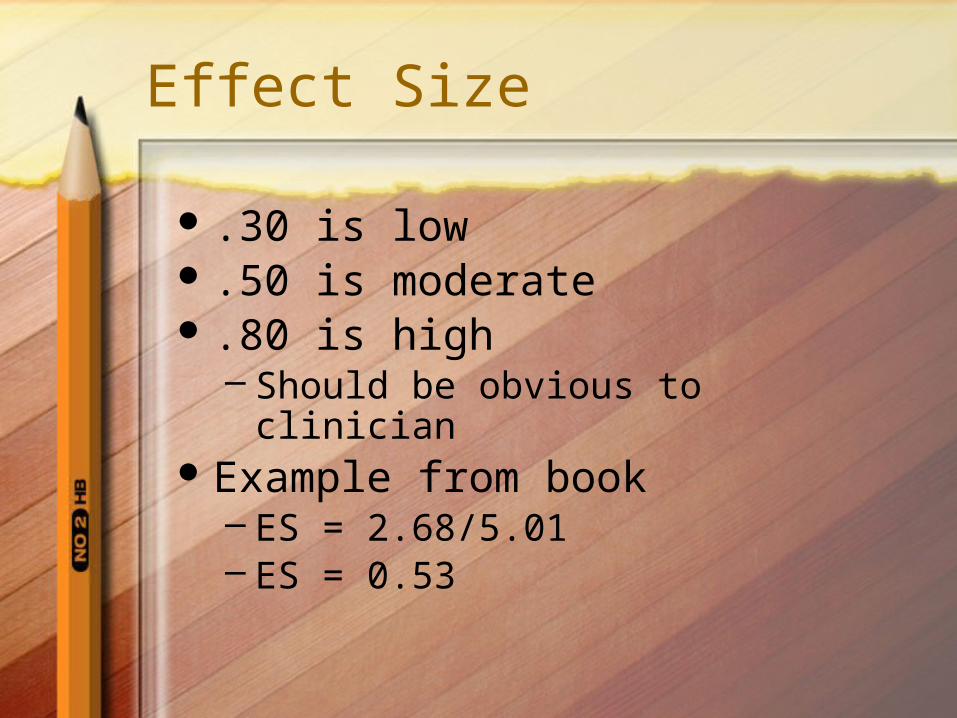
Effect Size
.30 is low .50 is moderate .80 is high
– Should be obvious to clinicianExample from book
– ES = 2.68/5.01– ES = 0.53


