
Mitigation of greenhouse gas emissions from global livestock systems through
nutrition strategies
Dario Caroa, Ermias Kebreaba, Frank M. Mitloehnera
aDepartment of Animal Science, University of California, Davis, USA
Supplementary Data
TABLE OF CONTENT
1. Regional aggregation 2
2. Diet composition 7
3. Specific diet related parameters 19
4. Ration formulation program 30
5. Estimation of CH4 emissions from manure management 33
6. Estimation of N2O emissions from manure management 35
7. Predicted emission reduction in 2050 36
8. Lipid inclusion versus fiber subtraction 37
9. Supplementary results 39
References 40
1 Regional aggregation
1
The letter shows the potential reduction of enteric CH4 in 2012, for 183 countries and presents
results aggregated in 11 geographical regions. For each region analyzed, except for European
regions, we follow the regional aggregation based on the M49 UN classification (UNFCCC
2015). The same aggregation is followed by FAOstat statistic database (FAO 2015). Since for
European regions we have available more specific data, the aggregation in these regions was
more detailed and did not follow the M49 UN classification. For European regions, the
aggregation has been developed by the authors of this letter. We assume that for each region, one
country is representative of all countries within the region. In Table S1 we show the regional
aggregation used in this letter as well as the representative country for each region and the
scientific literature used. Table S2 presents the countries within each respective region. Finally,
to aid clarity, maps presented in Figure S1 and Figure S2 show the regional aggregation in
geographic area.
2

Table S1: Table shows the regional aggregation used in this letter. It refers to the M49 UN
classification (UNFCCC 2015). The representative country for each region and the respective
reference are presented.
Region Code UNFCC Classification Country ReferenceOceania OCE Australia, New
Zealand, Polynesia, Melanesia, Micronesia
Australia FAO, IDF and IFCN, 2014
South America SAM South America, Caribbean and Central America
Brazil Palhares and Pezzopane 2015; Calegare et al. 2014
North America NAM Northern America Canada FAO, IDF and IFCN 2014
Africa AFR Southern, Eastern, Western and middle Africa
Uganda Asizua et al. 2009; Jenet et al. 2004
Asia ASI Southern, South-estern, Estern and Central Asia
India FAO, IDF and IFCN, 2014
Middle East MEA Northern Africa and Western Asia
Egypt Dyaa et al. 2013, Jenet et al. 2004
South Eastern Europe SEE Classified by authors Austria FAO, IDF and IFCN, 2014
North Western Europe NWE Classified by authors UK FAO, IDF and IFCN, 2014
South Western Europe SWE Classified by authors France FAO, IDF and IFCN, 2014
Central Europe CEE Classified by authors Germany FAO, IDF and IFCN, 2014
North Eastern Europe NEE Classified by authors Norway FAO, IDF and IFCN, 2014
3

Table S2: Table shows all the countries analyzed in this letter, aggregated in their respective
region.
Region Countries1
OCE AUSTRALIA, Fijii, French Polynesia, New Caledonia, New Zealand, Niue, P.N. Guinea, Samoa, Solmon Island, Tonga, Vanatu.
SAM BRAZIL, Antigua e Barbuda, Argentina, Bahamas, Barbados, Belize, Bolivia, Chile, Colombia, Costa Rica, Cuba, Dominica, Dominican Republic, Ecuador, El Salvador, Falkland Island, French Guyana, Grenada, Guadalupe, Guatemala, Guyana, Haiti, Honduras, Jamaica, Martinique, Mexico, Montserrat, Netherland Antille, Nicaragua, Panama, Paraguay, Peru, Puerto Rico, Saint Lucia, Saint Vincent and the G, Suriname, Trinidad and Tobago, Uruguay, US Virgin Islands, Venezuela.
NAM CANADA, United States of America.
AFR2 UGANDA, Angola, Benin, Botzwana, Burkina Faso, Burundi, Cabo Verde, Cameroon, Central African R, Chad, Comoros, Congo, Cote D'Ivoire, Dem Rep Congo, Djbouti, Eritrea, Ethiopia, Gabon, Gambia, Ghana, Guinea, Guinea B., Kenya, Lesotho, Liberia, Madagascar, Malawi, Mali, Mauritania, Mauritius, Mozambique, Namibia, Niger, Nigeria, Reunion, Ruwanda, Sao Tome and P., Senegal, Sierra Leone, Somalia, Swaitzland, Togo, Uni Rep Tanzania, Zambia, Zimbabwe.
ASI2 INDIA, Afganistan, Bangladesh, Bhutan, Cambodia, China, Dem. R of Korea, Indonesia, Iran, Kazakhstan, Kyrzigistan, Laos, Malaysia, Mongolia, Myanmar, Nepal, Pakistan, Philippines, Sri Lanka, Tajikistan, Thailand, Turkmekistan, Uzbekistan, Vietnam.
MEA EGYPT, Algeria, Armenia, Azerbajan, Bahrain, Cyprus, Georgia, Iraq, Jordan, Kuwait, Lebanon, Libya, Morrocco, Oman, Qatar, Saudi Arabia, Sudan, Syria, Tunisia, Turkey, United Arab Emirates, Yemen.
SEE AUSTRIA, Albania, Bosnia H., Bulgaria, Croatia, Greece, Montenegro, Serbia, Slovakia, Slovenia, Switzerland, The former Yugoslav Republic of Macedonia.
NWE UK, Belgium, Denmark, Iceland, Ireland, Luxembourg, Netherland.
SWE FRANCE, Italy, Malta, Portugal, Spain.
CEE GERMANY, Czech Rep, Poland, Hungary, Romania, Republic of Moldova.
NEE NORWAY, Belarus, Estonia, Finland, Latvia, Lithuania Russia, Sweden, Ukraine.
1 Capital is relative to representative country in each region2 South Africa and Japan are the only significant countries excluded from the analysis because they have a completely different cow production systems than the representative country in their respective geographical regions (such as Uganda and India, respectively).
4

Figure S1: Geographical aggregation used in this letter. For each region analyzed, except for
European regions, we follow the regional aggregation based on the M49 UN classification
(UNFCCC 2015)1.
1 South Africa and Japan are the only significant countries excluded from the analysis because they have a completely different cow production systems than the representative country in their respective geographical regions (such as Uganda and India, respectively).
5

Figure S2: Geographical aggregation for European regions. The aggregation of countries for
European regions has been developed by the authors of this letter.
6

2 Diet composition
Tables in this section (Table S3-S13) present the composition of traditional and amended diets in
each region analyzed. The composition of each ingredient is expressed as percentage of dry
matter intake (%DMI).
The effect on CH4 production is also dependent on type of lipids supplemented (Fiorentini et al.
2014; Beauchemin et al. 2009; Place and Mitloehner 2010). In this study, choice of lipid
supplementation was conducted by following a protocol common to all the regions. First, we
looked into the ingredient list of the traditional diet in order to recognize ingredients that greatly
contribute to EE and NDF contents. Secondly, to reduce the alteration effect, the dietary lipid
content was elevated by increasing the portion of ingredients with high fat concentration already
present in traditional diets. In line with that, soybean products are the lipid sources mostly
supplemented because they are the most common high concentrated fat products used for feeding
dairy cattle worldwide (Granger and Beachemin 2011). Finally, in selecting the concentrate
ingredient to be increased, by-products from oil or cereal industry preferably related to the region
was given special attention. This procedure was performed to make the diet amendment to be
more economical and relevant to the region in question. For example, in AFR, we supplemented
rice bran, which is an affordable and available ingredient (Lukuku et al. 2012).
7

Table S3: Composition of traditional and amended diets in OCE.
Ingredient %DMI in traditional diet %DMI in amended dietPasture 55.3 22.2Hay 7.9 8.3Grass silage 7.5 7.8Winter and summer forage crops (grazing) 1.8 1.9Maize silage 1.4 1.5Crop residues 0.9 1.0Wheat and barley 9.6 10.1Maize 0.9 0.9Others: Lupins 0.8 0.9Rapeseed meal 2.2 12.9Feed processing by-products 1.1 1.2Soymeal 0.5 10.1Cereal bran 0.3 0.3Pulp, molasses 0.2 0.3Cottonseed cake 0.0 10.9Compound feed 9.4 9.9
8

Table S4: Composition of traditional and amended diets in SEE.
Ingredient %DMI in traditional diet %DMI in amended dietPasture 2.8 2.8Hay 13.5 13.5Green fodder 15.1 15.1Grass silage 35.6 25.2Maize silage 11.6 10.0Wheat and barley 7.2 7.2Maize 4.5 4.5Others: rye and oat 1.6 1.6Others: triticale and other grains 1.6 1.6Other meals/cakes: brewer grains 2.2 2.2Soymeal 1.1 3.4Cereal bran 0.5 0.5Pulp, molasses 1.3 1.3Other meals/cake: rape cake 0.8 4.4Cottonseed cake 0.0 4.4Compound feed 0.6 0.6
9

Table S5: Composition of traditional and amended diets in SAM.
Ingredient %DMI in traditional diet %DMI in amended dietHay 51.0 14.3Wheat silage 4.0 4.0Maize silage 21.0 8.6Maize 11.0 8.6Soymeal 3.0 40.1Other: whey and wet corn gluten feed 5.0 5.3Sugar cane 5.0 13.2Cottonseed cake 0.0 6.0
10
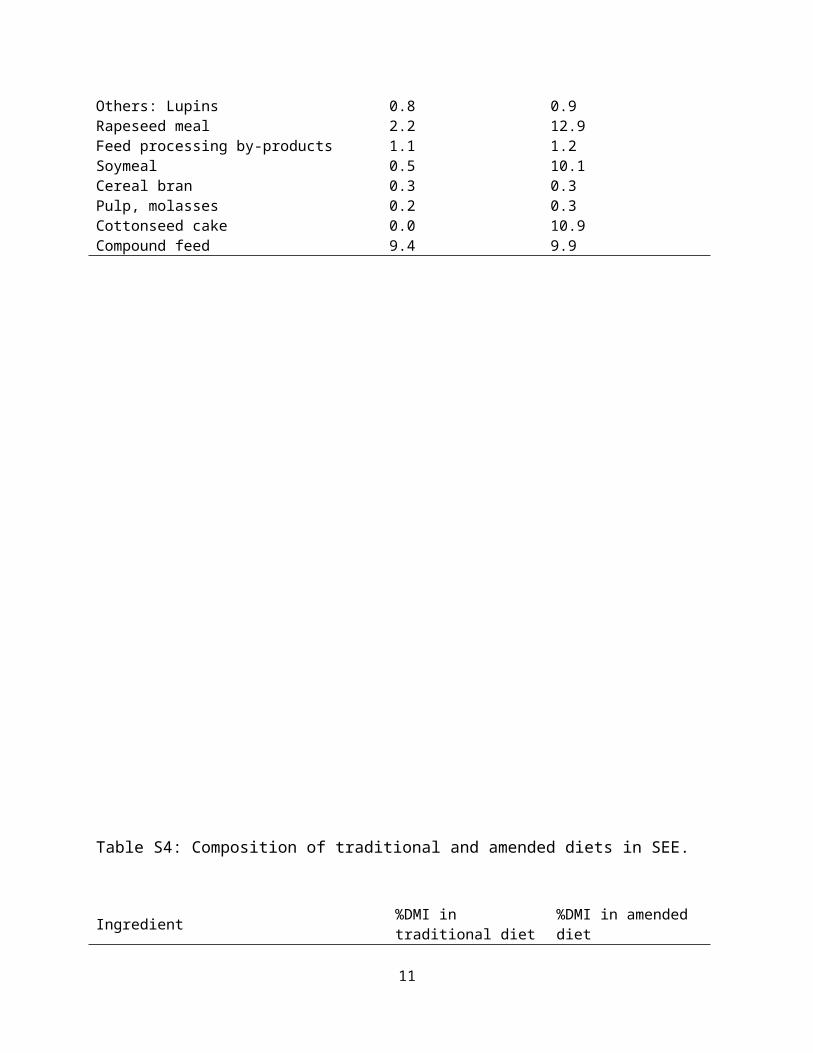
Table S6: Composition of traditional and amended diets in NAM.
Ingredient %DMI in traditional diet %DMI in amended dietPasture 1.4 1.4Hay 14.8 11.3Grass silage 36.2 16.9Winter and summer forage crops (grazing) 2.2 2.2Maize silage 9.3 9.3Wheat and barley 17.0 14.1Soymeal 2.3 14.1Cottonseed cake 0.0 9.9Compound feed 16.9 16.9
11

Table S7: Composition of traditional and amended diets in MEA.
Ingredient %DMI in traditional diet %DMI in amended dietPasture 26.7 15.5Hay 11.4 4.4Green fodder 7.7 4.4Maize 26.2 28.8Rapeseed meal 3.0 3.1Soymeal 24.9 37.6Cottonseed cake 0.0 6.2
12

Table S8: Composition of traditional and amended diets in SWE.
Ingredient %DMI in traditional diet %DMI in amended dietPasture 22.1 16.4Hay 17.3 13.4Green fodder 2.1 2.1Others: fodder beets, whole crops 0.4 0.4Grass silage 9.0 9.0Maize silage 26.7 24.9Wheat and barley 4.5 4.5Maize 1.0 1.0Rapeseed meal 0.9 0.9Other meals/cakes: brewer grains 0.4 0.4Soymeal 4.2 6.5Others: chunnies (mainly maize by-product) 1.0 1.0Other DDGS 0.7 0.7Other meals/cake: sunflower meal 0.1 0.1Other meals/cake: rape cake 0.0 4.9Cotton 0.2 0.2Cottonseed cake 0.0 3.0Compound feed 9.1 9.1
13

Table S9: Composition of traditional and amended diets in CEE.
Ingredient %DMI in traditional diet %DMI in amended dietPasture 1.6 1.7Grass silage 30.9 16.0Maize silage 39.4 14.4Rapeseed meal 4.7 24.0Soymeal 7.0 24.0Cottonseed cake 0.0 6.1Compound feed 16.3 13.8
14
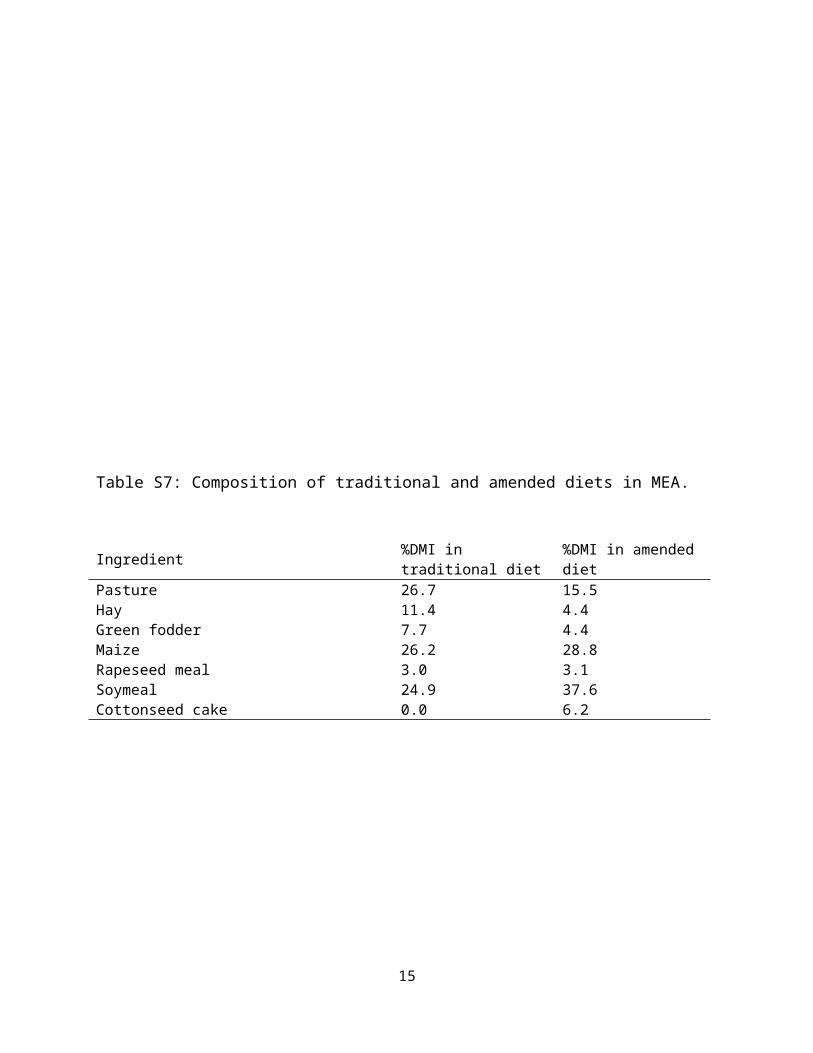
Table S10: Composition of traditional and amended diets in ASI.
Ingredient %DMI in traditional diet %DMI in amended dietPasture 3.1 3.1Green fodder 14.2 14.2Maize silage 0.8 0.8Crop residues 43.5 17.7Wheat and barley 0.3 0.3Maize 4.9 4.9Soymeal 0.0 16.3Others: chunnies (mainly maize by-product) 4.5 4.5Other meals/cake: maize cake 0.3 0.3Other meals/cake: groundnut cake 0.2 0.2Cereal bran 9.9 9.9Cottonseed cake 4.4 9.9Compound feed 13.9 13.9
15

Table S11: Composition of traditional and amended diets in NEE.
Ingredient %DMI in traditional diet %DMI in amended dietPasture 13.5 18.6Hay 3.7 3.8Grass silage 48.7 36.2Other meals/cake: rape cake 0.0 6.9Compound feed 34.1 34.6
16

Table S12: Composition of traditional and amended diets in AFR.
Ingredient %DMI in traditional diet %DMI in amended dietPasture 4.2 2.2Hay 14.6 4.3Green fodder 14.6 4.3Maize silage 13.8 6.5Wheat and barley 5.0 5.2Maize 9.6 9.9Sorghum 10.0 10.3Others: triticale and other grains 5.8 6.0Rice bran 0.0 19.4Other meals/cakes: brewer grains 5.8 6.0Soymeal 0.0 8.6Other meals/cake: gluten feed 5.8 6.0Other meals/cake: maize cake 5.8 6.0Pulp, molasses 5.0 5.2
17

Table S13: Composition of traditional and amended diets in NWE.
Ingredient %DMI in traditional diet %DMI in amended dietPasture 22.3 16.7Hay 0.2 0.2Grass silage 47.5 37.4Winter and summer forage crops (grazing) 5.3 5.5Maize silage 16.8 17.4Crop residues 0.4 0.4Cereal bran 2.0 2.1Cottonseed cake 1.1 15.8Compound feed 4.3 4.5
18

3 Specific diet related parameters
Tables in this section (Table S14-S24) present the diet related parameters used in our analysis for
each region. The gross energy (GE) expressed as Mega Joule per kilogram of dry matter and the
total concentrations of neutral detergent fiber (NDF) and ether extract (EE) expressed as
percentage content in 1 MJ of gross energy intake are showed. The former is provided by
Rostock feed evaluation system (Beyer et al. 2003); the latter are provided by National Research
Council (NRC 2001). Moreover the crude protein (CP) content expressed as percentage content
in 1 MJ of gross energy intake is showed. CP has been used for estimating direct and indirect
N2O emissions. CP values are also provided by National Research Council (NRC 2001).
Table S14: Specific diet related parameters used in OCE.
Ingredient GE NDF EE CP(MJ/kgDM) (%) (%) (%)
Pasture 17.56 45.8 2.7 26.5Hay 17.91 64.4 2.6 10.6Grass silage 17.33 66.6 3.0 12.7Winter and summer forage crops 17.05 49.6 2.4 18.4Maize silage 17.47 45.0 3.2 8.8Crop residues 17.21 69.1 2.0 10.8Wheat and barley 18.18 36.7 4.5 18.5Maize 18.10 13.4 2.3 14.2Others: Lupins 20.69 42.5 4.3 14.2Rapeseed meal 19.24 29.8 5.4 37.8Feed processing by-products 17.90 22.1 10.8 10.5Soymeal 20.05 21.7 8.1 46.3Cereal bran 19.29 42.5 4.3 17.3Pulp, molasses 17.49 0.2 0.4 5.8Cottonseed cake 21.22 50.3 19.3 23.5Compound feed 19.11 35.5 3.5 23.8
19

Table S15: Specific diet related parameters used in SEE.
Ingredient GE NDF EE CP(MJ/kgDM) (%) (%) (%)
Pasture 17.56 45.8 2.7 26.5Hay 17.91 64.4 2.6 10.6Green fodder 16.42 60.7 3.1 12.8Grass silage 17.33 66.6 3.0 12.7Maize silage 17.47 45.0 3.2 8.8Wheat and barley 18.18 36.7 4.5 18.5Maize 18.10 13.4 2.3 14.2Rye and oat 18.29 57.8 3.8 16.1Triticale and other grains 18.26 59.7 3.8 13.8Brewer grains 20.66 21.5 3.9 8.6Soymeal 20.05 21.7 8.1 46.3Cereal bran 19.29 42.5 4.3 17.3Pulp, molasses 17.49 0.2 0.4 5.8Rape cake 20.28 17.8 40.5 20.5Cottonseed cake 21.22 50.3 19.3 23.5Compound feed 19.11 35.5 3.5 23.8
20

Table S16: Specific diet related parameters used in SAM.
Ingredient GE NDF EE CP(MJ/kgDM) (%) (%) (%)
Hay 17.91 64.4 2.6 10.6Wheat silage 17.97 44.5 3.2 8.5Maize silage 17.47 45.0 3.2 8.8Maize 18.10 13.4 2.3 14.2Soymeal 20.05 21.7 8.1 46.3Whey and wet corn gluten feed 19.15 35.5 3.5 23.8Sugar cane 15.48 0.2 0.4 5.8Cottonseed cake 21.22 50.3 19.3 23.5
21

Table S17: Specific diet related parameters used in NAM.
Ingredient GE NDF EE CP(MJ/kgDM) (%) (%) (%)
Pasture 17.56 45.8 2.7 26.5Hay 17.91 64.4 2.6 10.6Grass silage 17.33 66.6 3.0 12.7Winter and summer forage crops 17.05 49.6 2.4 18.4Maize silage 17.47 45.0 3.2 8.8Wheat and barley 18.18 36.7 4.5 18.5Soymeal 20.05 21.7 8.1 46.3Cottonseed cake 21.22 50.3 19.3 23.5Compound feed 19.11 35.5 3.5 23.8
22

Table S18: Specific diet related parameters used in MEA.
Ingredient GE NDF EE CP(MJ/kgDM) (%) (%) (%)
Pasture 17.56 45.8 2.7 26.5Hay 17.91 64.4 2.6 10.6Green fodder 16.42 60.7 3.1 12.8Maize 18.10 13.4 2.3 14.2Rapeseed meal 19.24 29.8 5.4 37.8Soymeal 20.05 21.7 8.1 46.3Cottonseed cake 21.22 50.3 19.3 23.5
23

Table S19: Specific diet related parameters used in SWE.
Ingredient GE NDF EE CP(MJ/kgDM) (%) (%) (%)
Pasture 17.56 45.8 2.7 26.5Hay 17.91 64.4 2.6 10.6Green fodder 16.42 60.7 3.1 12.8Fodder beets, whole crops 13.00 58.2 2.4 16.8Grass silage 17.33 66.6 3.0 12.7Maize silage 17.47 45.0 3.2 8.8Wheat and barley 18.18 36.7 4.5 18.5Maize 18.10 13.4 2.3 14.2Rapeseed meal 19.24 29.8 5.4 37.8Brewer grains 20.66 21.5 3.9 8.6Soymeal 20.05 21.7 8.1 46.3Chunnies (mainly maize by-product) 19.98 55.0 5.0 14.2Other DDGS 20.59 9.5 4.2 9.4Sunflower meal 19.69 40.3 1.4 28.4Rape cake 20.28 17.8 40.5 20.5Cotton 20.20 30.8 1.9 44.9Cottonseed cake 21.22 50.3 19.3 23.5Compound feed 19.11 35.5 3.5 23.8
24
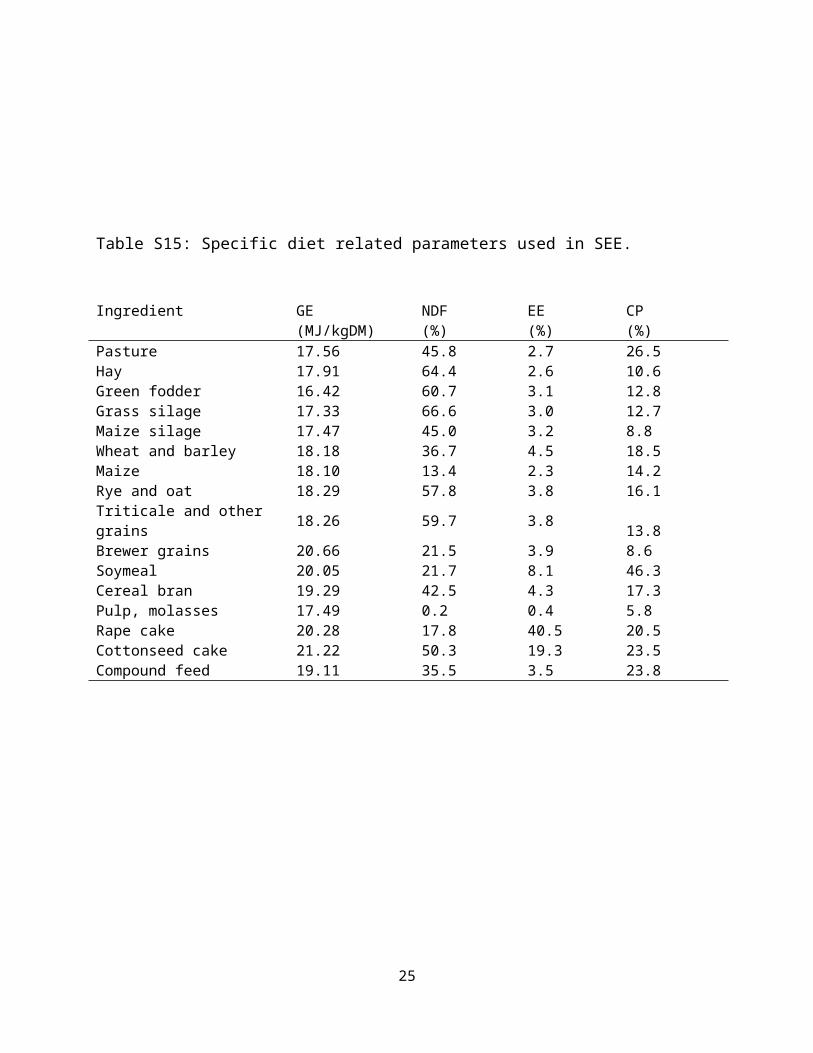
Table S20: Specific diet related parameters used in CEE.
Ingredient GE NDF EE CP(MJ/kgDM) (%) (%) (%)
Pasture 17.56 45.8 2.7 26.5Grass silage 17.33 66.6 3.0 12.7Maize silage 17.47 45.0 3.2 8.8Rapeseed meal 19.24 29.8 5.4 37.8Soymeal 20.05 21.7 8.1 46.3Cottonseed cake 21.22 50.3 19.3 23.5Compound feed 19.11 35.5 3.5 23.8
25

Table S21: Specific diet related parameters used in ASI.
Ingredient GE NDF EE CP(MJ/kgDM) (%) (%) (%)
Pasture 17.56 45.8 2.7 26.5Green fodder 16.42 60.7 3.1 12.8Maize silage 17.47 45.0 3.2 8.8Crop residues 17.21 69.1 2.0 10.8Wheat and barley 18.18 36.7 4.5 18.5Maize 18.1 13.4 2.3 14.2Soymeal 20.05 21.7 8.1 46.3Chunnies (mainly maize by-product) 19.98 55.0 5.0 14.2Maize cake 19.00 10.3 4.3 9.2Groundnut cake 20.05 21.4 1.4 51.8Cereal bran 19.29 42.5 4.3 17.3Cottonseed cake 21.22 50.3 19.3 23.5Compound feed 19.11 35.5 3.5 23.8
26

Table S22: Specific diet related parameters used in NEE.
Ingredient GE NDF EE CP(MJ/kgDM) (%) (%) (%)
Pasture 17.56 45.8 2.7 26.5Hay 17.91 64.4 2.6 10.6Grass silage 17.33 66.6 3.0 12.7Rape cake 20.28 17.8 40.5 20.5Compound feed 19.11 35.5 3.5 23.8
27

Table S23: Specific diet related parameters used in AFR.
Ingredient GE NDF EE CP(MJ/kgDM) (%) (%) (%)
Pasture 17.56 45.8 2.7 26.5Hay 17.91 64.4 2.6 10.6Green fodder 16.42 60.7 3.1 12.8Maize silage 17.47 45.0 3.2 8.8Wheat and barley 18.18 36.7 4.5 18.5Maize 18.10 13.4 2.3 11.6Sorghum 16.16 10.9 3.1 11.6Triticale and other grains 18.26 59.7 3.8 13.8Rice bran 19.25 26.1 15.2 15.5Brewer grains 20.66 21.5 3.9 8.6Soymeal 20.05 21.7 8.1 46.3Gluten feed 19.53 11.1 2.5 65Maize cake 19.00 10.3 4.3 9.2Pulp, molasses 17.49 0.2 0.4 5.8
28

Table S24: Specific diet related parameters used in NWE.
Ingredient GE NDF EE CP(MJ/kgDM) (%) (%) (%)
Pasture 17.56 45.8 2.7 26.5Hay 17.91 64.4 2.6 10.6Grass silage 17.33 66.6 3.0 12.7Winter and summer forage crops 17.05 49.6 2.4 18.4Maize silage 17.47 45.0 3.2 8.8Crop residues 17.21 69.1 2.0 10.8Cereal bran 19.29 42.5 4.3 17.3Cottonseed cake 21.22 50.3 19.3 23.5Compound feed 19.11 35.5 3.5 23.8
29

4 Ration formulation program
The animal productivity is influenced by diet composition. Therefore, the difference of milk
production in traditional and amended is an important aspect to investigate. We used a ration
formulation program to formulate and evaluate the performance of dairy cattle (for specific
details about the ration formulation program, see Oltjen and Ahmadi 2013). The program uses as
input, the daily ration of dairy cattle (each ingredient expressed as percentage of dry matter, Fig.
S3), the gross energy intake and the average weight of the animal. For each region, we used the
average weight of dairy cattle provided by IPCC (IPCC 2006). The program comes with a feed
library and allows formulation and evaluation of rations for dairy cattle. The feeds are selected
from the standard library, which includes more than 700 feeds with their nutrient analysis. The
program reads the data in the animal information form and then uses NRC (NRC 2001) to
evaluate the nutrients in each ingredient. Since in the feed group list form, the user can force a
given amount of feed to be included in the ration, we inserted as input, the traditional and
amended diets, for each region, presented in Table S3-S13. After the user has completed the
input forms, the program can elaborate the ration using the linear programming primal dual
algorithm. During the ration formulation process, the ration formulation program automatically
appends a set of “diagnostic feeds” to the feed list. These are virtual feeds (energy, protein,
vitamins, and minerals) that the ration formulation program will use to avoid getting an
infeasible solution when it cannot fulfill the nutrient requirements with the available feed
ingredients.
As output, the ration formulation program provides the performance of the animal, in terms of
maximum milk productivity, expressed as kg of milk per animal per day (Fig. S4). We estimated
the milk productivity in each region for traditional and amended diets. Two RFPs are available:
the 2005 version calibrated for US and the 2012 version calibrated for Uruguay. We apply the
2005 version for regions characterized by intensive production systems (NAM, EEU, NWE,
SWE, CEE, SEE) and the 2012 version for regions characterized by extensive production
systems (SAM, AFR, OCE, MEA, ASI).
30

Figure S3: Daily ration used as input for traditional diet in France (SWE according to Table S1).
The ingredients are expressed as percentage of dry matter.
31

Figure S4: Maximum milk productivity obtained as output for traditional diet in France (SWE
according to Table S1). It is expressed as kilogram of milk per animal per day.
32

5 Estimation of CH4 emissions from manure management:
Methane emissions were estimated by following a Tier 2 method described in the IPCC
guidelines (IPCC 2006) for traditional and amended diets. The Tier 2 method relies on two
primary types of inputs that affect the calculation of methane emission factors from manure:
manure characteristics and manure management system. Development of Tier 2 emission factors
(see equation 10.23 in IPCC 2006) involves determining a weighted average methane conversion
factors (MCF) using the estimates of the manure managed by each waste system within each
climate region. The average MCF is then multiplied by the volatile solid excreted (VS) and the
maximum methane producing capacity for manure produced (Bo) for the livestock categories.
Except for VS, the parameters in the equation strictly reflect national circumstances (such as
storage or temperature conditions) and therefore they are not influential in the final calculation.
Therefore, we used default values provided by IPCC guidelines to estimate MCF and Bo. The
mean annual temperature for each region were provided by (NOAA 2015).
According to equation 1 (see equation 10.24 in IPCC, 2006) we estimated VS:
VS=¿ [1]
Where:
GE is the total gross energy intake,
UE is the urinary energy expressed as fraction of GE
DE% is the percentage of digestibility
ASH is the ash content of manure
For UE and ASH, we used default values provided by IPCC, (2006). According to IPCC
guidelines (see Table 10.2 in IPCC 2006) the percentage of digestibility was estimated on the
basis of amount of pasture contained in the diets. Table S25 shows estimates of VS for
traditional and amended diets in the 11 regions analyzed. Methane emissions estimated in each
of the 183 countries for traditional and amended diet are shown in “Supplementary results” file.
33

Table S25: Estimates of volatile solid excretion (VS) for traditional and amended diets in the 11 regions analyzed.
Region Traditional diet Amended dietVS (kg VS day-1) VS (kg VS day-1)
NWE 6.23 5.52MEA 1.98 1.69NEE 4.34 3.70ASI 2.88 2.88CEE 4.69 3.88SWE 6.34 5.53AFR 1.69 1.11NAM 5.90 5.03SAM 3.48 2.14SEE 6.60 5.85OCE 5.90 4.56
34

6 Estimation of N2O emissions from manure management:
Nitrous oxide emissions were estimated by following a Tier 1 method described in the IPCC
guidelines (IPCC 2006) for traditional and amended diets. N2O emission occurring via both
nitrification and denitrification of nitrogen contained in manure (direct emissions) and N2O
emissions resulting from volatile and leaching/runoff nitrogen losses (indirect N2O emissions)
were considered in this study. The nitrogen excretion in each region was obtained from the
prediction equation presented in (Reed et al. 2015):
Nex=20.3+0.654×∋¿ [2]
NI is the nitrogen intake expressed as g d-1. To estimate NI, the crude protein content of each
ingredient was provided by NRC (2001). In Table S3-S13, the crude protein content for each
ingredient in each region is shown. For each ingredient, crude protein is converted to nitrogen
intake by dividing by 6.25, due to the fact protein is 16 percent nitrogen and the total NI in each
region was estimated. Finally, equation [2] was applied for estimating nitrogen excretion.
According to (IPCC 2006) nitrogen excretion was used for estimating direct and indirect N2O
emissions. Default parameters and emissions factor were provided by IPCC (IPCC 2006).
Nitrous oxide emissions estimated in each of the 183 countries for traditional and amended diet
are shown in “Supplementary results” file.
35

7 Predicted emission reduction in 2050
To estimate the emissions reduction due to amended diets in 2050, we need the predicted dairy
cattle population in 2050. FAO (2012) provides the “cattle and buffalos” population in 2007 and
the predicted “cattle and buffalos” population in 2050. Since “cattle and buffalos” category
includes three types of livestock (such as beef cattle, dairy cattle and buffalo), to estimate the
predicted dairy cattle population we use two assumptions:
We assume that the percentage variation of “cattle and buffalos” population during the
period 2007-2050 is equal to the percentage variation of dairy cattle population in the
same period.
We assume that the percentage variation of dairy cattle population during the period
2012-2050 is equal to the percentage variation of dairy cattle population during the
period 2007-2050 (estimated by using the previous assumption).
Therefore, as proportion of the percentage variation provided by FAO (2012), we estimated the
dairy cattle population in 2050. Finally emissions due to traditional and amended diets are
estimated for each region following the same approach used for 2012 but considering the dairy
cattle population predicted for 2050.
36

8 Lipid inclusion versus fiber subtraction
We observe that in extensive production related diets, the decreasing of fiber concentration
affects CH4 mitigation more than increasing of lipid concentration. In contrast, in the intensive
production related diets, increasing lipid content of traditional diet represents the most relevant
variable for reducing CH4 enteric emissions (Figure S3).
Prediction model used in this letter estimates CH4 emissions in traditional and amended diets by
using three diet related variables: GEI, NDF and EE. When amending diets, GEI was kept
constant and fiber and lipid contents were modified. For each region, the different contribution of
these two modified variables in reducing CH4 emissions was evaluated. Figure S3 shows that, the
reduction in fiber content had greater potential effect on enteric CH4 emission reduction than the
lipid inclusion, mainly in developing regions. In SAM and ASI, reduction in fiber content was
preponderant for reducing enteric CH4 emissions (69% and 63% of fiber decreasing related
contribution to emissions reduction, respectively). The same outcome occurred in AFR and MEA
(55% and 52% of fiber decreasing related contribution to emissions reduction, respectively). In
the European region, only CEE had a greater potential enteric CH4 reduction due to reduction in
fiber content of the diet (60%). In the rest of the European regions, lipid inclusion was more
potentially effective than fiber reduction, especially in NWE and SEE (83% and 73%,
respectively). We find that in OCE the effect of the lipid inclusion was more significant than the
effect of fiber reduction whereas in NAM the contribution of the two effects was equivalent (Fig
S3).
37

Figure S3: Percentage contribution of reducing CH4 emissions by decreasing the percentage of fiber versus increasing the percentage of fat in amended diets for each region.
38

9 Supplementary results
The file “Supplementary results” shows the results relative to enteric CH4 emissions associated
with traditional and amended diet for each of the 183 countries in 2012. The emissions reduced
when amended diets are administered, is showed. Emissions are expressed as Mt CO2eq.
Moreover the file shows the CH4 and N2O emissions from manure management estimated in
each of the 183 countries for traditional and amended diet.
39

Alexandratos N, Bruinsma J, 2012. World agriculture towards 2030/2050: the 2012 revision. ESA Working paper No. 12-03. Rome, FAO.
Asizua D, Mpairwe D, Kabi F, Mutetikka D, Madsen J, 2009. Growth and slaughter characteristics of Ankole cattle and its Boran and Fresian crossbreds. South African Juornal of Animal Science 39: 81-85.
Beauchemin KA, McGinn SM, Benchaar C, Holtshausen L, 2009. Crushed sunflower, flax, or canola seeds in lactating dairy cow diets: effects on methane production, rumen fermentation, and milk production. J Dairy Sci 92: 2118-2127.
Beyer M et al. 2003. Rostock feed evaluation system: reference numbers of feed value and requirement on the base of net energy, pp. 294-351.
Calegare L, Alencar MM, Packer IU, Lanna DPD, 2007. Energy requirements and cow/calf efficiency of Nellore and Continental and British Bos Taurus X Nellore crosses. J Anim Sci 85: 2413-2422.
FAO 2015. FAOSTAT online database (Food and Agriculture Organization of the United Nations, Rome, Italy).
FAO, IDF and IFCN 2014. World mapping of animal feeding systems in the dairy sector, Rome, Italy.
Fiorentini G, Carvalho IPC, Messana JD, Castagnino PS, Berndt A, Canesin RC, Frighetto, RTS, Berchielli TT, 2014. Effect of lipid sources with different fatty acid profiles on the intake, performance, and methane emissions of feedlot Nellore steers. J Anim Sci 92: 1613-1620.
Granger C, Beauchemin KA, 2011. Can enteric emissions from ruminants be lowered without lowering their production? Anim Feed Sci Technol 166-167: 308-320.
IPCC 2006. Guideline for national greenhouse gas inventories (Intergovernmental Panel on Climate Change).
Jenet A, Yimegnuhal A, Tegegne A, Fernandex-Rivera S, Kreuzer M, 2004. Water intake and nutrient balances of Holestein x Boran cows fed a low-quality tropical diet. Eth J Anim Prod 4: 1-10.
Lukuku B, Gachuiri CK, Lukuku MN, Lusweti C, Mwendia S, 2012. Feeding dairy cattle in East Africa (East Africa dairy development Project, Nairobi, Kenya).
Mohamedi DEA, Borhami BE, El-Shazly KA, Sallam SMA, 2013. Effect of dietary supplementation with fibrolytic enzymes on the productive performance of early lactating dairy cows. J Agr Sci 5: 146-155.
NOAA 2015. National climatic data center. Earth System Research Laboratory of the University of Delware. National oceanic and atmosphere administration.
40

NRC 2001. Nutrient requirement of dairy cattle. Seven revised edition (National Research Council).
Oltjen JW, Ahmadi A, 2013. Taurus: a ration formulation program for beef cattle. Natural sciences education 42: 145-159.
Palhares JCP, Pezzopane JRM, 2015. Water footprint accounting and scarcity indicators of conventional and organic dairy production systems. Journal of cleaner production doi: http://dx.doi.org/10.1016/j.jclepro.2015.01.035
Place SE, Mitloehner FM, 2010. Invited review: Contemporary environmental issues: A review of the dairy industry's role in climate change and air quality and the potential of mitigation through improved production efficiency. J Dairy Sci 93(8): 3407-3416.
Reed KF, Moraes LE, Casper DP, Kebreab E, 2015. Predicting nitrogen excretion from cattle. J Dairy Sci 98: 3025-3035.
UNFCCC 2015. United Nations Framework Convention on Climate Change. Available at: http://unfccc.int/parties_and_observers/items/2704.php
41


