Download - State of the Retail Q4 2011
February 2012
State of the U.S. Online Retail Economy in Q4 2011
Gian Fulgoni, Chairman, comScore, Inc.
Andrew Lipsman, VP Industry Analysis, comScore, Inc.
Note: A copy of this presentation will be sent to all attendees within 24 hours of today’s webinar
2 © comScore, Inc. Proprietary and Confidential.
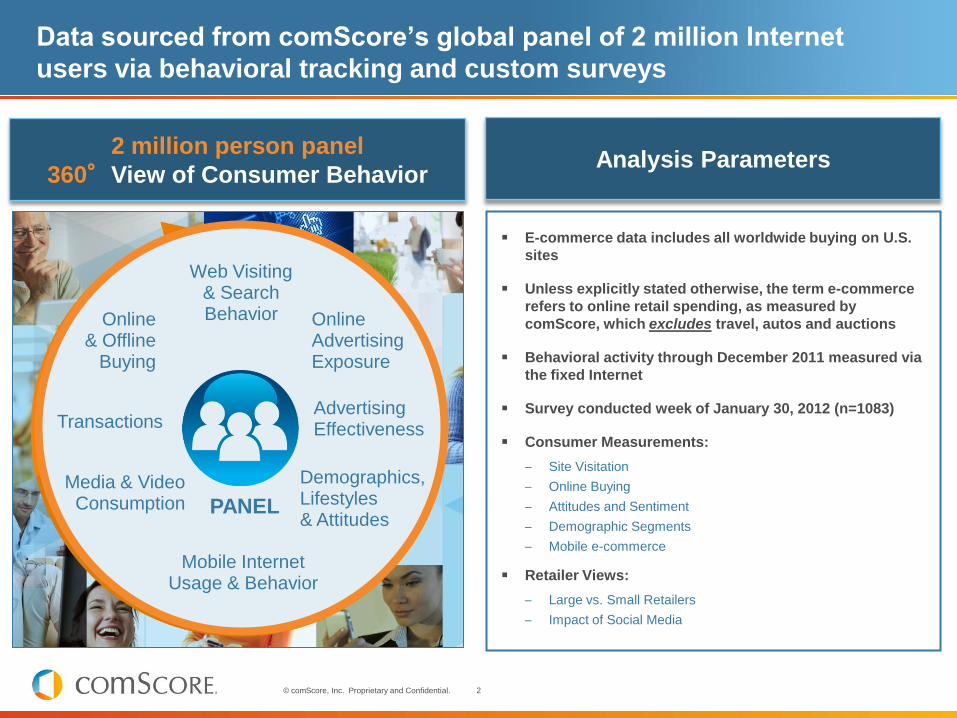
Data sourced from comScore‟s global panel of 2 million Internet
users via behavioral tracking and custom surveys
E-commerce data includes all worldwide buying on U.S.
sites
Unless explicitly stated otherwise, the term e-commerce
refers to online retail spending, as measured by
comScore, which excludes travel, autos and auctions
Behavioral activity through December 2011 measured via
the fixed Internet
Survey conducted week of January 30, 2012 (n=1083)
Consumer Measurements:
– Site Visitation
– Online Buying
– Attitudes and Sentiment
– Demographic Segments
– Mobile e-commerce
Retailer Views:
– Large vs. Small Retailers
– Impact of Social Media
2 million person panel
360°View of Consumer Behavior Analysis Parameters
Web Visiting & Search Behavior Online
Advertising Exposure
Advertising Effectiveness
Demographics, Lifestyles & Attitudes
Media & Video Consumption
Transactions
Online & Offline
Buying
Mobile Internet Usage & Behavior
PANEL

3 © comScore, Inc. Proprietary and Confidential.
-10%
0%
10%
20%
30%
40%
50%
2005 - Q1
2005 - Q2
2005 - Q3
2005 - Q4
2006 - Q1
2006 - Q2
2006 - Q3
2006 - Q4
2007 - Q1
2007 - Q2
2007 - Q3
2007 - Q4
2008 - Q1
2008 - Q2
2008 - Q3
2008 - Q4
2009 - Q1
2009 - Q2
2009 - Q3
2009 - Q4
2010 - Q1
2010 - Q2
2010 - Q3
2010 - Q4
2011 - Q1
2011 - Q2
2011 - Q3
Validation of comScore Sales Data:
Comparison of comScore data to U.S. Department of Commerce
Quarterly U.S. e-Commerce Growth* vs. YA Source: comScore & U.S. Department of Commerce (DOC)
% G
row
th v
s. Y
A
Dept. of Commerce (DOC) comScore Estimate of DOC
Correlation: 0.96
*Note: To be consistent with DOC, comScore estimate excludes
travel and event tickets but includes auction fees and autos.

4 © comScore, Inc. Proprietary and Confidential.
State of the Economy
A Review of Key Macroeconomic Trends
5 © comScore, Inc. Proprietary and Confidential.
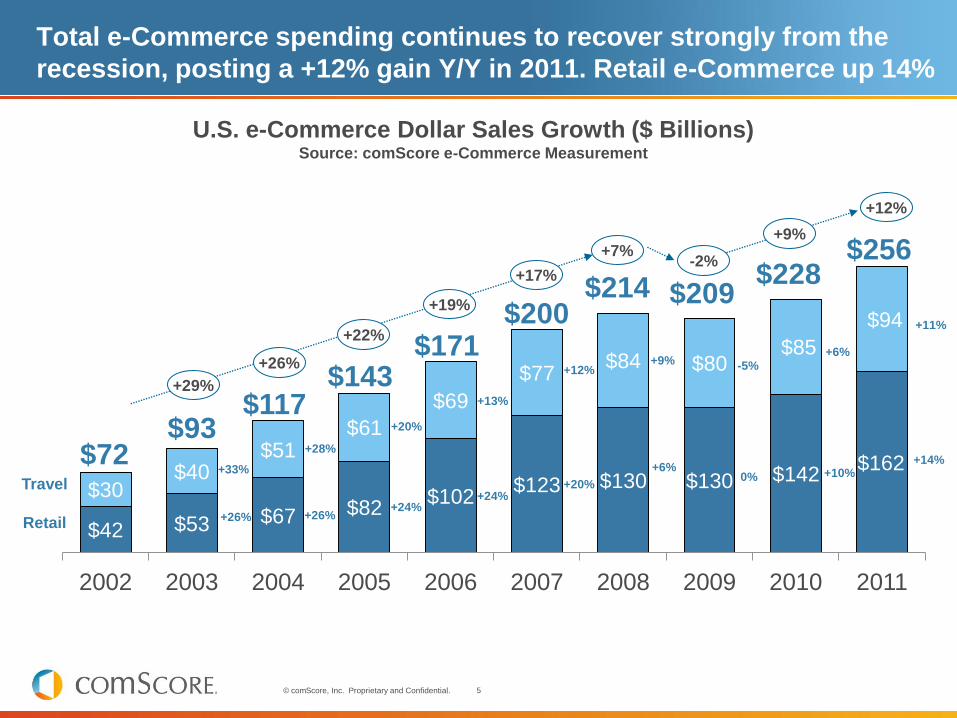
$42 $53 $67 $82 $102
$123 $130 $130 $142 $162
$30 $40
$51 $61
$69
$77 $84 $80
$85
$94
2002 2003 2004 2005 2006 2007 2008 2009 2010 2011
$72 $93
$117 $143
Retail
Travel
+26%
+33%
+26%
+28%
+20%
+24% +24%
+13%
$171 $200
+20%
+12%
+6%
+9%
Total e-Commerce spending continues to recover strongly from the
recession, posting a +12% gain Y/Y in 2011. Retail e-Commerce up 14%
$214
0%
-5%
$209
U.S. e-Commerce Dollar Sales Growth ($ Billions) Source: comScore e-Commerce Measurement
+10%
+6%
$228
+14%
+11%
$256
+29%
+26%
+22%
+19%
+17%
+7% -2%
+9%
+12%

6 © comScore, Inc. Proprietary and Confidential.
17%
23% 23%
19%
11%
13%
6% -3% 0% -1% -2%
3%
10%
9% 9%
11% 12% 14%
13%
14%
Q1 2007
Q2 2007
Q3 2007
Q4 2007
Q1 2008
Q2 2008
Q3 2008
Q4 2008
Q1 2009
Q2 2009
Q3 2009
Q4 2009
Q1 2010
Q2 2010
Q3 2010
Q4 2010
Q1 2011
Q2 2011
Q3 2011
Q4 2011
Channel shift accelerating: e-Commerce growth shows significant gains,
nearly triple the growth rate of total retail in Q4 2011
Quarterly e-Commerce Sales Growth vs. YA Source: comScore e-Commerce Measurement
Quarterly Retail & Food Services Sales Growth* vs. YA
Source: U.S. Department of Commerce (DOC)
*Note: The U.S. Department of Commerce calculation includes total
retail and food service sales, which also includes motor vehicles and
parts dealers.
4% 4% 3% 5%
4% 2%
1%
-8% -10% -9%
-7%
2%
6% 7%
5%
8%
7% 7% 7% 5%
Q1 2007
Q2 2007
Q3 2007
Q4 2007
Q1 2008
Q2 2008
Q3 2008
Q4 2008
Q1 2009
Q2 2009
Q3 2009
Q4 2009
Q1 2010
Q2 2010
Q3 2010
Q4 2010
Q1 2011
Q2 2011
Q3 2011
Q4 2011
When excluding autos, gas and
food/beverage, Q4 2011 retail growth
is up only +3% versus 2010
7 © comScore, Inc. Proprietary and Confidential.
4.3%
3.7% 4.0%
4.6%
5.1%
4.3% 4.5%
5.3%
5.9%
5.0%
5.3%
6.4% 6.7%
5.9%
6.3%
7.4% 7.3%
6.5% 6.6%
7.6% 7.7%
6.8% 6.9%
7.7% 8.1%
7.1% 7.1%
8.0%
8.6%
7.7% 7.6%
8.9%
0.0%
1.0%
2.0%
3.0%
4.0%
5.0%
6.0%
7.0%
8.0%
9.0%
10.0%
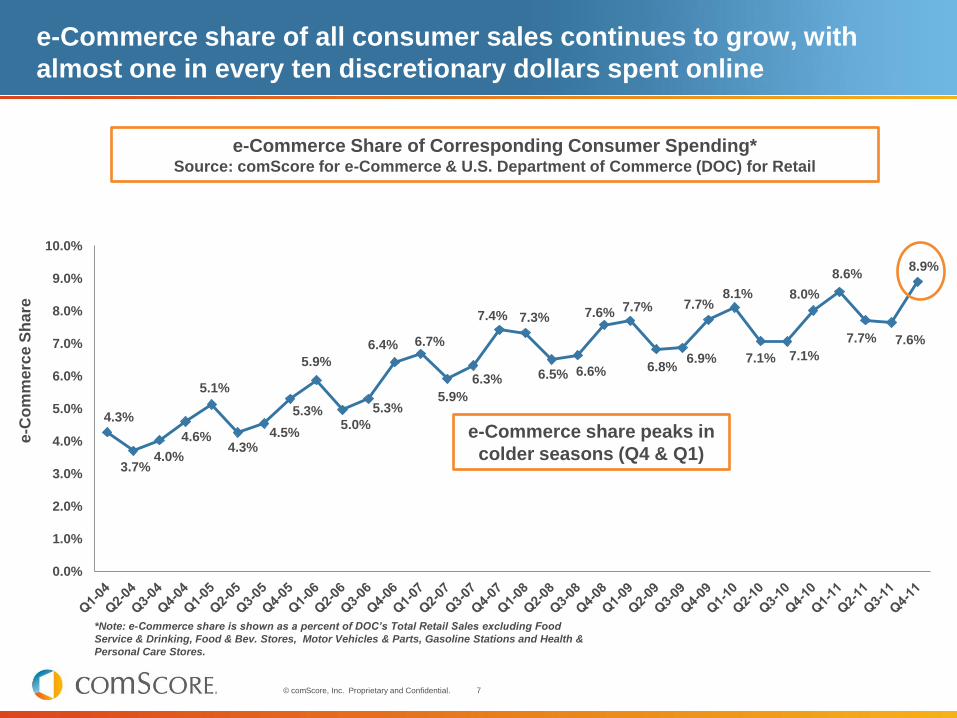
e-Commerce share of all consumer sales continues to grow, with
almost one in every ten discretionary dollars spent online
*Note: e-Commerce share is shown as a percent of DOC’s Total Retail Sales excluding Food
Service & Drinking, Food & Bev. Stores, Motor Vehicles & Parts, Gasoline Stations and Health &
Personal Care Stores.
e-Commerce Share of Corresponding Consumer Spending* Source: comScore for e-Commerce & U.S. Department of Commerce (DOC) for Retail
e-C
om
me
rce S
hare
e-Commerce share peaks in
colder seasons (Q4 & Q1)

8 © comScore, Inc. Proprietary and Confidential.
Q1 '08 Q2 '08 Q3 '08 Q4 '08 Q1 '09 Q2 '09 Q3 '09 Q4 '09 Q1 '10 Q2 '10 Q3 '10 Q4 '10 Q1 '11 Q2 '11 Q3 '11 Q4 '11
Overall e-Commerce dollar sales posted double-digit gains in every
quarter in 2011, reaching almost $50 billion in Q4
Bil
lio
ns
($
)
e-Commerce Dollar Sales ($ Billions) Source: comScore e-Commerce Measurement
+11% +13% +6% -3% 0% -1% -2% +3% +10% +9% +9% +11% +12% +14% +13% +14%
% Chg vs.YA
$31.2 $30.6 $30.3
$38.1
$31.0 $30.2 $29.6
$39.0
$33.9 $32.9 $32.1
$43.4
$38.0 $37.5 $36.3
$49.7
9 © comScore, Inc. Proprietary and Confidential.
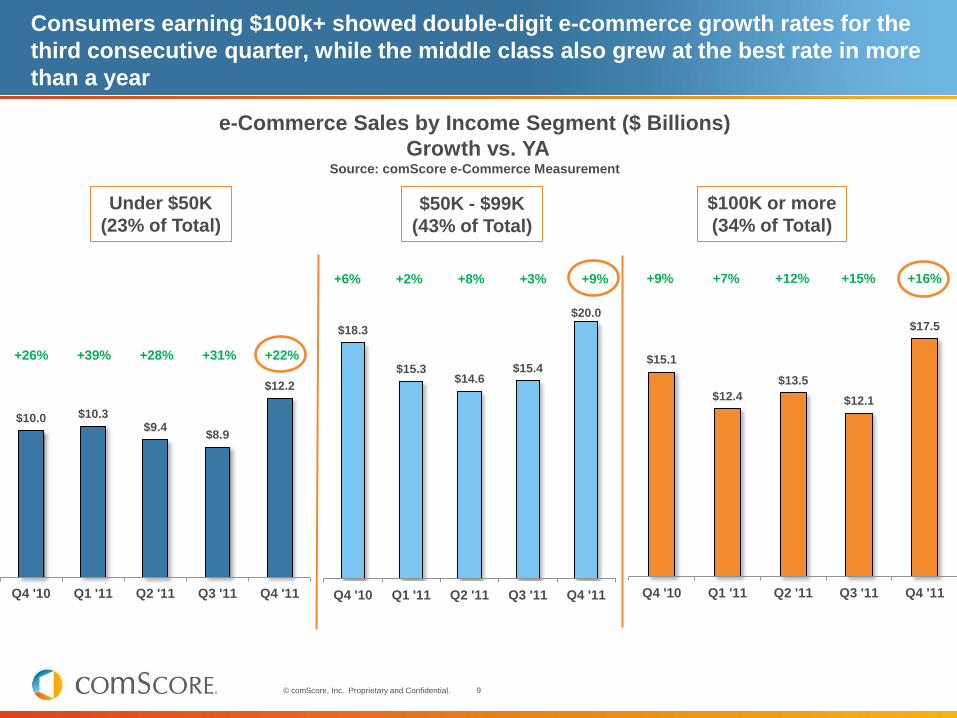
$15.1
$12.4
$13.5
$12.1
$17.5
Q4 '10 Q1 '11 Q2 '11 Q3 '11 Q4 '11
+9% +7% +12% +15% +16% +6% +2% +8% +3% +9%
$10.0 $10.3 $9.4
$8.9
$12.2
Q4 '10 Q1 '11 Q2 '11 Q3 '11 Q4 '11
+26% +39% +28% +31% +22%
Consumers earning $100k+ showed double-digit e-commerce growth rates for the
third consecutive quarter, while the middle class also grew at the best rate in more
than a year
$50K - $99K
(43% of Total)
Under $50K
(23% of Total)
$100K or more
(34% of Total)
e-Commerce Sales by Income Segment ($ Billions)
Growth vs. YA Source: comScore e-Commerce Measurement
$18.3
$15.3 $14.6
$15.4
$20.0
Q4 '10 Q1 '11 Q2 '11 Q3 '11 Q4 '11

10 © comScore, Inc. Proprietary and Confidential.
Overall consumer sentiment has improved, with 54% stating the
economy is in „poor‟ condition (2nd lowest percentage since 2009)
Percent of Consumers Who View The Economy as Poor
Q. How would you rate economic conditions today? Source: comScore Surveys
77% 68% 66%
61% 61% 59% 62% 61% 52%
59% 60% 62% 60% 54%
Jan-09 Apr-09 Jul-09 Oct-09 Jan-10 Apr-10 Jul-10 Oct-10 Jan-11 Apr-11 Jul-11 Aug-11 Oct-11 Jan-12
11 © comScore, Inc. Proprietary and Confidential.
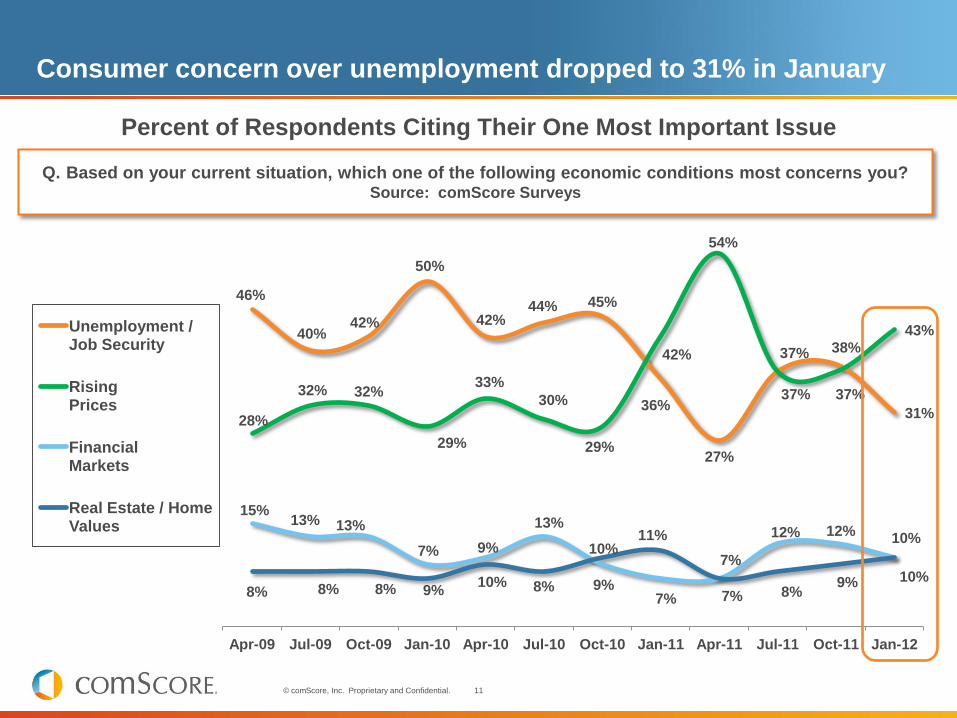
Consumer concern over unemployment dropped to 31% in January
Percent of Respondents Citing Their One Most Important Issue
46%
40% 42%
50%
42% 44% 45%
36%
27%
37% 38%
31% 28%
32% 32%
29%
33%
30%
29%
42%
54%
37% 37%
43%
15% 13% 13%
9% 10%
13%
9% 7% 7%
12% 12%
10% 8% 8% 8%
7% 9%
8%
10% 11%
7%
8% 9%
10%
Apr-09 Jul-09 Oct-09 Jan-10 Apr-10 Jul-10 Oct-10 Jan-11 Apr-11 Jul-11 Oct-11 Jan-12
Unemployment / Job Security
Rising Prices
Financial Markets
Real Estate / Home Values
Q. Based on your current situation, which one of the following economic conditions most concerns you? Source: comScore Surveys

12 © comScore, Inc. Proprietary and Confidential.
Retailer and Product Category Overview

13 © comScore, Inc. Proprietary and Confidential.
Most categories show strong growth in Q4 2011 versus Q4 2010
Q3 2011 e-Commerce Sales Growth vs. YA by Retail Category Source: comScore e-Commerce Measurement
Q4 growth rates of 15% or
higher
Q4 growth rates of 5% to 9%
Product Category Relative Chg
Growth Rate Q4
2011 vs. Q3 2011
Q4 2011
Growth
vs. YA
Digital Content and Subscriptions Very Strong
Jewelry & Watches Very Strong
Consumer Electronics (x PC Peripherals) Very Strong
Sport & Fitness Very Strong
Computers/Peripherals/PDAs Very Strong
Apparel & Accessories Very Strong
Event Tickets Strong
Flowers, Greetings & Misc. Gifts Strong
Books & Magazines Strong
Video Games, Consoles & Accessories Strong
Furniture, Appliances & Equipment Strong
Consumer Packaged Goods Strong
Office Supplies Moderate
Home & Garden Moderate
Q4 growth rates of 10-14%

14 © comScore, Inc. Proprietary and Confidential.
E-Commerce has shown growth in essentially every metric versus a year
ago, including total buyers, dollars per buyer and average order value
Metric Q4 2010 Q4 2011 % change
Dollar Sales ($ Billions) $43 $50 +14%
Dollars per buyer $261 $272 +4%
Buyers (Millions) 166 182 +10%
Average Order Value $92 $97 +6%
Transactions (Millions) 475 511 +8%
Transactions per Buyer 2.9 2.8 -2%
Buyer Penetration (Total Internet) 69% 74% +7%
Key e-Commerce Buyer and Transaction Measures
Q4 2011 vs. YA Source: comScore e-Commerce Measurement

15 © comScore, Inc. Proprietary and Confidential.
Compared to 2010, smaller retailers gained share of quarterly e-
Commerce sales versus the top-25 retailers
67.7% 69.9% 68.8% 67.7% 66.4% 67.9% 67.6%
32.3% 30.1% 31.2% 32.3% 33.6% 32.1% 32.4%
Q2-2010 Q3-2010 Q4-2010 Q1-2011 Q2-2011 Q3-2011 Q4-2011
All Other Retailers
Top 25 Retailers
Top-25 Retailers vs. All Other Retailers: Share of Quarterly
U.S. e-Commerce Sales Source: comScore e-Commerce Measurement
16 © comScore, Inc. Proprietary and Confidential.
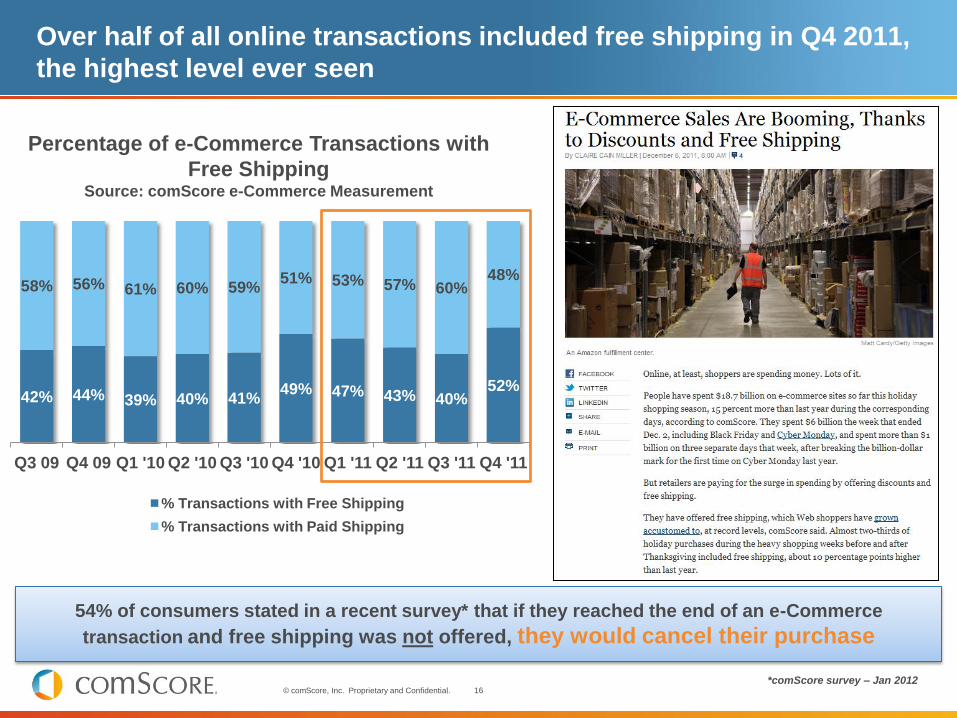
Over half of all online transactions included free shipping in Q4 2011,
the highest level ever seen
42% 44% 39% 40% 41% 49% 47% 43% 40%
52%
58% 56% 61% 60% 59% 51% 53% 57% 60%
48%
Q3 09 Q4 09 Q1 '10 Q2 '10 Q3 '10 Q4 '10 Q1 '11 Q2 '11 Q3 '11 Q4 '11
% Transactions with Free Shipping
% Transactions with Paid Shipping
Percentage of e-Commerce Transactions with
Free Shipping Source: comScore e-Commerce Measurement
54% of consumers stated in a recent survey* that if they reached the end of an e-Commerce
transaction and free shipping was not offered, they would cancel their purchase
*comScore survey – Jan 2012

17 © comScore, Inc. Proprietary and Confidential.
Amazon sites continue to break their own records, reaching 111
Million UVs in Q4, a 31% increase from 2010
Avg. Monthly UVs (MM) on Select Retail Sites in Q4 2011 Source: comScore Media Metrix U.S. Data
+31% vs. Q4 2010
+11% vs. Q3 2011
16.5
17.3
17.8
25.6
29.7
30.7
34.9
50.6
53.2
111.5
Macy's Inc.
JCPenney Sites
Sears.com
Hewlett Packard
Netflix.com
Best Buy Sites
Target Corporation
Apple.com
Wal-Mart
Amazon Sites

18 © comScore, Inc. Proprietary and Confidential.
The overall popularity of flash-sale sites continues to grow, with
several sites showing triple-digit growth versus a year ago
U.S. Unique Visitors (000) to Leading U.S. Flash Sales Sites Source: comScore Media Metrix, U.S., December 2011
Kids clothing site Totsy.com has exploded on the Flash Sale scene,
reaching 520,000 UVs in Dec-2011, vs. just 6,000 in Dec-2010
+62%
+115%
+153%
+30%
N/A
+40%
+206%
+36%
+8,306%
N/A
Y/Y Growth
487
520
590
716
925
1,163
1,186
1,655
1,701
2,428
EBay Fashion Vault
Totsy.com
RueLaLa.com
OneKingsLane.com
Ideeli.com
MyHabit.com
Gilt Groupe
Zulily.com
HauteLook.com
Woot.com

19 © comScore, Inc. Proprietary and Confidential.
Online Retail Advertising in 2011

20 © comScore, Inc. Proprietary and Confidential.
Internet advertising spending surged in 2011, reaching $7.9 Billion in Q3,
up 22% vs YA -- a growth rate about 6X faster than all media spending
$-
$1
$2
$3
$4
$5
$6
$7
$8
Q3 2011 $7.9 B
+22% vs YA
2000 2001 2002 2003 2004 2005 2006 2007 2008 2009 2010 2011
Source: IAB Internet Advertising Revenue Report, Q1 2000 - Q3 2011 IAB &
PricewaterhouseCoopers
Quarterly Revenue Trend ($ Billions)
2000 - 2011
$0
21 © comScore, Inc. Proprietary and Confidential.
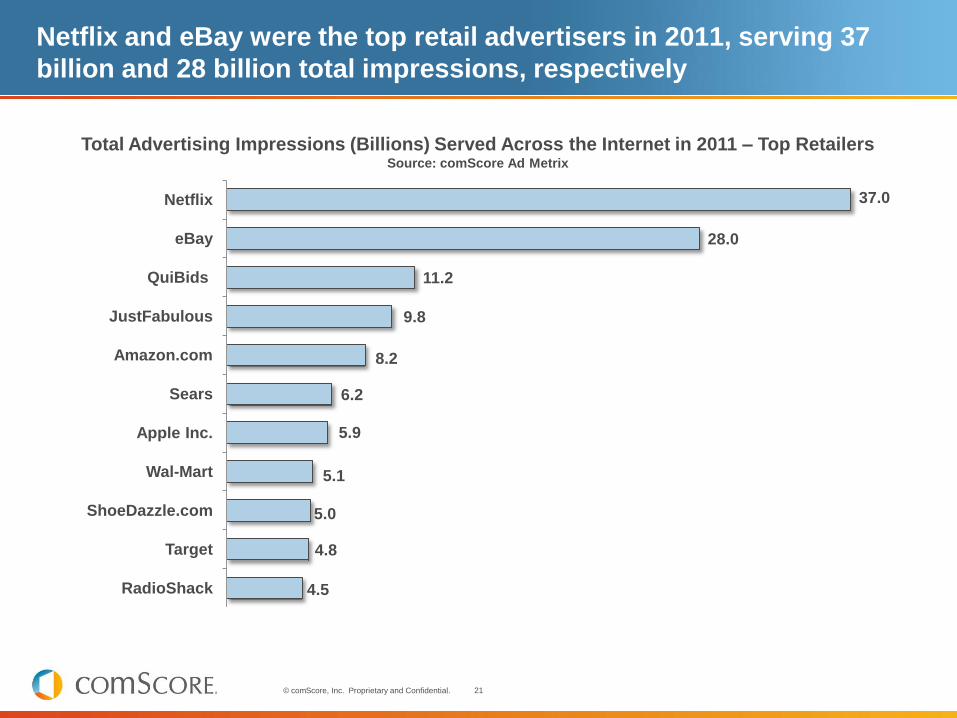
Netflix and eBay were the top retail advertisers in 2011, serving 37
billion and 28 billion total impressions, respectively
37.0
28.0
11.2
9.8
8.2
6.2
5.9
5.1
5.0
4.8
4.5
Netflix
eBay
QuiBids
JustFabulous
Amazon.com
Sears
Apple Inc.
Wal-Mart
ShoeDazzle.com
Target
RadioShack
Total Advertising Impressions (Billions) Served Across the Internet in 2011 – Top Retailers Source: comScore Ad Metrix

22 © comScore, Inc. Proprietary and Confidential.
0
500
1,000
1,500
2,000
2,500
3,000
Amazon.com
Walmart.com
Ad impressions delivered on Amazon.com (not including Amazon‟s
own ads) are up 81% versus a year ago
Impressions Delivered (in Millions) & Selected Leading Creatives on Amazon & Walmart Source: comScore Ad Metrix, U.S., Jul-2010 to Dec-2011
+81% vs. Dec ‟10
+12% vs. Nov „11
Amazon.com
Walmart.com

23 © comScore, Inc. Proprietary and Confidential.
$994
$9,905
$1,263
$11,550
Online Offline
Unexposed Exposed
Dollar Sales Lift Among Households
Exposed to Online Advertising
% Lift: 17%
% Lift: 27%
Despite click rates of only 0.1%, comScore research has shown that
display ads can lift retailer sales – both online and offline
Source: “Whither the Click?” 139 comScore studies in the
June 2009 Journal of Advertising Research
Exposure to display ads
doesn‟t just impact online
sales – it lifts in-store
sales as well
The absolute dollar lift
in offline sales is 5x higher
than the lift in e-commerce
sales
The click is misleading
as a measure of campaign
effectiveness
Conclusions

24 © comScore, Inc. Proprietary and Confidential.
Making Measurement Make Sense (3MS) Mission:
Reduce costs of doing business due to
complexity of digital advertising ecosystem
„Single Tag‟ solution to reduce complexity
Improve reporting of ad exposure
Bolster confidence that ads delivered are
actually visible
25 © comScore, Inc. Proprietary and Confidential.
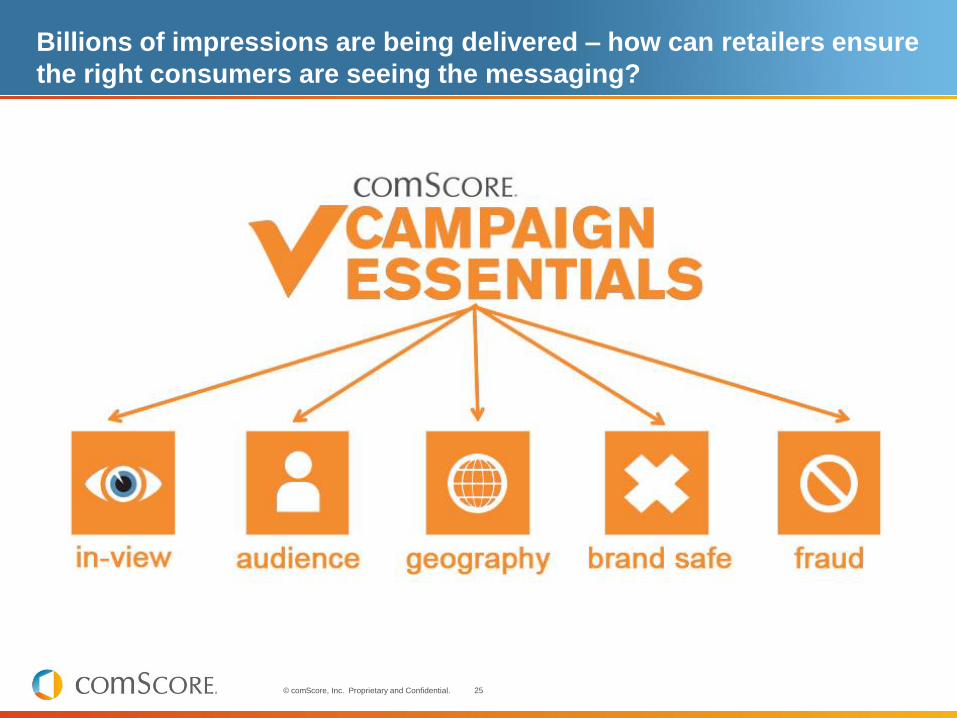
Billions of impressions are being delivered – how can retailers ensure
the right consumers are seeing the messaging?

26 © comScore, Inc. Proprietary and Confidential.
vCE Charter Study
18 campaigns
2 billion impressions
400k sites
Allstate

27 © comScore, Inc. Proprietary and Confidential.
Charter Findings
In-view ad rates ranged from
55% to 93% across 18 campaigns
0% 10% 20% 30% 40% 50% 60% 70% 80% 90% 100%
69% AVERAGE
28 © comScore, Inc. Proprietary and Confidential.
Mobile Retail Trends
29 © comScore, Inc. Proprietary and Confidential.
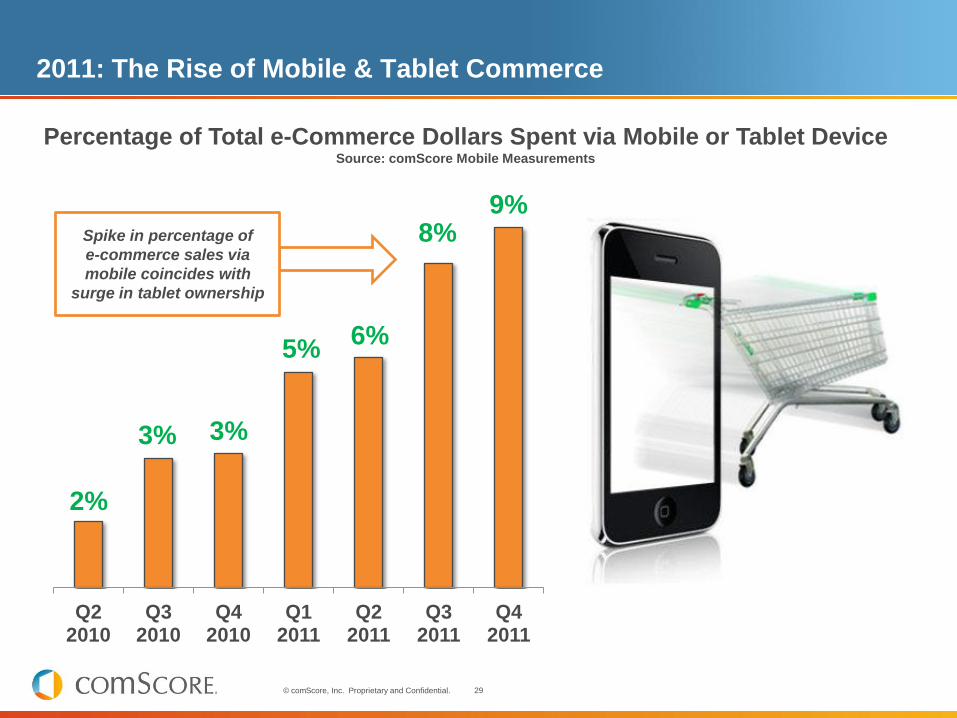
2011: The Rise of Mobile & Tablet Commerce
9% 8%
6% 5%
3% 3%
2%
Q4 2011
Q3 2011
Q2 2011
Q1 2011
Q4 2010
Q3 2010
Q2 2010
Percentage of Total e-Commerce Dollars Spent via Mobile or Tablet Device Source: comScore Mobile Measurements
Spike in percentage of
e-commerce sales via
mobile coincides with
surge in tablet ownership
30 © comScore, Inc. Proprietary and Confidential.
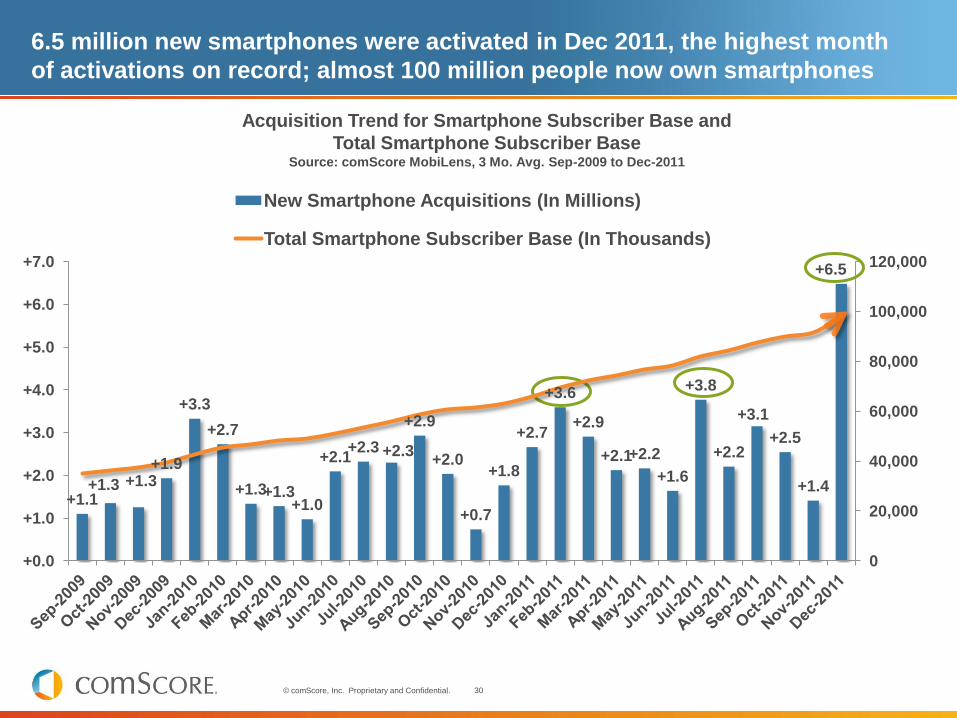
6.5 million new smartphones were activated in Dec 2011, the highest month
of activations on record; almost 100 million people now own smartphones
+1.1 +1.3 +1.3
+1.9
+3.3
+2.7
+1.3 +1.3 +1.0
+2.1 +2.3 +2.3
+2.9
+2.0
+0.7
+1.8
+2.7
+3.6
+2.9
+2.1 +2.2
+1.6
+3.8
+2.2
+3.1
+2.5
+1.4
+6.5
+0.0
+1.0
+2.0
+3.0
+4.0
+5.0
+6.0
+7.0
0
20,000
40,000
60,000
80,000
100,000
120,000
New Smartphone Acquisitions (In Millions)
Total Smartphone Subscriber Base (In Thousands)
Acquisition Trend for Smartphone Subscriber Base and
Total Smartphone Subscriber Base Source: comScore MobiLens, 3 Mo. Avg. Sep-2009 to Dec-2011

31 © comScore, Inc. Proprietary and Confidential.
0
5,000
10,000
15,000
20,000
25,000
30,000
35,000
40,000
Classifieds Online Retail
Real Estate Listings
E-Payments Auction Sites
Credit Cards
Shopping Guides
Bank Accounts
Restaurant Info
Travel Service
Dec-2010 Dec-2011
Mobile retail activities are surging as smartphone adoption approaches 100
million people in the U.S.
Retail Content Categories Are Among the Fastest Growing for Mobile
+116% +123%
+115%
+112% +104% +96%
+93%
+76%
+89%
+69%
Content Categories Consumed by Mobile Phone Owners (000) & Growth vs. YA Source: comScore Mobilens, Dec-2011, U.S.

32 © comScore, Inc. Proprietary and Confidential.
1 in 3 smartphone owners have used a phone to find a store location,
while about 20% compared product prices or features
33%
21% 20% 19% 17% 17%
16%
0
5,000
10,000
15,000
20,000
25,000
30,000
35,000
40,000
Found store location
Compared product prices
Researched product features
Found coupons or
deals
Made shopping lists
Checked product
availability
Used deal-a-day
To
tal A
ud
ien
ce
(00
0)
Retail Activities by Smartphone Users (000) and % of Audience Source: comScore Mobilens, Dec-2011
33 © comScore, Inc. Proprietary and Confidential.
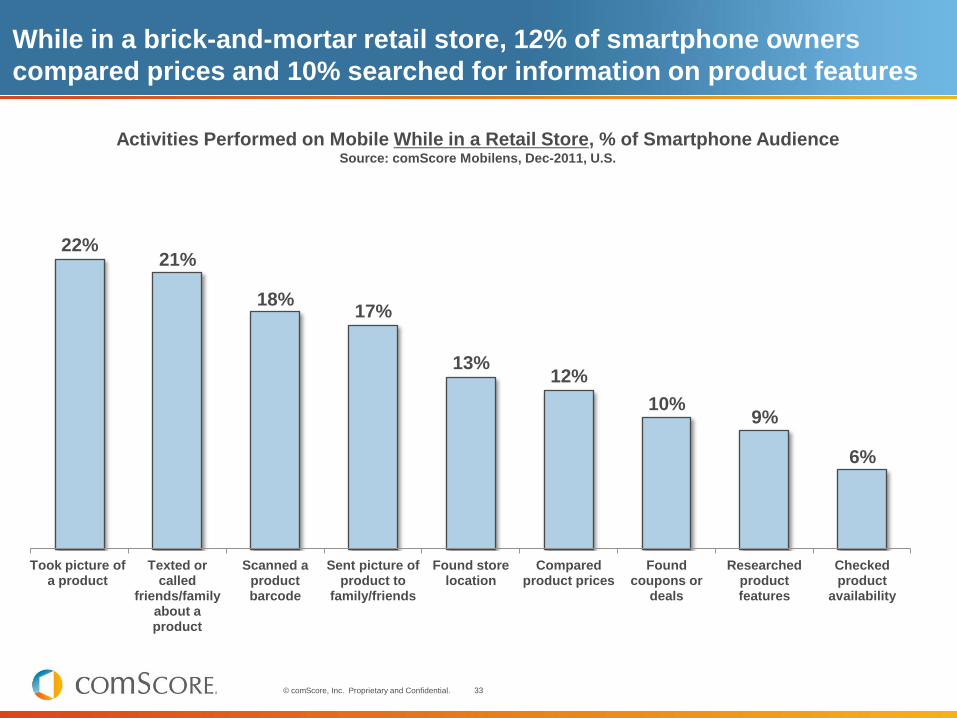
While in a brick-and-mortar retail store, 12% of smartphone owners
compared prices and 10% searched for information on product features
Activities Performed on Mobile While in a Retail Store, % of Smartphone Audience Source: comScore Mobilens, Dec-2011, U.S.
22% 21%
18% 17%
13% 12%
10% 9%
6%
Took picture of a product
Texted or called
friends/family about a product
Scanned a product barcode
Sent picture of product to
family/friends
Found store location
Compared product prices
Found coupons or
deals
Researched product features
Checked product
availability
34 © comScore, Inc. Proprietary and Confidential.
2011 Holiday Shopping Season
e-Commerce Wrap-Up and Key Findings

35 © comScore, Inc. Proprietary and Confidential.
$19.6
$24.6
$29.2 $28.0
$29.1
$32.6
$37.2
+26%
+19%
-4%
+4%
+12% +15%**
$0.0
$5.0
$10.0
$15.0
$20.0
$25.0
$30.0
$35.0
$40.0
-10%
-5%
0%
5%
10%
15%
20%
25%
30%
Holiday Season $ in Billions Y/Y Growth Rates
The 2011 U.S. e-Commerce holiday season surpassed all previous
years in sales and grew 15% versus year ago
* Holiday Season includes November and December
**Percentage change includes seasonal adjustment to account for unequal
number of weekdays and weekend days in 2010 and 2011
Holiday Season* Retail e-Commerce Sales ($ Billions)
Growth vs. YA Source: comScore e-Commerce Measurement
2005 2006 2007 2008 2009 2010 2011

36 © comScore, Inc. Proprietary and Confidential.
Through Dec 31st, ten individual days this past season have
surpassed $1 Billion in spending, compared to only one last year
$-
$200,000,000
$400,000,000
$600,000,000
$800,000,000
$1,000,000,000
$1,200,000,000
$1,400,000,000
2011 U.S. Online Holiday Spending by Day Source: comScore e-Commerce Measurement, 2011
Black Friday
+26%
Cyber Monday
+22% Green Monday
+19% Free Shipping Day
+14%
Thanksgiving
+18%

37 © comScore, Inc. Proprietary and Confidential.
$484
$608
$733
$846 $887
$1,028
$1,251
2005 2006 2007 2008 2009 2010 2011
For the second consecutive year, Cyber Monday was the highest
spending day throughout the holiday season
Cyber Monday U.S. Online Spending in
Millions (% growth vs. YA) Source: comScore E-commerce Measurement, 2005-2011
+16%
+5% +15%
+21%
+26%
+22%
8
12
9
3
2
1 1
0
2
4
6
8
10
12
14
2005 2006 2007 2008 2009 2010 2011
Sp
en
din
g D
ay R
an
k
Cyber Monday - Spending Day Rank
Cyber Monday - Spending Day Rank Source: comScore E-commerce Measurement. 2005-2011

38 © comScore, Inc. Proprietary and Confidential.
Cyber Monday 2011 activity saw a relatively higher percentage of sales occur
in the early morning as consumers sought out early deals and in the evening
hours as retailers continued to push promotions throughout the day
3% 12%
29%
32%
44% 22%
24% 34%
2010 2011
5pm - 9pm
1pm - 5pm
9am - 1pm
Before 9am
Cyber Monday Spending by Time of Day Source: comScore, Inc.
Time of Day:

39 © comScore, Inc. Proprietary and Confidential.
The season began earlier because of aggressive retailer promotions
and ended later because of increased confidence in free shipping
Millions ($)
2010 2011 % Change
November 1 – December 31 $32,589 $37,170 +15%**
Thanksgiving Day (Nov. 24) $407 $479 +18%
Black Friday (Nov. 25) $648 $816 +26%
Cyber Monday (Nov. 28) $1,028 $1,251 +22%
Green Monday (Dec. 12) $954 $1,133 +19%
Free Shipping Day (Dec. 16) $942 $1,072 +14%
Week ending Dec. 25 (Dec. 19-25) $2,450 $2,831 +16%
2011 Holiday Season e-Commerce Spending vs. Corresponding Days in 2010* Source: comScore e-Commerce Measurement
*Corresponding days based on corresponding shopping days
Heaviest online shopping day on record, surpassing
$1 billion in sales for the second consecutive year
Strong sales approaching
end of season
**Percentage change includes seasonal adjustment to account for unequal
number of weekdays and weekend days in 2010 and 2011
40 © comScore, Inc. Proprietary and Confidential.
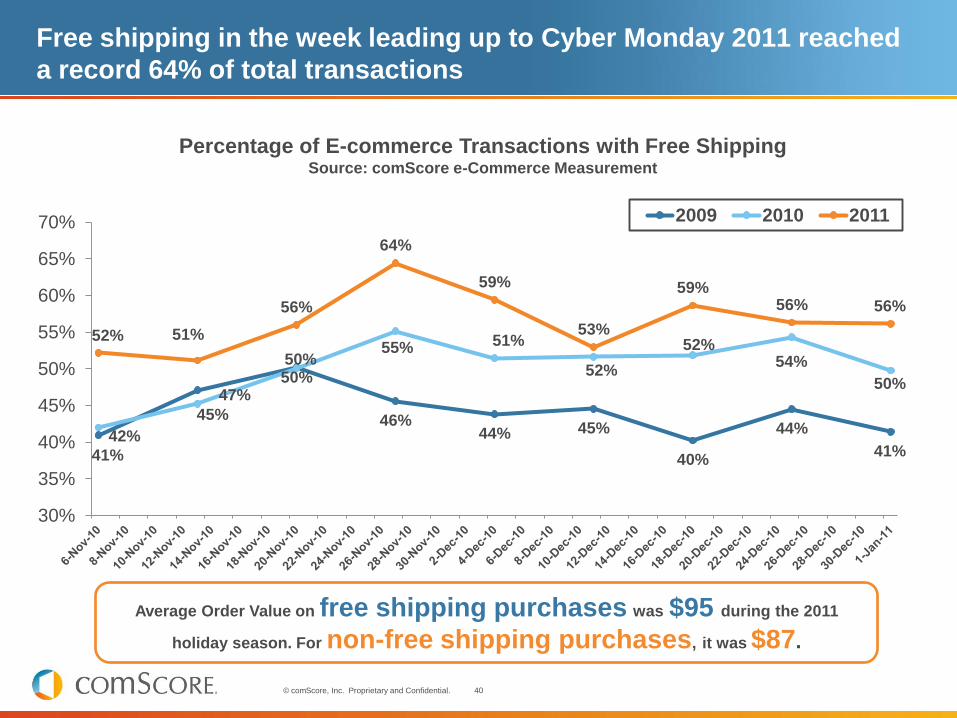
41%
47%
50%
46% 44% 45%
40%
44%
41% 42%
45%
50%
55% 51%
52%
52% 54%
50%
52% 51%
56%
64%
59%
53%
59% 56% 56%
30%
35%
40%
45%
50%
55%
60%
65%
70% 2009 2010 2011
Percentage of E-commerce Transactions with Free Shipping Source: comScore e-Commerce Measurement
Free shipping in the week leading up to Cyber Monday 2011 reached
a record 64% of total transactions
Average Order Value on free shipping purchases was $95 during the 2011
holiday season. For non-free shipping purchases, it was $87.

41 © comScore, Inc. Proprietary and Confidential.
Nearly 1 in 4 consumers purchased a gift via a deal-of-the-day site
this holiday season
8%
13%
11% 10%
13% 12%
5%
12%
10%
Yes, I purchased gifts via deal of the day vouchers I had already purchased but not
used
Yes, I purchased a new deal this holiday season & used it to buy a gift
Yes, I purchased a deal of the day as a gift (i.e. gave the voucher itself as a gift)
All consumers Men Women
Daily Deals As Holiday Gifts
Q. When thinking of this past holiday season, did you purchase any gifts via deal-of-the-day sites?
(Please select all that apply) Source: comScore Survey – January 2012
Overall, 27% of men and 21% of women bought gifts via
deal-of-the-day sites this season

42 © comScore, Inc. Proprietary and Confidential.
Promotions targeted to Fans can significantly expand the viral impact
of social media to Friends of Fans
0.31 0.34 0.50 0.45
0.67
0.92
1.76
1.53
Amazon Best Buy Target Walmart
Week Ending Oct. 19 Week Ending Nov. 30
2011 Holiday Retail Promotion Analysis Ratio of Friends of Fans Reached to Fans Reached for Leading U.S. Retailers
Source: comScore Social Essentials, U.S., November 2011
Viral Lift from
Promotions
2.2x
2.7x
3.5x 3.4x

43 © comScore, Inc. Proprietary and Confidential.
For most retailers, a significantly higher percentage of Fans &
Friends of Fans visited the retailer‟s website
27%
8% 9% 14%
36%
13% 12%
22%
64%
18% 12%
21%
Amazon Best Buy Target Walmart
Total Internet Friend of Fan Fan
2011 Holiday Retail Promotion Impact Analysis: Week Ending Nov. 30 Percentage of Brand-Exposed Fans & Friends of Fans Who Visited Retailer Website
Source: comScore Social Essentials, U.S., November 2011
Fans of Amazon were more than twice
as likely to have visited the brand’s site
than the general Internet user

44 © comScore, Inc. Proprietary and Confidential.
Key Takeaways

45 © comScore, Inc. Proprietary and Confidential.
Key Takeaways
Quarterly e-Commerce sales have increased by double digits Y/Y for five
straight quarters
– Online growth now nearly triple total retail sales, which means that $1 in every $10 of
discretionary spending will soon be spent online
– Channel shift to online has accelerated in 2011
Overall consumer perception of the economy improving, albeit slowly, but
remains negative with unemployment and high prices top concerns.
Smartphone adoption continues to explode: 6.5 million new phones activated in
Dec 2011, and overall 98 million people now use smartphones
– Smartphones & tablets used to buy and research competitive price / product features
while in-store, now accounting for 9% of Q4 dollars spent online
Strong holiday e-commerce sales exceeded $37 billion, up 15% vs YA
Free shipping growing in importance, far surpassing 50% of all transactions in
holiday season
– Has it become a cost of doing business?
– Negative impact on retailer profit margins?
46 © comScore, Inc. Proprietary and Confidential.
QUESTIONS?
Please contact us at [email protected] if
you have any additional questions or comments.

Thank You!
Note: A copy of this presentation will be sent to all attendees within 24
hours of today‟s webinar.


