
Autofacts ®
State of the Auto Industry Brandon Mason, PwC Autofacts

PwC
Agenda
Introduction to Autofacts ®
Global industry update
North America
Autofacts ® May 2012
Slide 2

PwC
Introduction to Autofacts ®
Autofacts ® May 2012
Slide 3

PwC
Autofacts – Our business model in context
Autofacts is a team of auto industry specialists within PwC’s Global Automotive practice dedicated to ongoing sector analysis. Autofacts data and analysis is used by the practice and by our clients to assess implications, make recommendations, and support auto industry decisions.
Autofacts ®
Global Automotive Practice
Analyst Briefings
(Quarterly)
Analyst Notes
(Monthly)
Analysis Services
Custom Deliverables
Global Light Vehicle &
Powertrain Forecast
Autofacts®
External Client Service
May 2012
Slide 4

PwC
Autofacts – Forecast methodology: A comprehensive and tested approach
Autofacts ®
Market Drivers Modeling Application Forecast
Macroeconomic Metrics Gross Domestic Product Interest Rate Trends Credit Availability Metrics Consumer Spending/Sentiment Employment Debt/Equity Accumulation Commodity Prices Inflationary Measures (CPI) Manufacturing/Housing Indices Demographics Government Stimulus Industry Indicators Imports/Exports/Inventory Plant Capacity/Utilisation Product Portfolio/Technology Incentives/Auto Financing Environmental/Safety Regulation Competitive Landscape
Analyst Input
Balancer Output
+
Proprietary
Data
Size Class /
Segment
Brand /
Nameplate
Region / Country
Alliance Group /
OEM
Platform / Product
Code
Forecast Level Quarterly Release
Autofacts®
Synchronous Forecasting
Integrated Data & Analysis
Online Client Access
Light Vehicle Assembly
Capacity / Utilisation
Powertrain
NA / EU Bodystyle
May 2012
Slide 5

PwC
Autofacts – Capabilities summary
Autofacts ®
Forecasts
Synchronous Global Update
Integrated Data & Analysis
Online Client Access
Analyst Briefings
Issues-based POV analysis
Regional market outlooks
Custom Analysis
Decision support Business
planning Thought leadership
Analyst Notes
Regional Industry Snapshots
Free Monthly Distribution
Engaging Viewpoints
Tested and trusted detailed
planning data and analysis on the
global light vehicle sector:
• Assembly / Capacity
• Powertrain
• Bodystyle (NA / EU)
Covering key issues facing
companies operating in the global
automotive sector:
• Deep regional insights
• Market trend analysis
• Powertrain outlook
Working in tandem with PwC’s
automotive practice, Autofacts can
assist with:
• M&A valuation support
• Industry studies
• Portfolio risk analysis
Providing easily digestible industry
updates on key market
developments:
• Unique auto viewpoints
• Key industry data sets
• autofacts.com/signup
Key Client
Benefits
• An independent, unbiased global perspective
• Differentiating & refined industry viewpoints
• Proactive & informed dialogue with executives
• Access to industry specialists with deep
expertise
For more information about
Autofacts products and
services, please contact:
May 2012
Slide 6

PwC
Global industry update
Autofacts ® May 2012
Slide 7

PwC
Global update – Assembly outlook Truly a global growth industry
Autofacts ®
106 million
The number of light
vehicles that will likely be
produced in 2018
5.2%
The CAGR for global light
vehicle assembly between
2011 - 2018
84%
Emerging markets’
contribution to growth
between 2011 - 2018
Source: Autofacts 2012 Q2 Data Release
May 2012
Slide 8

PwC
Global update – Forecast drivers Accentuate the positive, contain the negative
Assuming the European debt crisis is contained within the region’s borders, the auto industry has good reason to be optimistic for 2012. Monetary easing in key growth markets and recovery in Japan and Thailand should deliver a third sequential global record for light vehicle assembly in 2012.
Autofacts ®
74.6 74.6
76.8
78.2
79.5 79.7 79.7
2.2
1.4
1.2
0.6
-0.3
70
72
74
76
78
80
20
11
BR
IC
JP
NT
HA
NA
Oth
er
EU
20
12
Global: Light Vehicle Assembly Outlook 2011 – 2012 (millions)
European debt containment
BRICs regain momentum
Strong NA rebound
Japan + Thailand recovery
Non-resolution and/or
contagion scenario(s)
Divergent BRIC growth
trends
NA demand/ economic
flatline
Volatile ForEx + unknown
supply chain risk
Global: Light Vehicle Outlook Near-term positive and negative drivers
Source: Autofacts 2012 Q2 Data Release
May 2012
Slide 9

PwC
Global update – Assembly outlook After 2011 emerging market production dominates
For the first time in history, the number of vehicles produced in developing and emerging markets in 2011 was greater than the number of vehicles produced in mature markets. Sustainable demand for light vehicles in emerging markets will underpin organic growth for the foreseeable future.
Autofacts ®
Global: Light Vehicle Assembly by Market Type 2000 – 2018 (millions)
Global: Contribution to Growth by Region 2011 – 2018
0
10
20
30
40
50
60
70
20
00
20
01
20
02
20
03
20
04
20
05
20
06
20
07
20
08
20
09
20
10
20
11
20
12
20
13
20
14
20
15
20
16
20
17
20
18
Mature Emerging 0% 10% 20% 30% 40% 50% 60% 70%
MEA
EE
EU
SA
NA
AP China 39.4% India 12.9%
Brazil 6.9%
Russia 4.7%
May 2012
Slide 10
Source: Autofacts 2012 Q2 Data Release

PwC
Global update– Alliance group growth The gap at the top gets smaller
Autofacts ®
The contentious issue of who is number one remains, with Toyota expected to benefit from recovery from disruption caused by a number of natural disasters. Longer term we anticipate the three horse race will become a four horse one as Renault-Nissan enter the fray.
Global: Current Alliance Group Assembly Outlook* 2011, 2012, 2018 (millions)
0.0 1.0 2.0 3.0 4.0 5.0 6.0 7.0 8.0 9.0 10.0 11.0 12.0
Daimler
BMW
Suzuki
PSA
Honda
Fiat
Ford
Hyundai
RN
Toyota
VW
GM
2018 2012 2011
*RN = Renault-Nissan
May 2012
Slide 11
Source: Autofacts 2012 Q2 Data Release

PwC
Powertrain outlook – Global Engine, transmission, and technology forecast
Autofacts ®
Fuel Type and Delivery 2011 – 2018 (percent share)
Engine Intake Type 2011 – 2018 (percent share)
Weighted Engine Displacement 2011 – 2018 (litres)
Transmission Consumption 2011 vs. 2018 (percent share)
2011 2018
Engine Cons. by Configuration 2011 – 2018 (percent share)
Transmission Cons. by Gear Count 2011 vs. 2018 (percent share)
AMT DCT Auto CVT Electric Manual
Fuel / intake Transmission Engine
Gasoline Diesel Hybrid Electric DI
1.7
1.8
1.9
2.0
2.1
2.2
2011
2012
2013
2014
2015
2016
2017
2018
Th
ou
san
ds
0%
20%
40%
60%
80%
100%
2011
2012
2013
2014
2015
2016
2017
2018
0%
20%
40%
60%
80%
100%
2011
2012
2013
2014
2015
2016
2017
2018
R1/R2/I1/I2/I3 H4/I4/I5 H6/I6/V6
V8+ Electric
0% 20% 40% 60% 80% 100%
2018
2011
3 4 5 6 7 8 9 CVT Electric
0% 20% 40% 60% 80% 100%
20112012201320142015201620172018
Nat. Aspirated Turbo Twin Turbo Other
May 2012
Slide 12
Source: Autofacts 2012 Q2 Data Release

PwC
Powertrain outlook – Global Technology trending
Autofacts ®
Increasingly stringent global emission standards, combined with the ongoing consolidation of engine and transmission programs will result in a further shift towards alternative fuel technologies, with wider use of modularity to cater to individual market needs.
Global: Engine Fuel Type Consumption Outlook 2011 vs. 2018 (percent share)
Global: Top 5 Trending Powertrain Applications Market share gain (2018 vs. 2011)
75.46%
19.07% 3.17% 1.26% 1.04%
77.87%
20.21% 1.75% 0.05% 0.12%
2018
2011
Gasoline Diesel Hybrid PHEV PEV
1
2
3
4
5
Direct Injection +16.1%
DOHC
Turbocharging
CVTs
8-speed Trans.
+5.9%
+5.1%
+3.2%
+2.1%
May 2012
Slide 13
Source: Autofacts 2012 Q2 Data Release

PwC
North America
Autofacts ® May 2012
Slide 14

PwC
Market overview – Auto balancer key indicators in an atypical post-recession environment
May 2012
Slide 15
Autofacts ®
2%
4%
6%
8%
10%
2006
2007
2008
2009
2010
2011
2012
US: Long-Term Unemployment (27+ wks) 2000 – 2012 YTD (millions)
US: Non-Manufacturing Composite Index Jan 2008 – Mar 2012 (2008 = 100)
0
2
4
6
8
2000
2001
2002
2003
2004
2005
2006
2007
2008
2009
2010
2011
2012
Th
ou
san
ds
US: Auto Finance Average Prime Interest Rate 2006 – 2012 YTD
US: Total New Privately Owned Housing Starts* 2000 – 2012 YTD (millions) – *all units
US: Quarterly Real GDP Growth 2007 – 2011 Q4 final estimate (YoY Rate)
US: Total Asset Backed Security Issuance 2007 Q1 – 2012 Q1 (billions)
-10%
-6%
-2%
2%
6%
Q107
Q207
Q307
Q407
Q108
Q208
Q308
Q408
Q109
Q209
Q309
Q409
Q110
Q210
Q310
Q410
Q111
Q211
Q311
Q411
35
40
45
50
55
60
Jan
-08
Ap
r-08
Jul-0
8
Oct-
08
Jan
-09
Ap
r-09
Jul-0
9
Oct-
09
Jan
-10
Ap
r-10
Jul-1
0
Oct-
10
Jan
-11
Ap
r-11
Jul-1
1
Oct-
11
Jan
-12
0%
20%
40%
60%
80%
$0
$50
$100
$150
$200
Q1
07
Q4
07
Q3
08
Q2
09
Q1
10
Q4
10
Q3
11
A myriad of factors influence the sales and
assembly toplines
Structural Labour Market
Weakness 10 Quarters of Modest
Real GDP Growth
High Volume Vehicle
Launch Cadence
Interest Rates, Leasing, &
Incentive Upside Consumer Releveraging
Weak Service Spending
Housing Market Woes
& Household Debt
Auto Asset-Backed
Securitization Market
(+)
(-)
Supportive
Influences
Risk
Factors
Commodity Volatility
Inventory Recovery /
Replacement Demand
Euro Debt
Crisis
0.0
0.5
1.0
1.5
2.0
2.5
2000
2001
2002
2003
2004
2005
2006
2007
2008
2009
2010
2011
2012
Th
ou
san
ds
Source: US Federal Reserve, US Census, US BLS, EIA.gov, Edmunds, ISM

PwC
Sales outlook – North America Restrained 2011, breakneck start to 2012
Autofacts ®
The US light vehicle market continues to represent ~87% of all sales in North America, which confirms that the fate of the region is intrinsically tied to and driven by US performance. By historical standards, the environment remains subdued, yet the regional sales topline continues to cycle incrementally upward.
North America: Light Vehicle Sales Landscape 1990 – 2013(f) (millions)
North America: Light Vehicle Sales Jan 2007 – Mar 2012 (millions)
0
2
4
6
8
10
12
14
16
18
20
19
90
19
92
19
94
19
96
19
98
20
00
20
02
20
04
20
06
20
08
20
10
20
12
US Canada Mexico
0.0
0.3
0.5
0.8
1.0
1.3
1.5
1.8
Jan-0
7
Apr-
07
Jul-0
7
Oct-
07
Jan-0
8
Apr-
08
Jul-0
8
Oct-
08
Jan-0
9
Apr-
09
Jul-0
9
Oct-
09
Jan-1
0
Apr-
10
Jul-1
0
Oct-
10
Jan-1
1
Apr-
11
Jul-1
1
Oct-
11
Jan-1
2
US Canada Mexico
Source: Ward’s Automotive Reports, Autofacts Analysis
May 2012
Slide 16

PwC
Sales outlook – US The methodical recovery materialises
Autofacts ®
US light vehicle sales once remained fixed atop a 16–17.8 million unit plateau through the use of various industry stimulants. However, the theoretical end to the “push” model is delivering a methodical recovery more properly aligned with changes in metrics that drive real economic and industry health.
US: LV Sales Seasonally Adjusted Annual Rate Jan 2000 – Mar 2012 (millions)
US: SAAR + Annual LV Baseline Sales Forecast 2007 – 2013(f) (millions)
8
10
12
14
16
18
20
22
Jan-0
0
Jan-0
1
Jan-0
2
Jan-0
3
Jan-0
4
Jan-0
5
Jan-0
6
Jan-0
7
Jan-0
8
Jan-0
9
Jan-1
0
Jan-1
1
Jan-1
2
16.1
13.2
10.4 11.6
12.7 14.0
14.9
0
2
4
6
8
10
12
14
16
18
2007 2008 2009 2010 2011 2012(f) 2013(f)
Source: Ward’s Automotive Reports, Autofacts Analysis
May 2012
Slide 17

PwC
Sales overview – US New mix growth favors fuel economy
Autofacts ®
A series of new product launches in the small and mid car segments are helping buyers choose smaller, more economical vehicles better suited to blunt the impact of elevated fuel prices. The 2008 fuel price spike gave rise to a new era of pickup truck market share, which remains well below historical trend.
US: Light Vehicle Sales by Segment 2000 – Mar 2012
US: Light Vehicle Segmentation Market Share 2011 YTD vs. 2012 YTD
0%
20%
40%
60%
80%
100%
20
00
20
01
20
02
20
03
20
04
20
05
20
06
20
07
20
08
20
09
20
10
20
11
20
12
Small Car Mid Car Large Car Luxury Car
CUV SUV Van Pickup
0%
5%
10%
15%
20%
25%
30%
Sm
Ca
r
Mid
Car
Lg
Car
Lu
x C
ar
CU
V
SU
V
Van
Pic
ku
p
2012 2011Source: Ward’s Automotive Reports, Energy Information Agency
May 2012
Slide 18

PwC
Sales overview – US Sales momentum by automaker
Autofacts ®
While the Detroit 3 continue to perform with the market, share increases have been primarily bolstered by uncharacteristically low Japanese automaker sales that resulted from the post-crisis inventory shortages. D3 market share gains are encouraging, but will continue to feel near-term pressure.
US: Light Vehicle Sales by Automaker 2011 vs. 2012 YTD (thousands)
US: Light Vehicle Market Share by Automaker 2008 – 2012 YTD
-10%
0%
10%
20%
30%
40%
50%
0
200
400
600
GM
Ford
Toyota
Chry
sle
r
Nis
sa
n
Hond
a
Hyund
ai*
VW
2012 2011 YoY % Change (R-Axis)
0%
5%
10%
15%
20%
25%
GM
Ford
Toyota
Chry
sle
r
Ho
nd
a
Hyund
ai*
Nis
sa
n
VW
Oth
er
2012 2011 2010 2009 2008
*Includes KIA Source: Ward’s Automotive Reports
May 2012
Slide 19

PwC
Sales overview – US Inventory builds despite demand buoyancy
Autofacts ®
While demand strengthened substantially (14-15m SAAR) in Q1 2012, overall US inventory continues to register gradual increases, topping 2.75 million units in March – a figure last seen in 2009 when the economy was approaching historic lows and the industry was falling from unsustainable levels.
US: Light Vehicle Inventory Jan 2000 – Mar 2012 (millions)
US: Light Vehicle Inventory by Automaker Mar 2011 vs. Mar 2012 (thousands / days’ supply)
1
2
3
4
5
20
00
20
01
20
02
20
03
20
04
20
05
20
06
20
07
20
08
20
09
20
10
20
11
20
12
-20
-15
-10
-5
0
5
10
15
20
0
100
200
300
400
500
600
700
GM
Ford
Ch
rysle
r
Toyota
Ho
nda
Nis
san
Hyun
dai*
VW
2012 2011 Days' Supply Chg (R-Axis)
Source: Ward’s Automotive Reports, NBER, Autofacts Analysis
May 2012
Slide 20
PwC
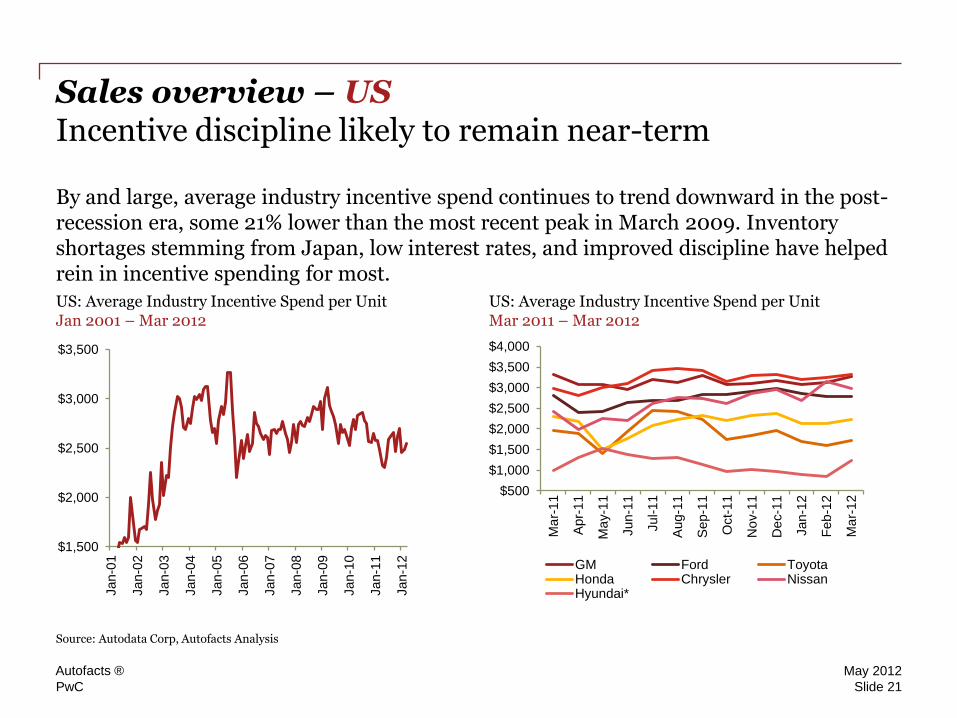
Sales overview – US Incentive discipline likely to remain near-term
Autofacts ®
By and large, average industry incentive spend continues to trend downward in the post-recession era, some 21% lower than the most recent peak in March 2009. Inventory shortages stemming from Japan, low interest rates, and improved discipline have helped rein in incentive spending for most.
US: Average Industry Incentive Spend per Unit Jan 2001 – Mar 2012
US: Average Industry Incentive Spend per Unit Mar 2011 – Mar 2012
$1,500
$2,000
$2,500
$3,000
$3,500
Jan-0
1
Jan-0
2
Jan-0
3
Jan-0
4
Jan-0
5
Jan-0
6
Jan-0
7
Jan-0
8
Jan-0
9
Jan-1
0
Jan-1
1
Jan-1
2
$500
$1,000
$1,500
$2,000
$2,500
$3,000
$3,500
$4,000
Ma
r-1
1
Apr-
11
Ma
y-1
1
Jun-1
1
Jul-1
1
Aug-1
1
Sep-1
1
Oct-
11
No
v-1
1
De
c-1
1
Jan-1
2
Feb
-12
Ma
r-1
2
GM Ford ToyotaHonda Chrysler NissanHyundai*
Source: Autodata Corp, Autofacts Analysis
May 2012
Slide 21

PwC
Assembly outlook – North America New mix footprint returns assembly topline to prior peaks
Autofacts ®
Although GM and Ford will remain atop the output hierarchy, the North American landscape continues to be characterised by additional foreign brand assembly. Recent announcements stating global automakers’ intent to build new global product in North America bodes well for regional light vehicle production.
NA: Light Vehicle Assembly Outlook 1990 – 2018 (millions)
NA: Current Alliance Group Assembly Outlook* 2011 – 2013 (millions)
0%
10%
20%
30%
40%
50%
60%
70%
80%
90%
100%
6789
1011121314151617181920
19
90
19
92
19
94
19
96
19
98
20
00
20
02
20
04
20
06
20
08
20
10
20
12
20
14
20
16
20
18
Assembly Volume Excess Capacity
Utilisation (R-Axis)
0.0 0.5 1.0 1.5 2.0 2.5 3.0 3.5
Other
VW
Hyundai
RN
Honda
Toyota
Fiat
Ford
GM
2013 2012 2011
Source: Autofacts 2012 Q2 Data Release *RN = Renault-Nissan. Chrysler Group LLC is classified under the Fiat Alliance Group outlook, including all potential volume from product sharing within the partnership.
May 2012
Slide 22

The information contained in this report represents the culmination of proprietary research
conducted by Autofacts, an analytical group within the PwC Research & Analysis Organisation.
All material contained in this report was developed independently of any PwC client
relationship and does not represent the firm’s view as an auditor to any legal business entity.
While every effort has been made to ensure the quality of information provided, no
representation or warranty of any kind (whether expressed or implied) is given by PwC as to
the accuracy, completeness or fitness for any purpose of this document. As such, this
document does not constitute the giving of investment advice, nor a part of any advice on
investment decisions. Accordingly, regardless of the form of action, whether in contract, tort or
otherwise, and to the extent permitted by applicable law, PwC accepts no liability of any kind
and disclaims all responsibility for the consequences of any person acting or refraining from
acting in reliance on this document.
© 2012 PricewaterhouseCoopers LLP. All rights reserved. PwC refers to the United States
member firm, and may sometimes refer to the PwC network. Each member firm is a separate
legal entity. Please see www.pwc. com/structure for further details.


