Download - Starboard Value Transforming Darden
8/11/2019 Starboard Value Transforming Darden
http://slidepdf.com/reader/full/starboard-value-transforming-darden 1/294
Transforming Darden Restaurants
September 11, 2014
“ You just have to have good people if you are going have a good operation, wi thout them you are lost.”
– Bil l Darden
8/11/2019 Starboard Value Transforming Darden
http://slidepdf.com/reader/full/starboard-value-transforming-darden 2/294
2
I. Executive summary 3
II. Real change is required at Darden 24
III. It’s all about the people 60
IV. Brinker’s value creation story provides a 76
roadmap for Darden
V. Company-wide margin improvement 89
opportunity
A. Corporate G&A 93
B. Food costs, food waste, and procurement 101
C. Labor 113
D. Facilities 126
E. Advertising and marketing 129
F. Alcoholic beverage 141
G. Table-turns 150
H. Summary 155
VI. Olive Garden 159
A. Darden’s largest brand is in desperate 159
need of a turnaround
TABLE OF CONTENTS
B. Olive Garden’s first turnaround (1994 – 2002) 178
C. Olive Garden turnaround plan 192
VII. Updated real estate valuation 217
VIII. Spin-off of Specialty Restaurant Group 230
IX. Franchising 237
A. International 239
B. Domestic 248
X. 100-day plan 259
XI. Structuring considerations 270
XII. Conclusion 285
Appendix: Analyst and investor sentiment 290
8/11/2019 Starboard Value Transforming Darden
http://slidepdf.com/reader/full/starboard-value-transforming-darden 3/294
3
I. Executive summary
8/11/2019 Starboard Value Transforming Darden
http://slidepdf.com/reader/full/starboard-value-transforming-darden 4/294
4
Overview of Starboard Value LP
Starboard's approach focuses on its discipline of "Value, Plan, and Path".
– Working with industry executives, consultants, customers, partners, competitors, and other advisors, Starboard
develops an alternative plan to create value in each of its investments. This investment process requires a deep
fundamental understanding of a company’s businesses, end markets, and competitive positioning.
In each of its investments, Starboard seeks to engage in constructive discussions with management regarding
corporate strategy and their vision for the future. It is always our preference to work with management and the board. However, in circumstances where it becomes clear that management and the board are not acting in the best
interest of all shareholders, we are prepared to take the necessary action to reconstitute the board with individuals
that have the appropriate skill sets and experience to best oversee the company.
Over the past twelve years, Starboard has added or replaced approximately 119 corporate directors on approximately
43 corporate boards.(1)
– We understand the requirements of public board service and how to be effective in the boardroom while
remaining professional and constructive.
Although it is difficult to quantify the direct impact of change in board composition on stock price performance, in
our experience it has had a material positive impact. According to 13D Monitor, a leading independent research
provider on shareholder activism:
– “Starboard’s average return on a 13D filing is 26.4% (versus an average of 9.7% for the S&P500 during the
same time periods). However, when they have received a board seat, their average 13D return has been
34.5% versus 14.8% for the S&P500.” (2)
(1) Includes investments that Starboard's investment team managed while at Starboard's predecessor, Ramius Value and Opportunity Master Fund, Ltd.
(2) Statistics from 13D Monitor as of August 27, 2014. Past performance is not indicative of future results and no represe ntation is being made herein that any investment will or is likely to achieve returns in line with historical data.
Since 2002, Starboard Value LP (“Starboard”) has focused on unlocking value in underperforming
companies for the benefit of all shareholders. Today, the firm manages more than $3.0 billion with a
proven track record of investment success.
8/11/2019 Starboard Value Transforming Darden
http://slidepdf.com/reader/full/starboard-value-transforming-darden 5/294
5
We believe that with the right Board in place, substantial value can be created for Darden shareholders
Our goal is to dramatically improve Darden for the benefit
of its customers, employees, and shareholders
We believe Darden Restaurants, Inc. (“Darden” or the “Company”) is extremely undervalued.
We invested in Darden because of the substantial opportunity to
unlock value with the right plan and right leadership
Our priorities
Our plan
Why Darden is compelling Infusing a major upgrade in the leadership at Darden.
– Substantially improve the Board of Directors (the
“Board”).
– Appoint a transformational leader as CEO.
– Align incentives with shareholders.
Fixing the culture so employees are once again excited toserve guests.
Substantially improving the value proposition and experience
at Olive Garden to increase guest counts.
Solidifying the investment grade rating and dividend, making
both safer.
Establishing capital discipline and a focus on return-on-
capital. Reducing bureaucracy and costs through a renewed focus on
operations and a decentralized organization.
1. A comprehensive operational improvement plan.
2. A value enhancing strategy for Darden’s real
estate assets.
3. A separation of concepts into the most logical
groupings.
4. A franchising program designed to accelerate
growth both internationally and domestically and
substantially improve returns on capital.
Great brands.
Valuable assets.
Tremendous opportunity to improve operating
performance.
Opportunity to improve returns-on-capital.
1
2
3
4
Note: If a majority of our nominees our elected to the Board, we would expect that our turnaround plan will be implemented. While our turnaround plan has been carefully devised with the assistance of a group of advisors, together with our
nominees, with an eye towards improving the Company’s operations and enhancing shareholder value, there can be no guarantee t hat that the turnaround plan will ultimately create value for shareholders.
8/11/2019 Starboard Value Transforming Darden
http://slidepdf.com/reader/full/starboard-value-transforming-darden 6/294
6
Great brands
– Darden has some of the most recognized brands in casual dining, especially Olive Garden – where
customers have fond memories, but where we believe execution has recently failed to live up to the brand
image.
– Olive Garden has a special place in our hearts as well as millions of others.
– Darden has lost its way, but by bringing back Olive Garden’s value proposition and superior customer
experience, we believe we can increase guest counts substantially.
Valuable assets
– Darden owns substantially more real estate than any of its peers.
– Although management has been hiding behind its “rent subsidy” when measuring their operating
performance, we believe shareholders are best served if the real estate is separated.
We invested in Darden because of the substantial opportunity to
unlock value with the right plan and right leadership (cont’d) We believe there is a tremendous value creation opportunity at Darden.
Darden has a great collection of brands and assets that, if managed correctly, would
drive significant value
8/11/2019 Starboard Value Transforming Darden
http://slidepdf.com/reader/full/starboard-value-transforming-darden 7/2947
Tremendous opportunity to improve operating performance
– As a restaurant operating company, Darden must capitalize on the operational improvementopportunities we believe are achievable.
– By returning to Darden’s roots, focusing on the basics of operating restaurants, and embracing a “quality
up, cost down” mentality, we expect to realize an annual EBITDA improvement of $215 - $326 million.
– We believe our operational improvement plan will enhance the guest experience while reducing costs.
– We see substantial opportunities to operate far more efficiently in the areas of supply chain, procurement,advertising, and G&A.
Opportunity to improve returns on capital
– The current Board has destroyed substantial value through poor capital allocation – Darden has acquired
concepts at extremely high prices and sold concepts at extremely low prices, all while consistently
overspending on capex.
– Darden needs to immediately institute a strict and disciplined capital deployment strategy.
New leadership with a disciplined focus on operational excellence and returns on capital is
desperately needed at Darden
We invested in Darden because of the substantial opportunity to
unlock value with the right plan and right leadership (cont’d)
8/11/2019 Starboard Value Transforming Darden
http://slidepdf.com/reader/full/starboard-value-transforming-darden 8/2948
We have the right plan to transform Darden
We believe we have the right plan to transform Darden.
1. A comprehensive operational improvement plan that includes:
i. A company-wide margin improvement plan that we believe
will increase EBITDA by $215 - $326 million per year while
improving the guest experience.
ii. A turnaround of the Olive Garden concept.
2. A value enhancing strategy for Darden’s real estate assets.
3. A separation of concepts into the most logical groupings.
4. A franchising program designed to accelerate growth both internationally and domestically and
substantially improve returns on capital.
1
2
3
4
With great leaders and successful execution of the operational and strategic initiatives we have
identified, our analysis set forth later in this presentation indicates the Company could be worth
$67 - $86 per share before factoring in the impact of an Olive Garden turnaround or franchising
Note: If a majority of our nominees our elected to the Board, we would expect that our turnaround plan will be implemented. While our turnaround plan has been carefully devised with the assistance of a group of advisors, together with our
nominees, with an eye towards improving the Company’s operations and enhancing shareholder value, there can be no guarantee t hat that the turnaround plan will ultimately create value for shareholders.
8/11/2019 Starboard Value Transforming Darden
http://slidepdf.com/reader/full/starboard-value-transforming-darden 9/2949
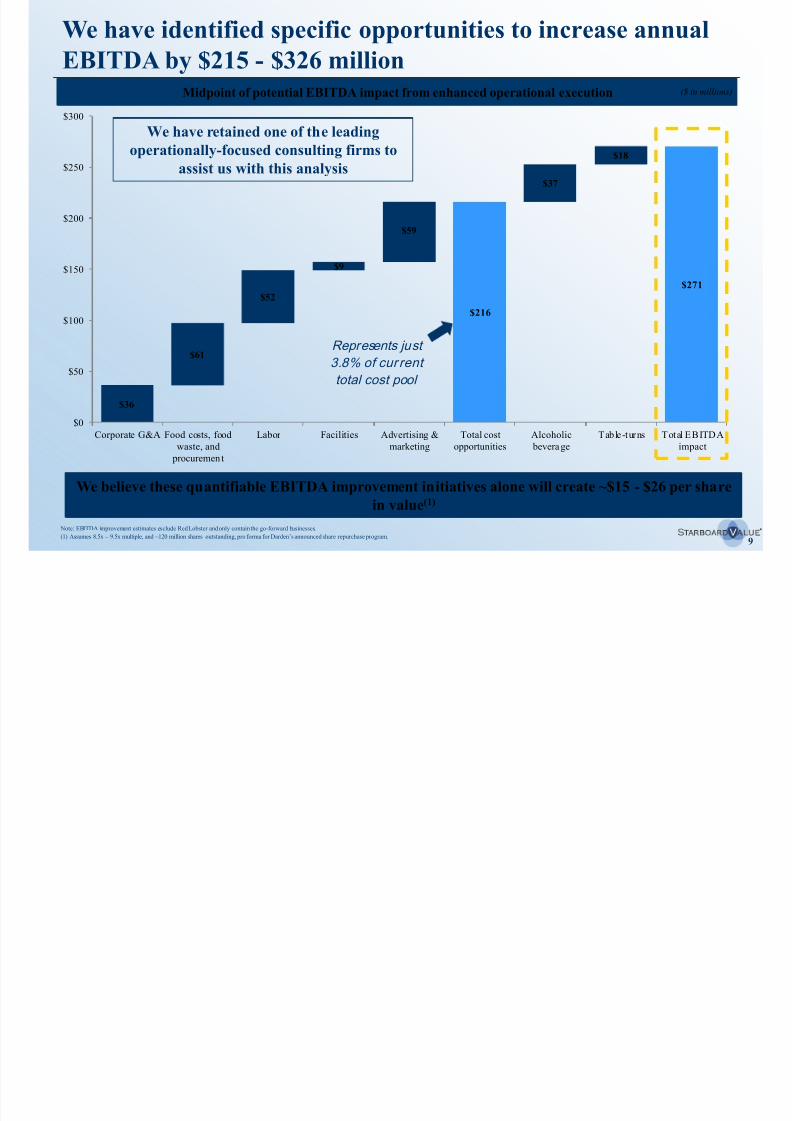
$36
$216
$271
$61
$52
$9
$59
$37
$18
$0
$50
$100
$150
$200
$250
$300
Corporate G&A Food costs, food
waste, and
procuremen t
Labor Facilities Advertising &
marketing
Total cost
opportunities
Alcoholic
beverage
Table-turns Total EBITDA
impact
We have identified specific opportunities to increase annual
EBITDA by $215 - $326 millionMidpoint of potential EBITDA impact from enhanced operational execution ($ in millions)
Represents just
3.8% of cur rent
total cost pool
We believe these quantifiable EBITDA improvement initiatives alone will create ~$15 - $26 per share
in value(1)
We have retained one of the leadingoperationally-focused consulting firms to
assist us with this analysis
(1) Assumes 8.5x – 9.5x multiple, and ~120 million shares outstanding, pro forma for Darden’s announced share repurchase program.
Note: EBITDA improvement estimates exclude Red Lobster and only contain the go-forward businesses.
8/11/2019 Starboard Value Transforming Darden
http://slidepdf.com/reader/full/starboard-value-transforming-darden 10/29410
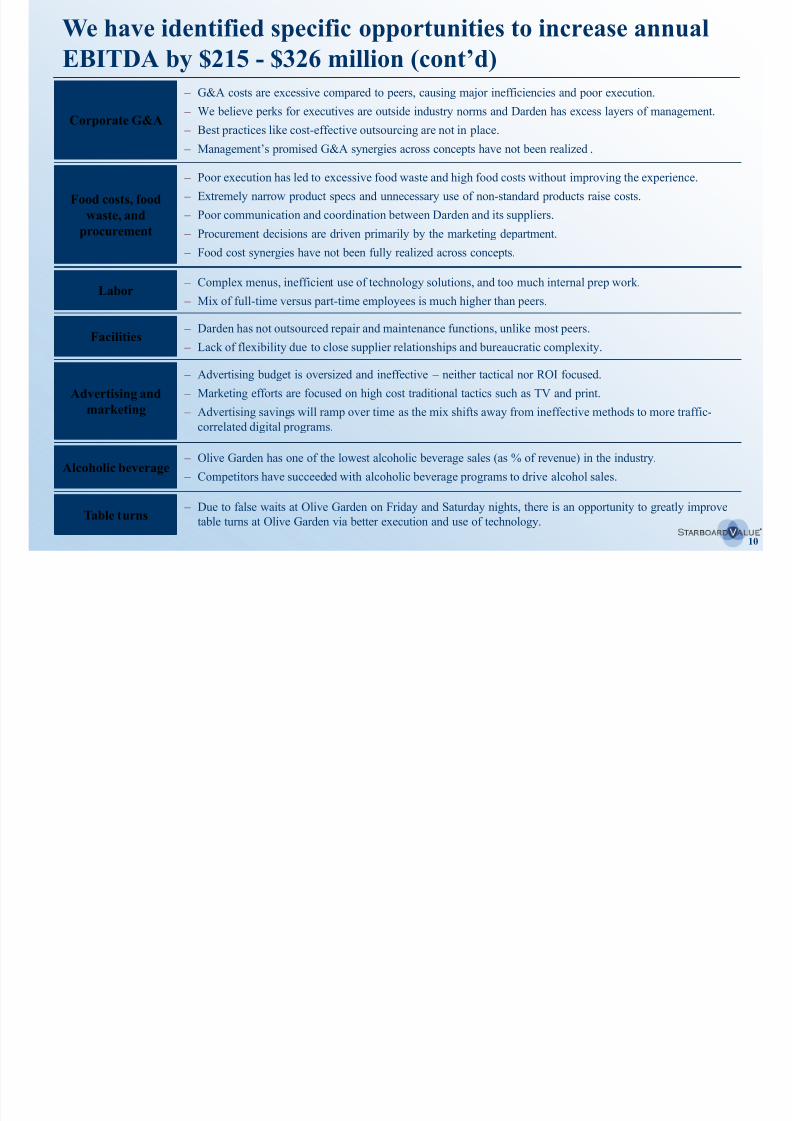
– G&A costs are excessive compared to peers, causing major inefficiencies and poor execution.
– We believe perks for executives are outside industry norms and Darden has excess layers of management.
– Best practices like cost-effective outsourcing are not in place. – Management’s promised G&A synergies across concepts have not been realized .
Corporate G&A
Advertising and
marketing
Food costs, food
waste, and
procurement
Labor
Facilities
Alcoholic beverage
Table turns
We have identified specific opportunities to increase annual
EBITDA by $215 - $326 million (cont’d)
– Advertising budget is oversized and ineffective – neither tactical nor ROI focused.
– Marketing efforts are focused on high cost traditional tactics such as TV and print.
– Advertising savings will ramp over time as the mix shifts away from ineffective methods to more traffic-
correlated digital programs.
– Poor execution has led to excessive food waste and high food costs without improving the experience.
– Extremely narrow product specs and unnecessary use of non-standard products raise costs.
– Poor communication and coordination between Darden and its suppliers.
– Procurement decisions are driven primarily by the marketing department.
– Food cost synergies have not been fully realized across concepts.
– Complex menus, inefficient use of technology solutions, and too much internal prep work.
– Mix of full-time versus part-time employees is much higher than peers.
– Darden has not outsourced repair and maintenance functions, unlike most peers.
– Lack of flexibility due to close supplier relationships and bureaucratic complexity.
– Olive Garden has one of the lowest alcoholic beverage sales (as % of revenue) in the industry.
– Competitors have succeeded with alcoholic beverage programs to drive alcohol sales.
– Due to false waits at Olive Garden on Friday and Saturday nights, there is an opportunity to greatly improve
table turns at Olive Garden via better execution and use of technology.
8/11/2019 Starboard Value Transforming Darden
http://slidepdf.com/reader/full/starboard-value-transforming-darden 11/29411
Substantial value creation opportunity through a real estate
separation and spin-off of the Specialty Restaurant Group (SRG)Darden has an extremely valuable real estate portfolio.
Even after the sale of Red Lobster (the “Red Lobster Sale”), Darden still has the largest real estate portfolio in the casual
dining industry, owning both the land and buildings on nearly 600 stores and the buildings on another 670.
Pro forma for the Red Lobster Sale, we believe that Darden’s remaining real estate is worth $2.5 to $3 billion.
Net of the value of the rent subsidy Darden currently receives for owning its properties, we believe that a real estate
separation could create approximately $1 billion in shareholder value.
Further, we still believe that a real estate separation can be structured in a tax-efficient manner and with minimal
breakage costs, all while enhancing Darden’s credit profile and supporting its dividend.
We believe a spinoff of the Specialty Restaurant Group (SRG) would create value for Darden shareholders.
SRG includes a number of exciting and fast-growing concepts that we believe would be attractive in the public markets,
but that are difficult for investors to fully appreciate and value inside of Darden.
– While Darden’s core brands, Olive Garden and LongHorn, are mainstream casual dining concepts with a national
footprint and hundreds of stores, the SRG brands are significantly higher end niche brands that cater to a very
different customer base, and, we believe, investor base.
The timing of an SRG spinoff will depend on factors including progress towards the turnaround of Olive Garden, the
consolidated financial performance of Darden, and the sustainability of the dividend and investment grade rating (see
Section VIII and Section XI).
In addition to substantial value creation from our operational improvement plan, we believe
a real estate separation and a spinoff of SRG would both create value
8/11/2019 Starboard Value Transforming Darden
http://slidepdf.com/reader/full/starboard-value-transforming-darden 12/29412
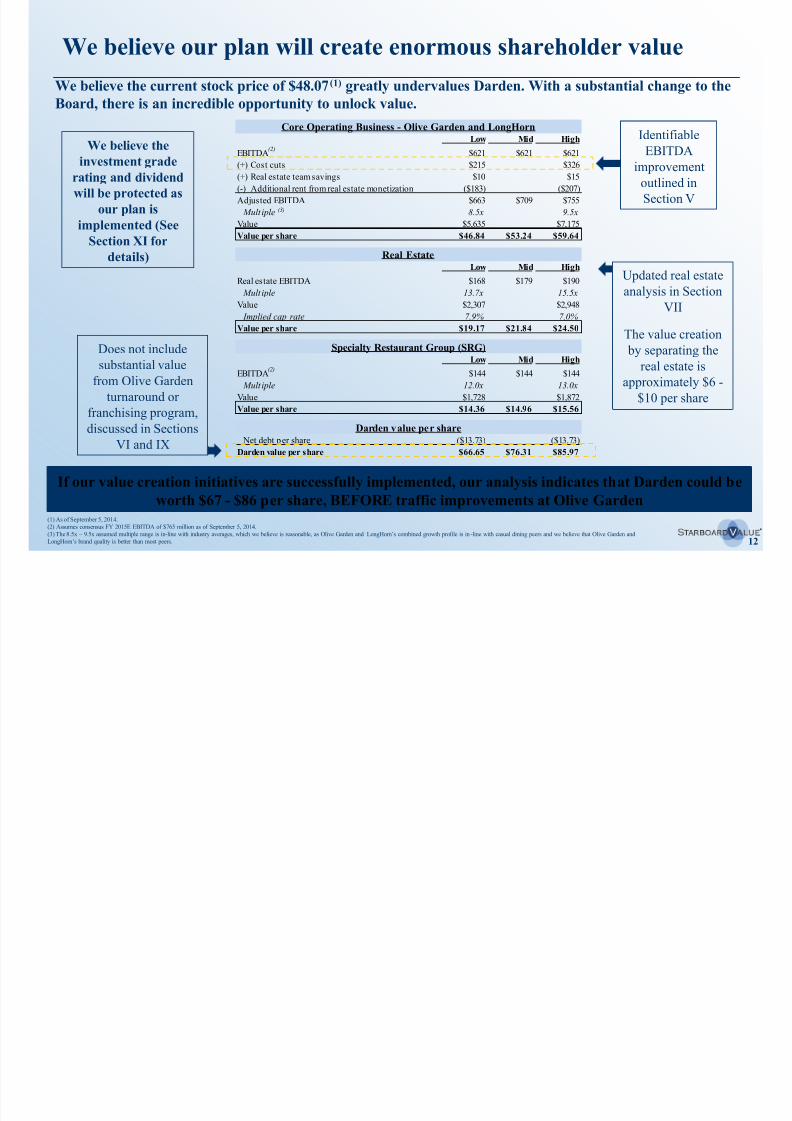
Core Operating Business - Olive Garden and LongHornLow Mid High
EBITDA $621 $621 $621
(+) Cost cuts $215 $326
(+) Real estate team savings $10 $15
(-) Additional rent from real estate monetization ($183) ($207)
Adjusted EBITDA $663 $709 $755
Mult iple 8.5x 9.5x
Value $5,635 $7,175
Value per share $46.84 $53.24 $59.64
Real Estate Low Mid High
Real estate EBITDA $168 $179 $190
Mult iple 13.7x 15.5x
Value $2,307 $2,948
Implied cap rate 7.9% 7.0%
Value per share $19.17 $21.84 $24.50
Specialty Restaurant Group (SRG)Low Mid High
EBITDA $144 $144 $144
Mult iple 12.0x 13.0xValue $1,728 $1,872
Value per share $14.36 $14.96 $15.56
Darden value per share Net debt per share ($13.73) ($13.73)
Darden value per share $66.65 $76.31 $85.97
We believe our plan will create enormous shareholder value
IdentifiableEBITDA
improvement
outlined in
Section V
Updated real estate
analysis in Section
VII
The value creation
by separating the
real estate is
approximately $6 -$10 per share
Does not include
substantial value
from Olive Garden
turnaround or
franchising program,
discussed in Sections
VI and IX
If our value creation initiatives are successfully implemented, our analysis indicates that Darden could be
worth $67 - $86 per share, BEFORE traffic improvements at Olive Garden
We believe the
investment grade
rating and dividend
will be protected as
our plan is
implemented (See
Section XI for
details)
(1) As of September 5, 2014.(2) Assumes consensus FY 2015E EBITDA of $765 million as of September 5, 2014.
(3) The 8.5x – 9.5x assumed multiple range is in-line with industry averages, which we believe is reasonable, as Olive Garden and LongHorn’s combined growth profile is in-line with casual dining peers and we believe that Olive Garden and
LongHorn’s brand quality is better than most peers.
(3)
(2)
(2)
We believe the current stock price of $48.07(1) greatly undervalues Darden. With a substantial change to the
Board, there is an incredible opportunity to unlock value.
8/11/2019 Starboard Value Transforming Darden
http://slidepdf.com/reader/full/starboard-value-transforming-darden 13/29413
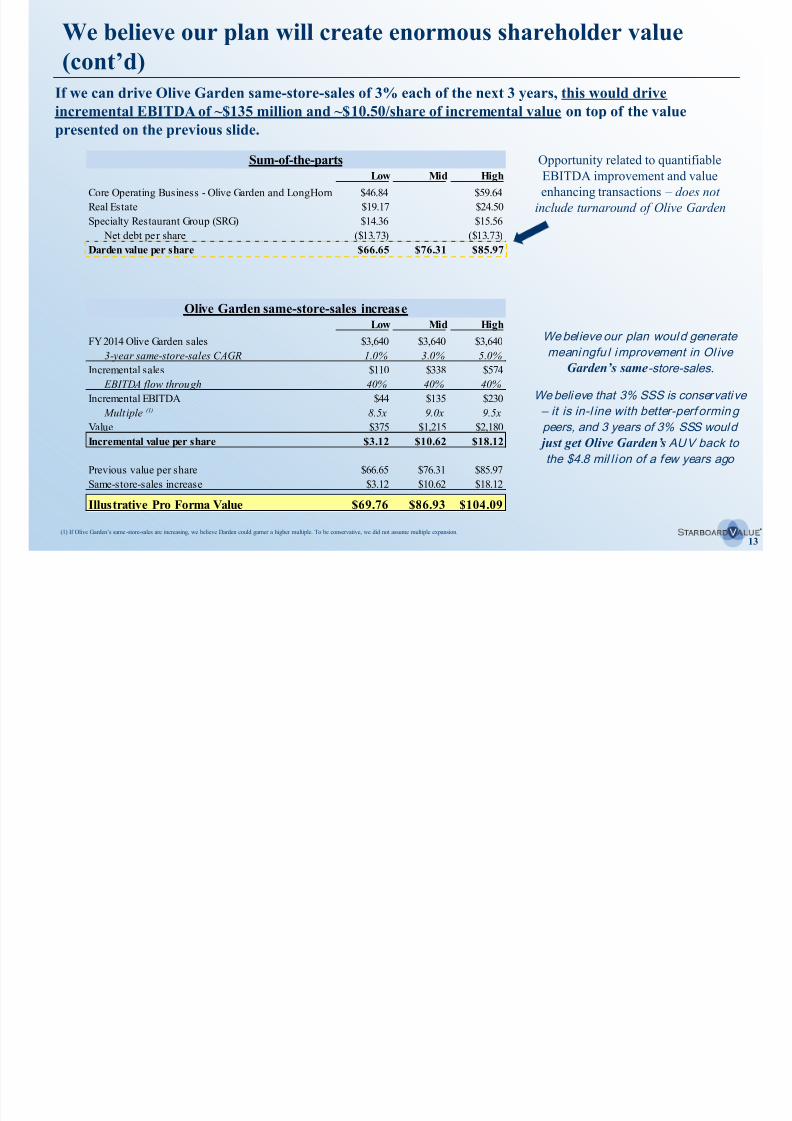
Sum-of-the-parts
Low Mid High
Core Operating Business - Olive Garden and LongHorn $46.84 $59.64
Real Estate $19.17 $24.50
Specialty Restaurant Group (SRG) $14.36 $15.56
Net debt per share ($13.73) ($13.73)
Darden value per share $66.65 $76.31 $85.97
Olive Garden same-store-sales increase
Low Mid High
FY 2014 Olive Garden sales $3,640 $3,640 $3,640
3-year same-store-sales CAGR 1.0% 3.0% 5.0%
Incremental sales $110 $338 $574
EBITDA flow through 40% 40% 40%Incremental EBITDA $44 $135 $230
Multiple 8.5x 9.0x 9.5x
Value $375 $1,215 $2,180
Incremental value per share $3.12 $10.62 $18.12
Previous value per share $66.65 $76.31 $85.97
Same-store-sales increase $3.12 $10.62 $18.12
Illustrative Pro Forma Value $69.76 $86.93 $104.09
We believe our plan will create enormous shareholder value
(cont’d)
We believe our plan would generate
meaningfu l improvement in Ol ive
Garden’s same-store-sales.
We believe that 3% SSS is conservative
– it is in-l ine with better-perf orming
peers, and 3 years of 3% SSS would
just get Olive Garden’s AUV back to
the $4.8 mil l ion of a few years ago
If we can drive Olive Garden same-store-sales of 3% each of the next 3 years, this would drive
incremental EBITDA of ~$135 million and ~$10.50/share of incremental value on top of the value
presented on the previous slide.
Opportunity related to quantifiable
EBITDA improvement and value
enhancing transactions – does not
include turnaround of Olive Garden
(1) If Olive Garden’s same-store-sales are increasing, we believe Darden could garner a higher multiple. To be conservative, we did not assume multiple expansion.
(1)
8/11/2019 Starboard Value Transforming Darden
http://slidepdf.com/reader/full/starboard-value-transforming-darden 14/29414
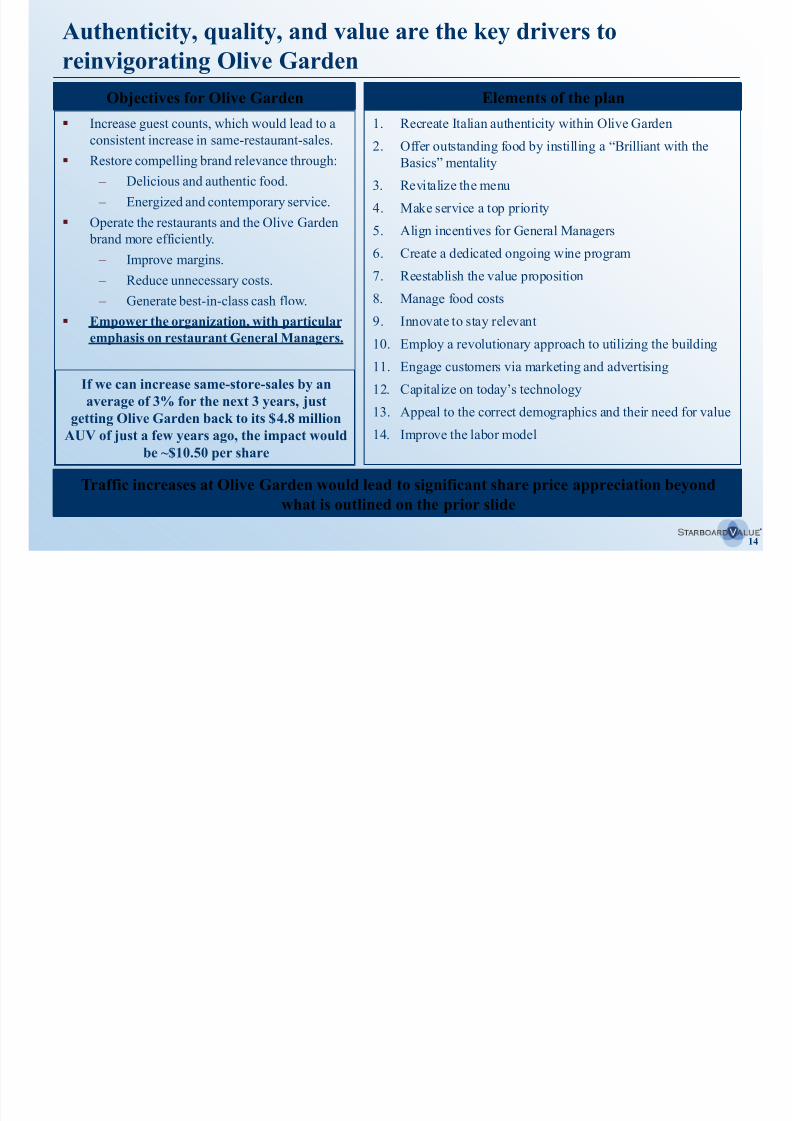
Authenticity, quality, and value are the key drivers to
reinvigorating Olive Garden
Increase guest counts, which would lead to aconsistent increase in same-restaurant-sales.
Restore compelling brand relevance through:
– Delicious and authentic food.
– Energized and contemporary service.
Operate the restaurants and the Olive Garden
brand more efficiently.
– Improve margins. – Reduce unnecessary costs.
– Generate best-in-class cash flow.
Empower the organization, with particular
emphasis on restaurant General Managers.
Objectives for Olive Garden Elements of the plan
1. Recreate Italian authenticity within Olive Garden2. Offer outstanding food by instilling a “Brilliant with the
Basics” mentality
3. Revitalize the menu
4. Make service a top priority
5. Align incentives for General Managers
6. Create a dedicated ongoing wine program7. Reestablish the value proposition
8. Manage food costs
9. Innovate to stay relevant
10. Employ a revolutionary approach to utilizing the building
11. Engage customers via marketing and advertising
12. Capitalize on today’s technology
13. Appeal to the correct demographics and their need for value
14. Improve the labor model
Traffic increases at Olive Garden would lead to significant share price appreciation beyond
what is outlined on the prior slide
If we can increase same-store-sales by anaverage of 3% for the next 3 years, just
getting Olive Garden back to its $4.8 million
AUV of just a few years ago, the impact would
be ~$10.50 per share
8/11/2019 Starboard Value Transforming Darden
http://slidepdf.com/reader/full/starboard-value-transforming-darden 15/29415
Our highly qualified nominees have the right mix of skill sets and
expertise to oversee and enact our transformation plan for Darden
We have carefully selected a cohesive group of candidates with unique and complementary skill sets
and perspectives directly relevant to Darden’s business and current challenges, including:
i. Experienced restaurant operators with expertise in Darden’s major business lines.
ii. Experts in real estate, finance, turnarounds, and supply chain.
iii. Effective stewards of public company governance with a proven record of recruiting transformational
CEOs and initiating shareholder friendly compensation programs.
– These director candidates, if elected, will commit to fairly and objectively representing the best interests of all
shareholders.
We approached recruiting the Board the same way a manager fields a baseball team – with a well balanced groupwhere each player contributes complementary skill sets.
– We did not know most of our nominees prior to our involvement in Darden, only two of our 12 nominees have an
affiliation with Starboard, and all of our nominees qualify as independent under NYSE standards.
– Most importantly, all of our nominees commit to fairly and objectively representing the best interests of all
shareholders.
Several of our nominees have successfully turned around restaurants in the past, including Olive Garden.
– Brad Blum previously led Olive Garden for 7+ years, achieving 29 consecutive quarters of same-restaurant-salesincreases, and increased average annual sales per restaurant from approximately $2.5 million to $4 million while
significantly increasing overall profits (see Section VI.A for a case study on Olive Garden’s first turnaround).
– Chuck Sonsteby is one of the architects behind Brinker’s historic turnaround, which drove 400%+ total
shareholder return (see Section IV for a case study on Brinker’s transformation).
We believe electing our nominees will be the first step in reinstating Darden’s people-
centric and operationally-focused culture
8/11/2019 Starboard Value Transforming Darden
http://slidepdf.com/reader/full/starboard-value-transforming-darden 16/29416
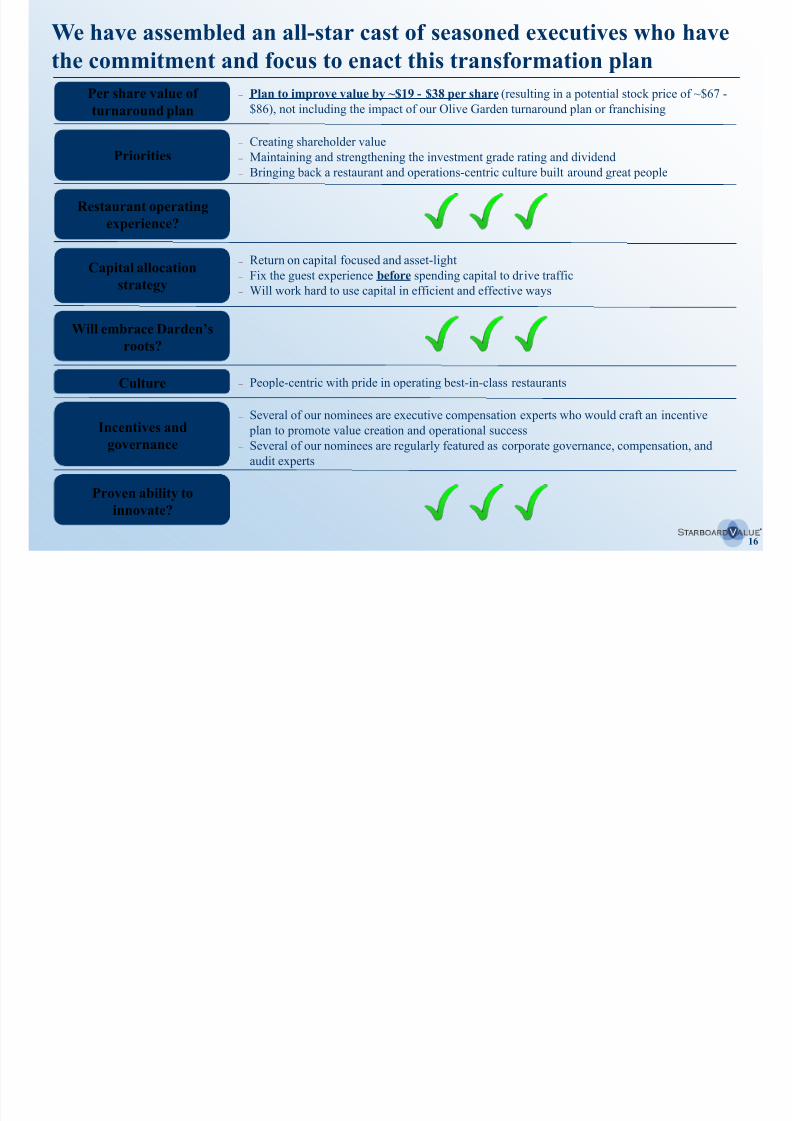
We have assembled an all-star cast of seasoned executives who have
the commitment and focus to enact this transformation plan
Per share value of
turnaround plan
Capital allocation
strategy
Priorities
Restaurant operating
experience?
– Plan to improve value by ~$19 - $38 per share (resulting in a potential stock price of ~$67 -
$86), not including the impact of our Olive Garden turnaround plan or franchising
– Creating shareholder value
– Maintaining and strengthening the investment grade rating and dividend
– Bringing back a restaurant and operations-centric culture built around great people
– Return on capital focused and asset-light – Fix the guest experience before spending capital to drive traffic
– Will work hard to use capital in efficient and effective ways
Culture
Incentives and
governance
Proven ability to
innovate?
–
People-centric with pride in operating best-in-class restaurants
– Several of our nominees are executive compensation experts who would craft an incentive
plan to promote value creation and operational success
– Several of our nominees are regularly featured as corporate governance, compensation, and
audit experts
Will embrace Darden’sroots?
8/11/2019 Starboard Value Transforming Darden
http://slidepdf.com/reader/full/starboard-value-transforming-darden 17/29417
Establish a strong leadership team with the
relevant experience and passion to drive
results.
This begins with a thorough search
process to find the next CEO of Darden.
Vastly improve the performance of the
Company through strict operating discipline
and intelligent capital allocation.
Maintain and solidify the existing
dividend.
Maintain and solidify the investment
grade rating.
Create substantial value for
shareholders.
Our goals for Darden How have we prepared to accomplish these goals?
We have assembled a team of extremely talented restaurant
operators, turnaround specialists, real estate experts, and
corporate governance veterans who are ready, willing, and able to
tackle each opportunity.
We have engaged:
A team of highly accomplished restaurant operators with
expertise directly relevant to Darden’s current problems.
One of the world’s leading operationally-focused consultingfirms with substantial expertise in casual dining.
Green Street Advisors, the world’s leading real estate valuation
firm.
Leading experts in debt and tax structuring.
We have spent nearly 2 years developing and refining our
transformation plan, including conducting detailed customer surveys,commissioning 100+ mystery shops across all of Olive Garden’s
major markets, and mining thousands of online customer reviews.
In total, our team includes 60+ experts each contributing to a specific
aspect of our plan and its implementation.
Our nominees are fully prepared to execute on our transformation plan
We have assembled an all-star cast of seasoned executives who have
the commitment and focus to enact this transformation plan (cont’d)
8/11/2019 Starboard Value Transforming Darden
http://slidepdf.com/reader/full/starboard-value-transforming-darden 18/29418
+60%
(20%)
(10%)
0%
10%
20%
30%
40%
50%
60%
70%
TSRA S&P 500
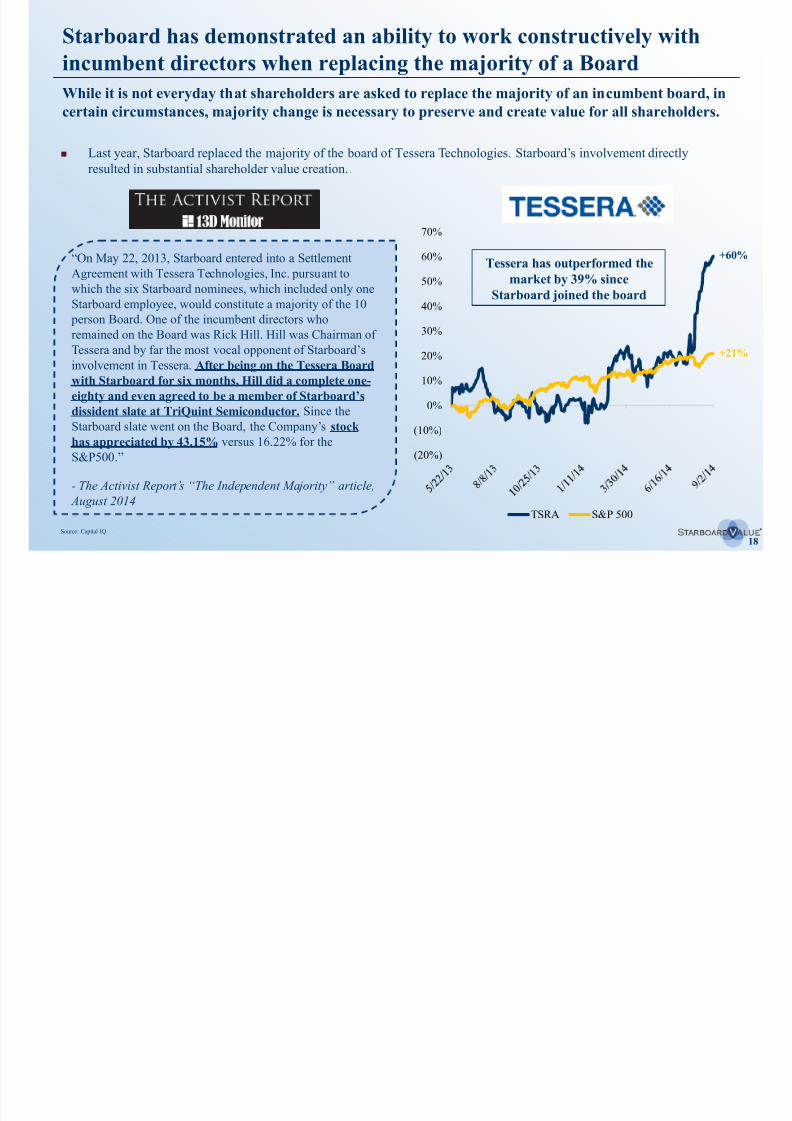
Starboard has demonstrated an ability to work constructively with
incumbent directors when replacing the majority of a Board
“On May 22, 2013, Starboard entered into a SettlementAgreement with Tessera Technologies, Inc. pursuant to
which the six Starboard nominees, which included only one
Starboard employee, would constitute a majority of the 10
person Board. One of the incumbent directors who
remained on the Board was Rick Hill. Hill was Chairman of
Tessera and by far the most vocal opponent of Starboard’s
involvement in Tessera. After being on the Tessera Board
with Starboard for six months, Hill did a complete one-
eighty and even agreed to be a member of Starboard’sdissident slate at TriQuint Semiconductor. Since the
Starboard slate went on the Board, the Company’s stock
has appreciated by 43.15% versus 16.22% for the
S&P500.”
- The Activist Report’s “The Independent Majority” article,
August 2014
While it is not everyday that shareholders are asked to replace the majority of an incumbent board, in
certain circumstances, majority change is necessary to preserve and create value for all shareholders.
+21%
Tessera has outperformed themarket by 39% since
Starboard joined the board
Source: Capital IQ.
Last year, Starboard replaced the majority of the board of Tessera Technologies. Starboard’s involvement directly
resulted in substantial shareholder value creation.
8/11/2019 Starboard Value Transforming Darden
http://slidepdf.com/reader/full/starboard-value-transforming-darden 19/29419
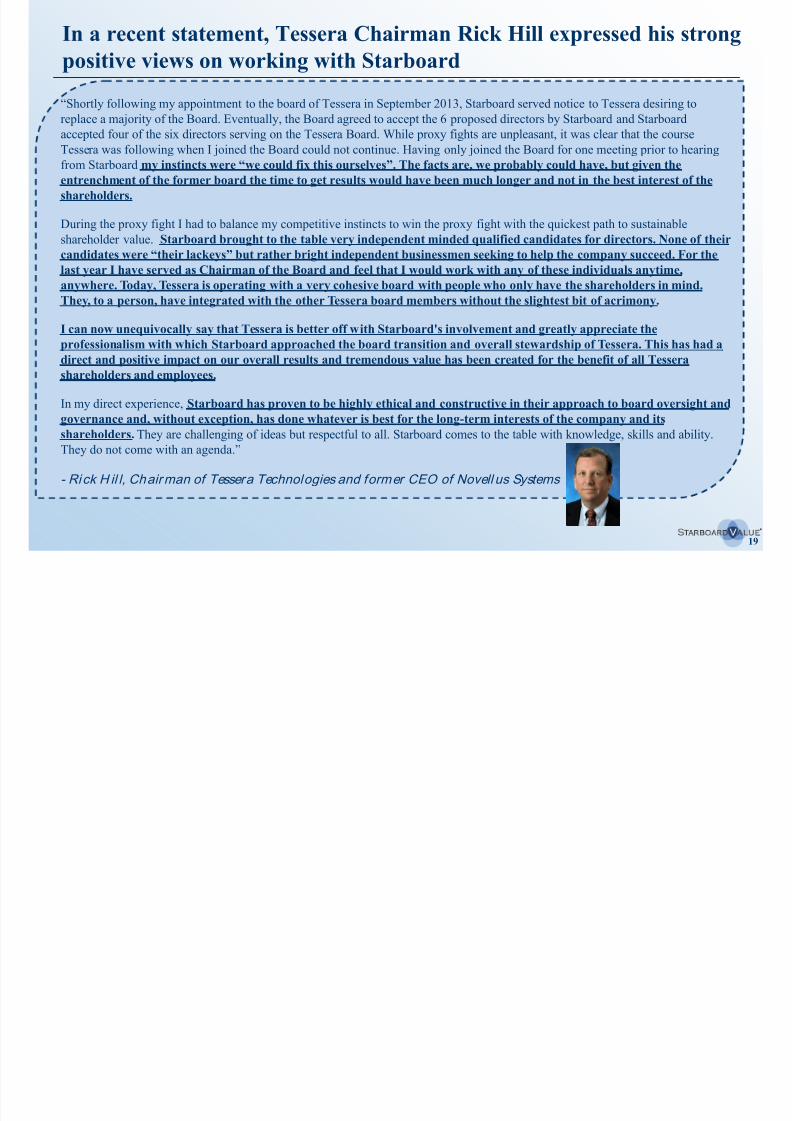
In a recent statement, Tessera Chairman Rick Hill expressed his strong
positive views on working with Starboard
“Shortly following my appointment to the board of Tessera in September 2013, Starboard served notice to Tessera desiring to
replace a majority of the Board. Eventually, the Board agreed to accept the 6 proposed directors by Starboard and Starboard
accepted four of the six directors serving on the Tessera Board. While proxy fights are unpleasant, it was clear that the courseTessera was following when I joined the Board could not continue. Having only joined the Board for one meeting prior to hearing
from Starboard my instincts were “we could fix this ourselves”. The facts are, we probably could have, but given theentrenchment of the former board the time to get results would have been much longer and not in the best interest of the
shareholders.
During the proxy fight I had to balance my competitive instincts to win the proxy fight with the quickest path to sustainable
shareholder value. Starboard brought to the table very independent minded qualified candidates for directors. None of their
candidates were “their lackeys” but rather bright independent businessmen seeking to help the company succeed. For thelast year I have served as Chairman of the Board and feel that I would work with any of these individuals anytime,
anywhere. Today, Tessera is operating with a very cohesive board with people who only have the shareholders in mind.
They, to a person, have integrated with the other Tessera board members without the slightest bit of acrimony.
I can now unequivocally say that Tessera is better off with Starboard's involvement and greatly appreciate the
professionalism with which Starboard approached the board transition and overall stewardship of Tessera. This has had a
direct and positive impact on our overall results and tremendous value has been created for the benefit of all Tessera
shareholders and employees.
In my direct experience, Starboard has proven to be highly ethical and constructive in their approach to board oversight and
governance and, without exception, has done whatever is best for the long-term interests of the company and its
shareholders. They are challenging of ideas but respectful to all. Starboard comes to the table with knowledge, skills and ability.
They do not come with an agenda.”
- Rick H il l, Chairman of Tessera Technologies and former CEO of Novell us Systems
8/11/2019 Starboard Value Transforming Darden
http://slidepdf.com/reader/full/starboard-value-transforming-darden 20/29420
(50%)
0%
50%
100%
150%
200%
9/14/12 1/12/13 5/12/13 9/9/13 1/7/14 5/7/14 9/4/14
Office Depot S&P 500
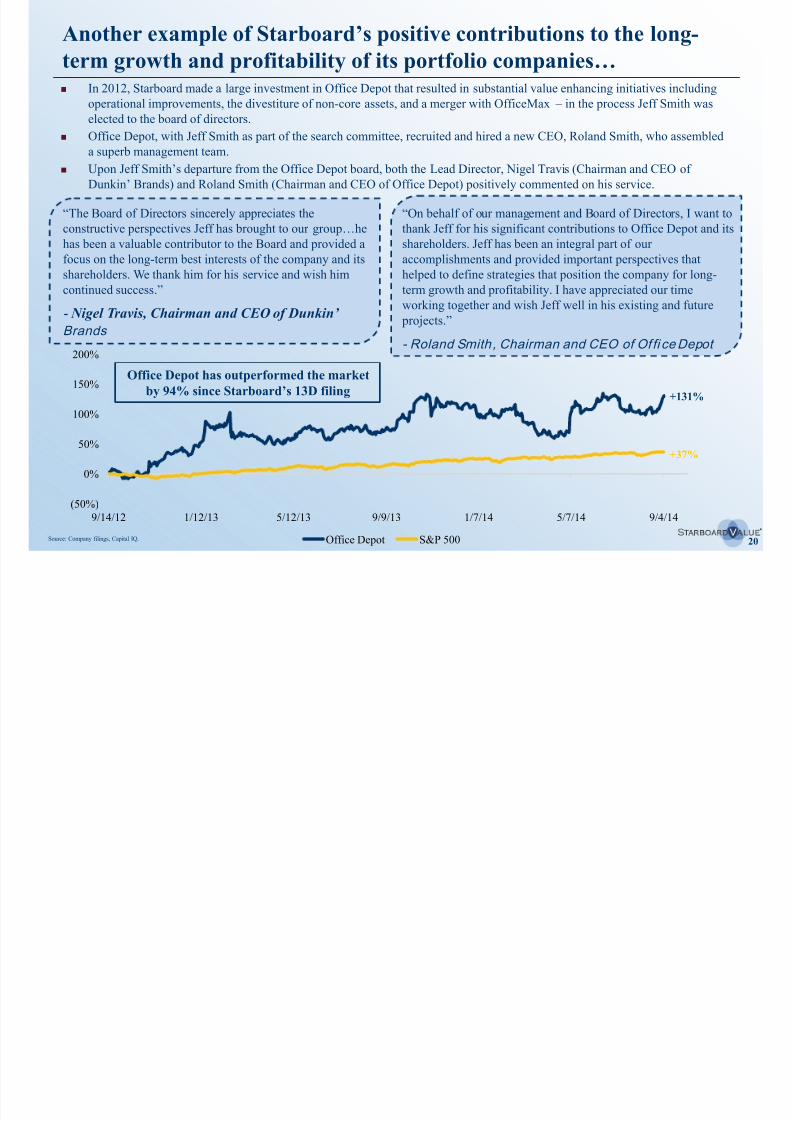
Another example of Starboard’s positive contributions to the long-
term growth and profitability of its portfolio companies…
“The Board of Directors sincerely appreciates the
constructive perspectives Jeff has brought to our group…he
has been a valuable contributor to the Board and provided a
focus on the long-term best interests of the company and itsshareholders. We thank him for his service and wish him
continued success.”
- Nigel Travis, Chairman and CEO of Dunkin’
Brands
“On behalf of our management and Board of Directors, I want to
thank Jeff for his significant contributions to Office Depot and its
shareholders. Jeff has been an integral part of our
accomplishments and provided important perspectives thathelped to define strategies that position the company for long-
term growth and profitability. I have appreciated our time
working together and wish Jeff well in his existing and future
projects.”
- Roland Smith, Chairman and CEO of Of fi ce Depot
+131%
+37%
Office Depot has outperformed the market
by 94% since Starboard’s 13D filing
Source: Company filings, Capital IQ.
In 2012, Starboard made a large investment in Office Depot that resulted in substantial value enhancing initiatives including
operational improvements, the divestiture of non-core assets, and a merger with OfficeMax – in the process Jeff Smith was
elected to the board of directors.
Office Depot, with Jeff Smith as part of the search committee, recruited and hired a new CEO, Roland Smith, who assembleda superb management team.
Upon Jeff Smith’s departure from the Office Depot board, both the Lead Director, Nigel Travis (Chairman and CEO of
Dunkin’ Brands) and Roland Smith (Chairman and CEO of Office Depot) positively commented on his service.
8/11/2019 Starboard Value Transforming Darden
http://slidepdf.com/reader/full/starboard-value-transforming-darden 21/29421
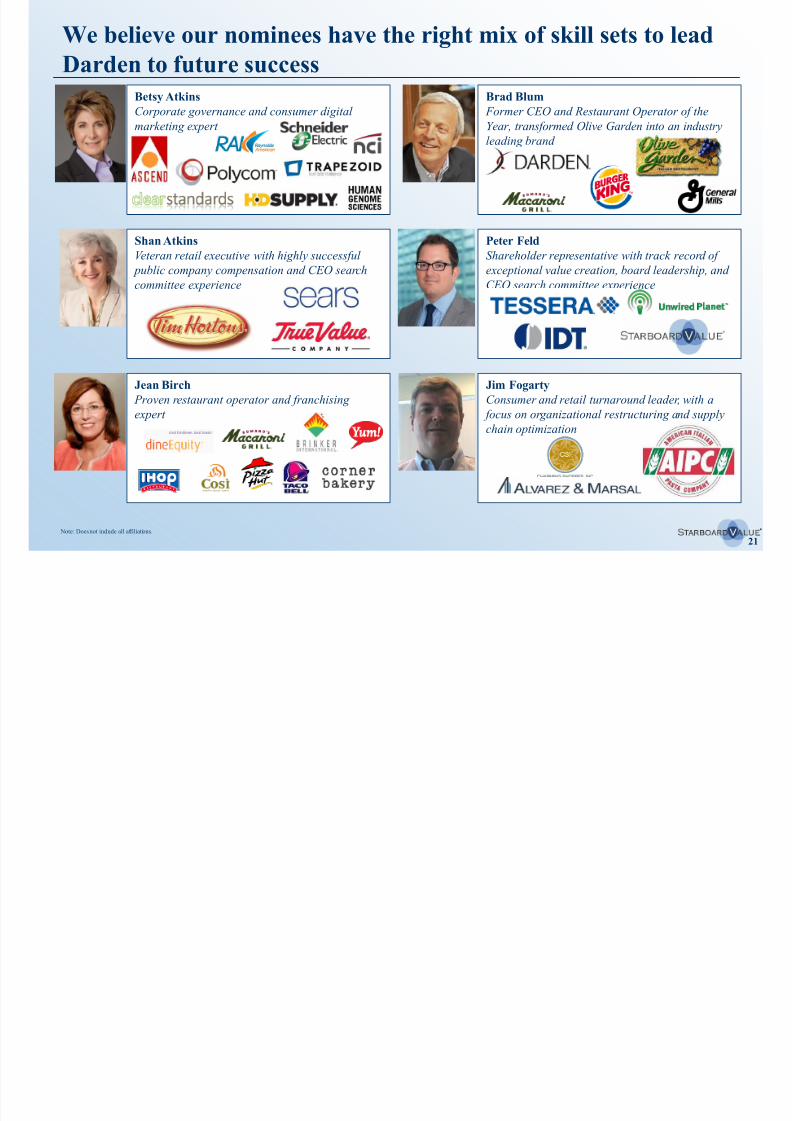
We believe our nominees have the right mix of skill sets to lead
Darden to future success
Betsy Atkins
Corporate governance and consumer digital
marketing expert
Shan Atkins
Veteran retail executive with highly successful public company compensation and CEO search
committee experience
Jean Birch Proven restaurant operator and franchising
expert
Brad Blum
Former CEO and Restaurant Operator of the
Year, transformed Olive Garden into an industryleading brand
Peter Feld
Shareholder representative with track record ofexceptional value creation, board leadership, and
CEO search committee experience
Jim FogartyConsumer and retail turnaround leader, with a
focus on organizational restructuring and supply
chain optimization
Note: Does not include all affiliations.

8/11/2019 Starboard Value Transforming Darden
http://slidepdf.com/reader/full/starboard-value-transforming-darden 22/29422
We believe our nominees have the right mix of skill sets to lead
Darden to future success (cont’d) Cindie Jamison
Experienced turnaround CFO with highly
successful compensation, audit, and CEO searchexperience
Bill Lenehan
Real estate expert, highly successful public REITCEO, board member, and investor
Lionel Nowell Financial expert, decorated board and audit
committee leader, and experienced food and
beverage executive
Jeff Smith
Shareholder representative with track record of
exceptional value creation, board leadership, andCEO search committee experience
Chuck Sonsteby
Casual dining transformation leader, recognizedas One of America’s Best CFOs
Alan StillmanVisionary founder and CEO of multiple iconic
restaurant concepts
Note: Does not include all affiliations.
8/11/2019 Starboard Value Transforming Darden
http://slidepdf.com/reader/full/starboard-value-transforming-darden 23/294
23
Protect and enhance your investment by voting on the
WHITE proxy card today
New leadership is needed to dramatically improve
Darden
Help Darden take the first steps in its long overdue
transformation
Your vote is critical
Vote on Starboard’s WHITE proxy card today
Vote for change
Vote to allow us to significantly improve Darden for the benefit
of shareholders
Vote on Starboard's WHITE proxy card today
Our goal is to
dramatically improve
Darden for the benefit of
its customers, employees,and shareholders
8/11/2019 Starboard Value Transforming Darden
http://slidepdf.com/reader/full/starboard-value-transforming-darden 24/294
24
II. Real change is required at Darden

8/11/2019 Starboard Value Transforming Darden
http://slidepdf.com/reader/full/starboard-value-transforming-darden 25/294
25
Share Price Performance(1)
1 Year 3 Year 5 Year
S&P 500 Index 20% 52% 171%
RUSSELL 3000 Restaurants Industry 18% 68% 212%
Proxy Group (2) 29% 93% 412%
Closest Direct Peers (3) 34% 80% 400%
Darden Restaurants, Inc. 5% 18% 104%
Underperformance vs. S&P 500 (15%) (34%) (66%)
Underperformance vs. RUSSELL 3000 (13%) (50%) (108%)Underperformance vs. Proxy Group (24%) (75%) (308%)
Underperformance vs. Closest Direct Peers (29%) (62%) (296%)
Management and the Board have destroyed shareholder value…
Summary Returns Five-Year Stock Price Chart
Three-Year Stock Price Chart One-Year Stock Price Chart
Darden’s stock price has materially underperformed the broader equity markets, its Proxy Peer Group andits closest direct competitors over the last 1-, 3-, and 5-year periods.
0%
100%
200%
300%
400%
500%
600%
Mar-09 Jan-10 Nov-10 Sep-11 Jul-12 May-13 Mar-14
Darden Proxy Peer GroupClosest Direct Competitors S&P 500 IndexRussell 3000 Restaurant Sector Index
-10%
0%
10%
20%
30%
40%
Mar-13 May-13 Jul-13 Oct-13 Dec-13 Mar-14
Darden Proxy Peer GroupClosest Direct Competitors S&P 500 IndexRussell 3000 Restaurant Sector Index
-25%
0%
25%
50%
75%
100%
Mar-11 Oct-11 May-12 Dec-12 Jul-13 Mar-14
Darden Proxy Peer GroupClosest Direct Competitors S&P 500 IndexRussell 3000 Restaurant Sector Index
Source: Capital IQ.
Note: For each time period, excludes companies not publicly traded throughout that entire period.(1) As of March 14, 2014, adjusted for dividends.(2) Proxy Group consists of companies used in the Company's proxy statement to set executive compensation.
(3) Includes EAT, BLMN, DIN, BWLD, TXRH, RT, RRGB, BBRG, CAKE, and DFRG.
300% underperformance over 5 years, and that was before the Red Lobster debacle
8/11/2019 Starboard Value Transforming Darden
http://slidepdf.com/reader/full/starboard-value-transforming-darden 26/294
26
$43.00
$45.00
$47.00
$49.00
$51.00
$53.00
12/2/13 1/6/14 2/10/14 3/17/14 4/21/14 5/26/14 6/30/14 8/4/14
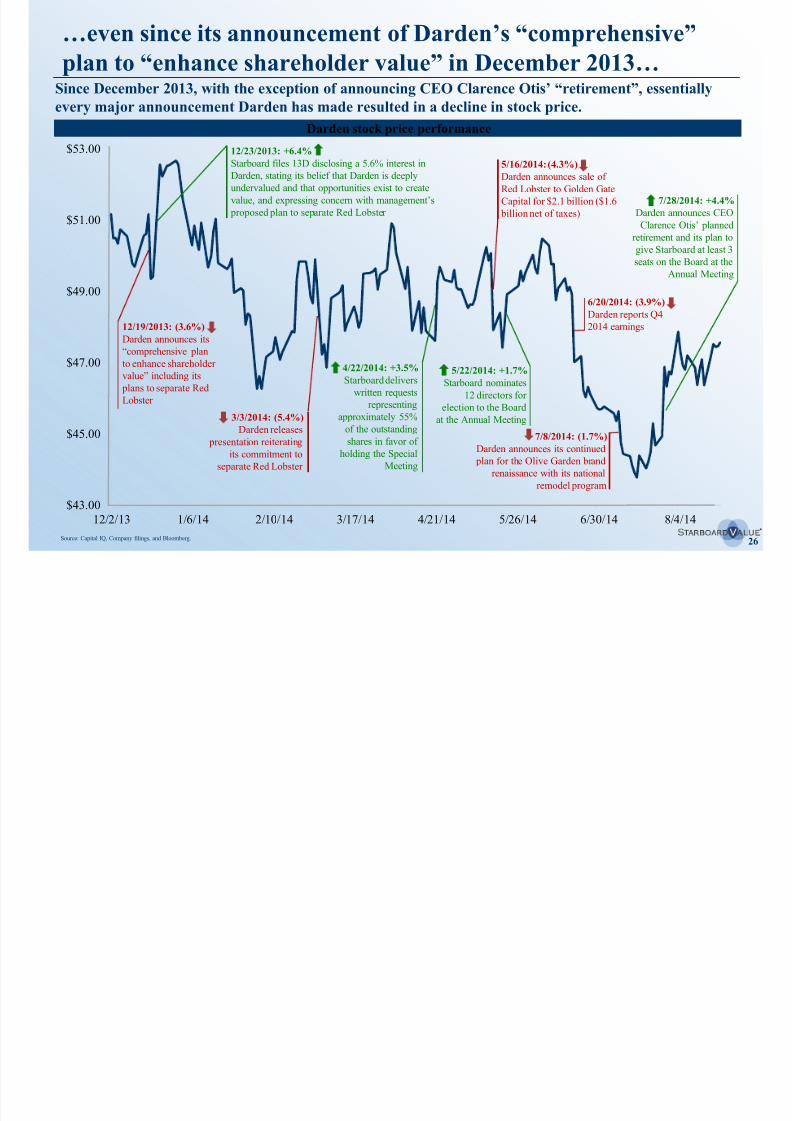
…even since its announcement of Darden’s “comprehensive”plan to “enhance shareholder value” in December 2013…
Since December 2013, with the exception of announcing CEO Clarence Otis’ “retirement”, essentiallyevery major announcement Darden has made resulted in a decline in stock price.
Darden stock price performance
12/19/2013: (3.6%)
Darden announces its
“comprehensive plan
to enhance shareholder
value” including its
plans to separate RedLobster
12/23/2013: +6.4%
Starboard files 13D disclosing a 5.6% interest in
Darden, stating its belief that Darden is deeply
undervalued and that opportunities exist to create
value, and expressing concern with management’s
proposed plan to separate Red Lobster
3/3/2014: (5.4%)
Darden releases
presentation reiterating
its commitment to
separate Red Lobster
5/16/2014: (4.3%)
Darden announces sale of
Red Lobster to Golden Gate
Capital for $2.1 billion ($1.6
billion net of taxes)
6/20/2014: (3.9%)
Darden reports Q4
2014 earnings
7/8/2014: (1.7%)
Darden announces its continued
plan for the Olive Garden brand
renaissance with its national
remodel program
7/28/2014: +4.4%
Darden announces CEO
Clarence Otis’ planned
retirement and its plan to
give Starboard at least 3
seats on the Board at theAnnual Meeting
5/22/2014: +1.7%
Starboard nominates
12 directors for
election to the Board
at the Annual Meeting
Source: Capital IQ, Company filings, and Bloomberg.
4/22/2014: +3.5%
Starboard delivers
written requestsrepresenting
approximately 55%
of the outstanding
shares in favor of
holding the Special
Meeting
8/11/2019 Starboard Value Transforming Darden
http://slidepdf.com/reader/full/starboard-value-transforming-darden 27/294
27
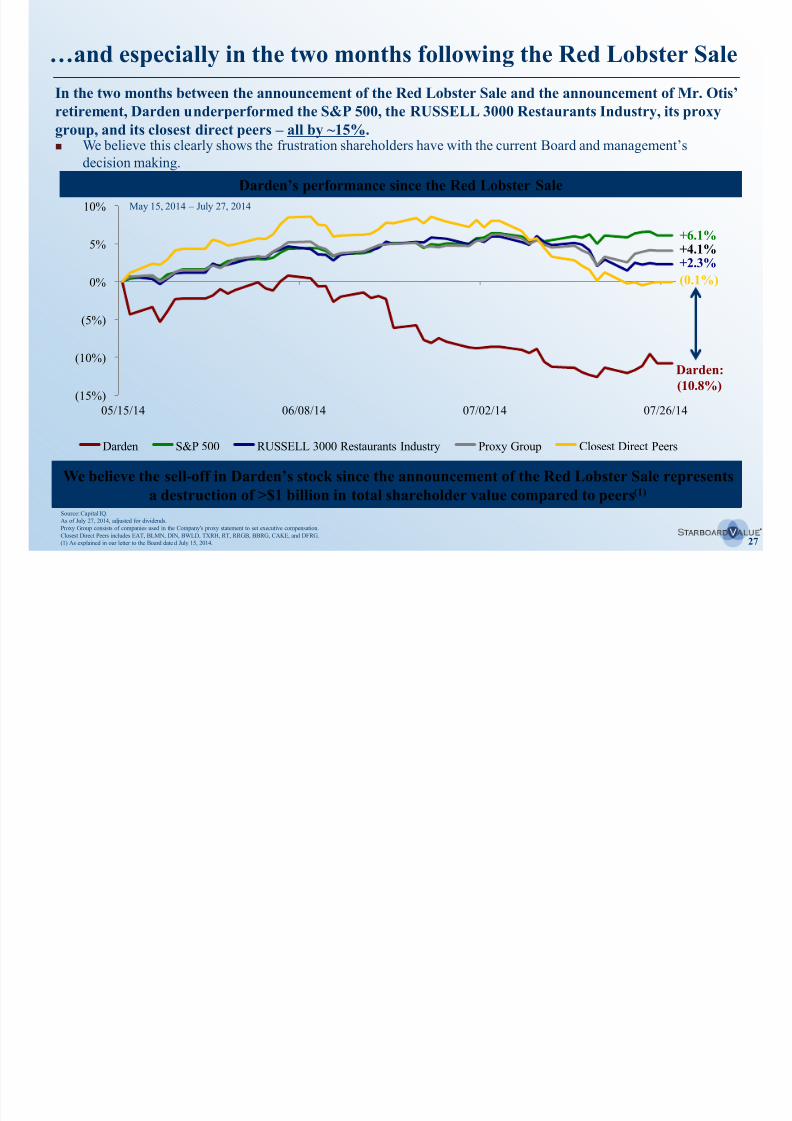
…and especially in the two months following the Red Lobster Sale
In the two months between the announcement of the Red Lobster Sale and the announcement of Mr. Otis’retirement, Darden underperformed the S&P 500, the RUSSELL 3000 Restaurants Industry, its proxy
group, and its closest direct peers – all by ~15%.
Source: Capital IQ.
As of July 27, 2014, adjusted for dividends.Proxy Group consists of companies used in the Company's proxy statement to set executive compensation.
Closest Direct Peers includes EAT, BLMN, DIN, BWLD, TXRH, RT, RRGB, BBRG, CAKE, and DFRG.
(1) As explained in our letter to the Board date d July 15, 2014.
We believe this clearly shows the frustration shareholders have with the current Board and management’s
decision making.
We believe the sell-off in Darden’s stock since the announcement of the Red Lobster Sale representsa destruction of >$1 billion in total shareholder value compared to peers(1)
Darden:
(10.8%)
(0.1%)+2.3%
+4.1%+6.1%
Darden’s performance since the Red Lobster Sale
May 15, 2014 – July 27, 2014
(15%)
(10%)
(5%)
0%
5%
10%
05/15/14 06/08/14 07/02/14 07/26/14
Darden S&P 500 RUSSELL 3000 Restaurants Industry Proxy Group Closest Direct Peers
8/11/2019 Starboard Value Transforming Darden
http://slidepdf.com/reader/full/starboard-value-transforming-darden 28/294
28
How have Darden’s management team and Board memberscontributed to this massive underperformance?
The current Board members and management embody a “corporate-centric” culture and have forgotten the ways of Bill
Darden and Joe Lee, true restaurant operators and leaders.
– The asset-and corporate-heavy structure Darden now maintains hinders it from successfully running great restaurants.
– Darden is a restaurant company, not a real estate company or a buyout firm – the focus should be on creating a superb
experience through great tasting food (that is also good for you) and superior service.
The Company’s actions, including the sale of Red Lobster, its lack of capital discipline, and its excessive spending on
corporate luxuries, have jeopardized the safety of Darden’s investment grade rating and dividend.
The Board has failed to establish incentives that promote hard work and lead to management success and shareholder returns.
– As just one example of the backward incentives this Board has put into place, CEO Clarence Otis was paid even
more this fiscal year than last year, even though Darden underperformed its peers by ~20%.(1)
– How can shareholders trust Darden’s proposed slate to find the next CEO and to align his or her compensationwith shareholders’ interests, considering that:
3 of the 4 incumbent nominees were on Darden’s Compensation Committee
2 were on the Nomination and Governance Committee
None of the Company’s nominees have hired an external CEO(2)
All of the Company’s nominees voted in favor of the Red Lobster sale
The best predictor of future behavior is past behavior…
As with any business, especially an operationally focused customer service business, success begins
with great leaders. We believe Darden’s Board and its proposed slate are not equipped to lead Darden
through Olive Garden’s revival.
Source: Company filings.
(1) In fiscal 2014, Darden underperformed its Proxy Group by 19% and underperformed its Closest Direct Peers by 18%.
(2) See slide 49.
8/11/2019 Starboard Value Transforming Darden
http://slidepdf.com/reader/full/starboard-value-transforming-darden 29/294
29
10.1% 10.6%
8.3%
6.5%
0%
2%
4%
6%
8%
10%
12%
2012DRI
2013DRI
2012Peers
2013Peers
7.3%
10.5%
0%
5%
10%
Darden Peers
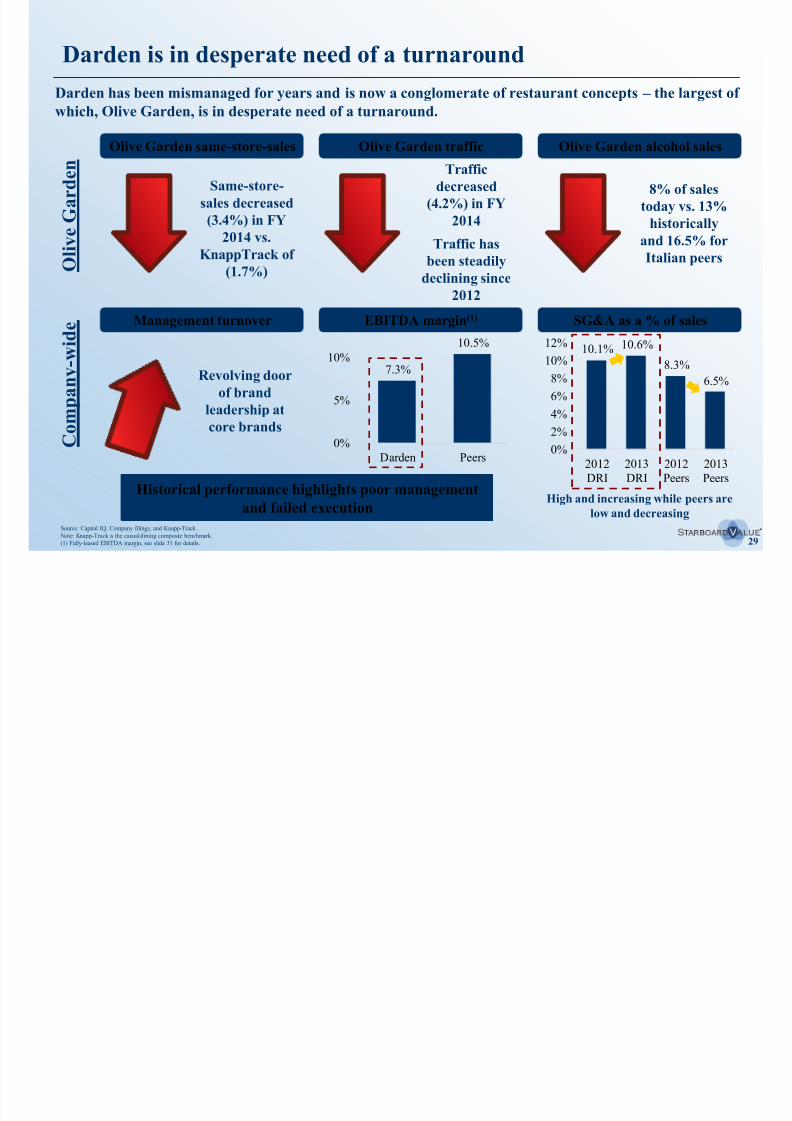
Darden is in desperate need of a turnaround
Darden has been mismanaged for years and is now a conglomerate of restaurant concepts – the largest of
which, Olive Garden, is in desperate need of a turnaround.
Olive Garden same-store-sales
EBITDA margin(1)
Same-store-
sales decreased
(3.4%) in FY
2014 vs.
KnappTrack of(1.7%)
Olive Garden traffic
Traffic
decreased
(4.2%) in FY
2014
Traffic has
been steadilydeclining since
2012
Olive Garden alcohol sales
8% of sales
today vs. 13%
historically
and 16.5% for
Italian peers
Management turnover
Revolving door
of brandleadership at
core brands
Source: Capital IQ, Company filings, and Knapp-Track.
Note: Knapp-Track is the casual dining composite benchmark.
(1) Fully-leased EBITDA margin, see slide 31 for details.
SG&A as a % of sales
High and increasing while peers are
low and decreasing
O
l i v e G a r d e n
C o m p a n y - w i d e
Historical performance highlights poor management
and failed execution
8/11/2019 Starboard Value Transforming Darden
http://slidepdf.com/reader/full/starboard-value-transforming-darden 30/294
30
Darden is in desperate need of a turnaround (cont’d)
Track record of destroying value: share price
underperformance and questionable capital spending,
leading to poor returns.
Margins are SIGNIFICANTLY below peers.
Significant decreases in same-store-sales and traffic at
most prominent brands (especially Olive Garden).
Long history of abysmal corporate governance –
most recently, ignored shareholders’ request to hold
Special Meeting to discuss Red Lobster separation
and sold Red Lobster at what we believe to be a fire
sale price.
Failed conglomerate model that has not leveraged
scale or industry leading average unit volumes.
Inefficient, but management friendly, real estateownership structure that significantly reduces returns
on capital and total after-tax cash flow.
Unwillingness to franchise has hurt returns on capital
domestically and left Darden years behind the
competition internationally.
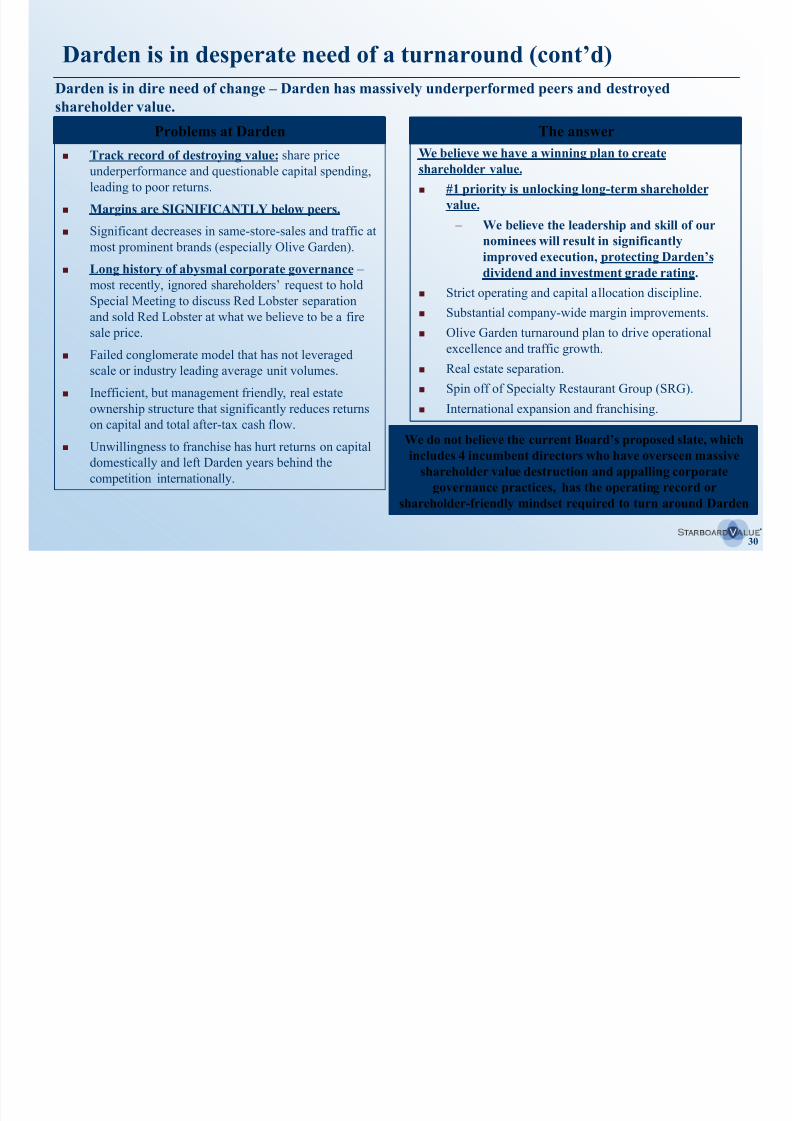
Darden is in dire need of change – Darden has massively underperformed peers and destroyed
shareholder value.
Problems at DardenWe believe we have a winning plan to create
shareholder value.
#1 priority is unlocking long-term shareholder
value.
– We believe the leadership and skill of our
nominees will result in significantly
improved execution, protecting Darden’sdividend and investment grade rating.
Strict operating and capital allocation discipline.
Substantial company-wide margin improvements.
Olive Garden turnaround plan to drive operational
excellence and traffic growth.
Real estate separation.
Spin off of Specialty Restaurant Group (SRG). International expansion and franchising.
The answer
We do not believe the current Board’s proposed slate, which
includes 4 incumbent directors who have overseen massive
shareholder value destruction and appalling corporate
governance practices, has the operating record or
shareholder-friendly mindset required to turn around Darden
8/11/2019 Starboard Value Transforming Darden
http://slidepdf.com/reader/full/starboard-value-transforming-darden 31/294
31
16.3%14.3%
12.7% 12.4%
10.5% 9.9% 9.7%8.5%
7.3%
(1.5%)(4%)
(2%)
0%2%
4%
6%
8%
10%
12%
14%
16%18%
BWLD DFRG EAT CAKE TXRH BBRG RRGB BLMN DRI RT
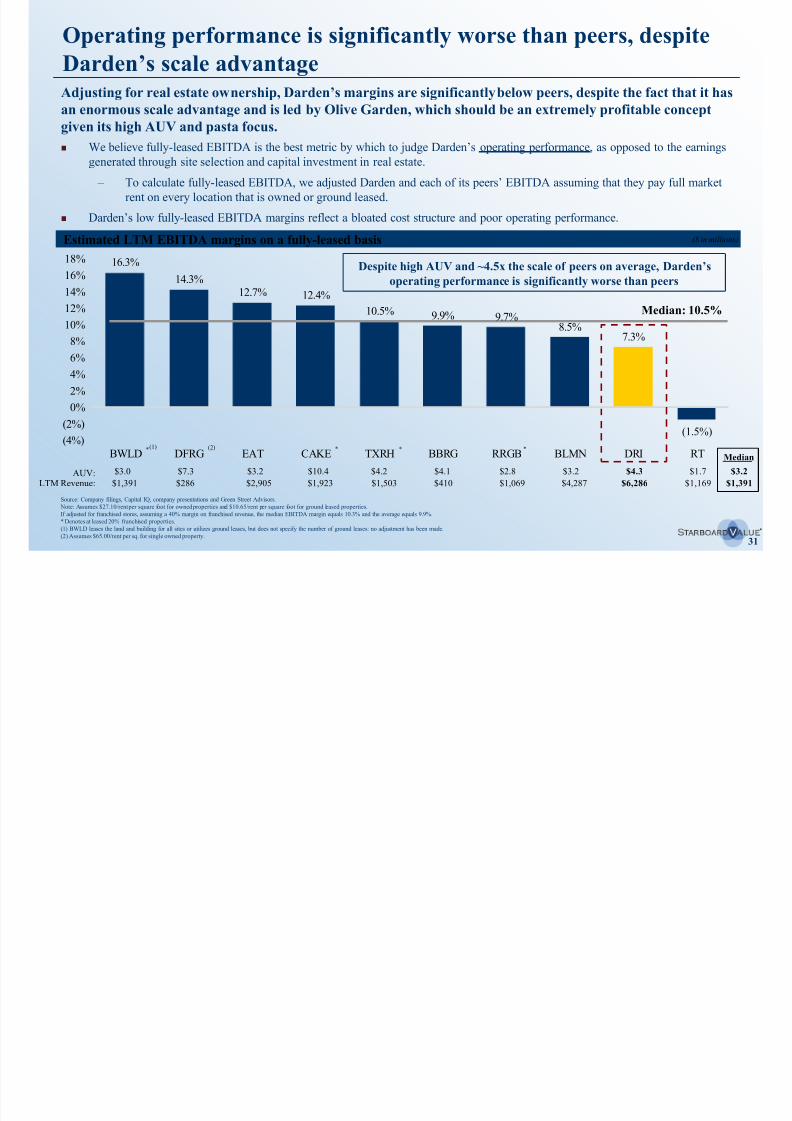
Adjusting for real estate ownership, Darden’s margins are significantly below peers, despite the fact that it has
an enormous scale advantage and is led by Olive Garden, which should be an extremely profitable concept
given its high AUV and pasta focus.
Estimated LTM EBITDA margins on a fully-leased basis
Source: Company filings, Capital IQ, company presentations and Green Street Advisors.
Note: Assumes $27.10/rent per square foot for owned properties and $10.65/rent per square foot for ground leased properties.
If adjusted for franchised stores, assuming a 40% margin on franchised revenue, the median EBITDA margin equals 10.3% and the average equals 9.9%.
* Denotes at leased 20% franchised properties.(1) BWLD leases the land and building for all sites or utilizes ground leases, but does not specify the number of ground leases: no adjustment has been made.
(2) Assumes $65.00/rent per sq. for single owned property.
(1) (2) * ***
Median: 10.5%
We believe fully-leased EBITDA is the best metric by which to judge Darden’s operating performance, as opposed to the earnings
generated through site selection and capital investment in real estate.
– To calculate fully-leased EBITDA, we adjusted Darden and each of its peers’ EBITDA assuming that they pay full market
rent on every location that is owned or ground leased.
Darden’s low fully-leased EBITDA margins reflect a bloated cost structure and poor operating performance.
Despite high AUV and ~4.5x the scale of peers on average, Darden’soperating performance is significantly worse than peers
$3.0 $7.3 $3.2 $10.4 $4.2 $4.1 $2.8 $3.2 $4.3AUV:
($ in millions)
$1.7
$1,391 $286 $2,905 $1,923 $1,503 $410 $1,069 $4,287 $6,286 $1,169LTM Revenue:
Operating performance is significantly worse than peers, despite
Darden’s scale advantage
$3.2
$1,391
Median
8/11/2019 Starboard Value Transforming Darden
http://slidepdf.com/reader/full/starboard-value-transforming-darden 32/294
32Source: Company filings, Wall Street equity research, and Knapp-Track.
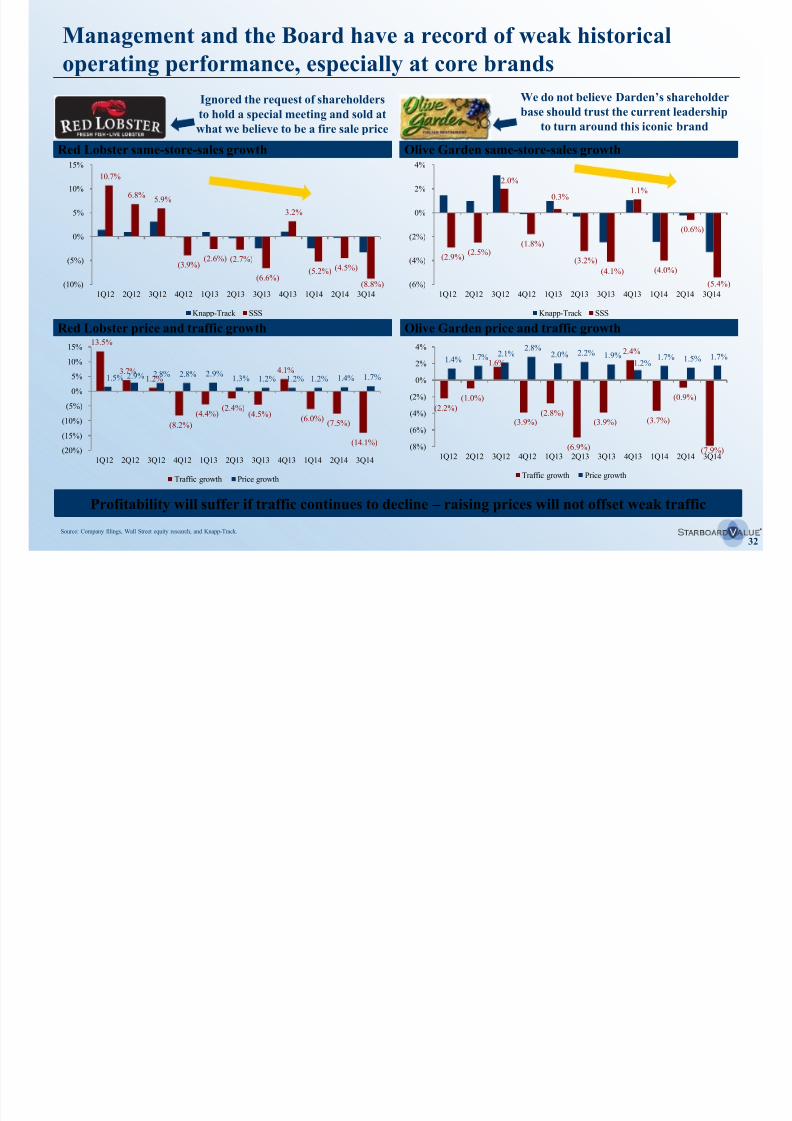
Management and the Board have a record of weak historical
operating performance, especially at core brands
Red Lobster price and traffic growth Olive Garden price and traffic growth
Red Lobster same-store-sales growth Olive Garden same-store-sales growth
(2.9%)(2.5%)
2.0%
(1.8%)
0.3%
(3.2%)(4.1%)
1.1%
(4.0%)
(0.6%)
(5.4%)(6%)
(4%)
(2%)
0%
2%
4%
1Q12 2Q12 3Q12 4Q12 1Q13 2Q13 3Q13 4Q13 1Q14 2Q14 3Q14
Knapp-Track SSS
(2.2%)
(1.0%)
1.6%
(3.9%)(2.8%)
(6.9%)
(3.9%)
2.4%
(3.7%)
(0.9%)
(7.9%)
1.4% 1.7% 2.1%2.8%
2.0% 2.2% 1.9%1.2%
1.7% 1.5% 1.7%
(8%)
(6%)
(4%)
(2%)
0%
2%
4%
1Q12 2Q12 3Q12 4Q12 1Q13 2Q13 3Q13 4Q13 1Q14 2Q14 3Q14
Traffic growth Price growth
13.5%
3.7%1.2%
(8.2%)
(4.4%)(2.4%)
(4.5%)
4.1%
(6.0%)(7.5%)
(14.1%)
1.5% 2.9% 2.8% 2.8% 2.9%1.3% 1.2% 1.2% 1.2% 1.4% 1.7%
(20%)
(15%)
(10%)
(5%)
0%
5%
10%
15%
1Q12 2Q12 3Q12 4Q12 1Q13 2Q13 3Q13 4Q13 1Q14 2Q14 3Q14
Traffic growth Price growth
10.7%
6.8%5.9%
(3.9%) (2.6%) (2.7%)
(6.6%)
3.2%
(5.2%) (4.5%)
(8.8%)(10%)
(5%)
0%
5%
10%
15%
1Q12 2Q12 3Q12 4Q12 1Q13 2Q13 3Q13 4Q13 1Q14 2Q14 3Q14
Knapp-Track SSS
Ignored the request of shareholders
to hold a special meeting and sold at
what we believe to be a fire sale price
We do not believe Darden’s shareholderbase should trust the current leadership
to turn around this iconic brand
Profitability will suffer if traffic continues to decline – raising prices will not offset weak traffic
8/11/2019 Starboard Value Transforming Darden
http://slidepdf.com/reader/full/starboard-value-transforming-darden 33/294
33
Darden has a long history of earnings misses and, we believe, management
recently “updated” guidance to avoid the appearance of another miss
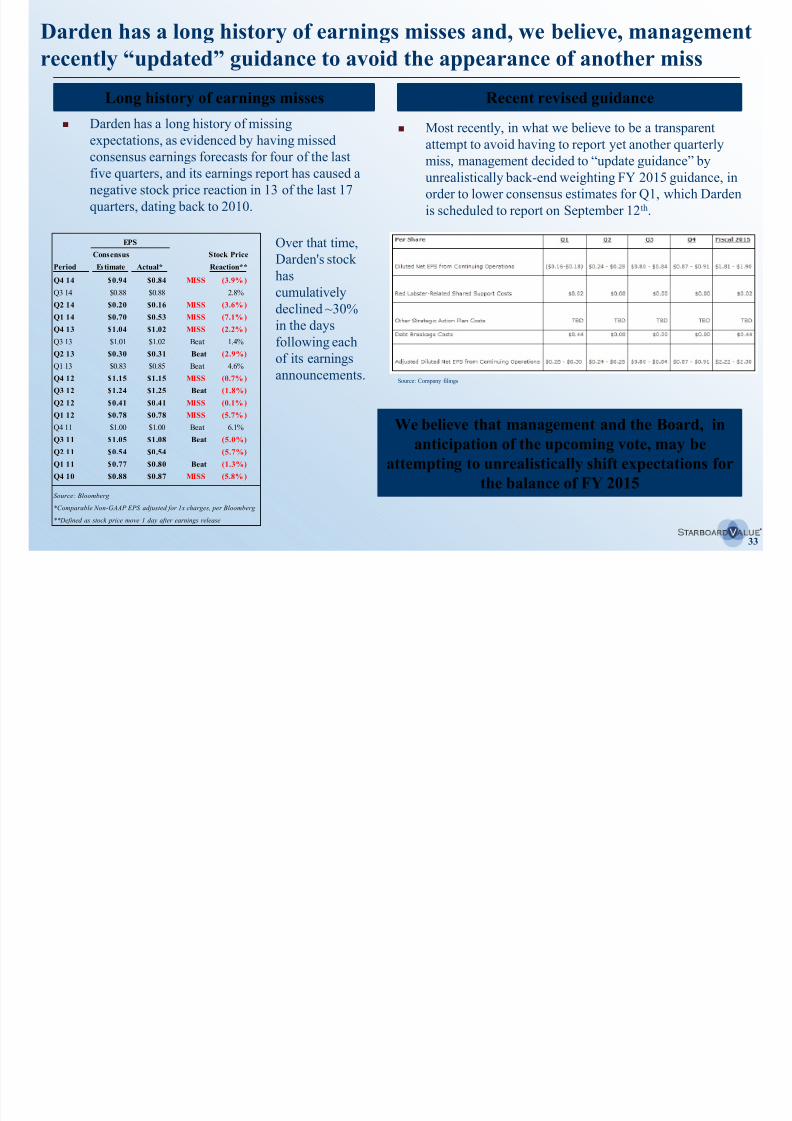
Darden has a long history of missing
expectations, as evidenced by having missed
consensus earnings forecasts for four of the last
five quarters, and its earnings report has caused a
negative stock price reaction in 13 of the last 17
quarters, dating back to 2010.
Most recently, in what we believe to be a transparentattempt to avoid having to report yet another quarterly
miss, management decided to “update guidance” by
unrealistically back-end weighting FY 2015 guidance, in
order to lower consensus estimates for Q1, which Darden
is scheduled to report on September 12th.
Recent revised guidanceLong history of earnings misses
We believe that management and the Board, in
anticipation of the upcoming vote, may be
attempting to unrealistically shift expectations for
the balance of FY 2015
EPS
Consensus Stock Price
Period Estimate Actual* Reaction**
Q4 14 $0.94 $0.84 MISS (3.9% )
Q3 14 $0.88 $0.88 2.8%
Q2 14 $0.20 $0.16 MISS (3.6% )
Q1 14 $0.70 $0.53 MISS (7.1% )
Q4 13 $1.04 $1.02 MISS (2.2% )
Q3 13 $1.01 $1.02 Beat 1.4%
Q2 13 $0.30 $0.31 Beat (2.9%)
Q1 13 $0.83 $0.85 Beat 4.6%
Q4 12 $1.15 $1.15 MISS (0.7% )
Q3 12 $1.24 $1.25 Beat (1.8%)Q2 12 $0.41 $0.41 MISS (0.1% )
Q1 12 $0.78 $0.78 MISS (5.7% )
Q4 11 $1.00 $1.00 Beat 6.1%
Q3 11 $1.05 $1.08 Beat (5.0%)
Q2 11 $0.54 $0.54 (5.7%)
Q1 11 $0.77 $0.80 Beat (1.3%)
Q4 10 $0.88 $0.87 MISS (5.8% )
Source: Bloomberg
*Comparable Non-GAAP EPS adjusted for 1x charges, per Bloomberg
**Defined as stock price move 1 day after earnings release
Source: Company filings
Over that time,
Darden's stockhas
cumulatively
declined ~30%
in the days
following each
of its earnings
announcements.
8/11/2019 Starboard Value Transforming Darden
http://slidepdf.com/reader/full/starboard-value-transforming-darden 34/294
34
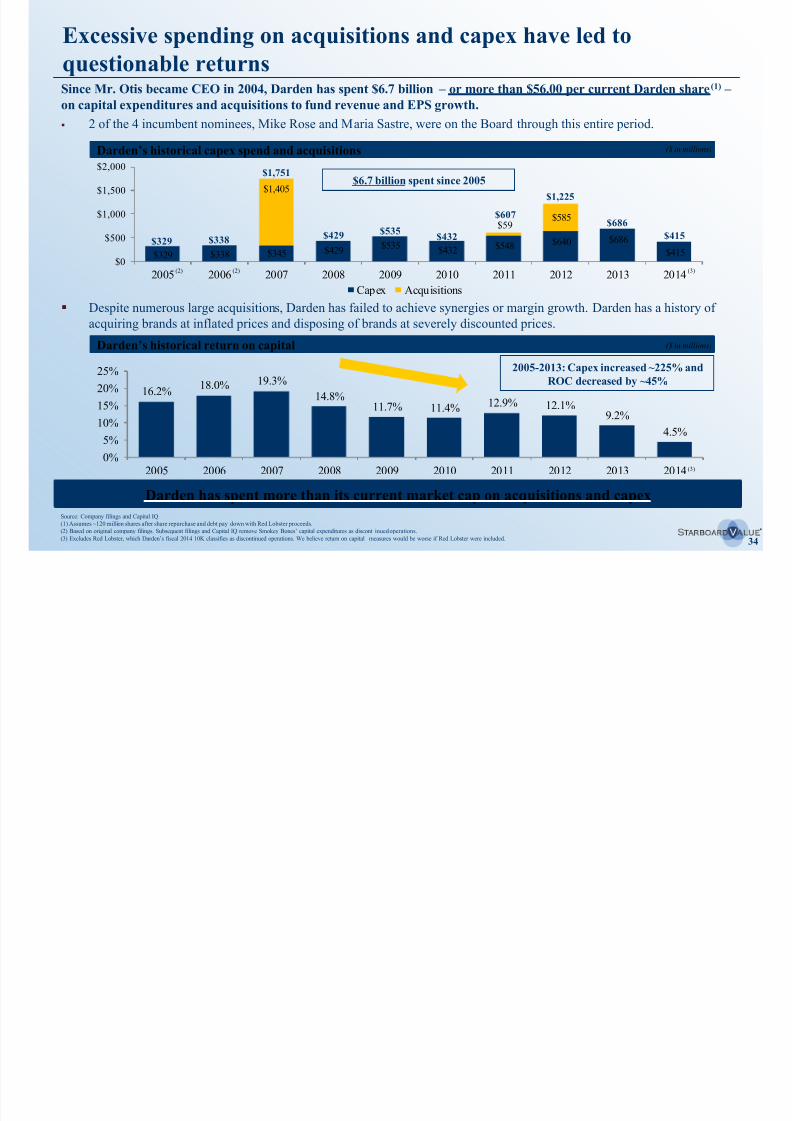
Despite numerous large acquisitions, Darden has failed to achieve synergies or margin growth. Darden has a history of
acquiring brands at inflated prices and disposing of brands at severely discounted prices.
16.2%18.0% 19.3%
14.8%11.7% 11.4% 12.9% 12.1%
9.2%
4.5%
0%
5%
10%
15%20%
25%
2005 2006 2007 2008 2009 2010 2011 2012 2013 2014
$329 $338 $345 $429$535
$432 $548 $640 $686
$415
$1,405
$59$585
$0
$500
$1,000
$1,500
$2,000
2005 2006 2007 2008 2009 2010 2011 2012 2013 2014
Capex Acquisitions
Since Mr. Otis became CEO in 2004, Darden has spent $6.7 billion – or more than $56.00 per current Darden share (1) – on capital expenditures and acquisitions to fund revenue and EPS growth.
2 of the 4 incumbent nominees, Mike Rose and Maria Sastre, were on the Board through this entire period.
Darden’s historical return on capital
Darden’s historical capex spend and acquisitions
$329 $338
$1,751
$429 $535$432
$607
$1,225
$686
($ in millions)
$6.7 billion spent since 2005
2005-2013: Capex increased ~225% and
ROC decreased by ~45%
($ in millions)
Excessive spending on acquisitions and capex have led to
questionable returns
Source: Company filings and Capital IQ.
(1) Assumes ~120 million shares after share repurchase and debt pay down with Red Lobster proceeds.
(2) Based on original company filings. Subsequent filings and Capital IQ remove Smokey Bones’ capital expenditures as discont inued operations.
(3) Excludes Red Lobster, which Darden’s fiscal 2014 10K classifies as discontinued operations. We believe return on capital measures would be worse if Red Lobster were included.
$415
(3)
(3)
Darden has spent more than its current market cap on acquisitions and capex
(2) (2)
8/11/2019 Starboard Value Transforming Darden
http://slidepdf.com/reader/full/starboard-value-transforming-darden 35/294
35
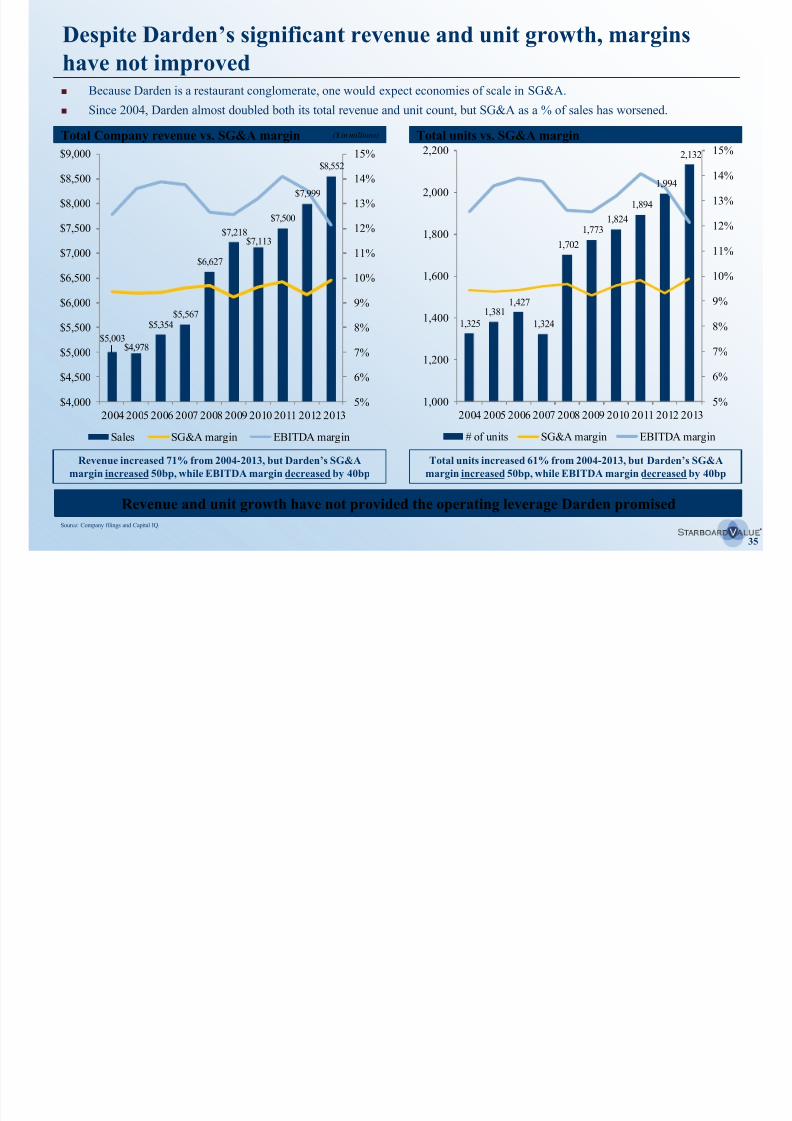
Despite Darden’s significant revenue and unit growth, marginshave not improved
Total Company revenue vs. SG&A margin
Source: Company filings and Capital IQ.
Because Darden is a restaurant conglomerate, one would expect economies of scale in SG&A.
Since 2004, Darden almost doubled both its total revenue and unit count, but SG&A as a % of sales has worsened.
($ in millions) Total units vs. SG&A margin
Revenue increased 71% from 2004-2013, but Darden’s SG&Amargin increased 50bp, while EBITDA margin decreased by 40bp
Total units increased 61% from 2004-2013, but Darden’s SG&Amargin increased 50bp, while EBITDA margin decreased by 40bp
Revenue and unit growth have not provided the operating leverage Darden promised
$5,003$4,978
$5,354$5,567
$6,627
$7,218$7,113
$7,500
$7,999
$8,552
5%
6%
7%
8%
9%
10%
11%
12%
13%
14%
15%
$4,000
$4,500
$5,000
$5,500
$6,000
$6,500
$7,000
$7,500
$8,000
$8,500
$9,000
2004 2005 2006 2007 2008 2009 2010 2011 2012 2013
Sales SG&A margin EBITDA margin
1,325
1,3811,427
1,324
1,702
1,7731,824
1,894
1,994
2,132
5%
6%
7%
8%
9%
10%
11%
12%
13%
14%
15%
1,000
1,200
1,400
1,600
1,800
2,000
2,200
2004 2005 2006 2007 2008 2009 2010 2011 2012 2013
# of units SG&A margin EBITDA margin
8/11/2019 Starboard Value Transforming Darden
http://slidepdf.com/reader/full/starboard-value-transforming-darden 36/294
36
The current Board and management team committed one of the
most egregious violations of shareholder trust we have ever seen
On May 16, 2014 Darden announced that it had signed an agreement to sell its Red Lobster business
and real estate assets for approximately $1.6 billion in net proceeds in a transaction that was not subject
to a shareholder vote.
Through the hurried Red Lobster sale, the Board ignored the request of shareholders to hold a special meeting
and destroyed value that we believe was easily avoidable:
Shareholders tried to ask the Company to pause and reconsider the plan, with a substantial majority of
shareholders formally requesting that Darden hold a special meeting to discuss this very topic.
We published two detailed presentations and sent seven letters urging the Board to listen to the request of
shareholders and put the Red Lobster separation on hold. Unfortunately, the Board chose to enter into, what we
believe to be, a value destructive transaction by signing a binding commitment before holding the validly
requested special meeting.
If we let the incumbent Board members and management team continue in their ways, webelieve Olive Garden may become the next Red Lobster…an iconic American brand destroyed
by Darden’s Board and management
Vote for change
Vote on Starboard's WHITE proxy card today
8/11/2019 Starboard Value Transforming Darden
http://slidepdf.com/reader/full/starboard-value-transforming-darden 37/294
37
$2,100
$1,600
($79)$21
$2,460
($500)
($1,500)
$227
$0
$500
$1,000
$1,500
$2,000
$2,500
$3,000
Before-tax
proceeds
Tax leakage After-tax
proceeds
Real Estate
Value
Debt
breakage
costs
Estimated
Value for
Red Lobster
Operating Business
LTM
Operating
EBITDA
LTM
Revenue
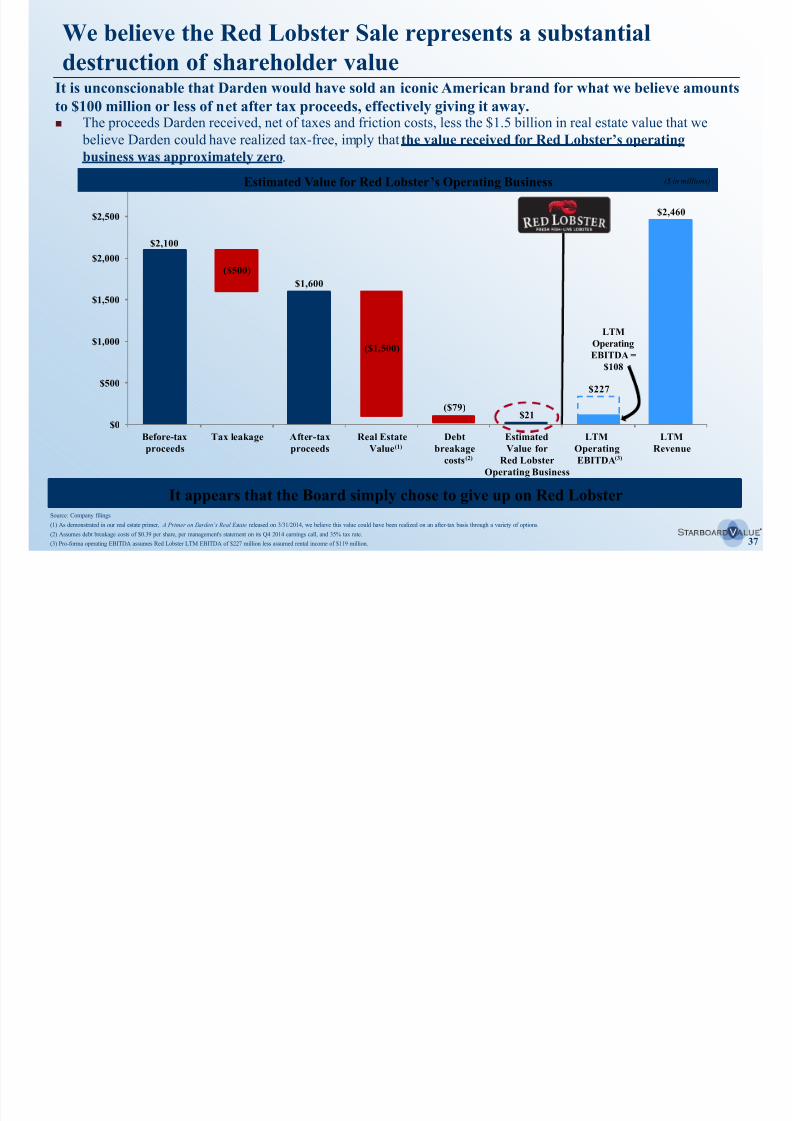
We believe the Red Lobster Sale represents a substantial
destruction of shareholder valueIt is unconscionable that Darden would have sold an iconic American brand for what we believe amounts
to $100 million or less of net after tax proceeds, effectively giving it away.
Source: Company filings.
(1) As demonstrated in our real estate primer, A Primer on Darden’s Real Estate released on 3/31/2014, we believe this value could have been realized on an after-tax basis through a variety of options.
(2) Assumes debt breakage costs of $0.39 per share, per management's statement on its Q4 2014 earnings call, and 35% tax rate.
(3) Pro-forma operating EBITDA assumes Red Lobster LTM EBITDA of $227 million less assumed rental income of $119 million.
The proceeds Darden received, net of taxes and friction costs, less the $1.5 billion in real estate value that we
believe Darden could have realized tax-free, imply that the value received for Red Lobster’s operatingbusiness was approximately zero.
LTM
Operating
EBITDA =
$108
(2)
Estimated Value for Red Lobster’s Operating Business
(3)
(1)
It appears that the Board simply chose to give up on Red Lobster
($ in millions)
8/11/2019 Starboard Value Transforming Darden
http://slidepdf.com/reader/full/starboard-value-transforming-darden 38/294
38
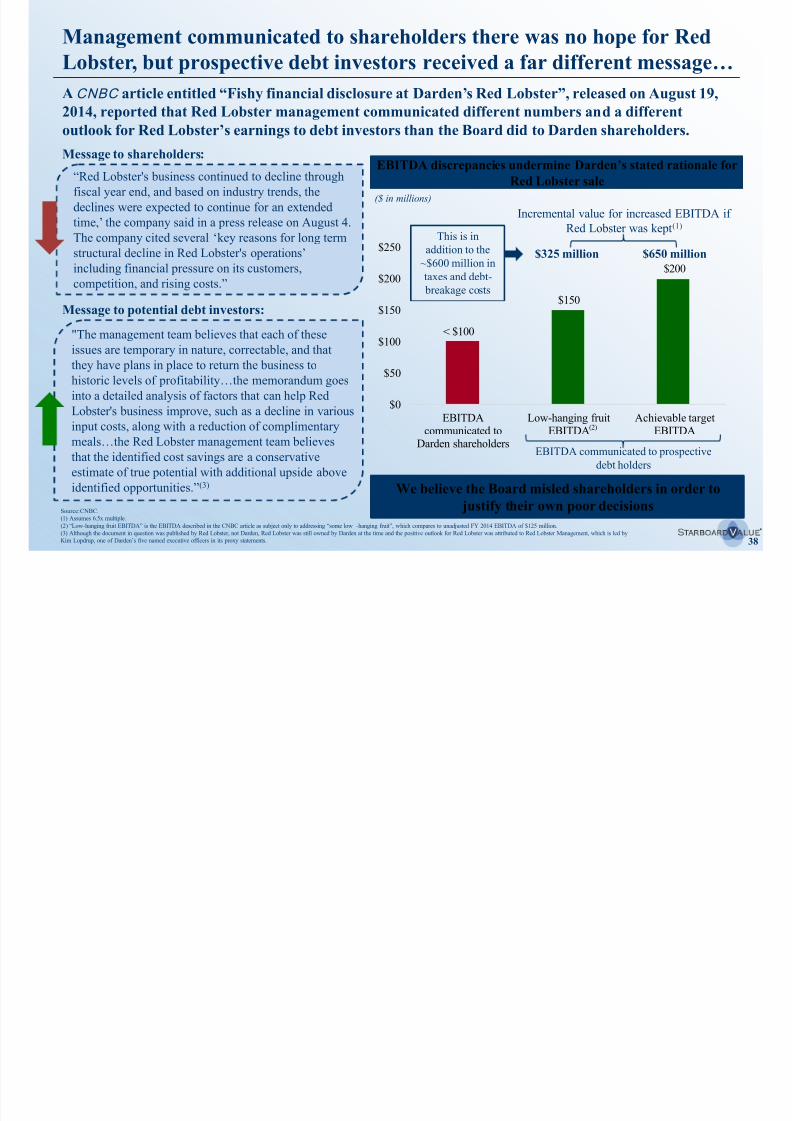
Management communicated to shareholders there was no hope for Red
Lobster, but prospective debt investors received a far different message…
"The management team believes that each of these
issues are temporary in nature, correctable, and that
they have plans in place to return the business to
historic levels of profitability…the memorandum goes
into a detailed analysis of factors that can help RedLobster's business improve, such as a decline in various
input costs, along with a reduction of complimentary
meals…the Red Lobster management team believes
that the identified cost savings are a conservative
estimate of true potential with additional upside above
identified opportunities.”(3)
ACNBC article entitled “Fishy financial disclosure at Darden’s Red Lobster”, released on August 19,2014, reported that Red Lobster management communicated different numbers and a different
outlook for Red Lobster’s earnings to debt investors than the Board did to Darden shareholders.
“Red Lobster's business continued to decline through
fiscal year end, and based on industry trends, the
declines were expected to continue for an extended
time,’ the company said in a press release on August 4.
The company cited several ‘key reasons for long term
structural decline in Red Lobster's operations’
including financial pressure on its customers,
competition, and rising costs.”
$100
$150
$200
$0
$50
$100
$150
$200
$250
EBITDAcommunicated to
Darden shareholders
Low-hanging fruitEBITDA
Achievable targetEBITDA
<
Incremental value for increased EBITDA if
Red Lobster was kept(1)
$325 million $650 million
Source: CNBC.
(1) Assumes 6.5x multiple.(2) “Low-hanging fruit EBITDA” is the EBITDA described in the CNBC article as subject only to addressing “some low -hanging fruit”, which compares to unadjusted FY 2014 EBITDA of $125 million.
(3) Although the document in question was published by Red Lobster, not Darden, Red Lobster was still owned by Darden at the time and the positive outlook for Red Lobster was attributed to Red Lobster Management, which is led by
Kim Lopdrup, one of Darden’s five named executive officers in its proxy statements.
EBITDA discrepancies undermine Darden’s stated rationale forRed Lobster sale
($ in millions)
Message to potential debt investors:
Message to shareholders:
We believe the Board misled shareholders in order to
justify their own poor decisions
(2)
This is in
addition to the
~$600 million intaxes and debt-
breakage costs
EBITDA communicated to prospective
debt holders
8/11/2019 Starboard Value Transforming Darden
http://slidepdf.com/reader/full/starboard-value-transforming-darden 39/294
39
How has the Red Lobster transaction affected our investment
thesis?We lost the opportunity to turn around Red Lobster, but the Red Lobster transaction has:
Affirmed our belief that the current Board members cannot be trusted to safeguard the best interests of
shareholders.
Affirmed our strong belief that a new Board and management team is needed to lead Darden and turn around
Olive Garden.
– Shareholders cannot trust that the incumbent Board members will not give up on Olive Garden, just as they
seemingly gave up on Red Lobster.
Confirmed our valuation for the rest of Darden’s real estate. In fact, the price paid by ARCP suggests ourestimates may be conservative.
– The ARCP sale-leaseback transaction valued Red Lobster’s real estate at $1.5 billion, in line with the
estimates included in our March 31, 2014 investor presentation. However, as we explained in our
presentation, real estate buyers have indicated that Red Lobster’s real estate would sell for or trade at a
higher cap rate (i.e. be worth less) if the tenant was a highly leveraged standalone Red Lobster rather than
an investment grade corporate like Darden. Therefore, we believe the $1.5 billion ARCP paid would
actually have been higher if Darden had sold the real estate to ARCP directly.
– The deal also confirmed that, despite management’s protests, there are no operational or strategic
justifications to keep Darden’s real estate and restaurant businesses together.
We believe the Red Lobster transaction highlights the incumbent Board members’ attitudestowards shareholders and their inability to create value at Darden
D d h hi t f di i t f it l l
8/11/2019 Starboard Value Transforming Darden
http://slidepdf.com/reader/full/starboard-value-transforming-darden 40/294
40
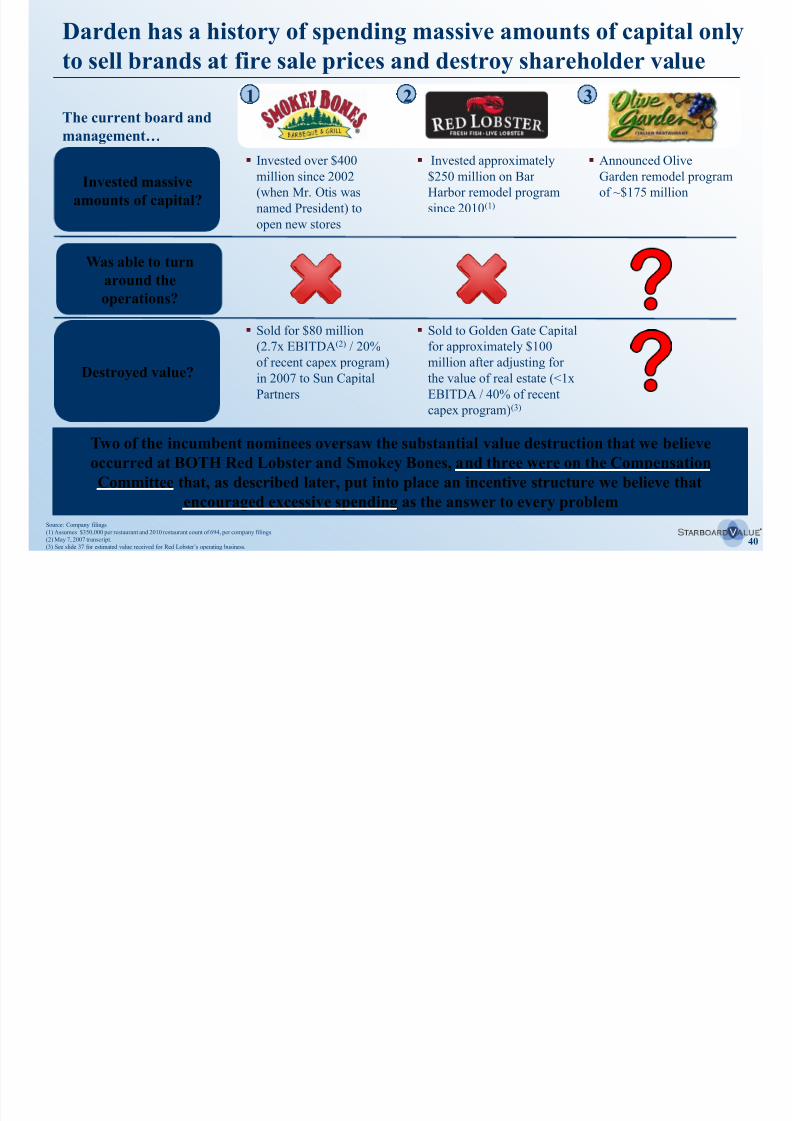
Darden has a history of spending massive amounts of capital only
to sell brands at fire sale prices and destroy shareholder value
Two of the incumbent nominees oversaw the substantial value destruction that we believe
occurred at BOTH Red Lobster and Smokey Bones, and three were on the Compensation
Committee that, as described later, put into place an incentive structure we believe that
encouraged excessive spending as the answer to every problem
Source: Company filings.
(1) Assumes $350,000 per restaurant and 2010 restaurant count of 694, per company filings.
(2) May 7, 2007 transcript.
(3) See slide 37 for estimated value received for Red Lobster’s operating business.
Invested massive
amounts of capital?
Was able to turnaround the
operations?
Destroyed value?
Invested over $400
million since 2002
(when Mr. Otis was
named President) to
open new stores
Invested approximately
$250 million on Bar
Harbor remodel program
since 2010(1)
Announced Olive
Garden remodel program
of ~$175 million
Sold for $80 million
(2.7x EBITDA(2) / 20%
of recent capex program)
in 2007 to Sun Capital
Partners
Sold to Golden Gate Capital
for approximately $100
million after adjusting for
the value of real estate (<1x
EBITDA / 40% of recentcapex program)(3)
The current board and
management…
1 2 3
S t t b t l t it t d t
8/11/2019 Starboard Value Transforming Darden
http://slidepdf.com/reader/full/starboard-value-transforming-darden 41/294
41
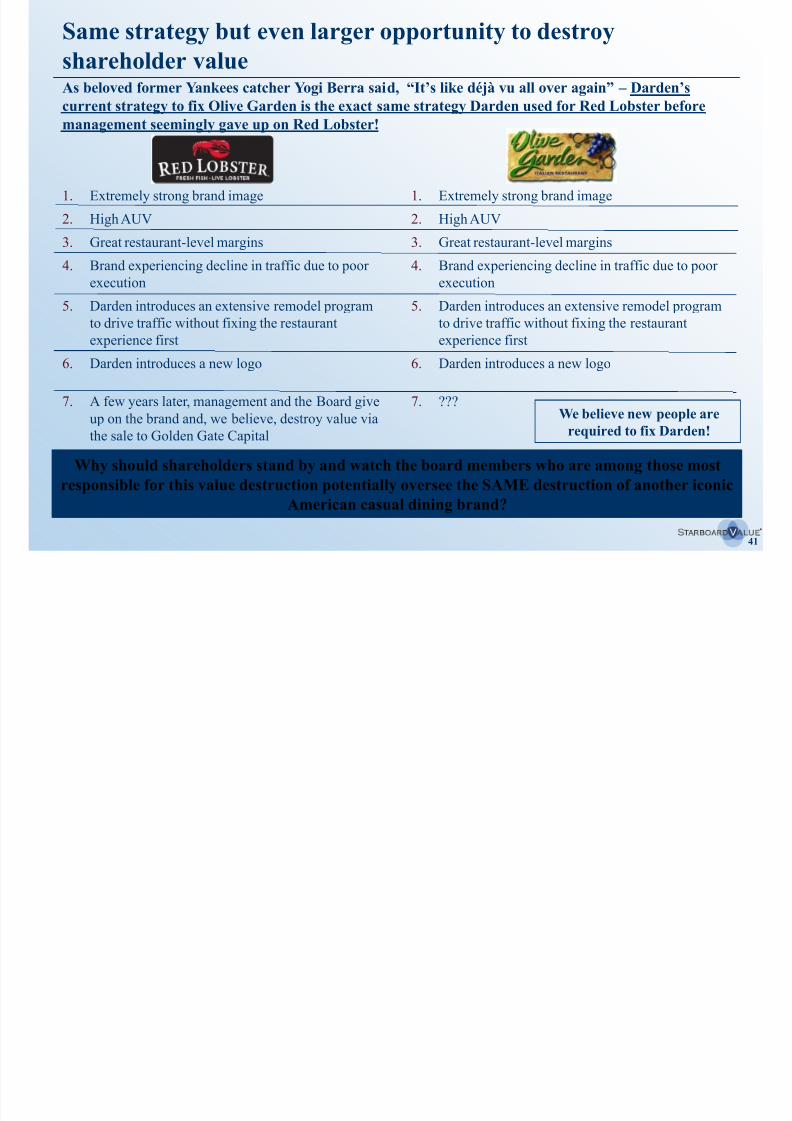
Same strategy but even larger opportunity to destroy
shareholder value
1. Extremely strong brand image
2. High AUV
3. Great restaurant-level margins
4. Brand experiencing decline in traffic due to poorexecution
5. Darden introduces an extensive remodel program
to drive traffic without fixing the restaurant
experience first
6. Darden introduces a new logo
7. A few years later, management and the Board give
up on the brand and, we believe, destroy value via
the sale to Golden Gate Capital
Why should shareholders stand by and watch the board members who are among those most
responsible for this value destruction potentially oversee the SAME destruction of another iconic
American casual dining brand?
As beloved former Yankees catcher Yogi Berra said, “It’s like déjà vu all over again” – Darden’scurrent strategy to fix Olive Garden is the exact same strategy Darden used for Red Lobster before
management seemingly gave up on Red Lobster!
1. Extremely strong brand image
2. High AUV
3. Great restaurant-level margins
4. Brand experiencing decline in traffic due to poorexecution
5. Darden introduces an extensive remodel program
to drive traffic without fixing the restaurant
experience first
6. Darden introduces a new logo
7. ???We believe new people are
required to fix Darden!
S t t b t l t it t d t
8/11/2019 Starboard Value Transforming Darden
http://slidepdf.com/reader/full/starboard-value-transforming-darden 42/294
42
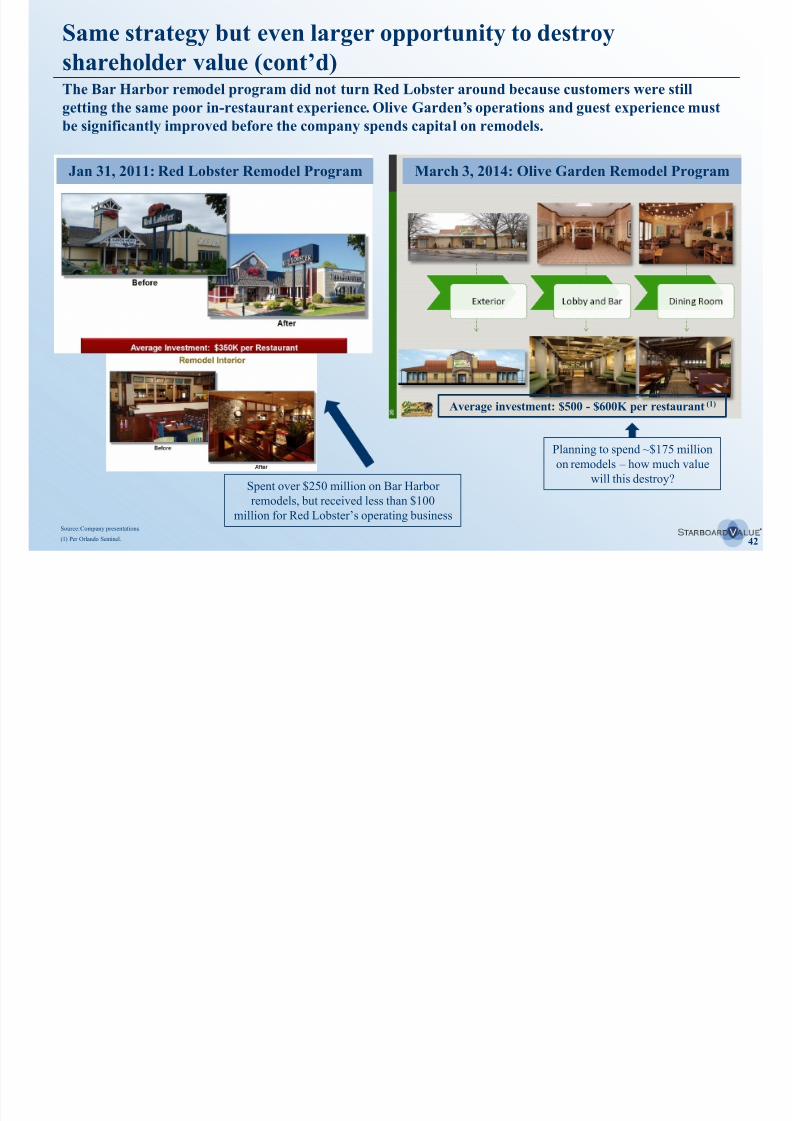
Same strategy but even larger opportunity to destroy
shareholder value (cont’d) The Bar Harbor remodel program did not turn Red Lobster around because customers were still
getting the same poor in-restaurant experience. Olive Garden’s operations and guest experience mustbe significantly improved before the company spends capital on remodels.
Spent over $250 million on Bar Harbor
remodels, but received less than $100
million for Red Lobster’s operating business
Planning to spend ~$175 million
on remodels – how much value
will this destroy?
Jan 31, 2011: Red Lobster Remodel Program March 3, 2014: Olive Garden Remodel Program
Average investment: $500 - $600K per restaurant(1)
Source: Company presentations.
(1) Per Orlando Sentinel.
Same strateg b t e en larger opport nit to destro
8/11/2019 Starboard Value Transforming Darden
http://slidepdf.com/reader/full/starboard-value-transforming-darden 43/294
43
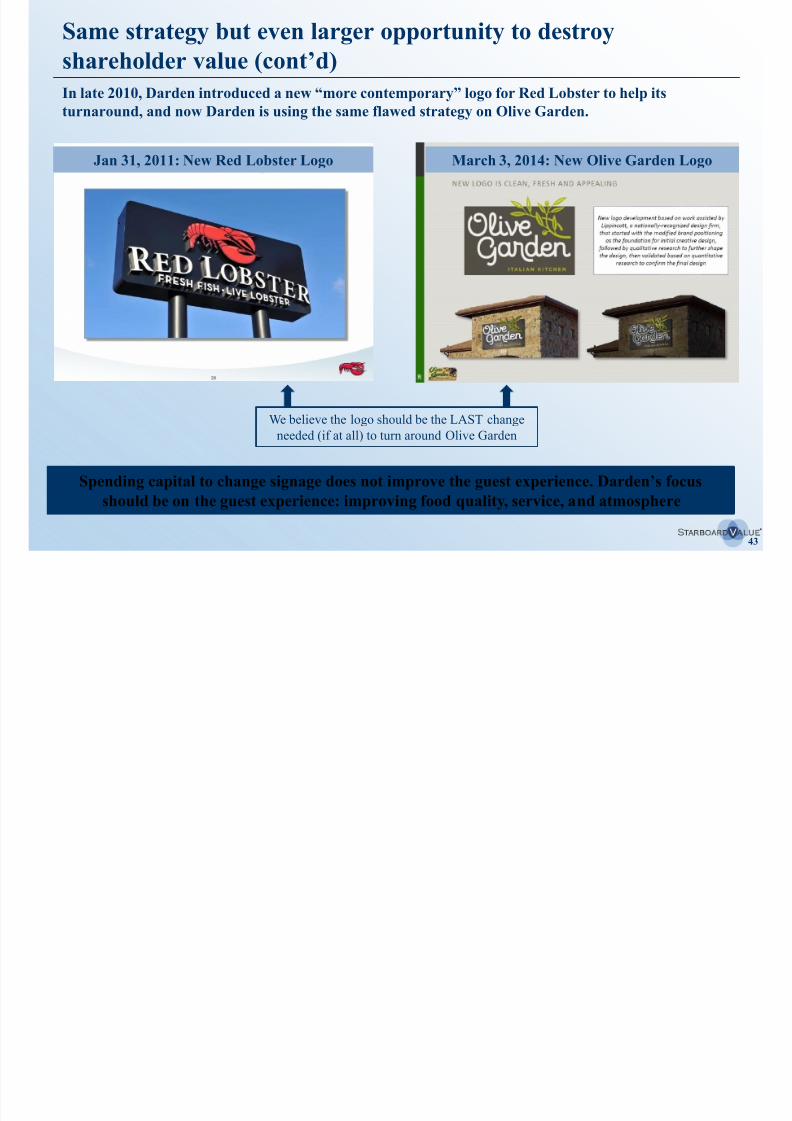
Same strategy but even larger opportunity to destroy
shareholder value (cont’d)
Spending capital to change signage does not improve the guest experience. Darden’s focusshould be on the guest experience: improving food quality, service, and atmosphere
In late 2010, Darden introduced a new “more contemporary” logo for Red Lobster to help itsturnaround, and now Darden is using the same flawed strategy on Olive Garden.
We believe the logo should be the LAST change
needed (if at all) to turn around Olive Garden
Jan 31, 2011: New Red Lobster Logo March 3, 2014: New Olive Garden Logo
Th t t t d B d h l t f
8/11/2019 Starboard Value Transforming Darden
http://slidepdf.com/reader/full/starboard-value-transforming-darden 44/294
44
Stock price
performance vs. proxy
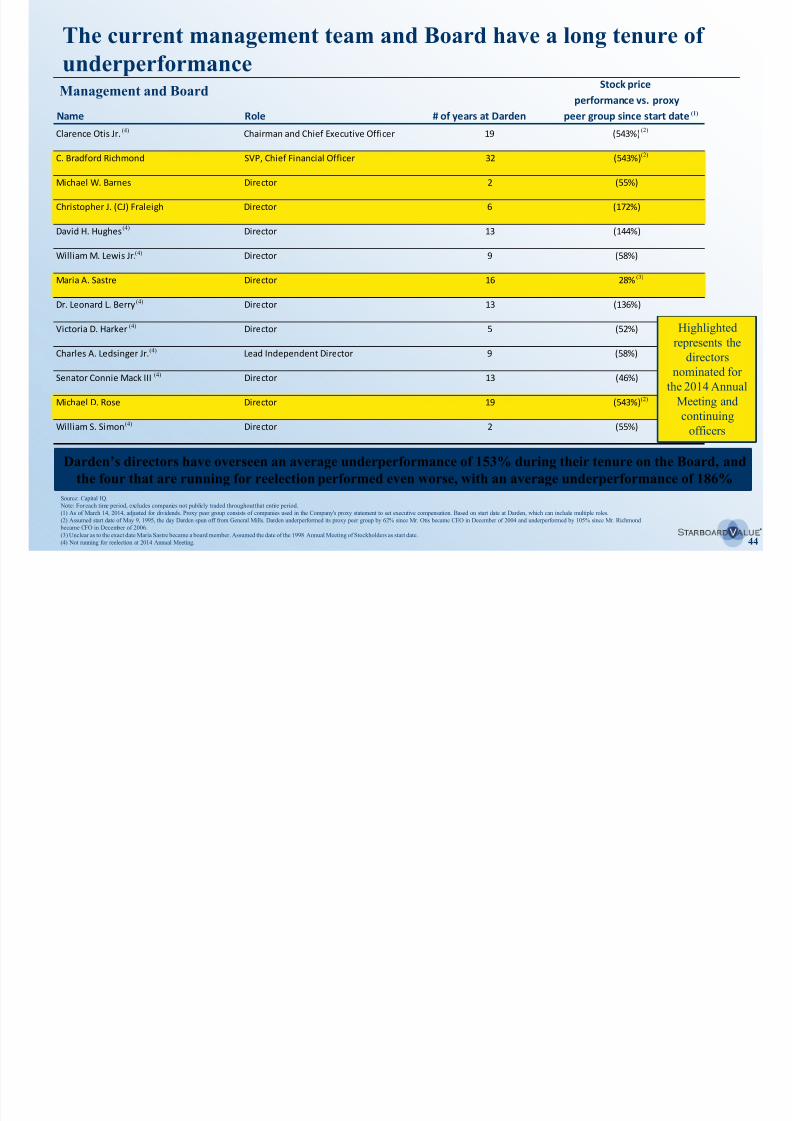
Name Role # of years at Darden peer group since start date
Clarence Otis Jr. Chairman and Chief Executive Officer 19 (543%)
C. Bradford Richmond SVP, Chief Financial Officer 32 (543%)
Michael W. Barnes Director 2 (55%)
Christopher J. (CJ) Fraleigh Director 6 (172%)
David H. Hughes Director 13 (144%)
William M. Lewis Jr. Director 9 (58%)
Maria A. Sastre Director 16 28%
Dr. Leonard L. Berry Director 13 (136%)
Victoria D. Harker Director 5 (52%)
Charles A. Ledsinger Jr. Lead Independent Director 9 (58%)
Senator Connie Mack III Director 13 (46%)
Michael D. Rose Director 19 (543%)
William S. Simon Director 2 (55%)
The current management team and Board have a long tenure of
underperformanceManagement and Board
Source: Capital IQ.
Note: For each time period, excludes companies not publicly traded throughout that entire period.
(1) As of March 14, 2014, adjusted for dividends. Proxy peer group consists of companies used in the Company's proxy statement to set executive compensation. Based on start date at Darden, which can include multiple roles.
(2) Assumed start date of May 9, 1995, the day Darden spun off from General Mills. Darden underperformed its proxy peer group by 62% since Mr. Otis became CEO in December of 2004 and underperformed by 105% since Mr. Richmond became CFO in December of 2006.
(3) Unclear as to the exact date Maria Sastre became a board member. Assumed the date of the 1998 Annual Meeting of Stockholders as start date.
(4) Not running for reelection at 2014 Annual Meeting.
(1)
(2)
(2)
(2)
(3)
Darden’s directors have overseen an average underperformance of 153% during their tenure on the Board, andthe four that are running for reelection performed even worse, with an average underperformance of 186%
Highlighted
represents the
directors
nominated for
the 2014 Annual
Meeting and
continuing
officers
(4)
(4)
(4)
(4)
(4)
(4)
(4)
(4)
We believe Darden’s proposed Board is suboptimal and not in
8/11/2019 Starboard Value Transforming Darden
http://slidepdf.com/reader/full/starboard-value-transforming-darden 45/294
45
The Darden Board is in disarray. Darden has proposed a Board that would be composed of:
– 4 incumbent directors who have overseen years of value destruction and egregious corporate governance,
– 4 last-minute hand picked nominees who we believe lack relevant qualifications and have questionable track
records, and
– 4 vacancies left for Starboard recommended nominees.
Darden’s proposed board is not the right answer for shareholders.
– We believe Darden’s proposed Board is at best suboptimal and potentially dysfunctional.
We believe Starboard’s proposed Board is the best solution.
– Starboard has proposed a cohesive slate of world class candidates with unique and complementary skills and
perspectives directly relevant to Darden's business and current challenges, including:
Experienced restaurant operators with expertise in Darden's major business lines.
Experts in real estate, finance, turnarounds, supply chain, effective public company governance, and
compensation programs. Experts in recruiting transformational external CEOs.
Our nominees are ready, willing, and able to turn around Darden – with a detailed transformation plan in hand.
– If elected, our nominees will immediately begin working with Darden’s management and advisors to verify the
opportunities discussed in this presentation.
Starboard has also previously indicated its willingness (if all of its 12 nominees are elected) to add back up to two
current Board members. The 2 added back would not necessarily come from the 4 running for reelection.
The incumbent directors have been at the forefront of terrible strategic decisions, unacceptable
corporate governance, and poor compensation practices.
We believe Darden s proposed Board is suboptimal and not inthe best interest of shareholders
We believe Darden’s proposed Board is suboptimal and not in
8/11/2019 Starboard Value Transforming Darden
http://slidepdf.com/reader/full/starboard-value-transforming-darden 46/294
46
The board’s arguments for continuity are misguided and hypocritical.
– Although we agree with the concept of continuity, we do not agree with electing directors who have
overseen massive shareholder value destruction, egregious corporate governance practices, and the
mismanagement of core brands.
Darden argues that their incumbent nominees will have the “track record”, “experience”, and “fresh perspectives” to
“enhance shareholder value”.
– In actuality, the incumbent directors include two of the most tenured members of Darden’s board: Michael Rose(19 years) and Maria Sastre (16 years).
Both of these directors oversaw years of terrible performance and poor capital allocation, including
massive investments in Red Lobster and Smokey Bones, only to sell the concepts at what we believe to
be rock bottom prices, destroying significant shareholder value.
– In addition, Darden paid $1 million in FY 2014 to Board member and nominee Maria Sastre’s private aircraft
support company, Signature Flight Corporation, a large and unnecessary related party transaction.(1)
– All 4 of the incumbent nominees voted in favor of signing a binding contract to sell Red Lobster without
holding the requested Special Meeting.
Given their track records, we have many concerns with the incumbent nominees representing the best
interests of shareholders
We have many concerns regarding the Company’s slate of nominees.
We believe Darden s proposed Board is suboptimal and not in
the best interest of shareholders (cont’d)
(1) Company filings.
The incumbent nominees have overseen Darden’s terrible
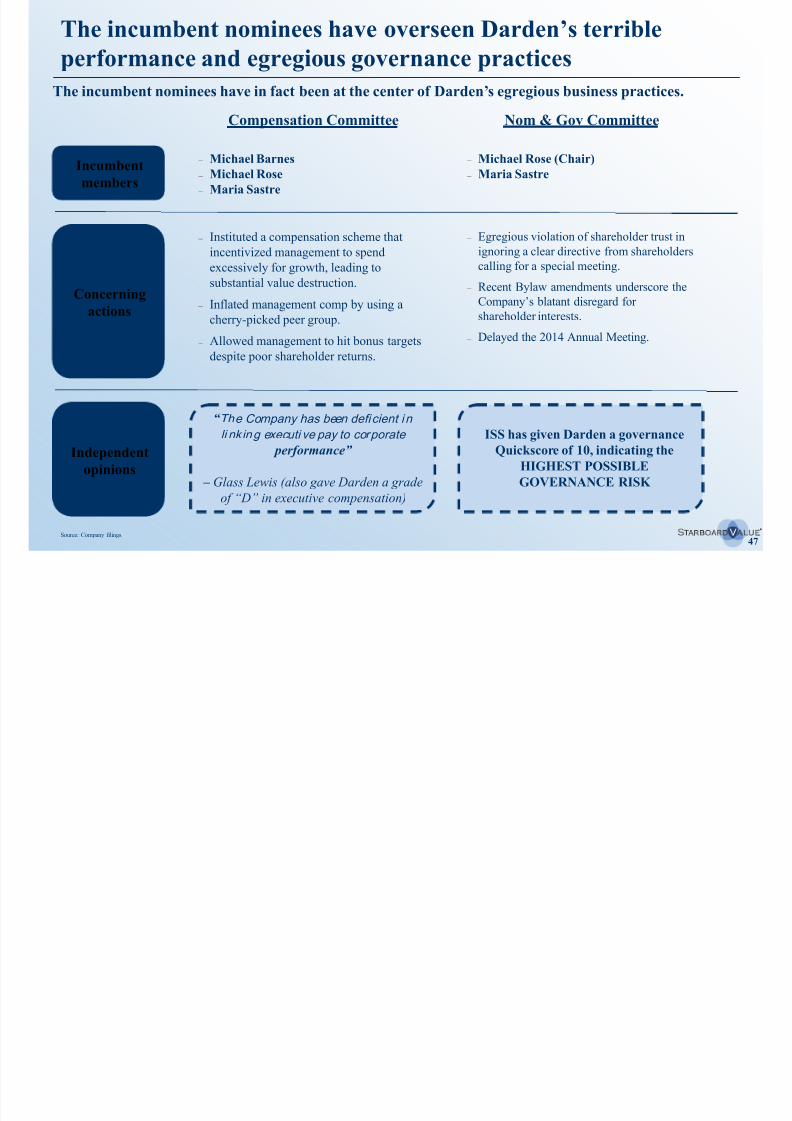
8/11/2019 Starboard Value Transforming Darden
http://slidepdf.com/reader/full/starboard-value-transforming-darden 47/294
47
The incumbent nominees have in fact been at the center of Darden’s egregious business practices.
The incumbent nominees have overseen Darden s terribleperformance and egregious governance practices
Source: Company filings.
Compensation Committee
– Michael Barnes
– Michael Rose
– Maria Sastre
Nom & Gov Committee
“ The Company has been deficient in
li nking executi ve pay to corporate
performance”
– Glass Lewis (also gave Darden a grade
of “D” in executive compensation)
– Michael Rose (Chair)
– Maria SastreIncumbent
members
Concerning
actions
– Instituted a compensation scheme that
incentivized management to spend
excessively for growth, leading tosubstantial value destruction.
– Inflated management comp by using a
cherry-picked peer group.
– Allowed management to hit bonus targets
despite poor shareholder returns.
Independent
opinions
– Egregious violation of shareholder trust in
ignoring a clear directive from shareholders
calling for a special meeting.
– Recent Bylaw amendments underscore the
Company’s blatant disregard for
shareholder interests.
– Delayed the 2014 Annual Meeting.
ISS has given Darden a governance
Quickscore of 10, indicating the
HIGHEST POSSIBLE
GOVERNANCE RISK
We believe the Company delayed the Annual Meeting for 10 days to hastily
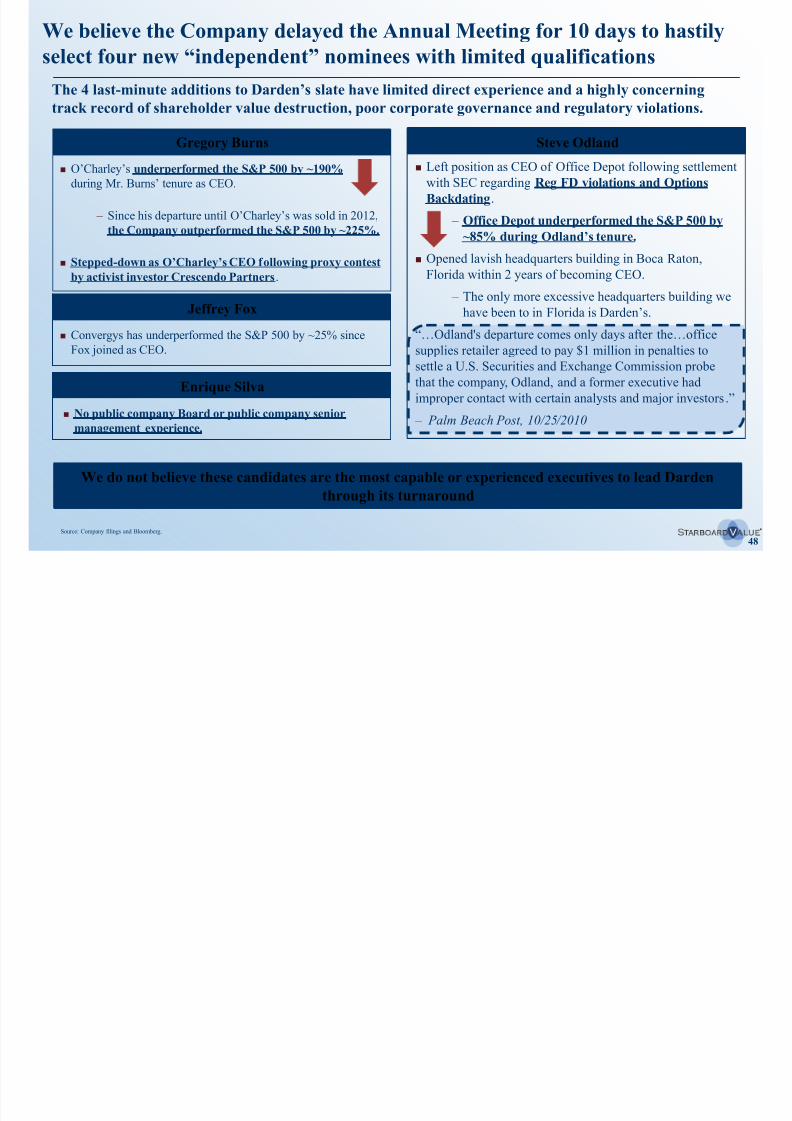
8/11/2019 Starboard Value Transforming Darden
http://slidepdf.com/reader/full/starboard-value-transforming-darden 48/294
48
We do not believe these candidates are the most capable or experienced executives to lead Darden
through its turnaround
The 4 last-minute additions to Darden’s slate have limited direct experience and a highly concerning
track record of shareholder value destruction, poor corporate governance and regulatory violations.
We believe the Company delayed the Annual Meeting for 10 days to hastily
select four new “independent” nominees with limited qualifications
Gregory Burns
O’Charley’s underperformed the S&P 500 by ~190%
during Mr. Burns’ tenure as CEO.
– Since his departure until O’Charley’s was sold in 2012,
the Company outperformed the S&P 500 by ~225%.
Stepped-down as O’Charley’s CEO following proxy contestby activist investor Crescendo Partners.
Enrique Silva
Source: Company filings and Bloomberg.
Jeffrey Fox
Convergys has underperformed the S&P 500 by ~25% since
Fox joined as CEO.
Steve Odland
Left position as CEO of Office Depot following settlement
with SEC regarding Reg FD violations and Options
Backdating.
– Office Depot underperformed the S&P 500 by
~85% during Odland’s tenure.
Opened lavish headquarters building in Boca Raton,Florida within 2 years of becoming CEO.
– The only more excessive headquarters building we
have been to in Florida is Darden’s.
“…Odland's departure comes only days after the…office
supplies retailer agreed to pay $1 million in penalties to
settle a U.S. Securities and Exchange Commission probe
that the company, Odland, and a former executive had
improper contact with certain analysts and major investors.”
– Palm Beach Post, 10/25/2010 No public company Board or public company senior
management experience.
Perhaps the most critical task of the new Board will be to hire
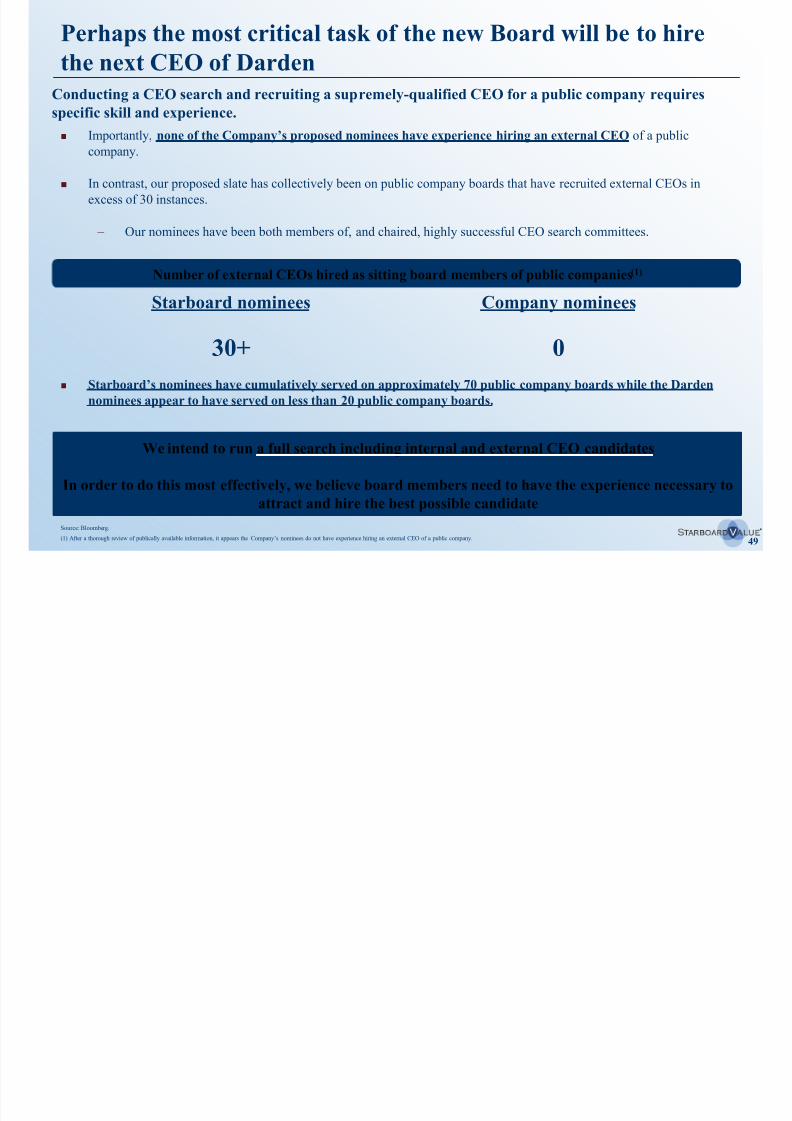
8/11/2019 Starboard Value Transforming Darden
http://slidepdf.com/reader/full/starboard-value-transforming-darden 49/294
49
Importantly, none of the Company’s proposed nominees have experience hiring an external CEO of a publiccompany.
In contrast, our proposed slate has collectively been on public company boards that have recruited external CEOs in
excess of 30 instances.
– Our nominees have been both members of, and chaired, highly successful CEO search committees.
Conducting a CEO search and recruiting a supremely-qualified CEO for a public company requires
specific skill and experience.
Perhaps the most critical task of the new Board will be to hire
the next CEO of Darden
Company nomineesStarboard nominees
Number of external CEOs hired as sitting board members of public companies(1)
We intend to run a full search including internal and external CEO candidates
In order to do this most effectively, we believe board members need to have the experience necessary to
attract and hire the best possible candidate
30+ 0
Source: Bloomberg.
(1) After a thorough review of publically available information, it appears the Company’s nominees do not have experience hiring an external CEO of a public company.
Starboard’s nominees have cumulatively served on approximately 70 public company boards while the Dardennominees appear to have served on less than 20 public company boards.
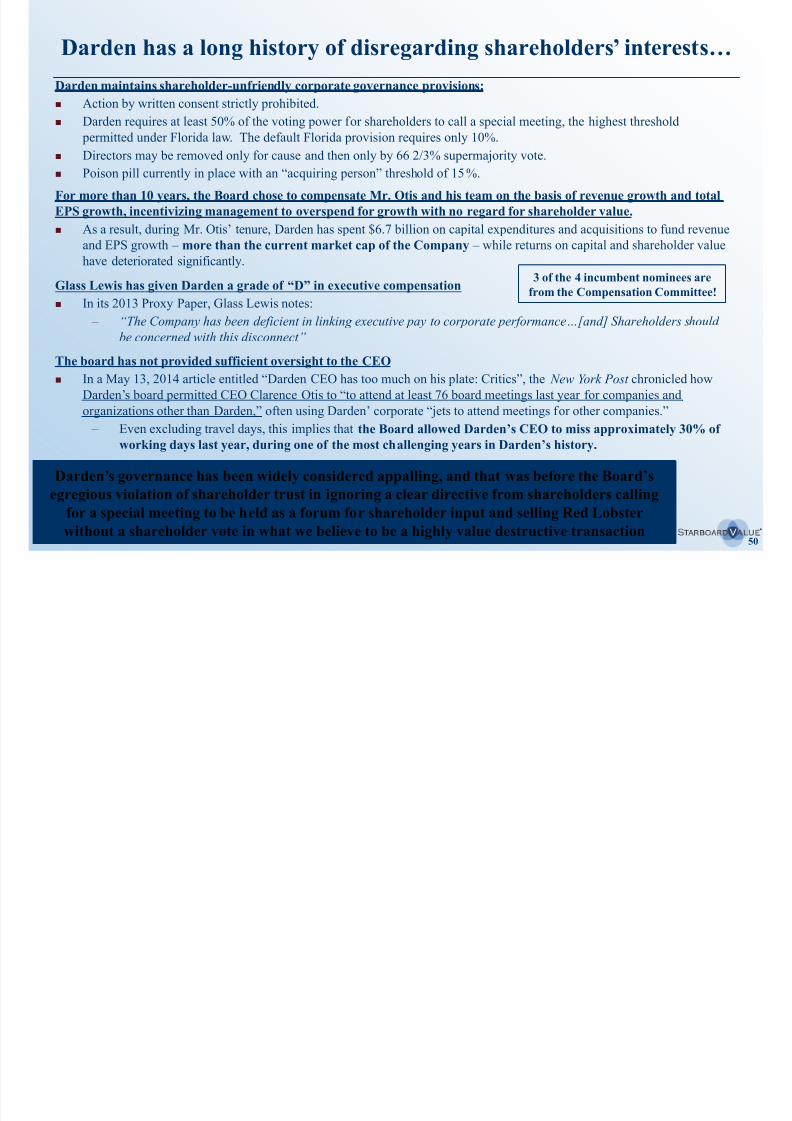
8/11/2019 Starboard Value Transforming Darden
http://slidepdf.com/reader/full/starboard-value-transforming-darden 50/294
50
Darden has a long history of disregarding shareholders’ interests…
Glass Lewis has given Darden a grade of “D” in executive compensation
In its 2013 Proxy Paper, Glass Lewis notes:
– “The Company has been deficient in linking executive pay to corporate performance…[and] Shareholders should
be concerned with this disconnect ”
Darden maintains shareholder-unfriendly corporate governance provisions:
Action by written consent strictly prohibited.
Darden requires at least 50% of the voting power for shareholders to call a special meeting, the highest threshold
permitted under Florida law. The default Florida provision requires only 10%. Directors may be removed only for cause and then only by 66 2/3% supermajority vote.
Poison pill currently in place with an “acquiring person” threshold of 15%.
Darden’s governance has been widely considered appalling, and that was before the Board’segregious violation of shareholder trust in ignoring a clear directive from shareholders calling
for a special meeting to be held as a forum for shareholder input and selling Red Lobster
without a shareholder vote in what we believe to be a highly value destructive transaction
For more than 10 years, the Board chose to compensate Mr. Otis and his team on the basis of revenue growth and total
EPS growth, incentivizing management to overspend for growth with no regard for shareholder value.
As a result, during Mr. Otis’ tenure, Darden has spent $6.7 billion on capital expenditures and acquisitions to fund revenue
and EPS growth – more than the current market cap of the Company – while returns on capital and shareholder value
have deteriorated significantly.
The board has not provided sufficient oversight to the CEO
In a May 13, 2014 article entitled “Darden CEO has too much on his plate: Critics”, the New York Post chronicled how
Darden’s board permitted CEO Clarence Otis to “to attend at least 76 board meetings last year for companies andorganizations other than Darden,” often using Darden’ corporate “jets to attend meetings for other companies.”
– Even excluding travel days, this implies that the Board allowed Darden’s CEO to miss approximately 30% ofworking days last year, during one of the most challenging years in Darden’s history.
3 of the 4 incumbent nominees are
from the Compensation Committee!
8/11/2019 Starboard Value Transforming Darden
http://slidepdf.com/reader/full/starboard-value-transforming-darden 51/294
51
Darden’s new Bylaw amendments serve to exacerbate Darden’s already alarming corporate governance concerns:
Gives Board broad discretion to unilaterally delay the Annual Meeting.
More stringent nomination notice and business proposal requirements. Sets Orange County, FL as exclusive forum for shareholders to bring derivative suits and other claims.
Removes ability of shareholders to fill existing vacancies at next Annual or Special Meeting.
Despite significant criticism from leading proxy advisory firms and shareholders regarding Darden’s poorgovernance practices, the Company has actually taken steps to further disenfranchise shareholders.
…and the Board has recently further limited shareholders’ rights
Rather than look out for the best interests of shareholders, it appears that Darden’s Board hastaken steps to further entrench themselves.
Darden’s recent Bylaw amendments underscore the Company’s blatant disregard forshareholder interests
ISS has given Darden a governance Quickscore of 10, indicating the HIGHEST POSSIBLE GOVERNANCE RISK The roles of Chairman and CEO were only recently separated.(1)
45.45% of the non-executive directors on the Board have lengthy tenure.
The Company does not have a majority vote standard in the election of directors.(2)
(1) After 19 years, Darden finally separated the roles on July 28, 2014, in response to a shareholder proposal from Barington Capital that the Board had initially said it planned to recommend against.(2) Darden stated that it intends to implement a majority voting standard for uncont ested elections beginning with the 2015 Annual Meet ing via a Bylaw amendment. Darden has yet to approve any such Bylaw amendment and indicates
that it plans to do so after the 2014 Annual Meeting.
Other disappointing corporate governance actions:
The Board paid outgoing CEO Clarence Otis even more in FY 2014, arguably the worst year in the Company’s history,
than it did the prior year.
2 of the 4 incumbent
nominees are fromthe Nom & Gov
Committee,
including Chair
Michael Rose
Time and again Darden has shown a blatant disregard for
8/11/2019 Starboard Value Transforming Darden
http://slidepdf.com/reader/full/starboard-value-transforming-darden 52/294
52
On March 3rd, during Darden’s call to explain the Company’s rationale for the Red Lobster spin, management took
questions from just four analysts and declined to provide details on several important questions.
Darden canceled its Analyst and Investor Day, scheduled for March 28, 2014.
Management shortened the Q3 2014 earnings call to 45 minutes and shut out critical analysts from asking questions.
A recent CNBC article titled “Darden Uses Lobster Claws On Critical Analysts” chronicles tactics used by Darden to put a
muzzle on analysts who provide critical analysis.
– The article discusses how analysts from leading sell-side research firms have had access limited to varying degrees
following their publication of analysis that did not reflect positively on management, and notes that this practice
has been going on for more than a decade and continues to this day. The article highlights that:
– Further, on March 19, 2014, the New York Post published an article titled “Darden Accused
of Icing out Critics of Red Lobster Spinoff”, which states:
Time and again Darden has shown a blatant disregard for
shareholder concerns and a propensity to silence criticsDarden has a long history of silencing critics and trying to avoid an active dialogue on key issues.
This is highly alarming – shareholders need to trust that management will provide equalaccess to all analysts and that sell-side analysts will be unbiased
“Some investors are protesting that Darden’s idea of ‘direct engagement’ amounts to returning the phone calls of analysts and investors who agree with its strategy while ignoring calls from
dissenters. ‘They’ve got a history of only engaging with investors and analysts who are supportive
of their views,’ said one Darden shareholder, who declined to give his name for fear of retribution
from the company. ‘If the board is so convinced [a Red Lobster spinoff] is such a great idea, then
put it to a vote.’”
“In 2002, The New York Times published an article about Matthew DiFrisco, an analyst who
downgraded Darden's stock to ‘neutral’ from ‘outperform.’ Following the downgrade, Darden’s
investor relations officer Matthew Stroud canceled a marketing trip with DiFrisco’s clients, telling
him that he needed to have an ‘outperform’ rating to enjoy such a privilege.”
Given this
distressing history,
why would the
Board look to add a
director with a well-
known Reg-FD
violation?
The Board then sanctioned one of the most egregious examples
8/11/2019 Starboard Value Transforming Darden
http://slidepdf.com/reader/full/starboard-value-transforming-darden 53/294
53
…The Board then sanctioned one of the most egregious examplesof poor corporate governance we have ever witnessed
On April 22, 2014, Starboard delivered an extremely strong mandate from Darden’s shareholder base for the calling of aspecial meeting to vote on the following proposal:
– to approve a non-binding resolution urging the Board of Directors of Darden not to approve any agreement or
proposed transaction involving a Red Lobster separation or spin-off prior to the 2014 Annual Meeting of
Shareholders unless such agreement or transaction would require shareholder approval.
The 57% of the outstanding shares that consented in favor of the calling of the Special Meeting represent an enormous
percentage of the estimated 72% of the outstanding shares that would be expected to vote at Darden's meetings.(1)
The Board’s casual and dismissive attitude towards the Special Meeting was disturbing.
– Shareholders spoke and expected the Board to recognize the will of shareholders and schedule the Special
Meeting without further delay.
– Instead, the Board chose to enter into a binding agreement to sell Red Lobster at what we believe to be a “fire
sale” price in a transaction that we believe destroyed shareholder value.
– This agreement rendered the Special Meeting request moot, thus disenfranchising shareholders and violatingshareholder trust.
Shareholders asked the Company to pause and reconsider what we believe to be a value destructive
plan to separate Red Lobster with a substantial majority of shareholders formally requesting that
Darden hold a special meeting to discuss this very topic, and the Board blatantly ignored shareholders’clearly stated wishes
Darden blatantly ignored the will of shareholders by committing to sell Red Lobster prior to holding
the shareholder-requested special meeting.
(1) Approximately 20% of the Company's outstanding shares are held by retail investors (who generally have extremely low vote totals), approximately 10% of the outstanding shares are out on loan and are typically not voted, andapproximately 3% of the outstanding shares are held by management and the Board. Based on the vote results from last year's 2013 Annual Meeting of shareholders, Darden's voting participation on non-routine items (items where a
broker cannot place a vote on a client's behalf) was 72% of the outstanding shares.
On top of poor governance practices the Board’s compensation
8/11/2019 Starboard Value Transforming Darden
http://slidepdf.com/reader/full/starboard-value-transforming-darden 54/294
54
Along with a leading compensation consultant, Starboard analyzed Darden’s executive compensation practices.
Despite underperforming peers substantially, members of Darden’s management have been paid at or near the top of
their bonus targets.
By utilizing bonus targets based on total revenue growth and total EPS growth, with no capital charge or shareholder-
return metric, the Board effectively incentivized management to spend as much of shareholders’ capital as possibleon growth without regard to whether that spending would create or destroy value.
Predictably, management spent nearly $7 billion – more than the entire current market cap of Darden – on
acquisitions and capex that we believe helped management realize outsized bonuses but destroyed value.
Darden has not followed best practices in numerous areas of compensation, including setting targets based on a peer
group cherry-picked to include primarily companies that are an order of magnitude larger and more successful than
Darden, many of whom are not even in Darden’s industry.
More troubling, we believe recent changes in Darden’s compensation structure may have been a factor inmanagement’s urgency to jettison Red Lobster.
As a final insult to shareholders, the Board paid outgoing CEO Clarence Otis even more in FY 2014, arguably the worst
year in the Company’s history, than it did the prior year.
Based on the limited information disclosed in Darden’s proxy statement, it does not appear that this bonus was
even earned, implying the Board gave Mr. Otis an extra discretionary bonus.
Despite the obvious and substantial failures of Darden’s compensation practices, Darden chose to include 3members of the Comp Committee out of its 4 incumbent nominees.
On top of poor governance practices, the Board s compensationpractices have also been terrible
Darden’s comp practices raise serious concerns about the oversight of the current Boardand Darden’s proposed slate of nominees
We believe that the Board has not properly linked pay with performance and has structured
management compensation plans that encouraged potentially value destructive behavior.
“The Company has been deficient in linking executive pay to corporate performance”
– Glass Lewis
Darden’s significant capital spending allowed management to hit
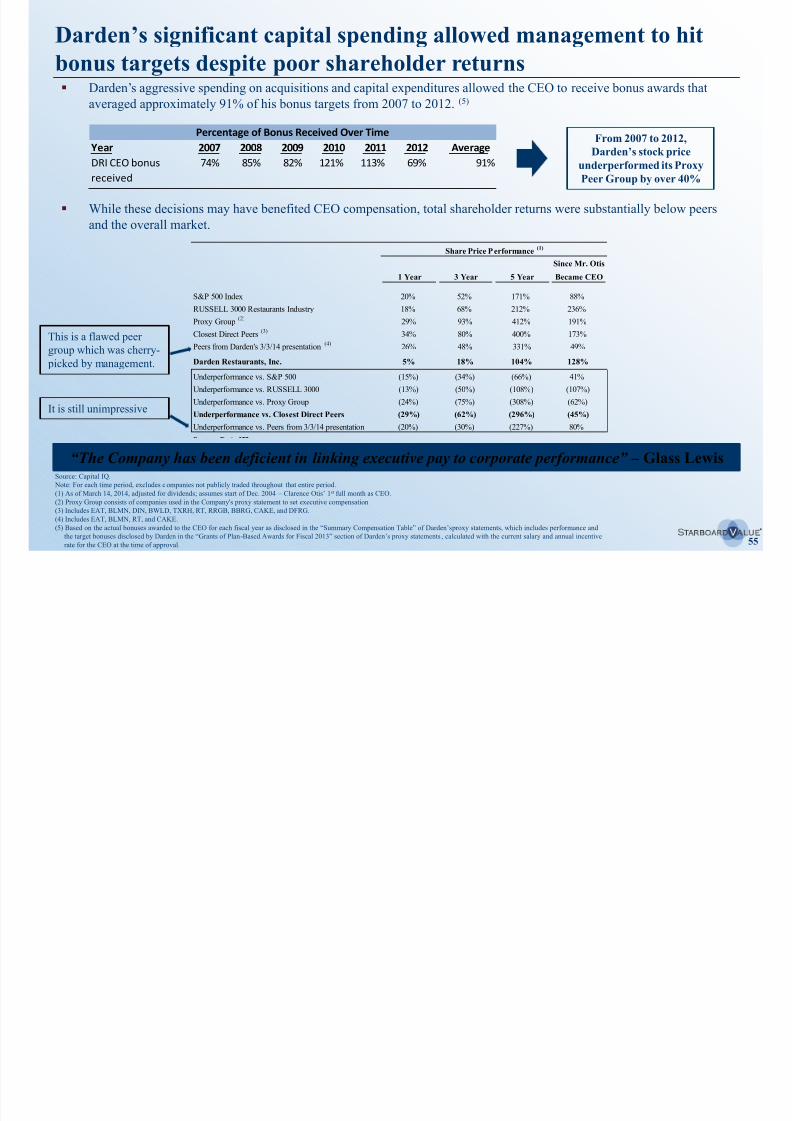
8/11/2019 Starboard Value Transforming Darden
http://slidepdf.com/reader/full/starboard-value-transforming-darden 55/294
55
Share Price Performance(1)
1 Year 3 Year 5 YearSince Mr. OtisBecame CEO
S&P 500 Index 20% 52% 171% 88%
RUSSELL 3000 Restaurants Industry 18% 68% 212% 236%
Proxy Group(2)
29% 93% 412% 191%
Closest Direct Peers(3)
34% 80% 400% 173%
Peers from Darden's 3/3/14 presentation(4)
26% 48% 331% 49%
Darden Restaurants, Inc. 5% 18% 104% 128%
Underperformance vs. S&P 500 (15%) (34%) (66%) 41%
Underperformance vs. RUSSELL 3000 (13%) (50%) (108%) (107%)
Underperformance vs. Proxy Group (24%) (75%) (308%) (62%)
Underperformance vs. Closest Direct Peers (29%) (62%) (296%) (45%)
Underperformance vs. Peers from 3/3/14 presentation (20%) (30%) (227%) 80%
Darden’s aggressive spending on acquisitions and capital expenditures allowed the CEO to receive bonus awards that
averaged approximately 91% of his bonus targets from 2007 to 2012. (5)
While these decisions may have benefited CEO compensation, total shareholder returns were substantially below peers
and the overall market.
Darden s significant capital spending allowed management to hitbonus targets despite poor shareholder returns
Source: Capital IQ.
Note: For each time period, excludes c ompanies not publicly traded throughout that entire period.
(1) As of March 14, 2014, adjusted for dividends; assumes start of Dec. 2004 – Clarence Otis’ 1st full month as CEO.
(2) Proxy Group consists of companies used in the Company's proxy statement to set executive compensation.
(3) Includes EAT, BLMN, DIN, BWLD, TXRH, RT, RRGB, BBRG, CAKE, and DFRG.
(4) Includes EAT, BLMN, RT, and CAKE.
(5) Based on the actual bonuses awarded to the CEO for each fiscal year as disclosed in the “Summary Compensation Table” of Darden’s proxy statements, which includes performance and
the target bonuses disclosed by Darden in the “Grants of Plan -Based Awards for Fiscal 2013” section of Darden’s proxy statements , calculated with the current salary and annual incentive
rate for the CEO at the time of approval.
Percentage of Bonus Received Over TimeYear 2007 2008 2009 2010 2011 2012 Average
DRI CEO bonus
received
74% 85% 82% 121% 113% 69% 91%
From 2007 to 2012,Darden’s stock price
underperformed its Proxy
Peer Group by over 40%
This is a flawed peer
group which was cherry-
picked by management.
It is still unimpressive
“The Company has been deficient in linking executive pay to corporate performance” – Glass Lewis
The Board inflated management comp by using a cherry-picked
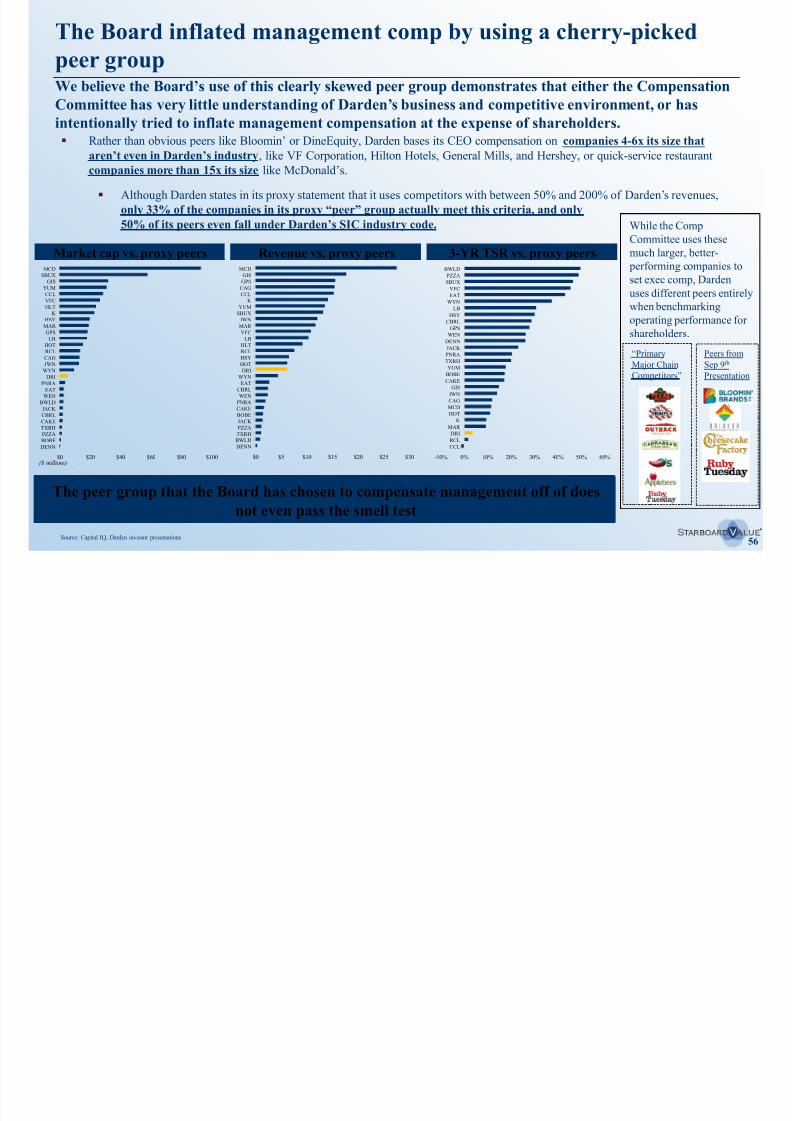
8/11/2019 Starboard Value Transforming Darden
http://slidepdf.com/reader/full/starboard-value-transforming-darden 56/294
56
Peers from
Sep 9th
Presentation
Rather than obvious peers like Bloomin’ or DineEquity, Darden bases its CEO compensation on companies 4-6x its size thataren’t even in Darden’s industry, like VF Corporation, Hilton Hotels, General Mills, and Hershey, or quick-service restaurant
companies more than 15x its size like McDonald’s.
Although Darden states in its proxy statement that it uses competitors with between 50% and 200% of Darden’s revenues,
only 33% of the companies in its proxy “peer” group actually meet this criteria, and only50% of its peers even fall under Darden’s SIC industry code.
The Board inflated management comp by using a cherry picked
peer group
The peer group that the Board has chosen to compensate management off of does
not even pass the smell test
We believe the Board’s use of this clearly skewed peer group demonstrates that either the CompensationCommittee has very little understanding of Darden’s business and competitive environment, or hasintentionally tried to inflate management compensation at the expense of shareholders.
While the Comp
Committee uses these
much larger, better-
performing companies toset exec comp, Darden
uses different peers entirely
when benchmarking
operating performance for
shareholders.
$0 $20 $40 $60 $80 $100
DENN
BOBE
PZZA
TXRH
CAKE
CBRL
JACK
BWLDWEN
EAT
PNRA
DRI
WYN
JWN
CAG
RCL
HOT
LB
GPS
MAR
HSY
K
HLT
VFC
CCL
YUM
GIS
SBUX
MCD
Market cap vs. proxy peers
($ millions)
Revenue vs. proxy peers
-10% 0% 10% 20% 30% 40% 50% 60%
CCL
RCL
DRI
MAR
K
HOT
MCD
CAGJWN
GIS
CAKE
BOBE
YUM
TXRH
PNRA
JACK
DENN
WEN
GPS
CBRL
HSY
LB
WYN
EAT
VFC
SBUX
PZZA
BWLD
3-YR TSR vs. proxy peers
Source: Capital IQ, Darden investor presentations
“Primary
Major Chain
Competitors”
$0 $5 $10 $15 $20 $25 $30
DENN
BWLDTXRH
PZZA
JACK
BOBE
CAKE
PNRAWEN
CBRL
EAT
WYN
DRI
HOT
HSY
RCL
HLT
LB
VFC
MAR
JWN
SBUX
YUM
K
CCL
CAG
GPS
GIS
MCD
Red Lobster was a key driver in management missing their 2013
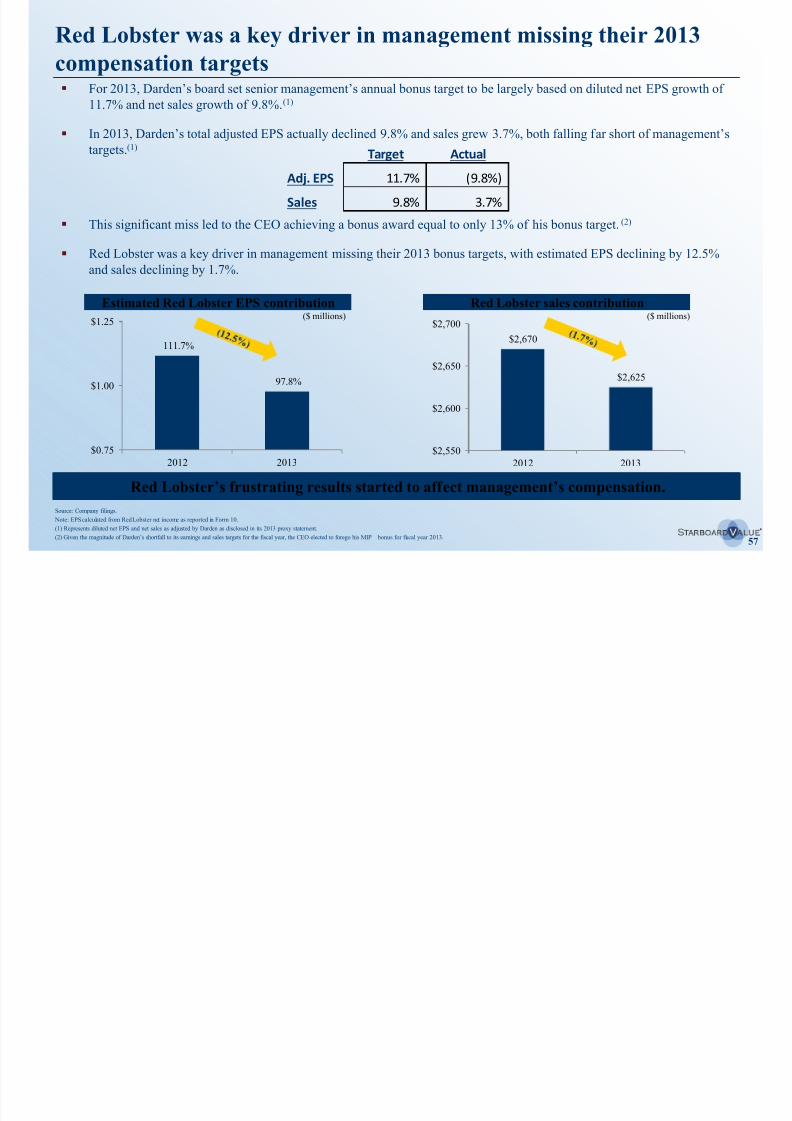
8/11/2019 Starboard Value Transforming Darden
http://slidepdf.com/reader/full/starboard-value-transforming-darden 57/294
57
For 2013, Darden’s board set senior management’s annual bonus target to be largely based on diluted net EPS growth of
11.7% and net sales growth of 9.8%.(1)
In 2013, Darden’s total adjusted EPS actually declined 9.8% and sales grew 3.7%, both falling far short of management’stargets.(1)
This significant miss led to the CEO achieving a bonus award equal to only 13% of his bonus target.(2)
Red Lobster was a key driver in management missing their 2013 bonus targets, with estimated EPS declining by 12.5%
and sales declining by 1.7%.
Red Lobster was a key driver in management missing their 2013
compensation targets
Source: Company filings.
Note: EPS calculated from Red Lobster net income as reported in Form 10.
(1) Represents diluted net EPS and net sales as adjusted by Darden as disclosed in its 2013 proxy statement.
(2) Given the magnitude of Darden’s shortfall to its earnings and sales targets for the fiscal year, the CEO elected to forego his MIP bonus for fiscal year 2013.
$2,670
$2,625
$2,550
$2,600
$2,650
$2,700
2012 2013
Red Lobster sales contributionEstimated Red Lobster EPS contribution
111.7%
97.8%
$0.75
$1.00
$1.25
2012 2013
($ millions)
Target Actual
Adj. EPS 11.7% (9.8%)
Sales 9.8% 3.7%
Red Lobster’s frustrating results started to affect management’s compensation.
($ millions)
Recent changes to Darden’s compensation programs made owning
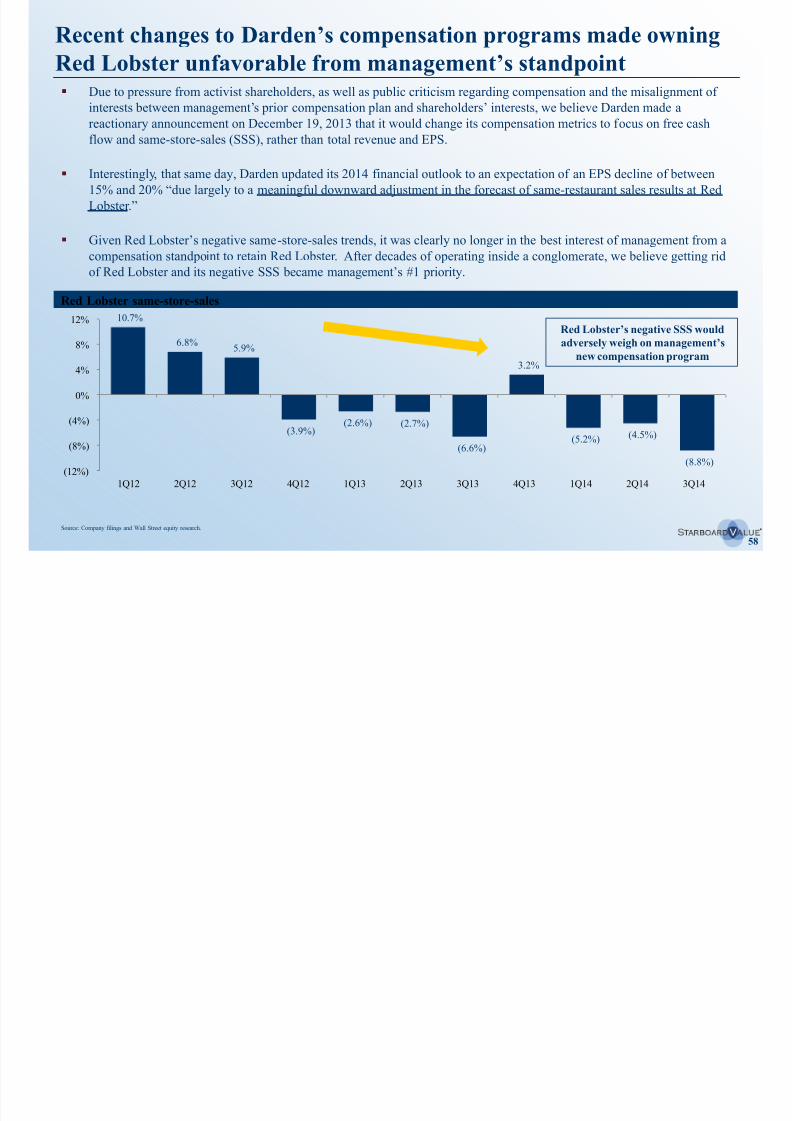
8/11/2019 Starboard Value Transforming Darden
http://slidepdf.com/reader/full/starboard-value-transforming-darden 58/294
58
Due to pressure from activist shareholders, as well as public criticism regarding compensation and the misalignment of
interests between management’s prior compensation plan and shareholders’ interests, we believe Darden made a
reactionary announcement on December 19, 2013 that it would change its compensation metrics to focus on free cash
flow and same-store-sales (SSS), rather than total revenue and EPS.
Interestingly, that same day, Darden updated its 2014 financial outlook to an expectation of an EPS decline of between
15% and 20% “due largely to a meaningful downward adjustment in the forecast of same-restaurant sales results at Red
Lobster .”
Given Red Lobster’s negative same-store-sales trends, it was clearly no longer in the best interest of management from a
compensation standpoint to retain Red Lobster. After decades of operating inside a conglomerate, we believe getting rid
of Red Lobster and its negative SSS became management’s #1 priority.
Recent changes to Darden s compensation programs made owningRed Lobster unfavorable from management’s standpoint
Red Lobster same-store-sales
Source: Company filings and Wall Street equity research.
Red Lobster’s negative SSS wouldadversely weigh on management’s
new compensation program
10.7%
6.8%5.9%
(3.9%)(2.6%) (2.7%)
(6.6%)
3.2%
(5.2%) (4.5%)
(8.8%)(12%)
(8%)
(4%)
0%
4%
8%
12%
1Q12 2Q12 3Q12 4Q12 1Q13 2Q13 3Q13 4Q13 1Q14 2Q14 3Q14
8/11/2019 Starboard Value Transforming Darden
http://slidepdf.com/reader/full/starboard-value-transforming-darden 59/294
59
The time for change is now
We must change Darden’s management approach to a restaurant-centric philosophy, away from its currentcorporate-centric philosophy.
Transformational leadership and innovative solutions are needed to propel Darden to future success.
The existing cost structure is not sustainable and needs to be adjusted to allow Darden to be a restaurant leader.
Darden’s current conglomerate model and inefficient asset ownership structure are preventing Darden from
realizing its potential operating performance or maximizing long-term value for shareholders – we are excited to
instill change at Darden for the benefit of all shareholders if our nominees are elected.
Darden is in dire need of change...we believe new people, new energy, and a new culture will improve the
business.
Unlocking long-term shareholder value must become a priority
Allow us to improve Darden for the benefit of all shareholders
Vote on Starboard’s WHITE proxy card today

8/11/2019 Starboard Value Transforming Darden
http://slidepdf.com/reader/full/starboard-value-transforming-darden 60/294
60
III. It’s all about the people
With the right people at the helm, we believe Darden will
8/11/2019 Starboard Value Transforming Darden
http://slidepdf.com/reader/full/starboard-value-transforming-darden 61/294
61
Beginning with Bill Darden and then Joe Lee, Darden’s restaurants operated with pride and flawless execution, exuding best-in-class operating performance.
The focus of any successful restaurant company must be on the:
– People
– Energy
– Culture
We have nominated 12 highly qualified candidates for election at the 2014 Annual Meeting who will commit to
bringing back Darden’s culture of success and fairly and objectively representing the best interests of all
shareholders.
– We have carefully selected a group of candidates with a unique and complementary set of skills and perspectives
directly relevant to Darden's business and current challenges, including experienced restaurant operators with
expertise in Darden's major business lines, and experts in real estate, finance, turnarounds, supply chain, and,critically, effective public company governance and compensation programs.
We believe electing our nominees will be the first step in returning Darden to a people-centric and operationally focused
culture rather than the current corporate-centric culture.
Darden has a history centered around experienced and passionate restaurant operators that led through
their spirit and desire for success.
Darden’s employee base is its greatest asset – we plan on improving the focus and culture of the
organization to empower the people and drive success
With the right people at the helm, we believe Darden will
succeed
1
2
3
8/11/2019 Starboard Value Transforming Darden
http://slidepdf.com/reader/full/starboard-value-transforming-darden 62/294
62
Great people will deliver great results
“It is said that leadership is the ability to guide or direct others. We would add to that
def ini tion the abil i ty to inspire, enthuse, motivate and encourage – for starters. The fact
is, Darden Restaurants leadership mani fests itself in hundreds of ways every day.
I ndeed, we consider leadership excellence to be the essential strategic plank of our
business model .…leadership creates value for all of our stakeholders – guests, investor s,employees, vendors and the communi ty .”
- Darden 2004 Annual Report (Joe Lee’s last as CEO)
Shortly before the current management team took the helm, Darden stated the following in its 2004
Annual Report.
As Joe Lee emphasized, running a successful restaurant concept is about the people. The leadership at
the top of the company (especially the CEO) must inspire a strong culture and demonstrate a desire to
lead superb operations
We believe Darden needs to follow the words it once said and revive the brand with excellent leaders.
8/11/2019 Starboard Value Transforming Darden
http://slidepdf.com/reader/full/starboard-value-transforming-darden 63/294
63
Words from a true restaurant operator…
In Joe Lee’s final public appearance as Darden’s Chairman, he said the following words, which revealthe most critical flaw in Darden’s current mindset – you must be a great restaurant operator to run
restaurants that create a great experience while simultaneously generating significant profits.
“Operations, I came out of operations…the goal is to be fully staffed in every restaurant with every
position, with talented, skilled and experienced employees. Let them know…make sure they
know…through training, through the orientation and hiring, through the training, let them know
what their role is in developing the brand promise and delivering the brand promise. We want to go
beyond their intellectual agreement to their emotional commitment…
…And so the key to management is making sure that you get that emotional connection…
… we’ve got several little sayings that we use here, but "brilliance with the basics" is one that I
have liked for a long time. It has some possible misconnotation because it is not just the basic thing
of serving food. It is the basics of your functional area. If you are in legal, you want to do it just a
little better. You want to shine relative to your competition, and throughout the Company with
every area…
…And we really want the general managers to know how much we appreciate them and appreciate
their role.”
- Joe Lee, November 9, 2005
We believe Restaurant General Managers (GMs) are the most
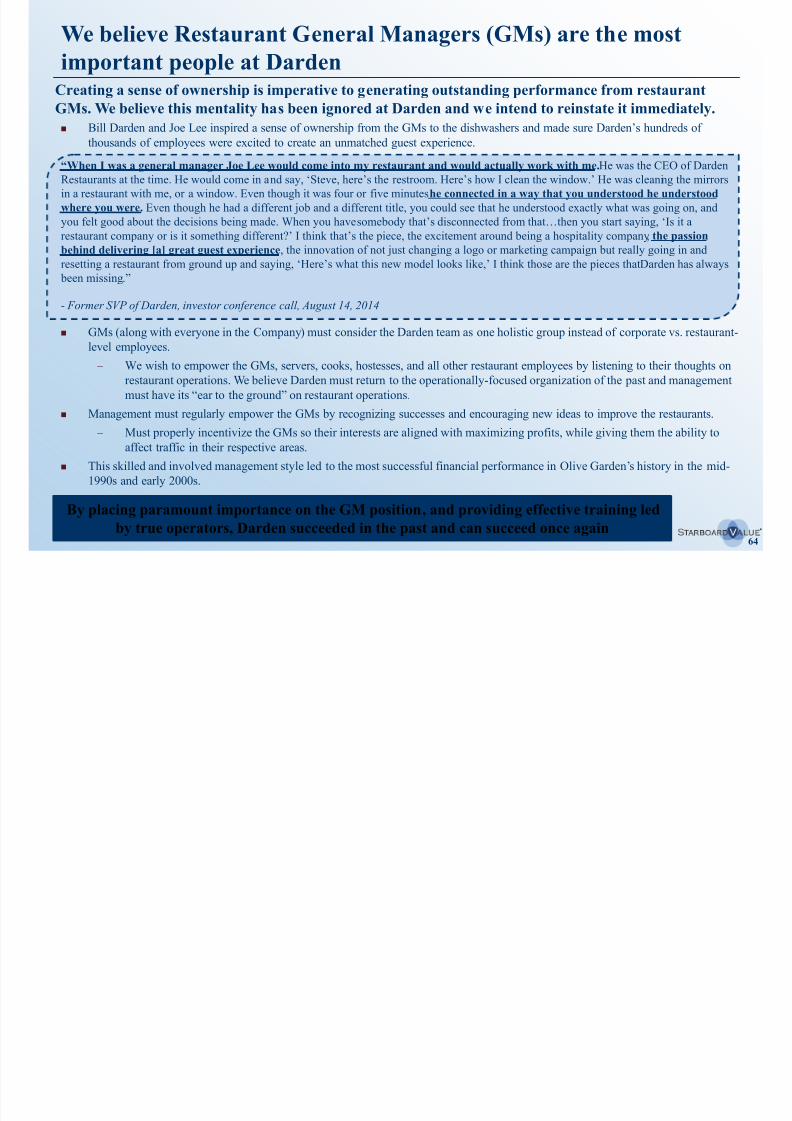
8/11/2019 Starboard Value Transforming Darden
http://slidepdf.com/reader/full/starboard-value-transforming-darden 64/294
64
g ( )
important people at Darden
By placing paramount importance on the GM position, and providing effective training led
by true operators, Darden succeeded in the past and can succeed once again
Creating a sense of ownership is imperative to generating outstanding performance from restaurant
GMs. We believe this mentality has been ignored at Darden and we intend to reinstate it immediately.
Bill Darden and Joe Lee inspired a sense of ownership from the GMs to the dishwashers and made sure Darden’s hundreds of
thousands of employees were excited to create an unmatched guest experience.
GMs (along with everyone in the Company) must consider the Darden team as one holistic group instead of corporate vs. restaurant-
level employees.
– We wish to empower the GMs, servers, cooks, hostesses, and all other restaurant employees by listening to their thoughts on
restaurant operations. We believe Darden must return to the operationally-focused organization of the past and management
must have its “ear to the ground” on restaurant operations. Management must regularly empower the GMs by recognizing successes and encouraging new ideas to improve the restaurants.
– Must properly incentivize the GMs so their interests are aligned with maximizing profits, while giving them the ability to
affect traffic in their respective areas.
This skilled and involved management style led to the most successful financial performance in Olive Garden’s history in the mid-
1990s and early 2000s.
“When I was a general manager Joe Lee would come into my restaurant and would actually work with me. He was the CEO of Darden
Restaurants at the time. He would come in and say, ‘Steve, here’s the restroom. Here’s how I clean the window.’ He was cleaning the mirrors
in a restaurant with me, or a window. Even though it was four or five minutes he connected in a way that you understood he understood
where you were. Even though he had a different job and a different title, you could see that he understood exactly what was going on, and
you felt good about the decisions being made. When you have somebody that’s disconnected from that…then you start saying, ‘Is it a
restaurant company or is it something different?’ I think that’s the piece, the excitement around being a hospitality company , the passion
behind delivering [a] great guest experience, the innovation of not just changing a logo or marketing campaign but really going in and
resetting a restaurant from ground up and saying, ‘Here’s what this new model looks like,’ I think those are the pieces that Darden has always been missing.”
- Former SVP of Darden, investor conference call, August 14, 2014
Competitors have also found that inspiration and engagement
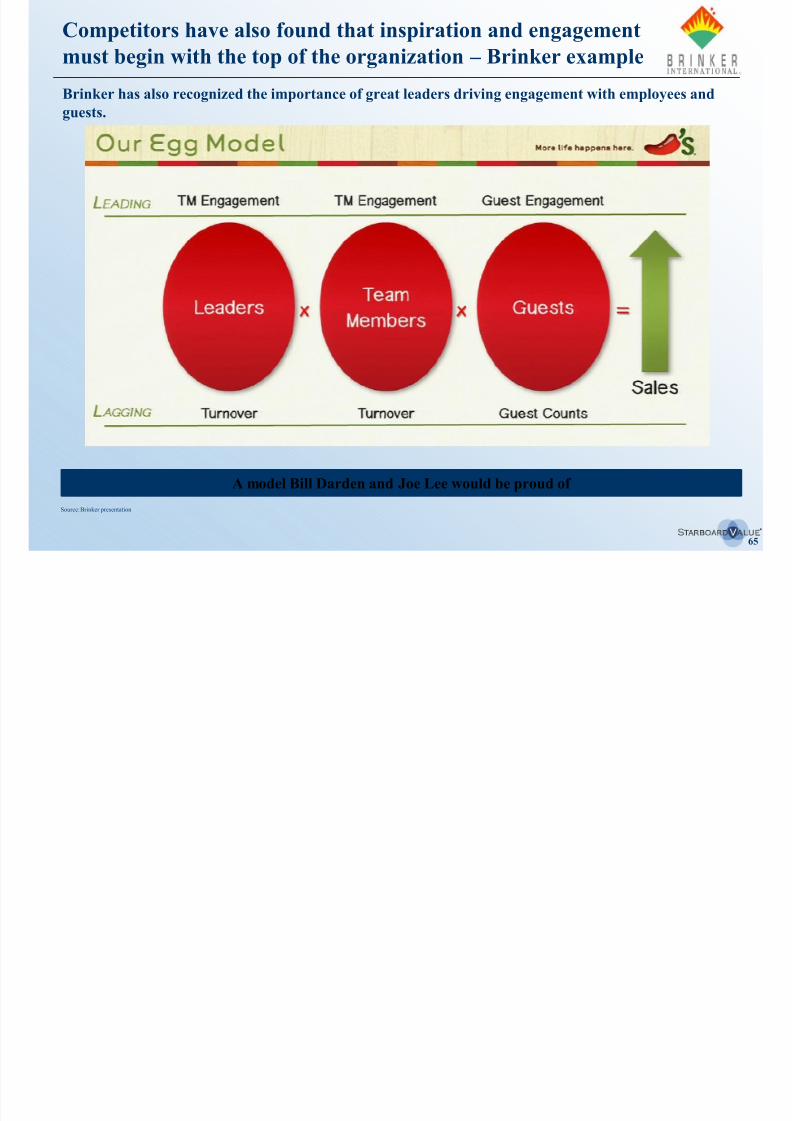
8/11/2019 Starboard Value Transforming Darden
http://slidepdf.com/reader/full/starboard-value-transforming-darden 65/294
65
must begin with the top of the organization – Brinker example
Brinker has also recognized the importance of great leaders driving engagement with employees and
guests.
Source: Brinker presentation.
A model Bill Darden and Joe Lee would be proud of
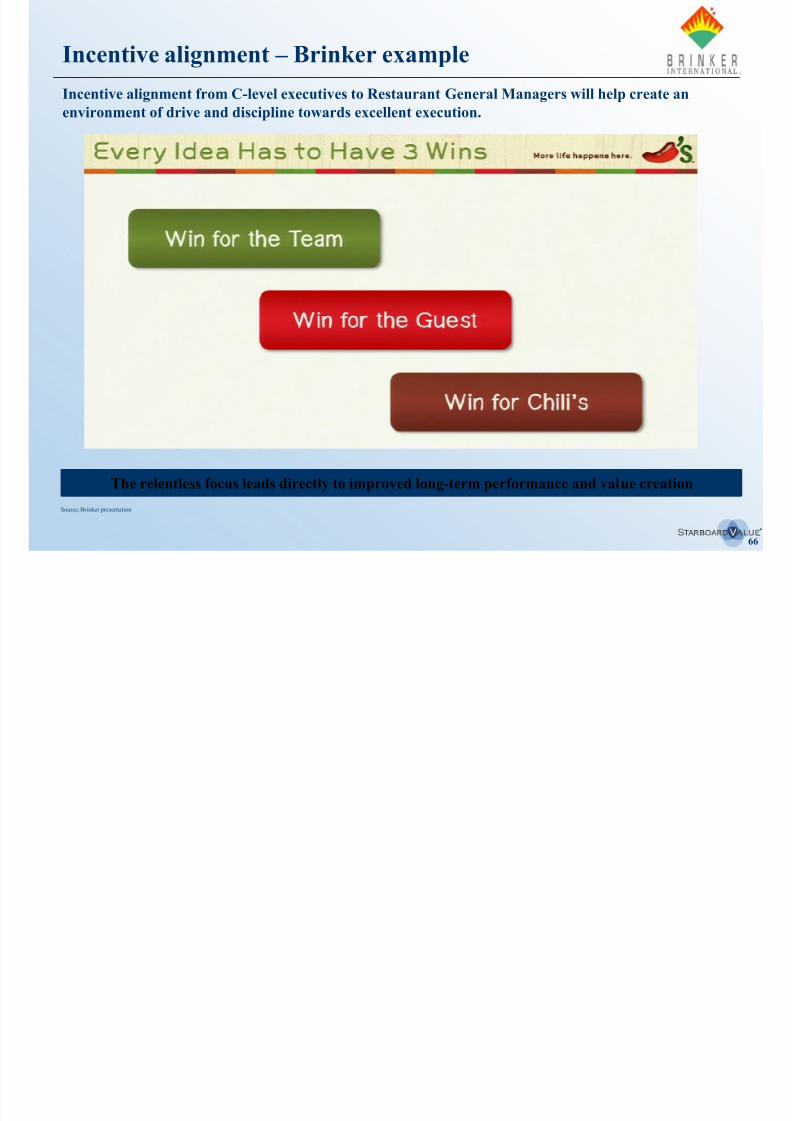
8/11/2019 Starboard Value Transforming Darden
http://slidepdf.com/reader/full/starboard-value-transforming-darden 66/294
66
Incentive alignment – Brinker example
Incentive alignment from C-level executives to Restaurant General Managers will help create an
environment of drive and discipline towards excellent execution.
Source: Brinker presentation.
The relentless focus leads directly to improved long-term performance and value creation
We believe aligning incentives with General Managers (GMs) is
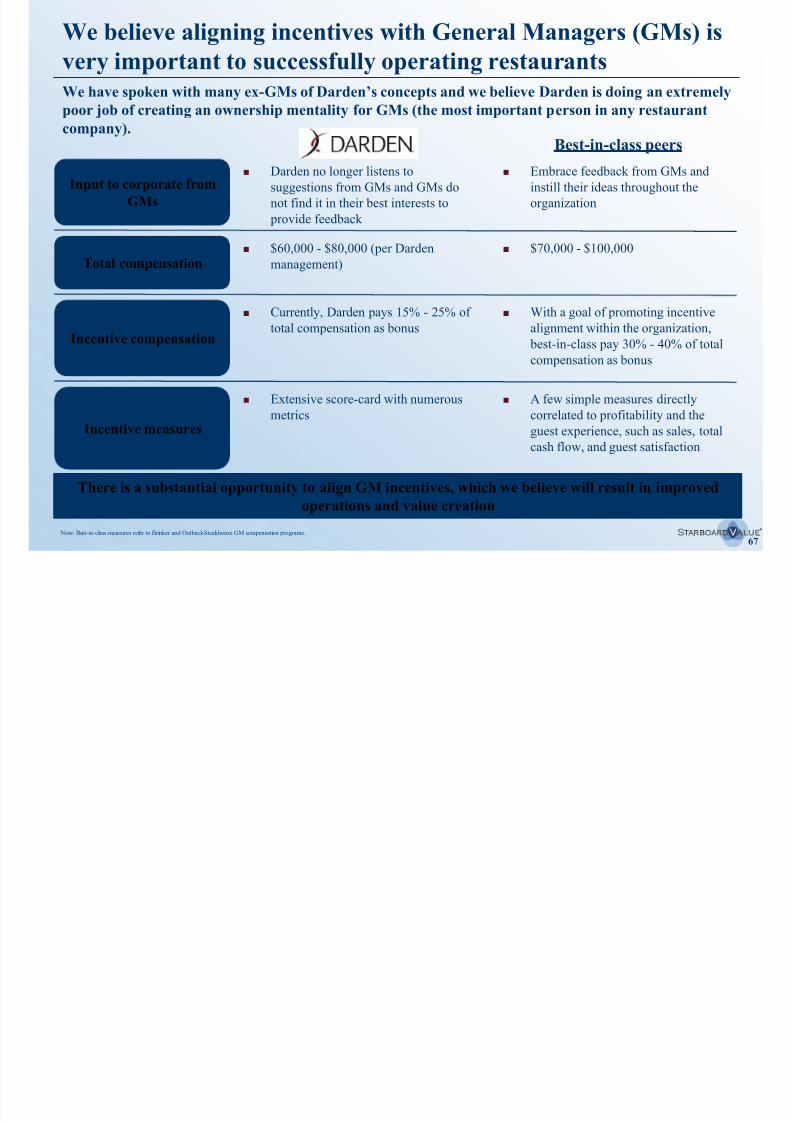
8/11/2019 Starboard Value Transforming Darden
http://slidepdf.com/reader/full/starboard-value-transforming-darden 67/294
67
We have spoken with many ex-GMs of Darden’s concepts and we believe Darden is doing an extremelypoor job of creating an ownership mentality for GMs (the most important person in any restaurant
company).
Note: Best-in-class measures refer to Brinker and Outback Steakhouse GM compensation programs.
There is a substantial opportunity to align GM incentives, which we believe will result in improved
operations and value creation
g g g ( )
very important to successfully operating restaurants
Input to corporate from
GMs
Total compensation
Incentive compensation
Darden no longer listens to
suggestions from GMs and GMs do
not find it in their best interests to
provide feedback
Currently, Darden pays 15% - 25% of
total compensation as bonus
Embrace feedback from GMs and
instill their ideas throughout the
organization
With a goal of promoting incentive
alignment within the organization,
best-in-class pay 30% - 40% of total
compensation as bonus
Incentive measures
Extensive score-card with numerousmetrics
A few simple measures directlycorrelated to profitability and the
guest experience, such as sales, total
cash flow, and guest satisfaction
$60,000 - $80,000 (per Darden
management)
$70,000 - $100,000
Best-in-class peers
We believe Darden must focus on the people in its organization
8/11/2019 Starboard Value Transforming Darden
http://slidepdf.com/reader/full/starboard-value-transforming-darden 68/294
68
Under the leadership of Joe Lee and Brad Blum, Olive Garden GMs were instructed to ask themselves 3
questions before making any decision:
– Is this good for the guest?
– Is this good for the employees?
– Is this good for the investors?
If the answer was “no” to any of the 3 above questions, then you should not proceed.
When Darden used this filter and empowered GMs, it drove both a superior guest experience and superiorshareholder returns.
Our nominees, if elected, are excited to bring back the inspiration and camaraderie that Darden once had.
With great leaders at the helm, we hope to:
1. Reinvigorate the culture at Darden
2. Bring Darden back to its roots as a restaurant operating company
3. Energize and empower the people in the organization
p p g
to drive results
1
2
3
We belie e o r nominees can lead Darden to f t re s ccess
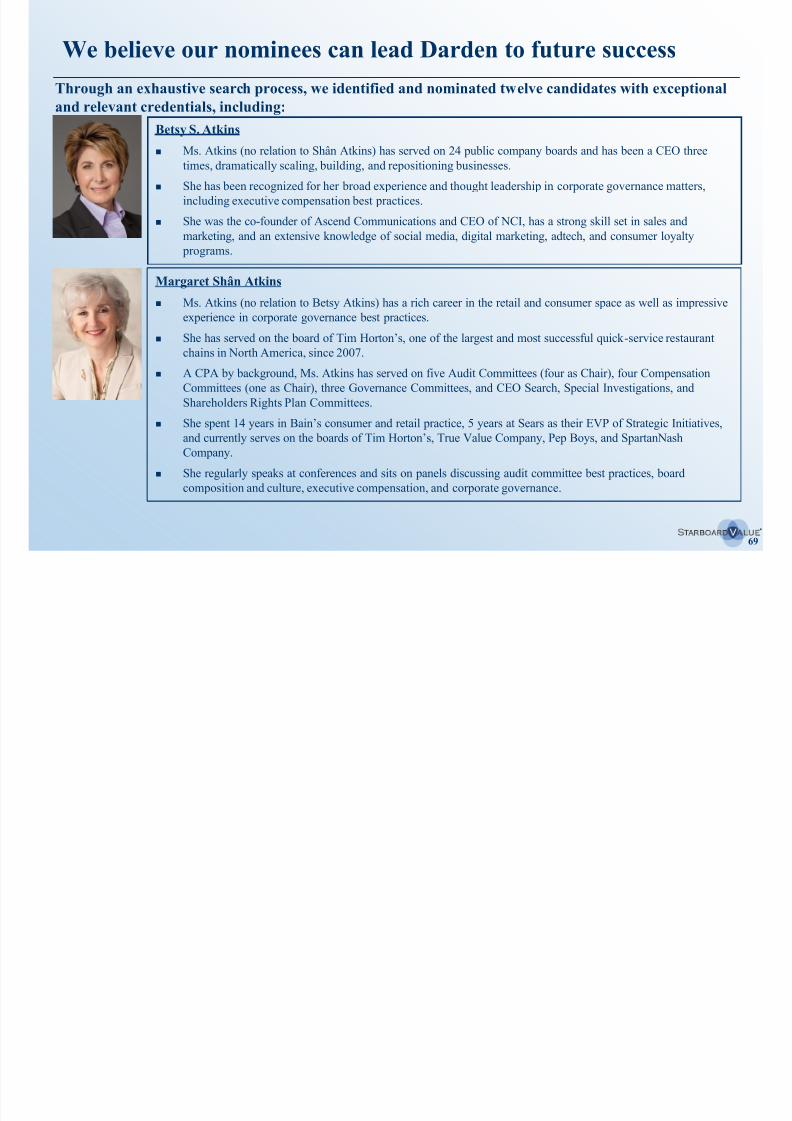
8/11/2019 Starboard Value Transforming Darden
http://slidepdf.com/reader/full/starboard-value-transforming-darden 69/294
69
We believe our nominees can lead Darden to future success
Betsy S. Atkins
Ms. Atkins (no relation to Shân Atkins) has served on 24 public company boards and has been a CEO three
times, dramatically scaling, building, and repositioning businesses.
She has been recognized for her broad experience and thought leadership in corporate governance matters,
including executive compensation best practices.
She was the co-founder of Ascend Communications and CEO of NCI, has a strong skill set in sales and
marketing, and an extensive knowledge of social media, digital marketing, adtech, and consumer loyalty
programs.
Margaret Shân Atkins
Ms. Atkins (no relation to Betsy Atkins) has a rich career in the retail and consumer space as well as impressive
experience in corporate governance best practices.
She has served on the board of Tim Horton’s, one of the largest and most successful quick -service restaurant
chains in North America, since 2007.
A CPA by background, Ms. Atkins has served on five Audit Committees (four as Chair), four Compensation
Committees (one as Chair), three Governance Committees, and CEO Search, Special Investigations, and
Shareholders Rights Plan Committees.
She spent 14 years in Bain’s consumer and retail practice, 5 years at Sears as their EVP of Strategic Initiatives,
and currently serves on the boards of Tim Horton’s, True Value Company, Pep Boys, and SpartanNash
Company.
She regularly speaks at conferences and sits on panels discussing audit committee best practices, board
composition and culture, executive compensation, and corporate governance.
Through an exhaustive search process, we identified and nominated twelve candidates with exceptional
and relevant credentials, including:
We believe our nominees can lead Darden to future success
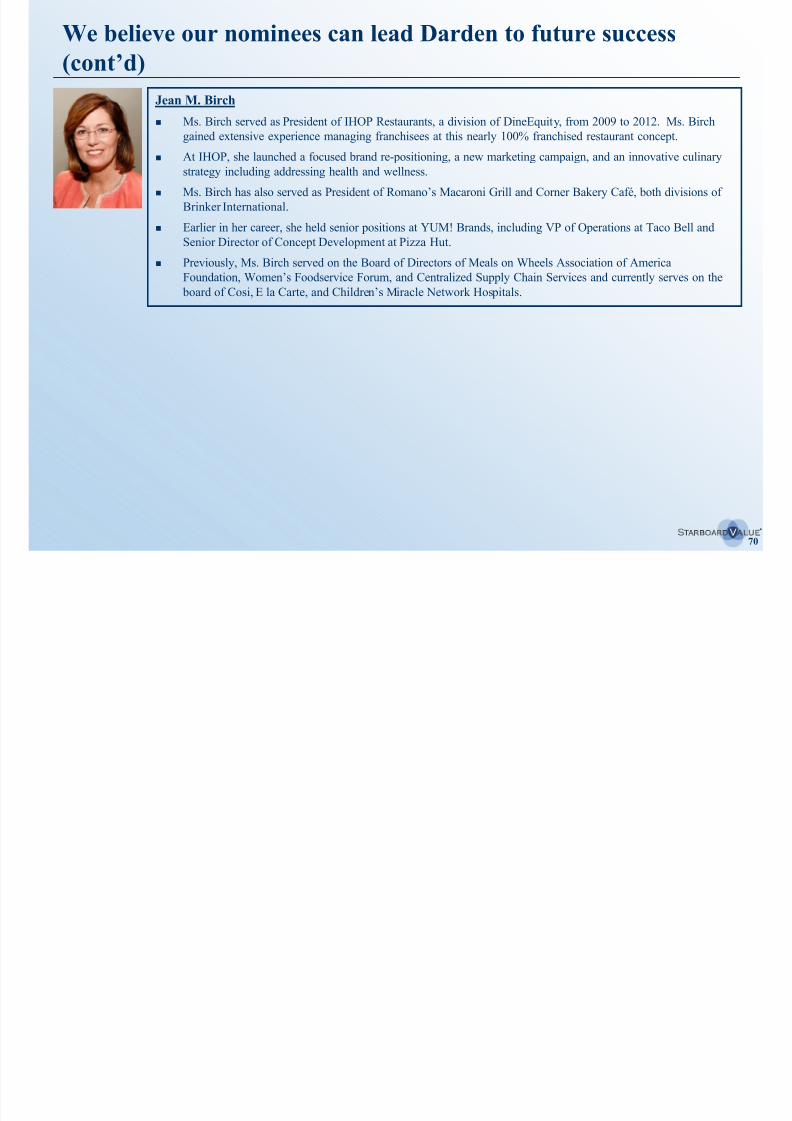
8/11/2019 Starboard Value Transforming Darden
http://slidepdf.com/reader/full/starboard-value-transforming-darden 70/294
70
(cont’d) Jean M. Birch
Ms. Birch served as President of IHOP Restaurants, a division of DineEquity, from 2009 to 2012. Ms. Birch
gained extensive experience managing franchisees at this nearly 100% franchised restaurant concept. At IHOP, she launched a focused brand re-positioning, a new marketing campaign, and an innovative culinary
strategy including addressing health and wellness.
Ms. Birch has also served as President of Romano’s Macaroni Grill and Corner Bakery Café, both divisions of
Brinker International.
Earlier in her career, she held senior positions at YUM! Brands, including VP of Operations at Taco Bell and
Senior Director of Concept Development at Pizza Hut.
Previously, Ms. Birch served on the Board of Directors of Meals on Wheels Association of AmericaFoundation, Women’s Foodservice Forum, and Centralized Supply Chain Services and currently serves on the
board of Cosi, E la Carte, and Children’s Miracle Network Hospitals.
We believe our nominees can lead Darden to future success

8/11/2019 Starboard Value Transforming Darden
http://slidepdf.com/reader/full/starboard-value-transforming-darden 71/294
71
Bradley D. Blum
Mr. Blum spent a significant portion of his career with Darden and General Mills.
As President of Olive Garden from 1994 to 2002, he led a brand renaissance that transformed Olive Garden
from a struggling company in serious decline to one of the most successful casual dining restaurants in the
world, and a business that is currently the largest and most valuable part of Darden's portfolio of brands.
During Mr. Blum’s tenure at Darden, the Company's stock price outperformed the S&P 500 by more than
100%, and Olive Garden achieved 29 consecutive quarters of same-restaurant-sales increases, increased
average annual sales per restaurant from approximately $2.5 million to $4 million, and significantly increased
overall profits.
Mr. Blum served on Darden's Board of Directors for more than 5 years, including as Vice Chairman of the
Company.
He then joined Burger King as CEO to turn around their struggling business, which resulted in a successful IPO
in 2006 that achieved an outsized return on the original private equity investment.
As a senior executive in the cereal division of General Mills, Mr. Blum was responsible for developing and
introducing Cinnamon Toast Crunch, Total Raisin Bran, Apple Cinnamon Cheerios, and Basic 4.
(cont’d)
We believe our nominees can lead Darden to future success
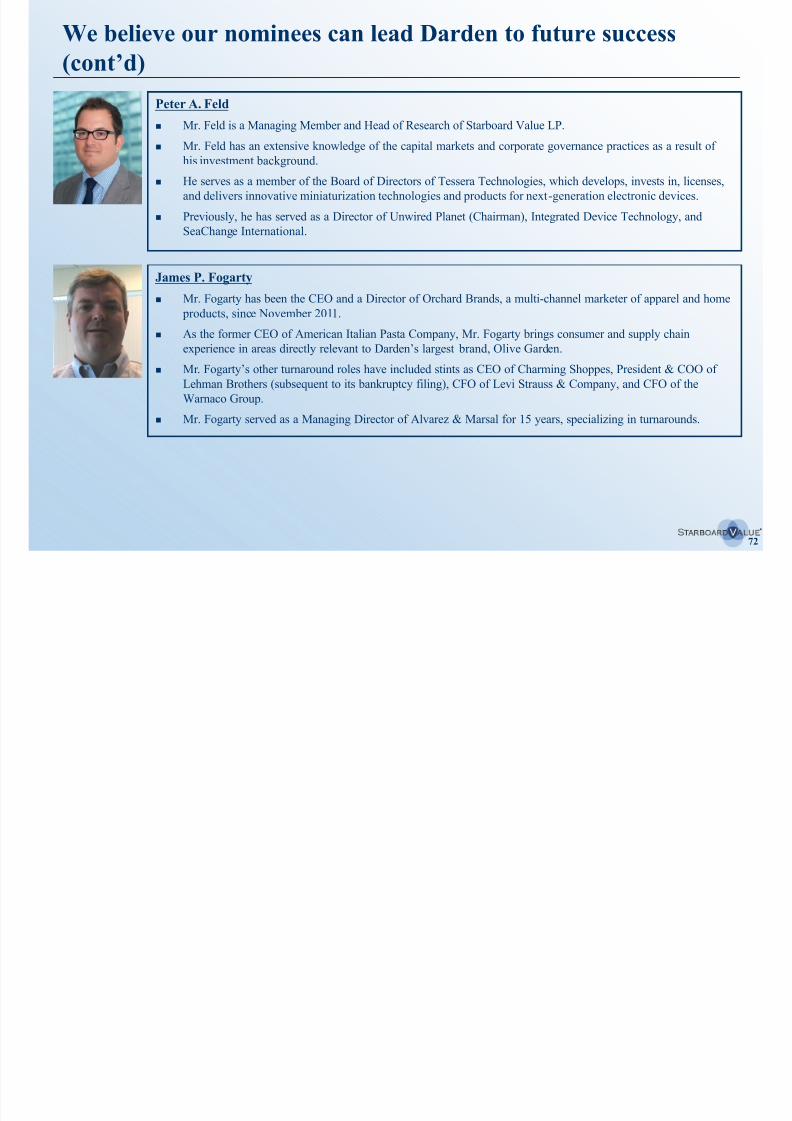
8/11/2019 Starboard Value Transforming Darden
http://slidepdf.com/reader/full/starboard-value-transforming-darden 72/294
72
Peter A. Feld
Mr. Feld is a Managing Member and Head of Research of Starboard Value LP.
Mr. Feld has an extensive knowledge of the capital markets and corporate governance practices as a result of
his investment background.
He serves as a member of the Board of Directors of Tessera Technologies, which develops, invests in, licenses,
and delivers innovative miniaturization technologies and products for next-generation electronic devices.
Previously, he has served as a Director of Unwired Planet (Chairman), Integrated Device Technology, and
SeaChange International.
James P. Fogarty
Mr. Fogarty has been the CEO and a Director of Orchard Brands, a multi-channel marketer of apparel and home
products, since November 2011.
As the former CEO of American Italian Pasta Company, Mr. Fogarty brings consumer and supply chain
experience in areas directly relevant to Darden’s largest brand, Olive Garden.
Mr . Fogarty’s other turnaround roles have included stints as CEO of Charming Shoppes, President & COO of
Lehman Brothers (subsequent to its bankruptcy filing), CFO of Levi Strauss & Company, and CFO of the
Warnaco Group.
Mr. Fogarty served as a Managing Director of Alvarez & Marsal for 15 years, specializing in turnarounds.
(cont’d)
We believe our nominees can lead Darden to future success
8/11/2019 Starboard Value Transforming Darden
http://slidepdf.com/reader/full/starboard-value-transforming-darden 73/294
73
Cynthia T. Jamison
Ms. Jamison brings vast board experience, including her most recent success as Chairman of the Board of
Tractor Supply Co., which has outperformed the S&P by over 1,300% since she joined the Board in 2002.
Ms. Jamison also serves on the board of Office Depot and B&G Foods.
She has served on five Audit Committees (three as Chair), four Compensation Committees (one as Chair), and
three Governance Committees (one as Chair) throughout her career.
Ms. Jamison has experience as CFO and COO of several public companies.
She is both a frequent keynote speaker on CFO and boardroom topics, and quoted as a financial/economic
“expert” in Forbes, the Wall Street Journal, Newsweek, CFO Magazine, and the Economist.
William H. Lenehan
Mr. Lenehan has significant expertise in the real estate industry.
He served as CEO of MI Developments, now named Granite REIT, an owner of net leased industrial and
manufacturing real estate, where he was a member of their Strategic Review Committee and was a Director.
He is Chair of the Investment Committee, Member of the Nominating and Corporate Governance Committee,
and a Director of Gramercy Property Trust, a publicly traded industrial and office property net lease REIT.
He is Chair of the Corporate Governance Committee, Member of the Audit Committee, and a Director ofStratus Properties, owner of commercial real estate and residential land in Austin, Texas.
He has assembled, in joint venture with private equity funds and public REITs, nearly 100 triple net leased
properties in the last year.
He was formerly an investment professional at Farallon Capital Management.
(cont’d)
We believe our nominees can lead Darden to future success
8/11/2019 Starboard Value Transforming Darden
http://slidepdf.com/reader/full/starboard-value-transforming-darden 74/294
74
Lionel L. Nowell, III
Mr. Nowell is a financial expert with more than 30 years working in senior finance roles for top-tier publicly
traded consumer product companies. A CPA by background, Mr. Nowell served as the SVP and Treasurer of PepsiCo for 8 years.
He has previously served as the CFO of The Pepsi Bottling Group, CFO of Pillsbury North America, and as a
senior executive at Pizza Hut.
Mr. Nowell currently serves as a Director and as a member of the Audit Committees for American Electric
Power Company (Chair), Reynolds American Inc., and Bank of America Corporation.
He was recognized by National Association of Corporate Directors as one of the most influential people in the
boardroom and corporate governance.
Jeffrey C. Smith
Mr. Smith is a Managing Member, CEO, and Chief Investment Officer of Starboard Value LP. Prior to founding
Starboard, he was a Partner and Managing Director of Ramuis LLC.
Mr. Smith currently serves on the Board of Directors of Quantum Corporation, a global expert in data
protection and big data management.
Previously, he has served as a Director of Office Depot, Regis Corporation, Surmodics, Zoran Corporation,
Phoenix Technologies (Chairman), Actel Corporation, S1 Corporation, Kensey Nash Corporation, Register.com,
and The Fresh Juice Company.
Mr. Smith is an experienced shareholder representative and seasoned board executive having served on 11
public company boards.
He has served on three Nominating and Corporate Governance Committees (one as Chair), five Compensation
Committees, two Strategic Planning Committees, one Finance Committee, one Audit Committee, and one
Management Committee.
(cont’d)
We believe our nominees can lead Darden to future success
8/11/2019 Starboard Value Transforming Darden
http://slidepdf.com/reader/full/starboard-value-transforming-darden 75/294
75
Alan N. Stillman
Mr. Stillman is a legendary restaurant visionary who created the T.G.I. Friday’s and Smith & Wollensky
concepts.
He served as Chairman of The Smith & Wollensky Restaurant Group, which develops and operates high-end,
high-volume restaurants in major cities across the United States.
Mr. Stillman is the founder and Chairman of Fourth Wall Restaurant Group, which owns Maloney & Porcelli,
Quality Meats, Quality Italian, and the flagship Smith & Wollensky restaurant.
Charles (Chuck) M. Sonsteby
As CFO of Brinker International from 2001 to 2010, Mr . Sonsteby helped to develop Brinker’s historic casual
dining turnaround plan, including operational improvements expanding margins by more than 300 basis points,divesting non-core brands, implementing a substantial domestic and international franchising program, and
divesting company-owned real estate.
Currently he serves as CFO and Chief Administration Officer at Michaels, the largest arts and crafts specialty
retailer in North America.
Named one of "America's Best CFO's" by Institutional Investor magazine.
Mr. Sonsteby previously served on the board of Zale Corporation as the Audit Committee Chair and a member
of the Compensation Committee.
(cont’d)
8/11/2019 Starboard Value Transforming Darden
http://slidepdf.com/reader/full/starboard-value-transforming-darden 76/294
76
IV. Brinker’s value creation story provides aroadmap for Darden
Darden can be turned around, Brinker did it
Brinker’s value creation story provides a roadmap
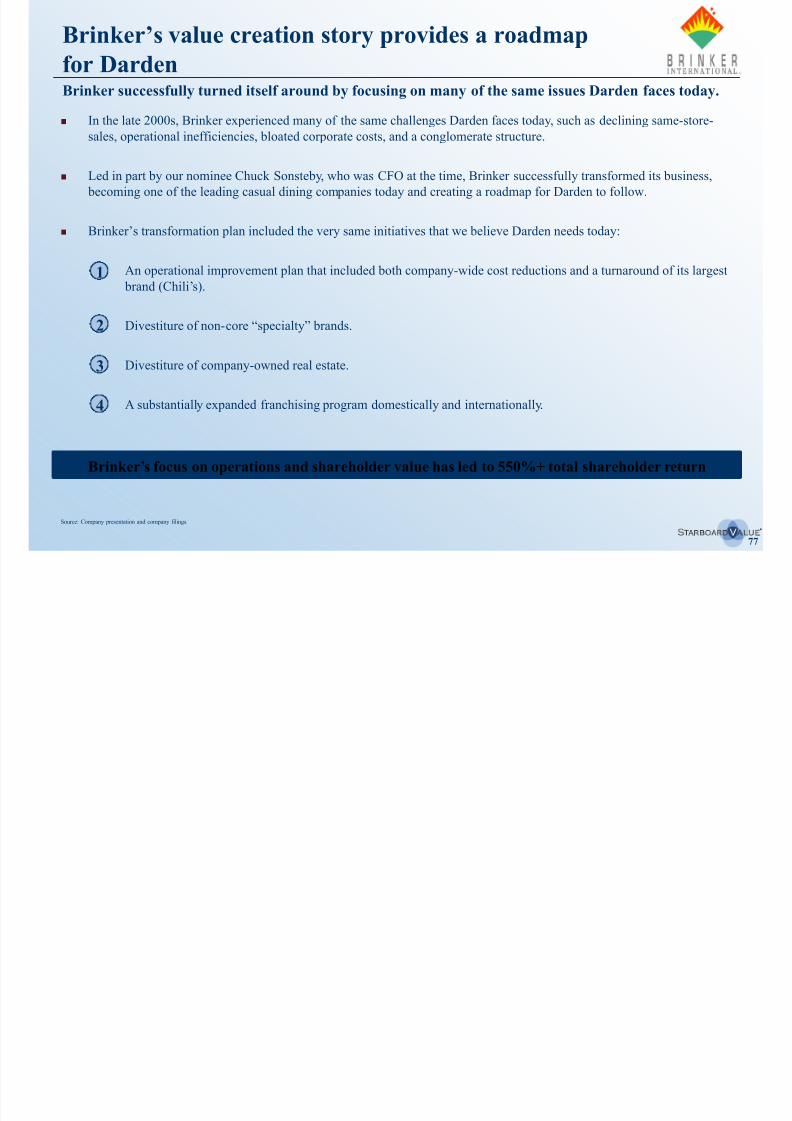
8/11/2019 Starboard Value Transforming Darden
http://slidepdf.com/reader/full/starboard-value-transforming-darden 77/294
77
for DardenBrinker successfully turned itself around by focusing on many of the same issues Darden faces today.
Source: Company presentation and company filings.
In the late 2000s, Brinker experienced many of the same challenges Darden faces today, such as declining same-store-
sales, operational inefficiencies, bloated corporate costs, and a conglomerate structure.
Led in part by our nominee Chuck Sonsteby, who was CFO at the time, Brinker successfully transformed its business,
becoming one of the leading casual dining companies today and creating a roadmap for Darden to follow.
Brinker’s transformation plan included the very same initiatives that we believe Darden needs today:
1. An operational improvement plan that included both company-wide cost reductions and a turnaround of its largest brand (Chili’s).
2. Divestiture of non-core “specialty” brands.
3. Divestiture of company-owned real estate.
4. A substantially expanded franchising program domestically and internationally.
1
2
3
4
Brinker’s focus on operations and shareholder value has led to 550%+ total shareholder return
Our nominee, Chuck Sonsteby, was an instrumental part of the

8/11/2019 Starboard Value Transforming Darden
http://slidepdf.com/reader/full/starboard-value-transforming-darden 78/294
78
Brinker turnaround effort
Mr. Sonsteby helped to lead Brinker, as its CFO, to initiate an extremely successful operational
turnaround plan after leading a refranchising and brand divestiture effort.
During his tenure at Brinker, the Company unlocked shareholder value, improved its operations, and
adopted a focused capital investment strategy.
Charles (Chuck) M. Sonsteby
As CFO of Brinker International from 2001 to 2010, Mr. Sonsteby helped to develop Brinker’s historic
casual dining turnaround plan, including operational improvements expanding margins by more than
300 basis points, divesting non-core brands, implementing a substantial domestic and international
franchising program, and divesting company-owned real estate.
Currently he serves as CFO and Chief Administration Officer at Michaels, the largest arts and crafts
specialty retailer in North America.
Named one of "America's Best CFO's" by Institutional Investor magazine.
Mr. Sonsteby previously served on the board of Zale Corporation as the Audit Committee Chair and a
member of the Compensation Committee.
Brinker’s situation was very similar to Darden – we see an even larger opportunity at Darden
Brinker’s value creation story provides a roadmap
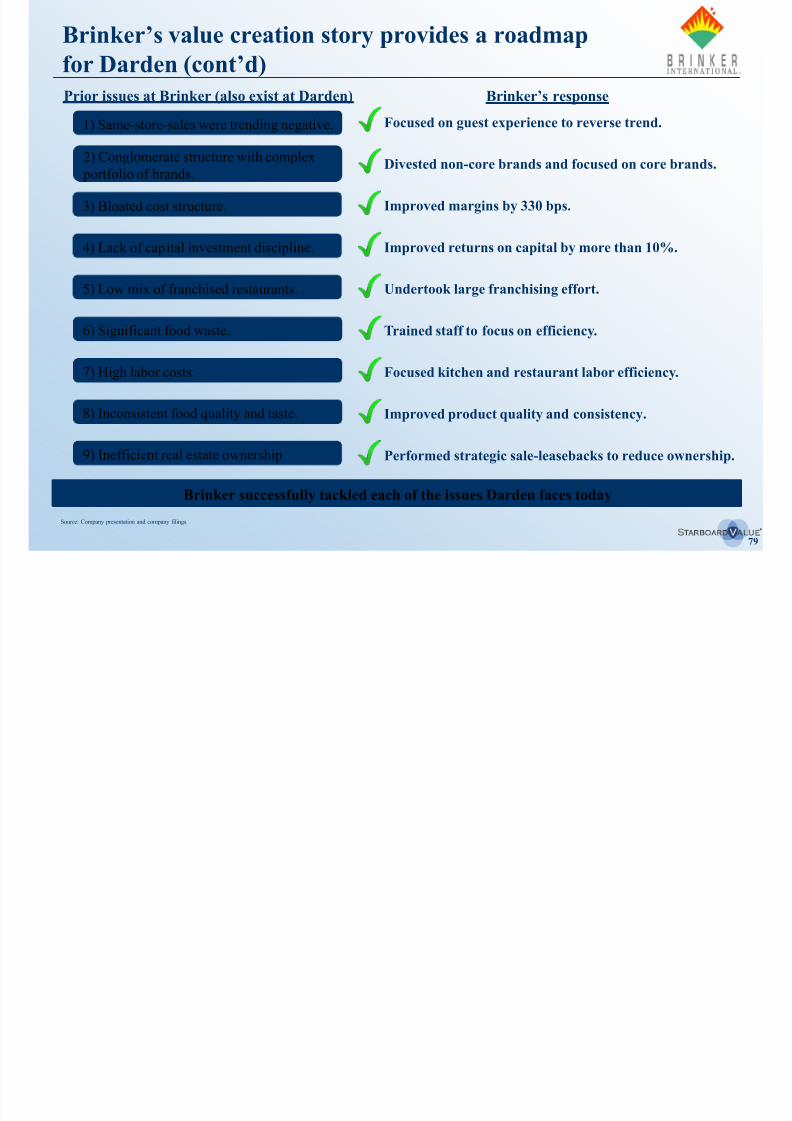
8/11/2019 Starboard Value Transforming Darden
http://slidepdf.com/reader/full/starboard-value-transforming-darden 79/294
79
for Darden (cont’d)
Source: Company presentation and company filings.
Focused on guest experience to reverse trend.
Divested non-core brands and focused on core brands.
Improved margins by 330 bps.
Improved returns on capital by more than 10%.
Undertook large franchising effort.
Trained staff to focus on efficiency.
Focused kitchen and restaurant labor efficiency.
Improved product quality and consistency.
Performed strategic sale-leasebacks to reduce ownership.
1) Same-store-sales were trending negative.
2) Conglomerate structure with complex
portfolio of brands.
3) Bloated cost structure.
4) Lack of capital investment discipline.
5) Low mix of franchised restaurants.
6) Significant food waste.
7) High labor costs.
8) Inconsistent food quality and taste.
Prior issues at Brinker (also exist at Darden) Brinker’s response
9) Inefficient real estate ownership
Brinker successfully tackled each of the issues Darden faces today
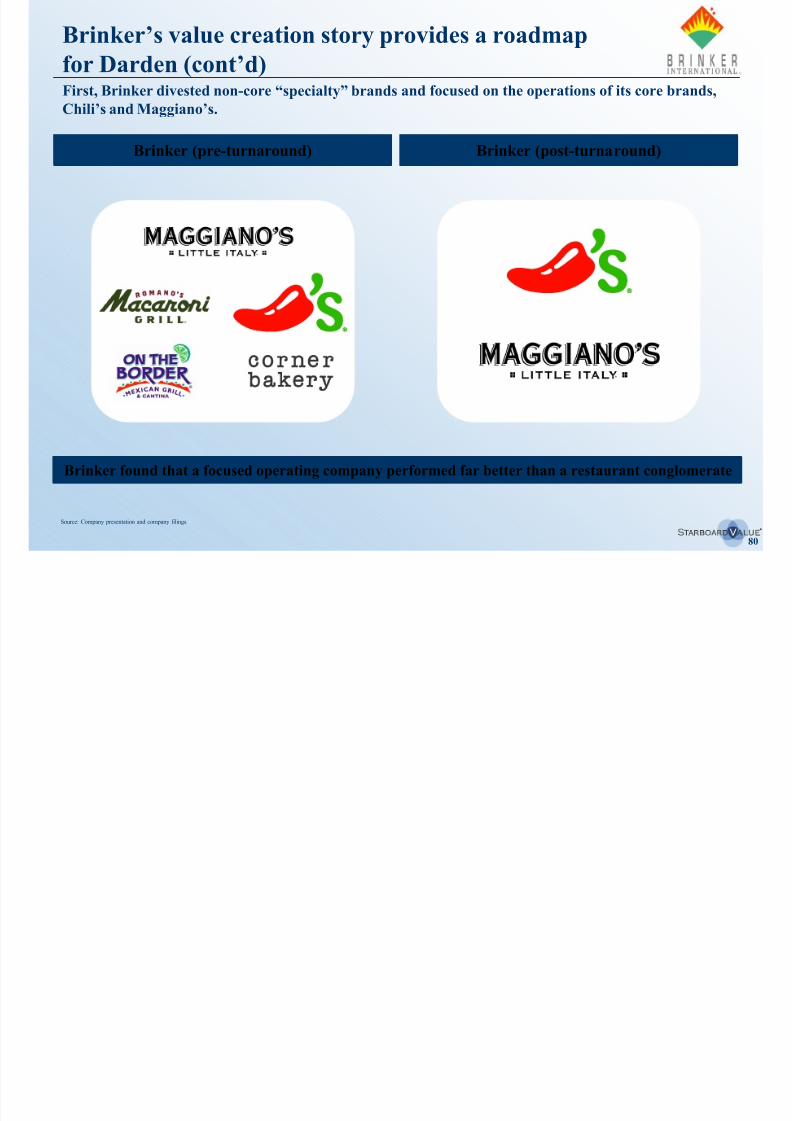
8/11/2019 Starboard Value Transforming Darden
http://slidepdf.com/reader/full/starboard-value-transforming-darden 80/294
Brinker’s stock price has dramatically outperformed Darden’s
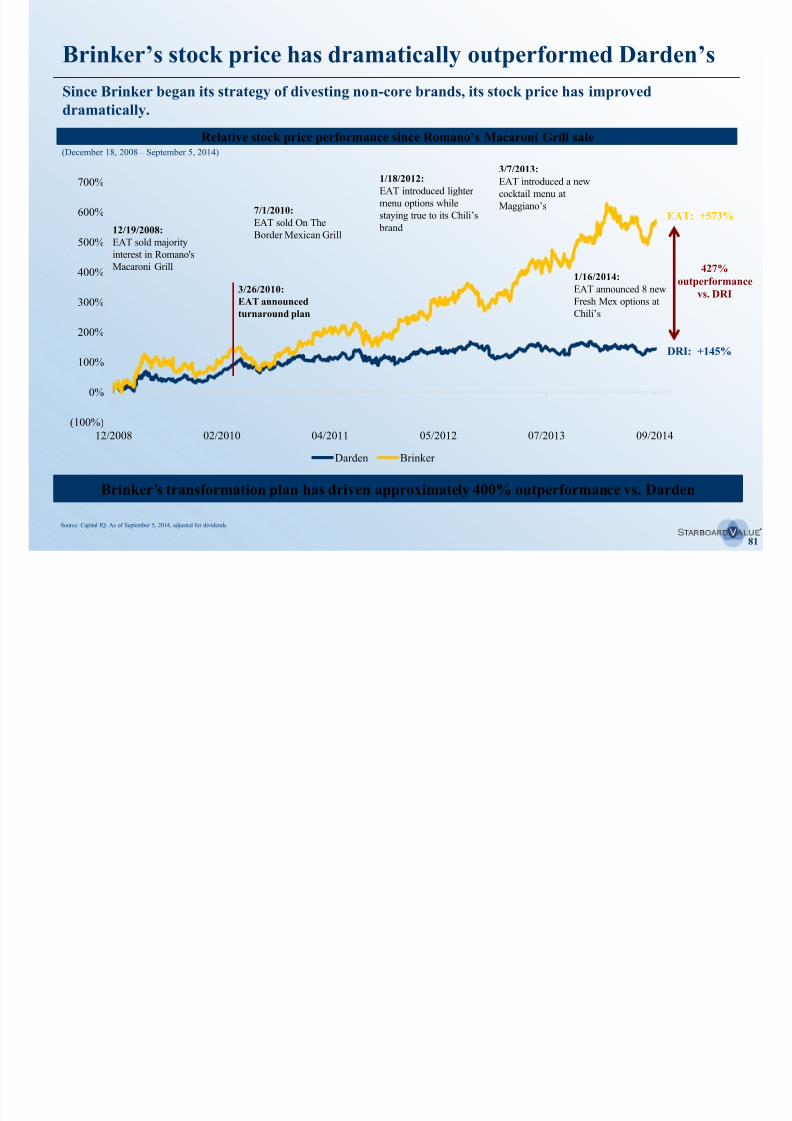
8/11/2019 Starboard Value Transforming Darden
http://slidepdf.com/reader/full/starboard-value-transforming-darden 81/294
81
(100%)
0%
100%
200%
300%
400%
500%
600%
700%
12/2008 02/2010 04/2011 05/2012 07/2013 09/2014
Darden Brinker
Brinker s stock price has dramatically outperformed Darden s
Source: Capital IQ. As of September 5, 2014, adjusted for dividends.
(December 18, 2008 – September 5, 2014)
EAT: +573%
DRI: +145%
Relative stock price performance since Romano’s Macaroni Grill sale
12/19/2008:
EAT sold majority
interest in Romano's
Macaroni Grill
1/18/2012:
EAT introduced lighter
menu options while
staying true to its Chili’s
brand
7/1/2010:
EAT sold On The
Border Mexican Grill
3/7/2013:
EAT introduced a new
cocktail menu at
Maggiano’s
1/16/2014:
EAT announced 8 new
Fresh Mex options at
Chili’s
Since Brinker began its strategy of divesting non-core brands, its stock price has improved
dramatically.
427%outperformance
vs. DRI3/26/2010:
EAT announced
turnaround plan
Brinker’s transformation plan has driven approximately 400% outperformance vs. Darden
Generating returns for shareholders through focused
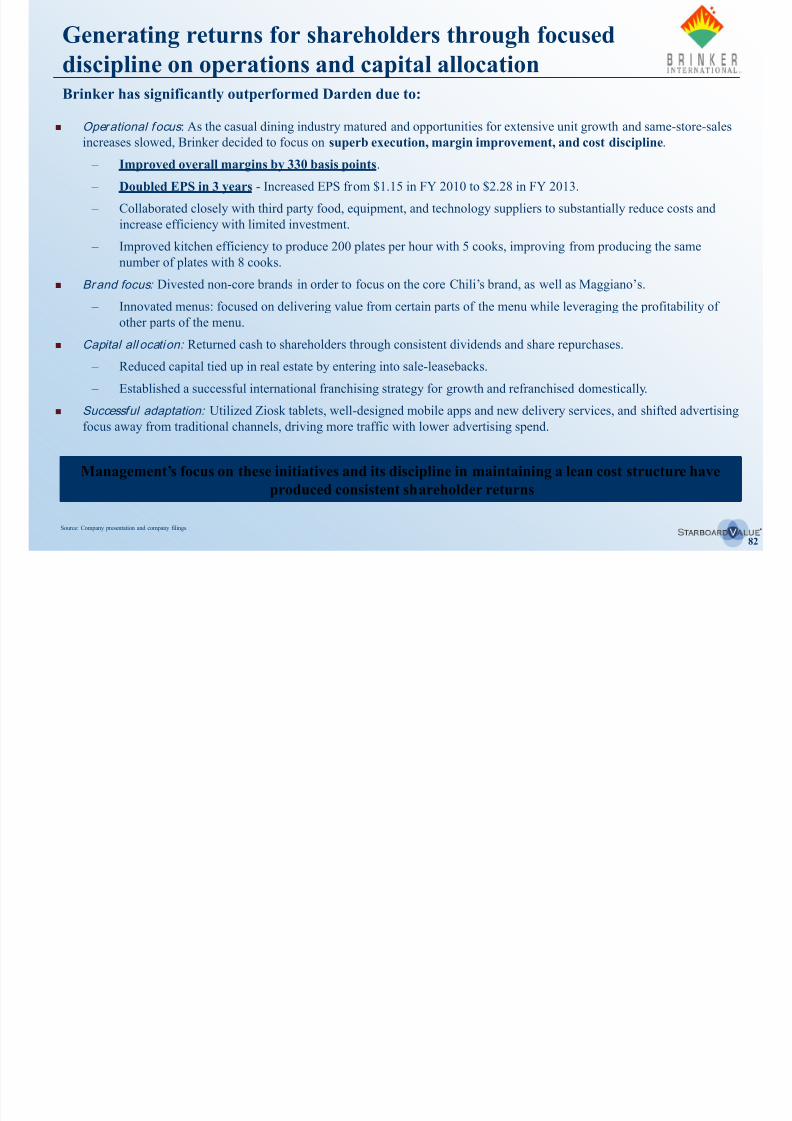
8/11/2019 Starboard Value Transforming Darden
http://slidepdf.com/reader/full/starboard-value-transforming-darden 82/294
82
Operational focus : As the casual dining industry matured and opportunities for extensive unit growth and same-store-sales
increases slowed, Brinker decided to focus on superb execution, margin improvement, and cost discipline.
– Improved overall margins by 330 basis points.
– Doubled EPS in 3 years - Increased EPS from $1.15 in FY 2010 to $2.28 in FY 2013.
– Collaborated closely with third party food, equipment, and technology suppliers to substantially reduce costs and
increase efficiency with limited investment.
– Improved kitchen efficiency to produce 200 plates per hour with 5 cooks, improving from producing the same
number of plates with 8 cooks.
Brand focus: Divested non-core brands in order to focus on the core Chili’s brand, as well as Maggiano’s.
– Innovated menus: focused on delivering value from certain parts of the menu while leveraging the profitability of
other parts of the menu.
Capital all ocation: Returned cash to shareholders through consistent dividends and share repurchases.
– Reduced capital tied up in real estate by entering into sale-leasebacks.
– Established a successful international franchising strategy for growth and refranchised domestically.
Successful adaptation: Utilized Ziosk tablets, well-designed mobile apps and new delivery services, and shifted advertising
focus away from traditional channels, driving more traffic with lower advertising spend.
Brinker has significantly outperformed Darden due to:
Source: Company presentation and company filings.
Management’s focus on these initiatives and its discipline in maintaining a lean cost structure haveproduced consistent shareholder returns
discipline on operations and capital allocation
Operational focus drove results
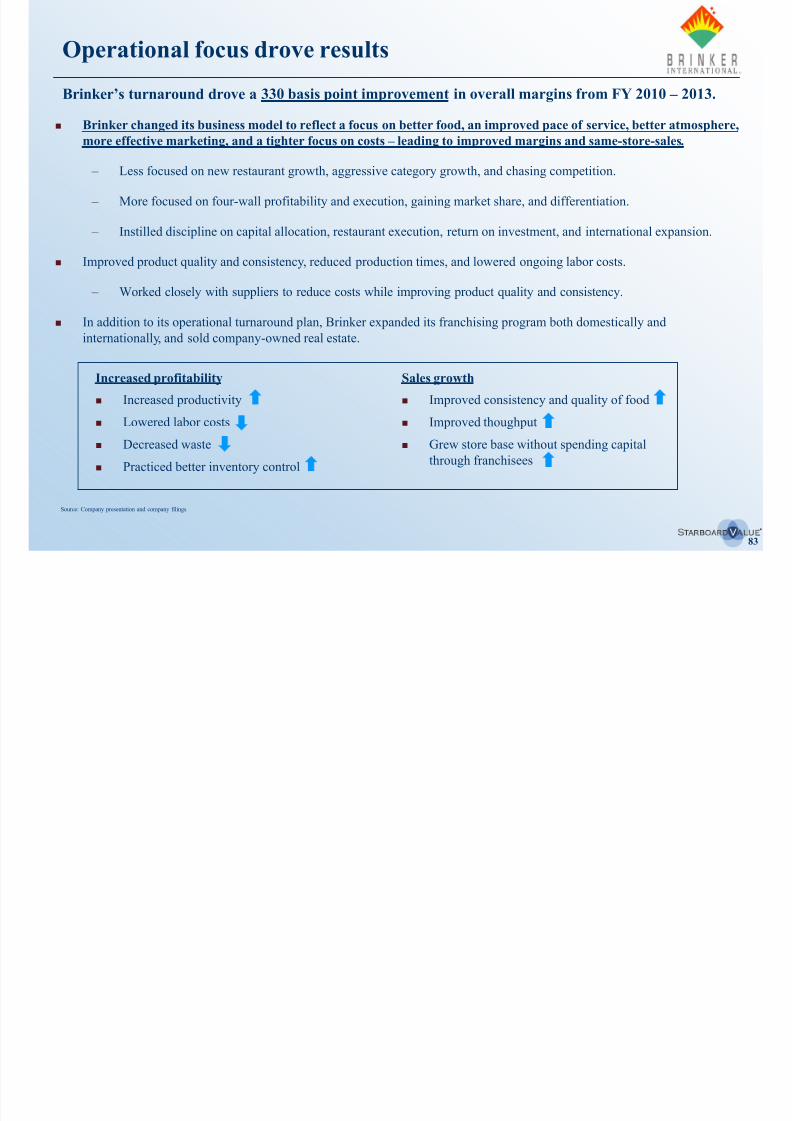
8/11/2019 Starboard Value Transforming Darden
http://slidepdf.com/reader/full/starboard-value-transforming-darden 83/294
83
Brinker changed its business model to reflect a focus on better food, an improved pace of service, better atmosphere,
more effective marketing, and a tighter focus on costs – leading to improved margins and same-store-sales.
– Less focused on new restaurant growth, aggressive category growth, and chasing competition.
– More focused on four-wall profitability and execution, gaining market share, and differentiation.
– Instilled discipline on capital allocation, restaurant execution, return on investment, and international expansion.
Improved product quality and consistency, reduced production times, and lowered ongoing labor costs.
– Worked closely with suppliers to reduce costs while improving product quality and consistency.
In addition to its operational turnaround plan, Brinker expanded its franchising program both domestically and
internationally, and sold company-owned real estate.
Brinker’s turnaround drove a 330 basis point improvement in overall margins from FY 2010 – 2013.
Source: Company presentation and company filings.
Increased productivity
Lowered labor costs
Decreased waste
Practiced better inventory control
Improved consistency and quality of food
Improved thoughput
Grew store base without spending capital
through franchisees
Increased profitability Sales growth
Operational focus drove results
Brinker turnaround: Focused strategy and execution to
i i d t l
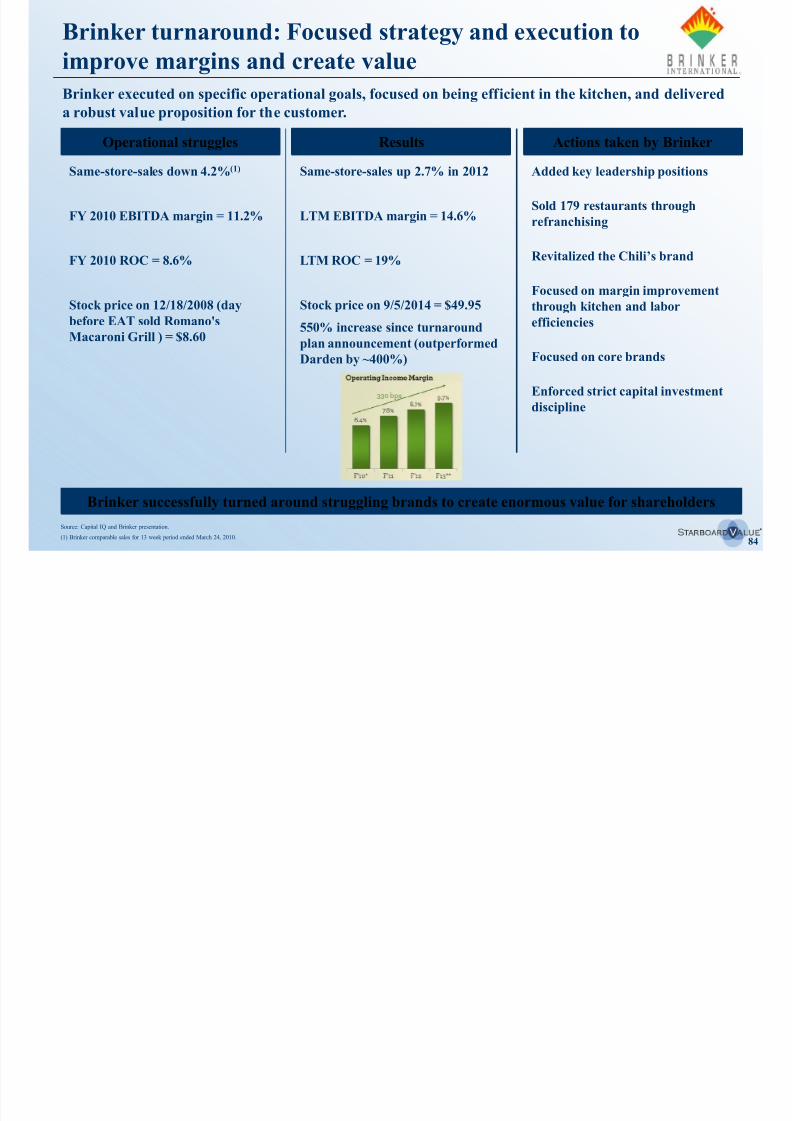
8/11/2019 Starboard Value Transforming Darden
http://slidepdf.com/reader/full/starboard-value-transforming-darden 84/294
84
Added key leadership positions
Sold 179 restaurants through
refranchising
Revitalized the Chili’s brand
Focused on margin improvement
through kitchen and labor
efficiencies
Focused on core brands
Enforced strict capital investment
discipline
improve margins and create value
Brinker executed on specific operational goals, focused on being efficient in the kitchen, and delivered
a robust value proposition for the customer.
Source: Capital IQ and Brinker presentation.(1) Brinker comparable sales for 13 week period ended March 24, 2010.
Operational struggles Actions taken by BrinkerResults
Same-store-sales down 4.2%(1)
FY 2010 EBITDA margin = 11.2%
FY 2010 ROC = 8.6%
Stock price on 12/18/2008 (day
before EAT sold Romano's
Macaroni Grill ) = $8.60
Brinker successfully turned around struggling brands to create enormous value for shareholders
Same-store-sales up 2.7% in 2012
LTM EBITDA margin = 14.6%
LTM ROC = 19%
Stock price on 9/5/2014 = $49.95
550% increase since turnaround
plan announcement (outperformed
Darden by ~400%)
The current situation at Darden resembles Brinker prior to its
t d
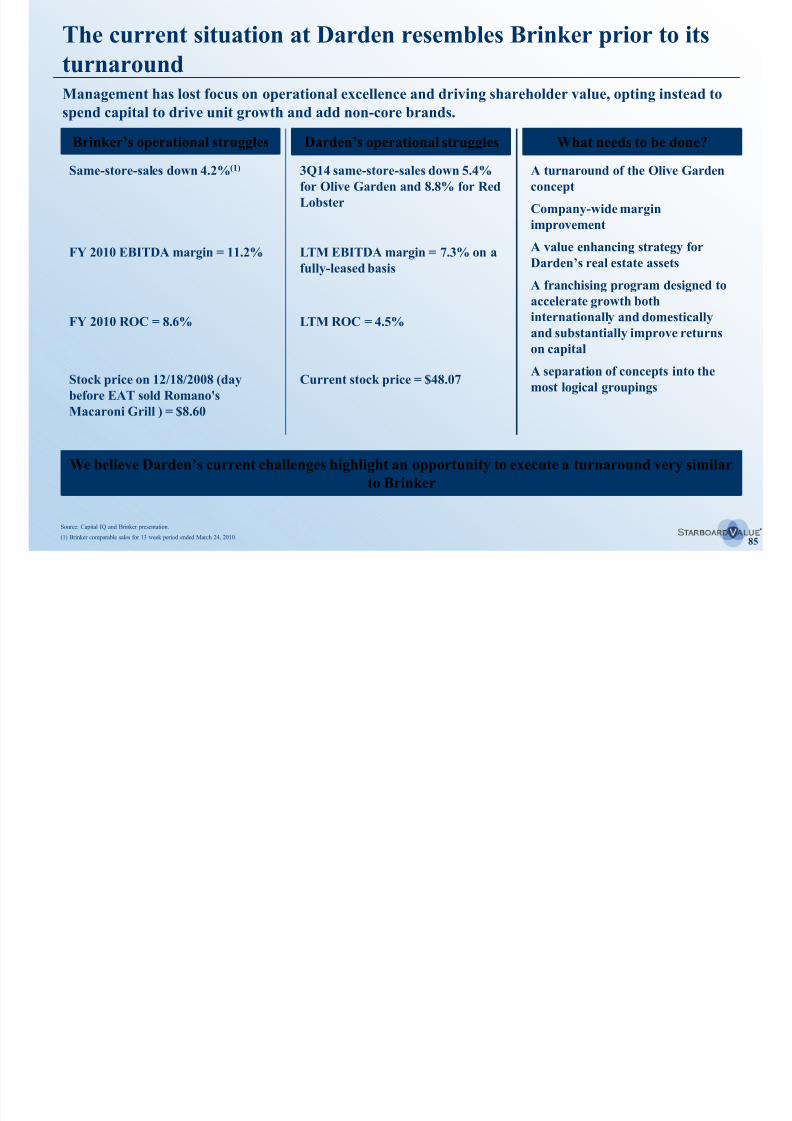
8/11/2019 Starboard Value Transforming Darden
http://slidepdf.com/reader/full/starboard-value-transforming-darden 85/294
85
turnaroundManagement has lost focus on operational excellence and driving shareholder value, opting instead to
spend capital to drive unit growth and add non-core brands.
Brinker’s operational struggles Darden’s operational struggles What needs to be done?
Same-store-sales down 4.2%(1)
We believe Darden’s current challenges highlight an opportunity to execute a turnaround very similarto Brinker
A turnaround of the Olive Garden
concept
Company-wide margin
improvement
A value enhancing strategy for
Darden’s real estate assets
A franchising program designed to
accelerate growth both
internationally and domestically
and substantially improve returns
on capital
A separation of concepts into the
most logical groupings
3Q14 same-store-sales down 5.4%
for Olive Garden and 8.8% for Red
Lobster
FY 2010 EBITDA margin = 11.2%
Stock price on 12/18/2008 (day
before EAT sold Romano'sMacaroni Grill ) = $8.60
FY 2010 ROC = 8.6%
LTM EBITDA margin = 7.3% on a
fully-leased basis
LTM ROC = 4.5%
Current stock price = $48.07
Source: Capital IQ and Brinker presentation.(1) Brinker comparable sales for 13 week period ended March 24, 2010.
Brinker’s value creation story provides a roadmapf D d
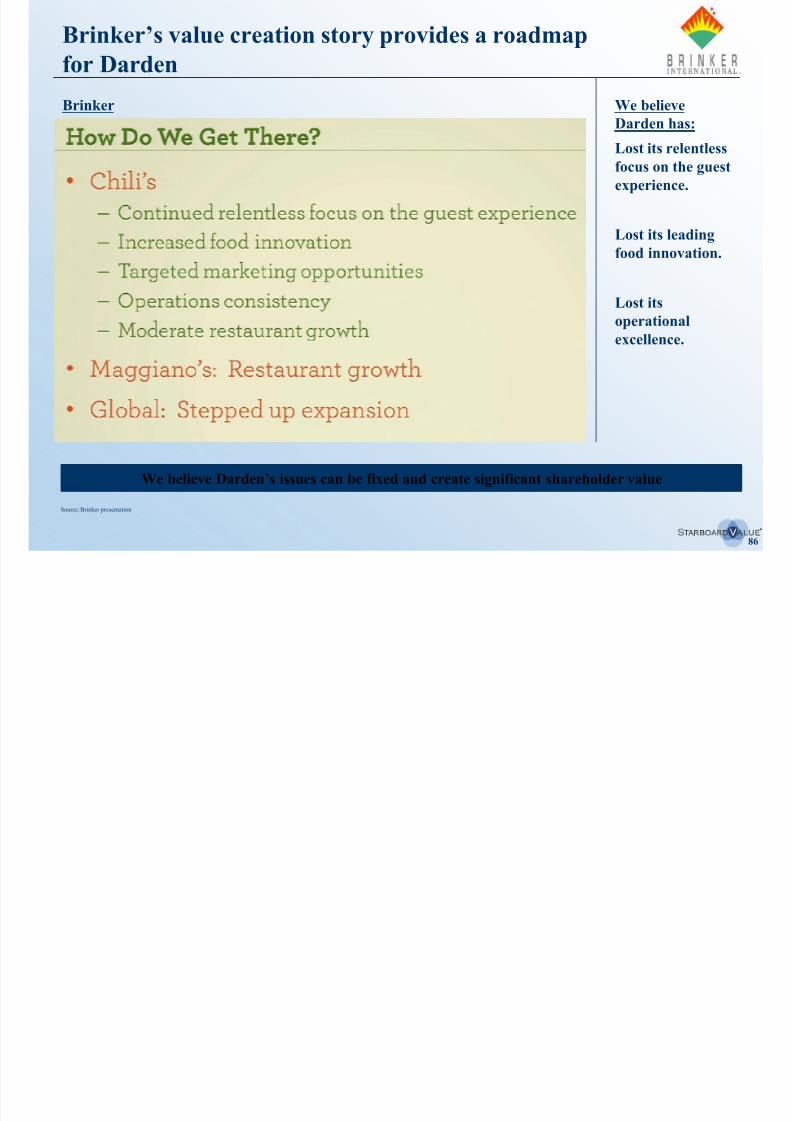
8/11/2019 Starboard Value Transforming Darden
http://slidepdf.com/reader/full/starboard-value-transforming-darden 86/294
86
for Darden
Brinker
Source: Brinker presentation.
We believe Darden’s issues can be fixed and create significant shareholder value
We believe
Darden has:
Lost its relentless
focus on the guest
experience.
Lost its leading
food innovation.
Lost its
operational
excellence.
Improved returns on capital
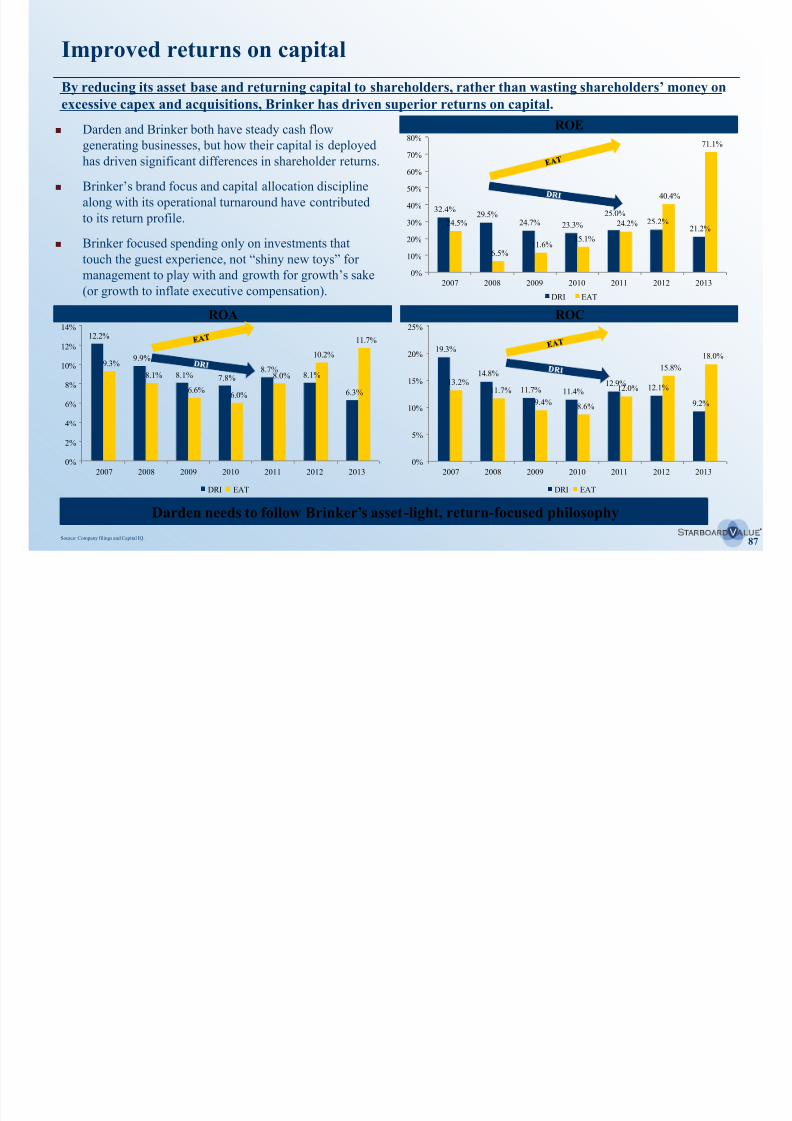
8/11/2019 Starboard Value Transforming Darden
http://slidepdf.com/reader/full/starboard-value-transforming-darden 87/294
87
p p
ROE
ROA ROC
By reducing its asset base and returning capital to shareholders, rather than wasting shareholders’ money onexcessive capex and acquisitions, Brinker has driven superior returns on capital.
Source: Company filings and Capital IQ.
32.4%29.5%
24.7% 23.3%
25.0%25.2%
21.2%24.5%
6.5%11.6%
15.1%
24.2%
40.4%
71.1%
0%
10%
20%
30%
40%
50%
60%
70%80%
2007 2008 2009 2010 2011 2012 2013
DRI EAT
12.2%
9.9%
8.1% 7.8%8.7%
8.1%
6.3%
9.3%
8.1%
6.6%6.0%
8.0%
10.2%
11.7%
0%
2%
4%
6%
8%
10%
12%
14%
2007 2008 2009 2010 2011 2012 2013
DRI EAT
19.3%
14.8%
11.7% 11.4%12.9%
12.1%
9.2%
13.2%11.7%
9.4% 8.6%
12.0%
15.8%
18.0%
0%
5%
10%
15%
20%
25%
2007 2008 2009 2010 2011 2012 2013
DRI EAT
Darden and Brinker both have steady cash flow
generating businesses, but how their capital is deployedhas driven significant differences in shareholder returns.
Brinker’s brand focus and capital allocation discipline
along with its operational turnaround have contributed
to its return profile.
Brinker focused spending only on investments that
touch the guest experience, not “shiny new toys” for
management to play with and growth for growth’s sake(or growth to inflate executive compensation).
Darden needs to follow Brinker’s asset-light, return-focused philosophy
Operational performance: Darden vs. Brinker
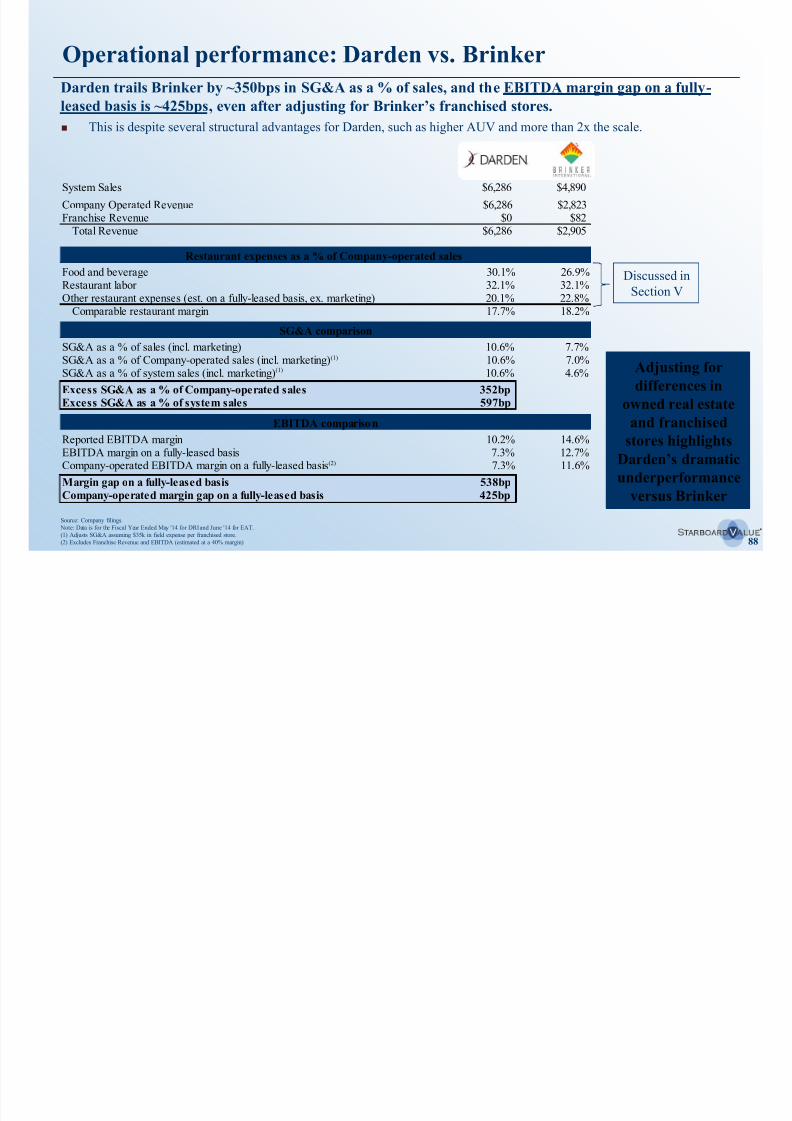
8/11/2019 Starboard Value Transforming Darden
http://slidepdf.com/reader/full/starboard-value-transforming-darden 88/294
88
Operational performance: Darden vs. Brinker
Source: Company filings.
Note: Data is for the Fiscal Year Ended May '14 for DRI and June '14 for EAT.(1) Adjusts SG&A assuming $35k in field expense per franchised store.
(2) Excludes Franchise Revenue and EBITDA (estimated at a 40% margin).
Darden trails Brinker by ~350bps in SG&A as a % of sales, and the EBITDA margin gap on a fully-
leased basis is ~425bps, even after adjusting for Brinker’s franchised stores. This is despite several structural advantages for Darden, such as higher AUV and more than 2x the scale.
Discussed inSection V
Adjusting for
differences in
owned real estateand franchised
stores highlights
Darden’s dramaticunderperformance
versus Brinker
System Sales $6,286 $4,890
Company Operated Revenue $6,286 $2,823Franchise Revenue $0 $82
Total Revenue $6,286 $2,905
Restaurant expenses as a % of Company-operated sales
Food and beverage 30.1% 26.9%Restaurant labor 32.1% 32.1%Other restaurant expenses (est. on a fully-leased basis, ex. marketing) 20.1% 22.8%
Comparable restaurant margin 17.7% 18.2%
SG&A comparison
SG&A as a % of sales (incl. marketing) 10.6% 7.7%SG&A as a % of Company-operated sales (incl. marketing) 10.6% 7.0%SG&A as a % of system sales (incl. marketing) 10.6% 4.6%
Excess SG&A as a % of Company-operated sales 352bp
Excess SG&A as a % of system sales 597bp
EBITDA comparison
Reported EBITDA margin 10.2% 14.6%EBITDA margin on a fully-leased basis 7.3% 12.7%Company-operated EBITDA margin on a fully-leased basis 7.3% 11.6%
Margin gap on a fully-leased basis 538bp
Company-operated margin gap on a fully-leased basis 425bp
(2)
(1)
(1)
8/11/2019 Starboard Value Transforming Darden
http://slidepdf.com/reader/full/starboard-value-transforming-darden 89/294
89
V. Company-wide margin improvement
opportunity
Darden’s unacceptable performance provides an opportunityf b t ti l i t
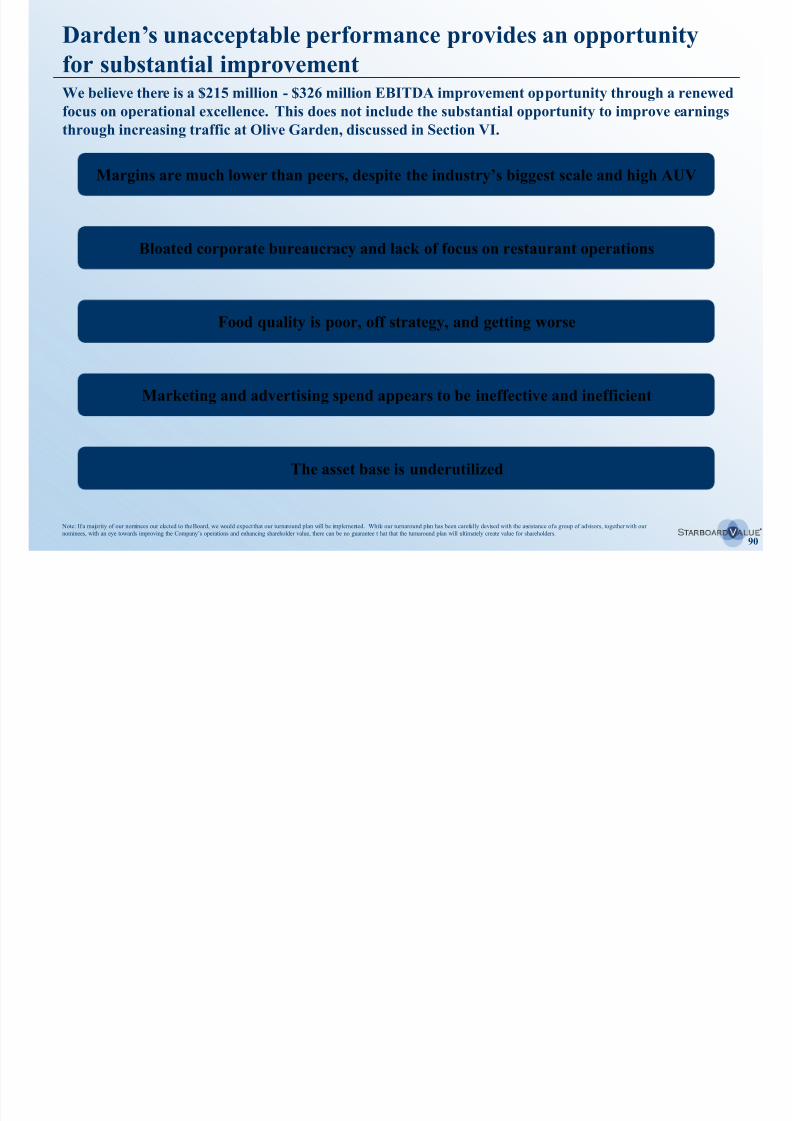
8/11/2019 Starboard Value Transforming Darden
http://slidepdf.com/reader/full/starboard-value-transforming-darden 90/294
90
for substantial improvementWe believe there is a $215 million - $326 million EBITDA improvement opportunity through a renewed
focus on operational excellence. This does not include the substantial opportunity to improve earnings
through increasing traffic at Olive Garden, discussed in Section VI.
Margins are much lower than peers, despite the industry’s biggest scale and high AUV
Bloated corporate bureaucracy and lack of focus on restaurant operations
Food quality is poor, off strategy, and getting worse
Marketing and advertising spend appears to be ineffective and inefficient
The asset base is underutilized
Note: If a majority of our nominees our elected to the Board, we would expect that our turnaround plan will be implemented. While our turnaround plan has been carefully devised with the assistance of a group of advisors, together with our
nominees, with an eye towards improving the Company’s operations and enhancing shareholder value, there can be no guarantee t hat that the turnaround plan will ultimately create value for shareholders.
EBITDA improvement potential totaling $215 - $326 million
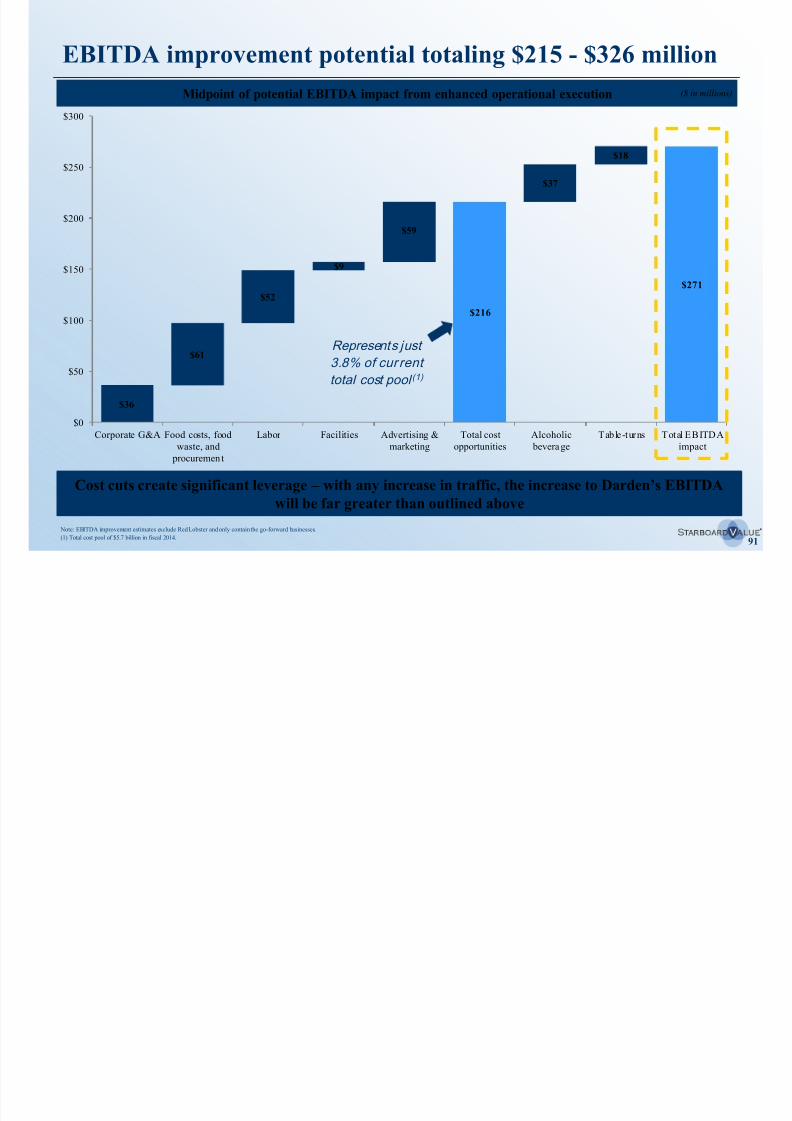
8/11/2019 Starboard Value Transforming Darden
http://slidepdf.com/reader/full/starboard-value-transforming-darden 91/294
91
$36
$216
$271
$61
$52
$9
$59
$37
$18
$0
$50
$100
$150
$200
$250
$300
Corporate G&A Food costs, food
waste, and
procuremen t
Labor Facilities Advertising &
marketing
Total cost
opportunities
Alcoholic
beverage
Table-turns Total EBITDA
impact
EBITDA improvement potential totaling $215 $326 million
Cost cuts create significant leverage – with any increase in traffic, the increase to Darden’s EBITDAwill be far greater than outlined above
(1) Total cost pool of $5.7 billion in fiscal 2014.
Midpoint of potential EBITDA impact from enhanced operational execution ($ in millions)
Represents just
3.8% of cur rent
total cost pool (1)
Note: EBITDA improvement estimates exclude Red Lobster and only contain the go-forward businesses.
EBITDA improvement potential totaling $215 - $326 million
(cont’d)
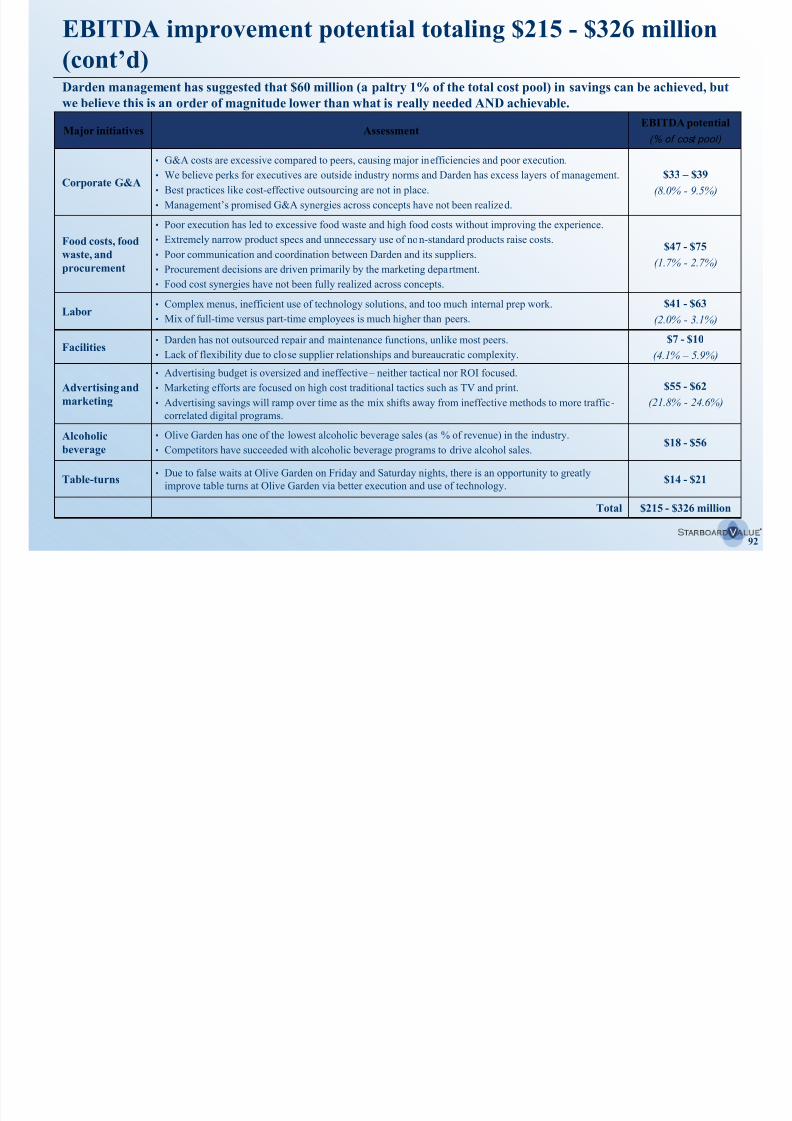
8/11/2019 Starboard Value Transforming Darden
http://slidepdf.com/reader/full/starboard-value-transforming-darden 92/294
92
(cont d)
Major initiatives AssessmentEBITDA potential
(% of cost pool)
Corporate G&A
• G&A costs are excessive compared to peers, causing major inefficiencies and poor execution.
• We believe perks for executives are outside industry norms and Darden has excess layers of management.
• Best practices like cost-effective outsourcing are not in place.
• Management’s promised G&A synergies across concepts have not been realized.
$33 – $39
(8.0% - 9.5%)
Food costs, food
waste, and
procurement
• Poor execution has led to excessive food waste and high food costs without improving the experience.
• Extremely narrow product specs and unnecessary use of non-standard products raise costs.
• Poor communication and coordination between Darden and its suppliers.
•
Procurement decisions are driven primarily by the marketing department.• Food cost synergies have not been fully realized across concepts.
$47 - $75
(1.7% - 2.7%)
Labor• Complex menus, inefficient use of technology solutions, and too much internal prep work.
• Mix of full-time versus part-time employees is much higher than peers.
$41 - $63
(2.0% - 3.1%)
Facilities• Darden has not outsourced repair and maintenance functions, unlike most peers.
• Lack of flexibility due to close supplier relationships and bureaucratic complexity.
$7 - $10
(4.1% – 5.9%)
Advertising and
marketing
• Advertising budget is oversized and ineffective – neither tactical nor ROI focused.
• Marketing efforts are focused on high cost traditional tactics such as TV and print.
• Advertising savings will ramp over time as the mix shifts away from ineffective methods to more traffic-correlated digital programs.
$55 - $62
(21.8% - 24.6%)
Alcoholic
beverage
• Olive Garden has one of the lowest alcoholic beverage sales (as % of revenue) in the industry.
• Competitors have succeeded with alcoholic beverage programs to drive alcohol sales.$18 - $56
Table-turns• Due to false waits at Olive Garden on Friday and Saturday nights, there is an opportunity to greatly
improve table turns at Olive Garden via better execution and use of technology.$14 - $21
Total $215 - $326 million
Darden management has suggested that $60 million (a paltry 1% of the total cost pool) in savings can be achieved, but
we believe this is an order of magnitude lower than what is really needed AND achievable.

8/11/2019 Starboard Value Transforming Darden
http://slidepdf.com/reader/full/starboard-value-transforming-darden 93/294
93
V. Company-wide margin improvement
opportunityA. Corporate G&A
Despite a significantly larger revenue base than peers, Darden’sSG&A as a % of sales is far worse
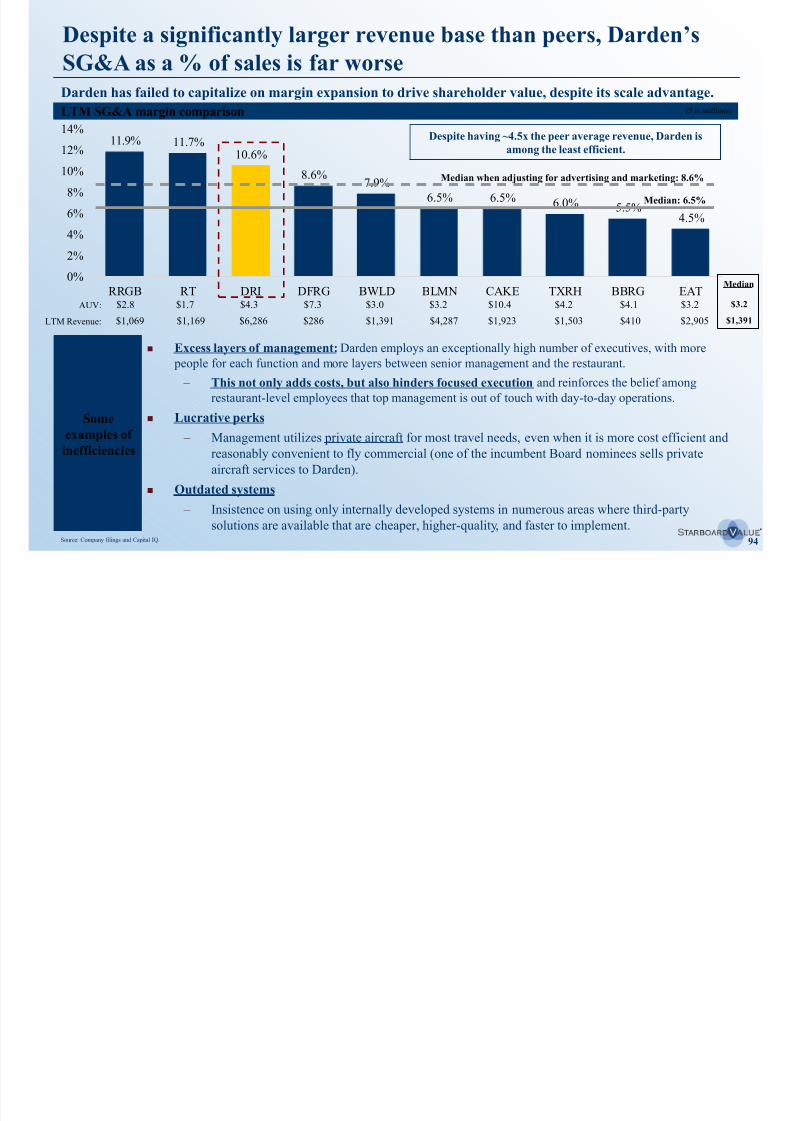
8/11/2019 Starboard Value Transforming Darden
http://slidepdf.com/reader/full/starboard-value-transforming-darden 94/294
94
11.9% 11.7%10.6%
8.6%7.9%
6.5% 6.5% 6.0% 5.5%4.5%
0%
2%
4%
6%
8%
10%
12%
14%
RRGB RT DRI DFRG BWLD BLMN CAKE TXRH BBRG EAT
Median: 6.5%
Darden has failed to capitalize on margin expansion to drive shareholder value, despite its scale advantage.
SG&A as a % of sales is far worse
LTM SG&A margin comparison
Source: Company filings and Capital IQ.
Excess layers of management: Darden employs an exceptionally high number of executives, with more
people for each function and more layers between senior management and the restaurant.
– This not only adds costs, but also hinders focused execution and reinforces the belief among
restaurant-level employees that top management is out of touch with day-to-day operations. Lucrative perks
– Management utilizes private aircraft for most travel needs, even when it is more cost efficient and
reasonably convenient to fly commercial (one of the incumbent Board nominees sells private
aircraft services to Darden).
Outdated systems
– Insistence on using only internally developed systems in numerous areas where third-party
solutions are available that are cheaper, higher-quality, and faster to implement.
Some
examples of
inefficiencies
$2.8 $1.7 $4.3 $7.3 $3.0 $10.4 $4.1$4.2 $3.2AUV:
$1,069 $1,169 $6,286 $286 $1,391 $1,923 $410$1,503 $2,905LTM Revenue:
($ in millions)
Despite having ~4.5x the peer average revenue, Darden is
among the least efficient.
$3.2
$1,391
Median
$3.2
$4,287
Median when adjusting for advertising and marketing: 8.6%
We believe G&A policies need to be reconsidered
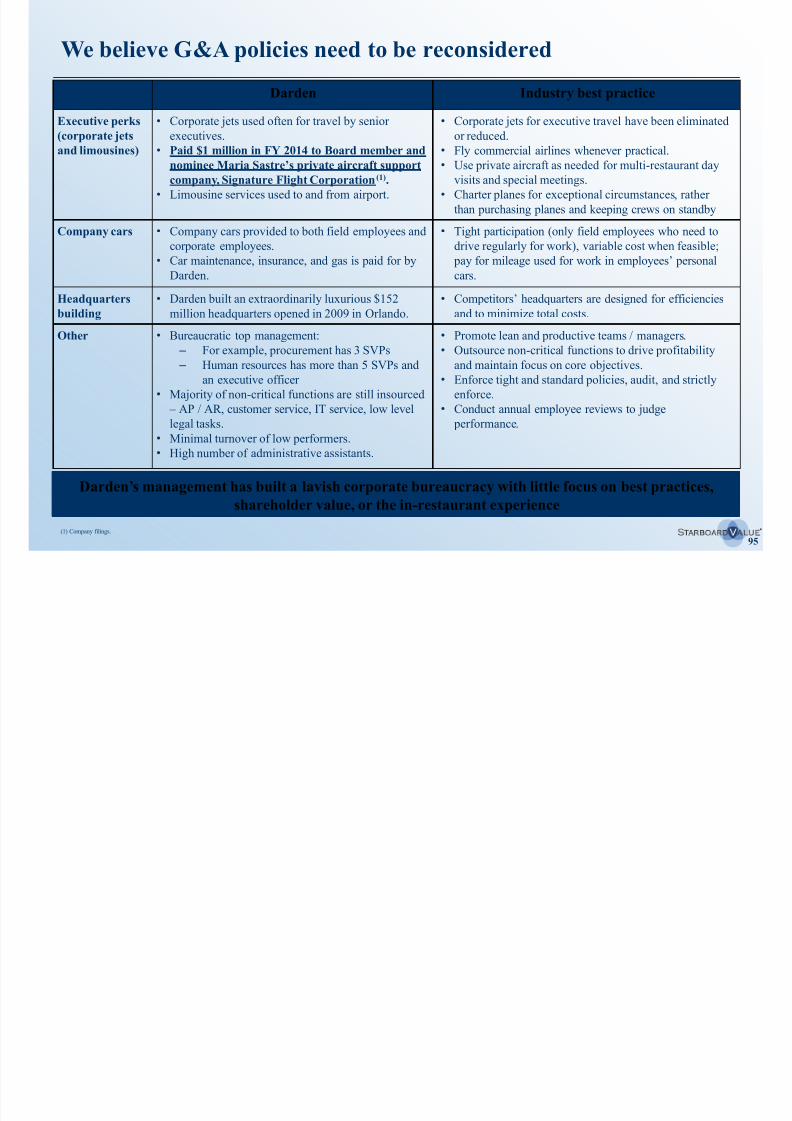
8/11/2019 Starboard Value Transforming Darden
http://slidepdf.com/reader/full/starboard-value-transforming-darden 95/294
95
Darden Industry best practice
Executive perks
(corporate jets
and limousines)
• Corporate jets used often for travel by senior
executives.
• Paid $1 million in FY 2014 to Board member and
nominee Maria Sastre’s private aircraft supportcompany, Signature Flight Corporation(1).
• Limousine services used to and from airport.
• Corporate jets for executive travel have been eliminated
or reduced.
• Fly commercial airlines whenever practical.
• Use private aircraft as needed for multi-restaurant day
visits and special meetings.
• Charter planes for exceptional circumstances, rather
than purchasing planes and keeping crews on standby
Company cars • Company cars provided to both field employees and
corporate employees.
• Car maintenance, insurance, and gas is paid for by
Darden.
• Tight participation (only field employees who need to
drive regularly for work), variable cost when feasible;
pay for mileage used for work in employees’ personal
cars.
Headquarters
building
• Darden built an extraordinarily luxurious $152
million headquarters opened in 2009 in Orlando.
• Competitors’ headquarters are designed for efficiencies
and to minimize total costs.
Other • Bureaucratic top management:
– For example, procurement has 3 SVPs
– Human resources has more than 5 SVPs and
an executive officer
• Majority of non-critical functions are still insourced
– AP / AR, customer service, IT service, low level
legal tasks.
• Minimal turnover of low performers.
• High number of administrative assistants.
• Promote lean and productive teams / managers.
• Outsource non-critical functions to drive profitability
and maintain focus on core objectives.
• Enforce tight and standard policies, audit, and strictly
enforce.
• Conduct annual employee reviews to judge
performance.
Darden’s management has built a lavish corporate bureaucracy with little focus on best practices,shareholder value, or the in-restaurant experience
(1) Company filings.
Opportunities exist to reduce costs across a number of functions
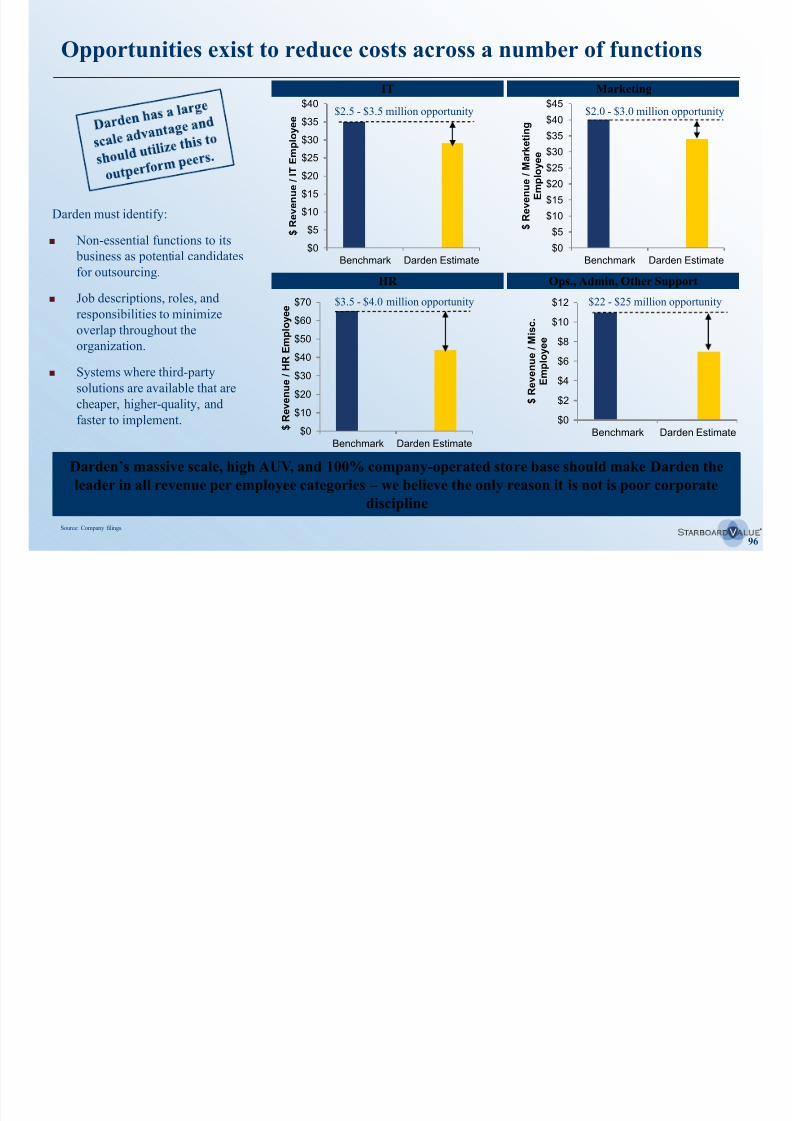
8/11/2019 Starboard Value Transforming Darden
http://slidepdf.com/reader/full/starboard-value-transforming-darden 96/294
96
Darden must identify:
Non-essential functions to its
business as potential candidates
for outsourcing.
Job descriptions, roles, and
responsibilities to minimize
overlap throughout the
organization.
Systems where third-party
solutions are available that are
cheaper, higher-quality, andfaster to implement.
$0
$5
$10
$15
$20
$25$30
$35
$40
Benchmark Darden Estimate
$ R e v e n u e / I T E m p l o y e e
IT
$2.5 - $3.5 million opportunity
$0
$10
$20
$30
$40
$50
$60
$70
Benchmark Darden Estimate
$ R e v e
n u e / H R E m p l o y e e
HR
$3.5 - $4.0 million opportunity
$0
$5
$10
$15
$20
$25
$30
$35
$40
$45
Benchmark Darden Estimate
$ R e v e n u e / M a r k e
t i n g
E m p l o y e e
Marketing
$2.0 - $3.0 million opportunity
$0
$2
$4
$6
$8
$10
$12
Benchmark Darden Estimate
$
R e v e n u e / M i s c .
E m p l o y e e
Ops., Admin, Other Support
$22 - $25 million opportunity
Source: Company filings.
Darden’s massive scale, high AUV, and 100% company-operated store base should make Darden the
leader in all revenue per employee categories – we believe the only reason it is not is poor corporate
discipline
Corporate offices are much more costly than peers
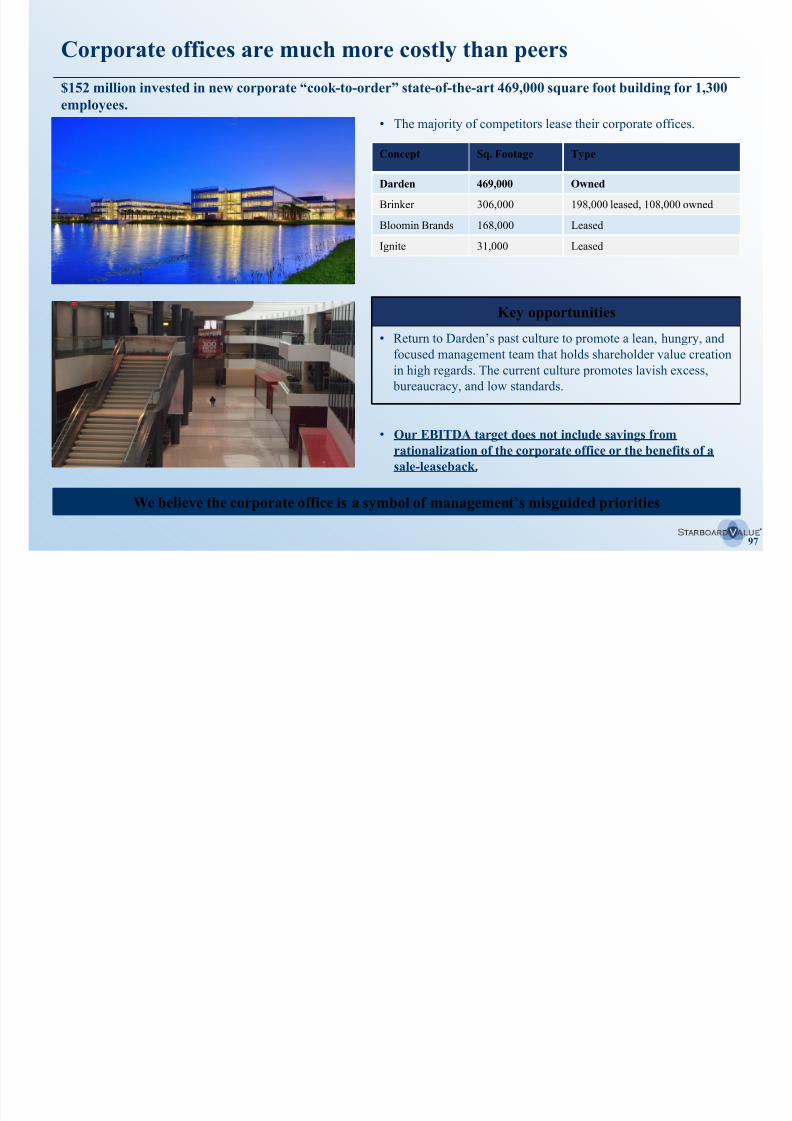
8/11/2019 Starboard Value Transforming Darden
http://slidepdf.com/reader/full/starboard-value-transforming-darden 97/294
97
• The majority of competitors lease their corporate offices.
Key opportunities
• Return to Darden’s past culture to promote a lean, hungry, and
focused management team that holds shareholder value creation
in high regards. The current culture promotes lavish excess,
bureaucracy, and low standards.
Concept Sq. Footage Type
Darden 469,000 Owned
Brinker 306,000 198,000 leased, 108,000 owned
Bloomin Brands 168,000 Leased
Ignite 31,000 Leased
We believe the corporate office is a symbol of management’s misguided priorities
$152 million invested in new corporate “cook -to-order” state-of-the-art 469,000 square foot building for 1,300
employees.
• Our EBITDA target does not include savings from
rationalization of the corporate office or the benefits of a
sale-leaseback.
Operations oversight costs are high and increasing…
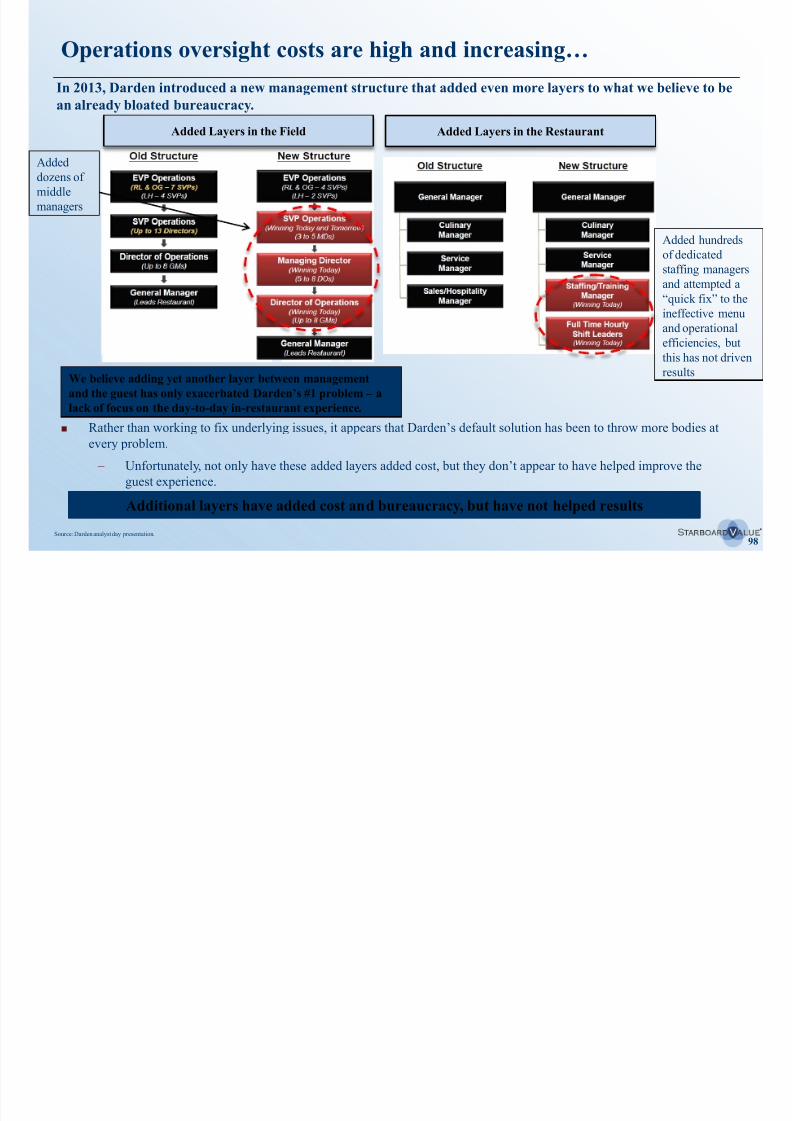
8/11/2019 Starboard Value Transforming Darden
http://slidepdf.com/reader/full/starboard-value-transforming-darden 98/294
98
Rather than working to fix underlying issues, it appears that Darden’s default solution has been to throw more bodies at
every problem.
– Unfortunately, not only have these added layers added cost, but they don’t appear to have helped improve the
guest experience.
In 2013, Darden introduced a new management structure that added even more layers to what we believe to be
an already bloated bureaucracy.
Source: Darden analyst day presentation.
Additional layers have added cost and bureaucracy, but have not helped results
Added Layers in the Field Added Layers in the Restaurant
Added hundreds
of dedicated
staffing managersand attempted a
“quick fix” to the
ineffective menu
and operational
efficiencies, but
this has not driven
resultsWe believe adding yet another layer between management
and the guest has only exacerbated Darden’s #1 problem – alack of focus on the day-to-day in-restaurant experience.
Added
dozens of
middle
managers
…and corporate bureaucracy appears to be out of control
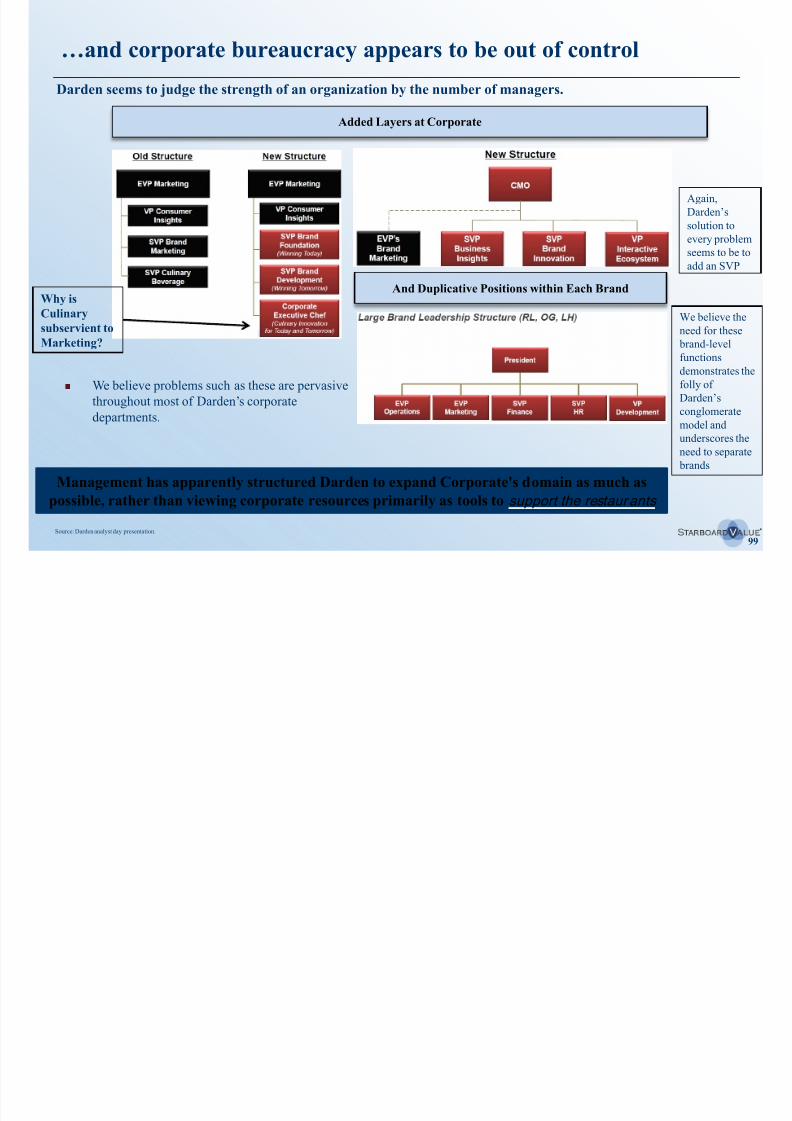
8/11/2019 Starboard Value Transforming Darden
http://slidepdf.com/reader/full/starboard-value-transforming-darden 99/294
99
Darden seems to judge the strength of an organization by the number of managers.
Management has apparently structured Darden to expand Corporate's domain as much as
possible, rather than viewing corporate resources primarily as tools to support the restaurants
Added Layers at Corporate
And Duplicative Positions within Each Brand
Source: Darden analyst day presentation.
We believe the
need for these
brand-level
functions
demonstrates the
folly of
Darden’sconglomerate
model and
underscores the
need to separate
brands
Again,
Darden’s
solution to
every problem
seems to be to
add an SVP
Why is
Culinary
subservient to
Marketing?
We believe problems such as these are pervasive
throughout most of Darden’s corporatedepartments.
Implementing the G&A opportunity
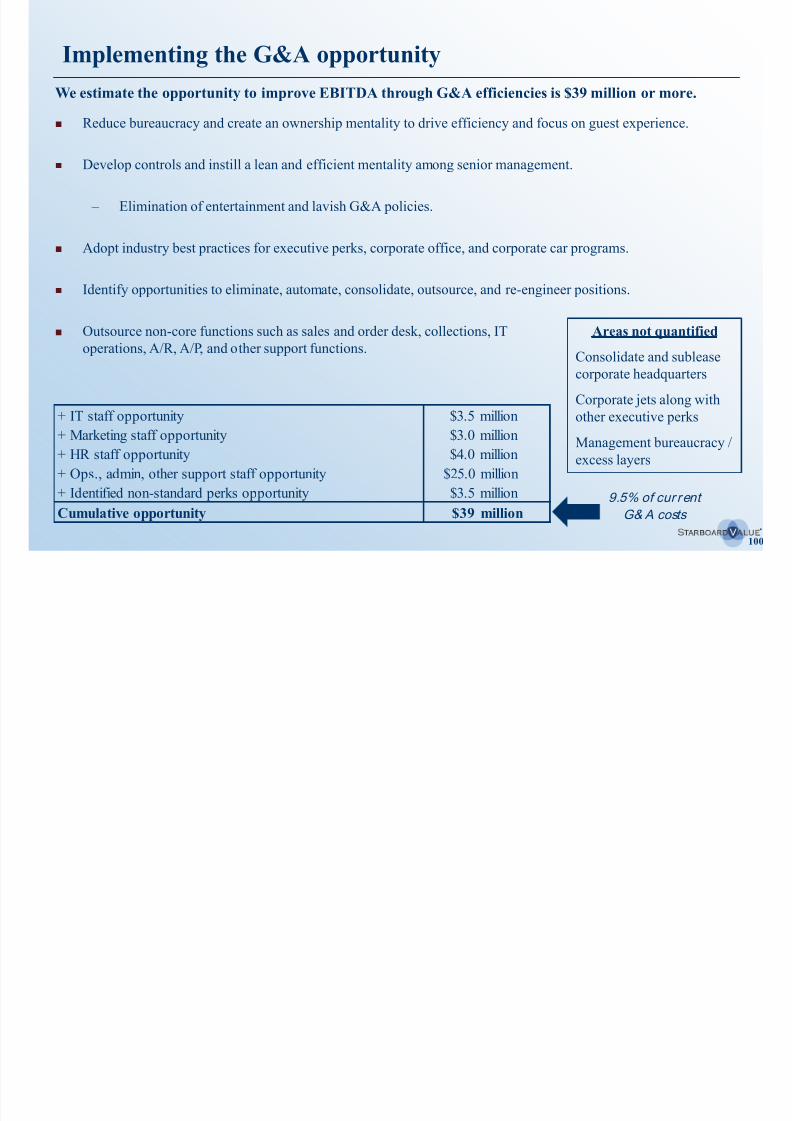
8/11/2019 Starboard Value Transforming Darden
http://slidepdf.com/reader/full/starboard-value-transforming-darden 100/294
100
Reduce bureaucracy and create an ownership mentality to drive efficiency and focus on guest experience.
Develop controls and instill a lean and efficient mentality among senior management.
– Elimination of entertainment and lavish G&A policies.
Adopt industry best practices for executive perks, corporate office, and corporate car programs.
Identify opportunities to eliminate, automate, consolidate, outsource, and re-engineer positions.
Outsource non-core functions such as sales and order desk, collections, IT
operations, A/R, A/P, and other support functions.
We estimate the opportunity to improve EBITDA through G&A efficiencies is $39 million or more.
Areas not quantified
Consolidate and sublease
corporate headquarters
Corporate jets along withother executive perks
Management bureaucracy /
excess layers
9.5% of cur rent
G& A costs
+ IT staff opportunity $3.5 million
+ Marketing staff opportunity $3.0 million
+ HR staff opportunity $4.0 million
+ Ops., admin, other support staff opportunity $25.0 million
+ Identified non-standard perks opportunity $3.5 million
Cumulative opportunity $39 million
8/11/2019 Starboard Value Transforming Darden
http://slidepdf.com/reader/full/starboard-value-transforming-darden 101/294
101
V. Company-wide margin improvement
opportunityB. Food costs, food waste, and procurement
Despite its scale advantage, Darden’s food costs and waste areabnormally high
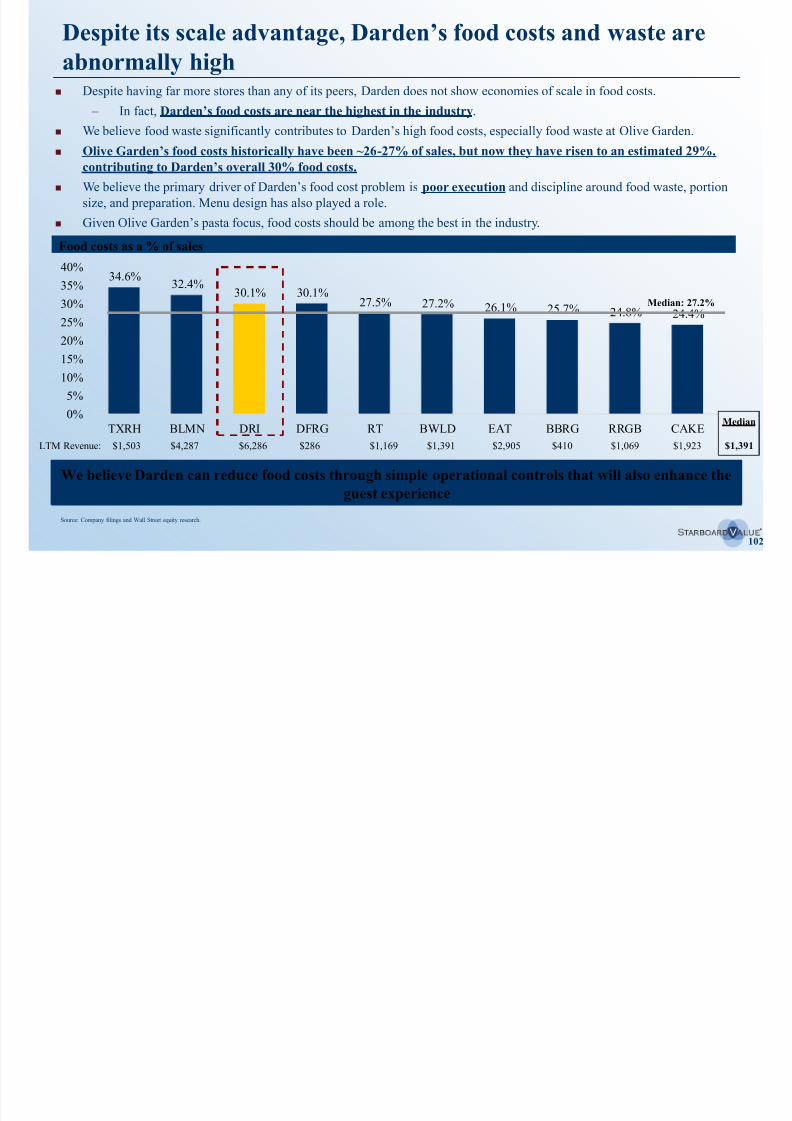
8/11/2019 Starboard Value Transforming Darden
http://slidepdf.com/reader/full/starboard-value-transforming-darden 102/294
102
34.6% 32.4%30.1% 30.1%
27.5% 27.2% 26.1% 25.7% 24.8% 24.4%
0%
5%
10%
15%
20%
25%
30%
35%
40%
TXRH BLMN DRI DFRG RT BWLD EAT BBRG RRGB CAKE
abnormally high Despite having far more stores than any of its peers, Darden does not show economies of scale in food costs.
– In fact, Darden’s food costs are near the highest in the industry.
We believe food waste significantly contributes to Darden’s high food costs, especially food waste at Olive Garden.
Olive Garden’s food costs historically have been ~26-27% of sales, but now they have risen to an estimated 29%,
contributing to Darden’s overall 30% food costs.
We believe the primary driver of Darden’s food cost problem is poor execution and discipline around food waste, portion
size, and preparation. Menu design has also played a role.
Given Olive Garden’s pasta focus, food costs should be among the best in the industry.
Food costs as a % of sales
Source: Company filings and Wall Street equity research.
Median: 27.2%
We believe Darden can reduce food costs through simple operational controls that will also enhance the
guest experience
$286 $2,905$1,169 $1,069$410$6,286$4,287$1,503 $1,391LTM Revenue: $1,391
Median
$1,923
Prices and food costs are high, but food quality appears to have
also deteriorated
8/11/2019 Starboard Value Transforming Darden
http://slidepdf.com/reader/full/starboard-value-transforming-darden 103/294
103
also deteriorated
We believe Olive Garden’s food continues to deteriorate and stray from authentic Italian.
Food margins and food quality appear to have worsened. However, we believe actual food costs have been increasing due
primarily to unfocused and undisciplined execution.
We believe neither the front of the house (service) nor the back of the house (kitchen) is running efficiently.
Similar to Brinker, we believe the kitchens can be re-engineered to bring down food and labor costs while simultaneously
improving the consistency and quality of the food.
Consumer pricing is high, COGS are high, and food quality appears to be low – the most unfortunate
perfect storm in procurement.
Darden must bring back the operational focus it once had to reduce food costs while enhancing the
customer experience
Breadsticks: just one example of food waste
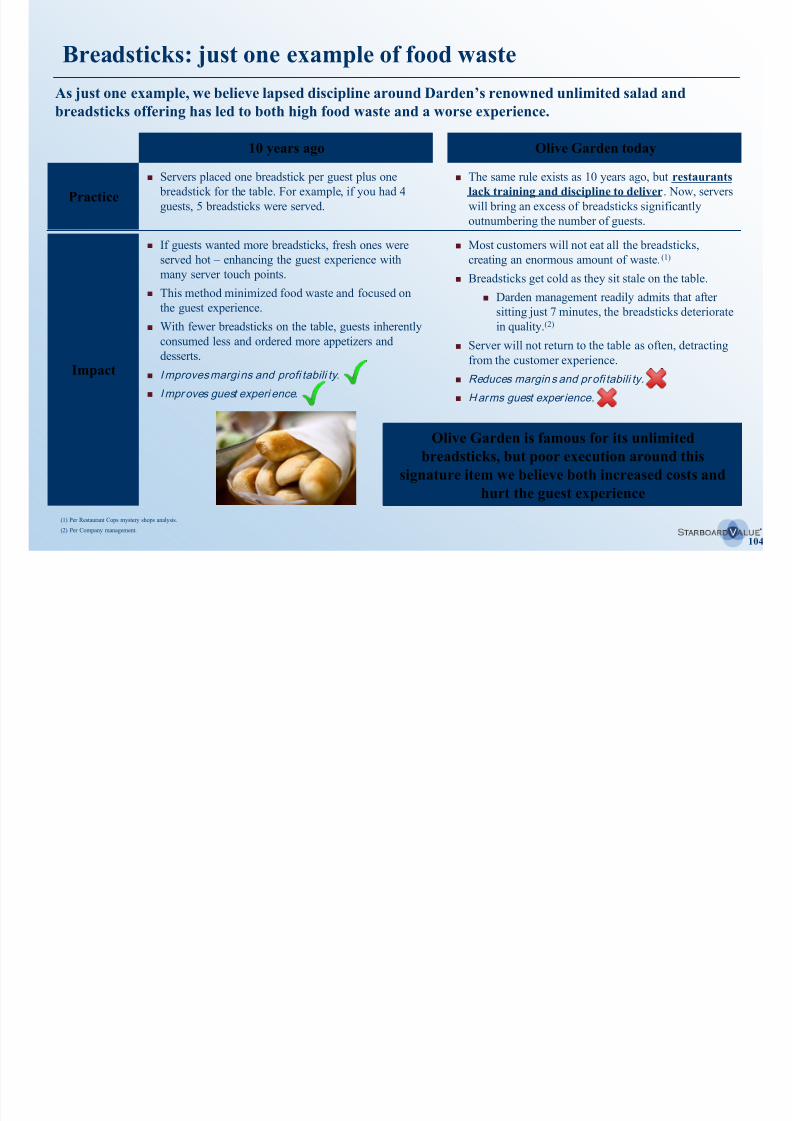
8/11/2019 Starboard Value Transforming Darden
http://slidepdf.com/reader/full/starboard-value-transforming-darden 104/294
104
As just one example, we believe lapsed discipline around Darden’s renowned unlimited salad andbreadsticks offering has led to both high food waste and a worse experience.
Practice
10 years ago Olive Garden today
Servers placed one breadstick per guest plus one
breadstick for the table. For example, if you had 4
guests, 5 breadsticks were served.
Impact
If guests wanted more breadsticks, fresh ones were
served hot – enhancing the guest experience with
many server touch points. This method minimized food waste and focused on
the guest experience.
With fewer breadsticks on the table, guests inherently
consumed less and ordered more appetizers and
desserts.
Improves margins and profi tabili ty.
Improves guest experi ence.
The same rule exists as 10 years ago, but restaurants
lack training and discipline to deliver. Now, servers
will bring an excess of breadsticks significantly
outnumbering the number of guests.
Most customers will not eat all the breadsticks,
creating an enormous amount of waste.(1)
Breadsticks get cold as they sit stale on the table.
Darden management readily admits that after
sitting just 7 minutes, the breadsticks deteriorate
in quality.(2)
Server will not return to the table as often, detracting
from the customer experience.
Reduces margins and profi tabili ty.
Harms guest exper ience.
Olive Garden is famous for its unlimited
breadsticks, but poor execution around this
signature item we believe both increased costs and
hurt the guest experience
(1) Per Restaurant Cops mystery shops analysis.
(2) Per Company management.
Breadsticks: just one example of food waste (cont’d)
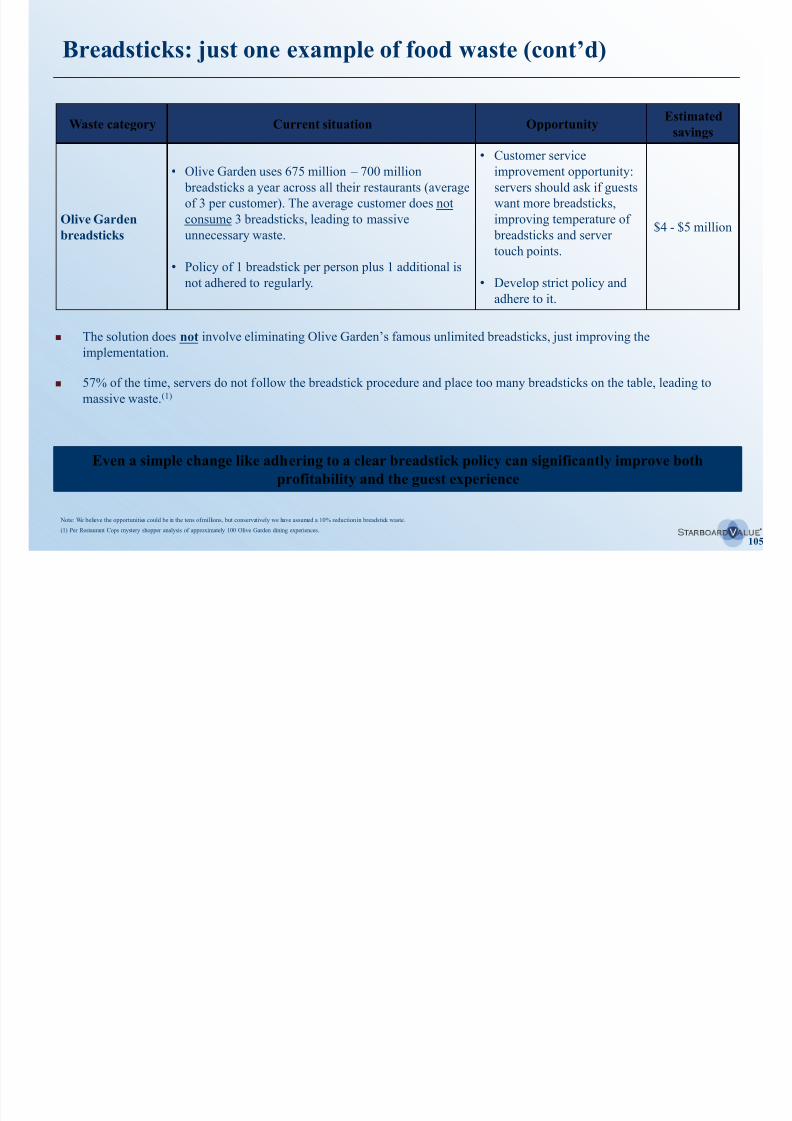
8/11/2019 Starboard Value Transforming Darden
http://slidepdf.com/reader/full/starboard-value-transforming-darden 105/294
105
Waste category Current situation OpportunityEstimated
savings
Olive Garden
breadsticks
• Olive Garden uses 675 million – 700 million
breadsticks a year across all their restaurants (average
of 3 per customer). The average customer does not
consume 3 breadsticks, leading to massive
unnecessary waste.
• Policy of 1 breadstick per person plus 1 additional is
not adhered to regularly.
• Customer service
improvement opportunity:
servers should ask if guests
want more breadsticks,
improving temperature of
breadsticks and server
touch points.
• Develop strict policy and
adhere to it.
$4 - $5 million
Even a simple change like adhering to a clear breadstick policy can significantly improve both
profitability and the guest experience
The solution does not involve eliminating Olive Garden’s famous unlimited breadsticks, just improving the
implementation.
57% of the time, servers do not follow the breadstick procedure and place too many breadsticks on the table, leading to
massive waste.(1)
Note: We believe the opportunities could be in the tens of millions, but conservatively we have assumed a 10% reduction in breadstick waste.
(1) Per Restaurant Cops mystery shopper analysis of approximately 100 Olive Garden dining experiences.
Endless salad: another contributor to food waste
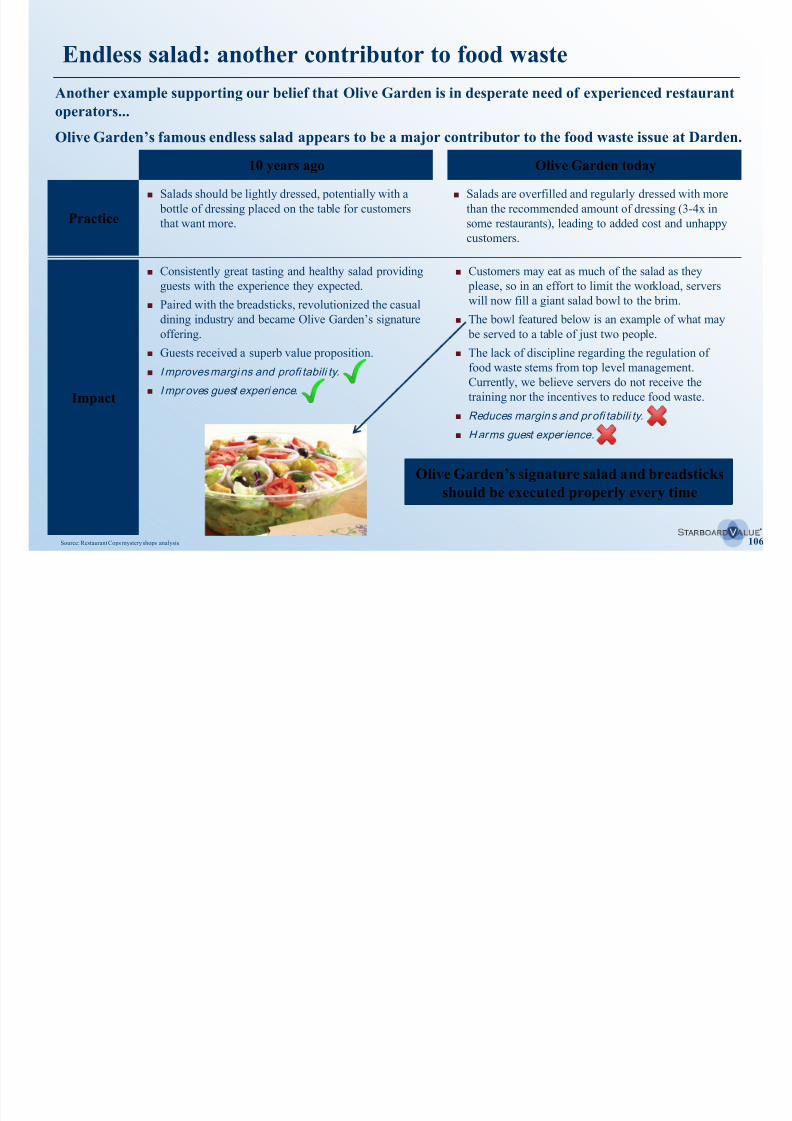
8/11/2019 Starboard Value Transforming Darden
http://slidepdf.com/reader/full/starboard-value-transforming-darden 106/294
106
Another example supporting our belief that Olive Garden is in desperate need of experienced restaurant
operators...
Olive Garden’s famous endless salad appears to be a major contributor to the food waste issue at Darden.
Practice
10 years ago Olive Garden today
Salads should be lightly dressed, potentially with a
bottle of dressing placed on the table for customers
that want more.
Impact
Consistently great tasting and healthy salad providingguests with the experience they expected.
Paired with the breadsticks, revolutionized the casual
dining industry and became Olive Garden’s signature
offering.
Guests received a superb value proposition.
Improves margins and profi tabili ty.
Improves guest experi ence.
Customers may eat as much of the salad as they please, so in an effort to limit the workload, servers
will now fill a giant salad bowl to the brim.
The bowl featured below is an example of what may
be served to a table of just two people.
The lack of discipline regarding the regulation of
food waste stems from top level management.
Currently, we believe servers do not receive the
training nor the incentives to reduce food waste.
Reduces margins and profi tabili ty.
Harms guest exper ience.
Salads are overfilled and regularly dressed with more
than the recommended amount of dressing (3-4x in
some restaurants), leading to added cost and unhappy
customers.
Olive Garden’s signature salad and breadsticksshould be executed properly every time
Source: Restaurant Cops mystery shops analysis.
We believe Darden’s lack of communication with its suppliers regardingpromotions has led to high food costs and unprofitable promotions
8/11/2019 Starboard Value Transforming Darden
http://slidepdf.com/reader/full/starboard-value-transforming-darden 107/294
107
We believe there are unnecessary barriers inside Darden that inhibit the communication between the procurement,
marketing, and culinary teams.
– This creates suboptimal menu offerings and ineffective and sometimes even unprofitable
promotions.
– At Darden, marketing typically crafts promotions without regard for the price or availability of items, and oftentells suppliers to go get it, “no matter the cost”.
– This contrasts with competitors, who work with suppliers to determine the most opportune time to run
promotions, taking into account seasonality/availability, commodity prices, and consumer demand.
Given the large number of promotions Darden uses, one would assume management is constantly
coordinating with their suppliers around the best times to promote from a cost perspective – inactuality, this does not appear to be the case.
Well performing restaurant companies work with their suppliers to deliver superior food and value to
customers
Specification (spec) rationalization is a significant opportunity for
improvement

8/11/2019 Starboard Value Transforming Darden
http://slidepdf.com/reader/full/starboard-value-transforming-darden 108/294
108
p
We believe extreme product specs coupled with the use of non-standard products across several
areas are key factors to Darden’s relative high purchasing costs.
– As just one of many examples, the industry standard for chicken specifications is +/- 0.5
ounce, but Darden requires their chicken to be +/- 0.25 ounce.
Suppliers can charge a significant premium for tighter specs, but for most
items the customer does not see or care about the difference.
– Packaging:
Non-standardized To-Go bags and microwavable to-go container is the “Cadillac”
container of the industry.
Darden’s straws are non-industry length, adding cost for a “custom run” from
suppliers.
Best practices like spec rationalization, leveraging of supplier partnerships, and use of
aggregators, especially for non-core functions (e.g., office supplies, travel, IT supplies), can
deliver potential savings opportunities.
Much of Darden’s high and increasing food cost problem appears to be due to its unnecessary non-
standard product specs requirements.
To-Go bags aremade with high-end
materials adding
25-30% cost above
competitors’ To-Go
bags
We believe using nonstandard product specs heavily contributes to Darden’s excess food costs withoutimproving the guest experience
Buying practice, tight product specs, and the use of non-standard
products are believed to drive higher overall costs
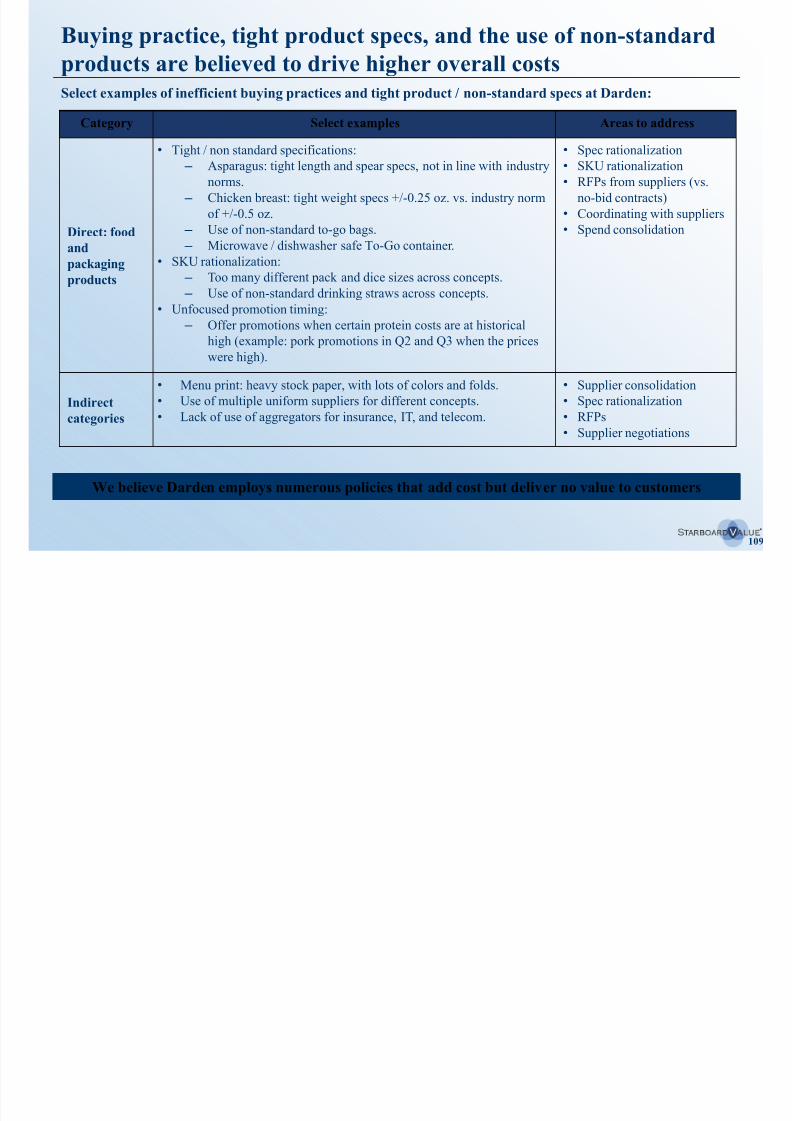
8/11/2019 Starboard Value Transforming Darden
http://slidepdf.com/reader/full/starboard-value-transforming-darden 109/294
109
p gSelect examples of inefficient buying practices and tight product / non-standard specs at Darden:
Category Select examples Areas to address
Direct: food
and
packaging
products
• Tight / non standard specifications: – Asparagus: tight length and spear specs, not in line with industry
norms.
– Chicken breast: tight weight specs +/-0.25 oz. vs. industry norm
of +/-0.5 oz.
– Use of non-standard to-go bags.
– Microwave / dishwasher safe To-Go container.
• SKU rationalization:
– Too many different pack and dice sizes across concepts. – Use of non-standard drinking straws across concepts.
• Unfocused promotion timing:
– Offer promotions when certain protein costs are at historical
high (example: pork promotions in Q2 and Q3 when the prices
were high).
• Spec rationalization• SKU rationalization
• RFPs from suppliers (vs.
no-bid contracts)
• Coordinating with suppliers
• Spend consolidation
Indirectcategories
• Menu print: heavy stock paper, with lots of colors and folds.
•
Use of multiple uniform suppliers for different concepts.• Lack of use of aggregators for insurance, IT, and telecom.
• Supplier consolidation
•
Spec rationalization• RFPs
• Supplier negotiations
We believe Darden employs numerous policies that add cost but deliver no value to customers
There appears to be approximately $24 – $42 million in
procurement improvement opportunities across direct categories…
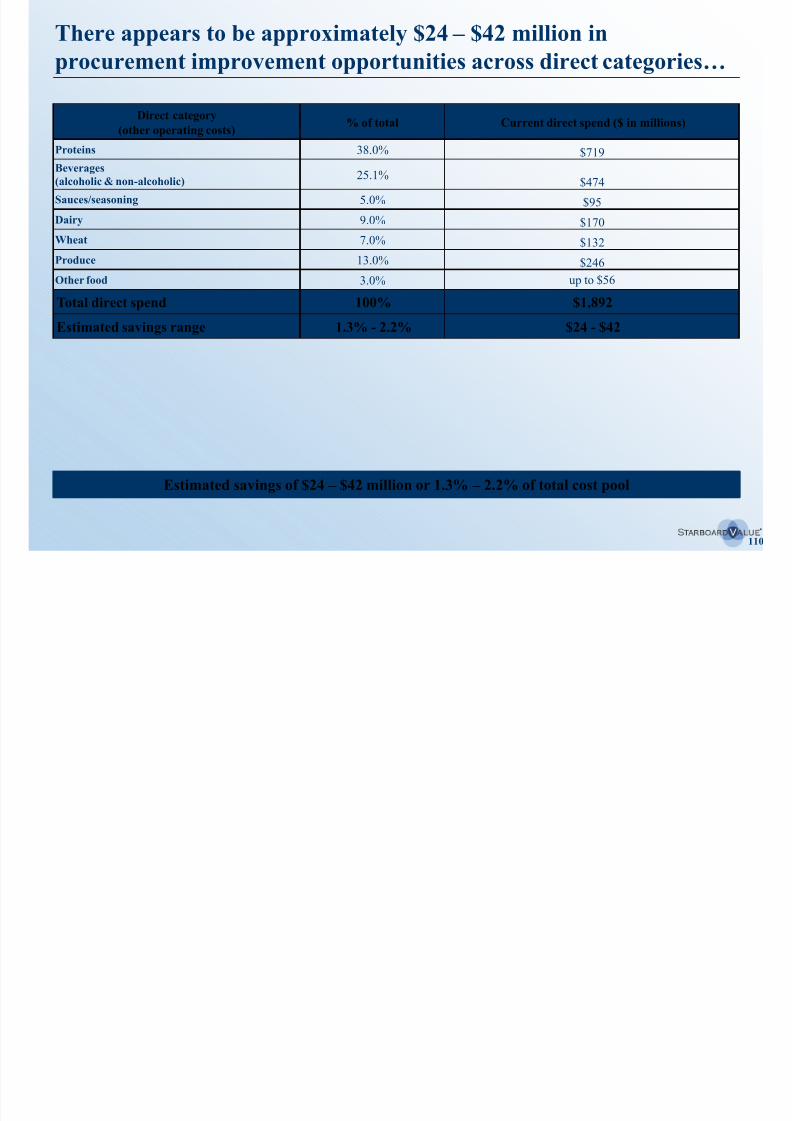
8/11/2019 Starboard Value Transforming Darden
http://slidepdf.com/reader/full/starboard-value-transforming-darden 110/294
110
Direct category
(other operating costs)% of total Current direct spend ($ in millions)
Proteins 38.0% $719
Beverages
(alcoholic & non-alcoholic)25.1%
$474
Sauces/seasoning 5.0% $95
Dairy 9.0% $170
Wheat 7.0% $132
Produce 13.0% $246
Other food 3.0% up to $56
Total direct spend 100% $1,892
Estimated savings range 1.3% - 2.2% $24 - $42
Estimated savings of $24 – $42 million or 1.3% – 2.2% of total cost pool
…And $19 – $28 million within indirect categories
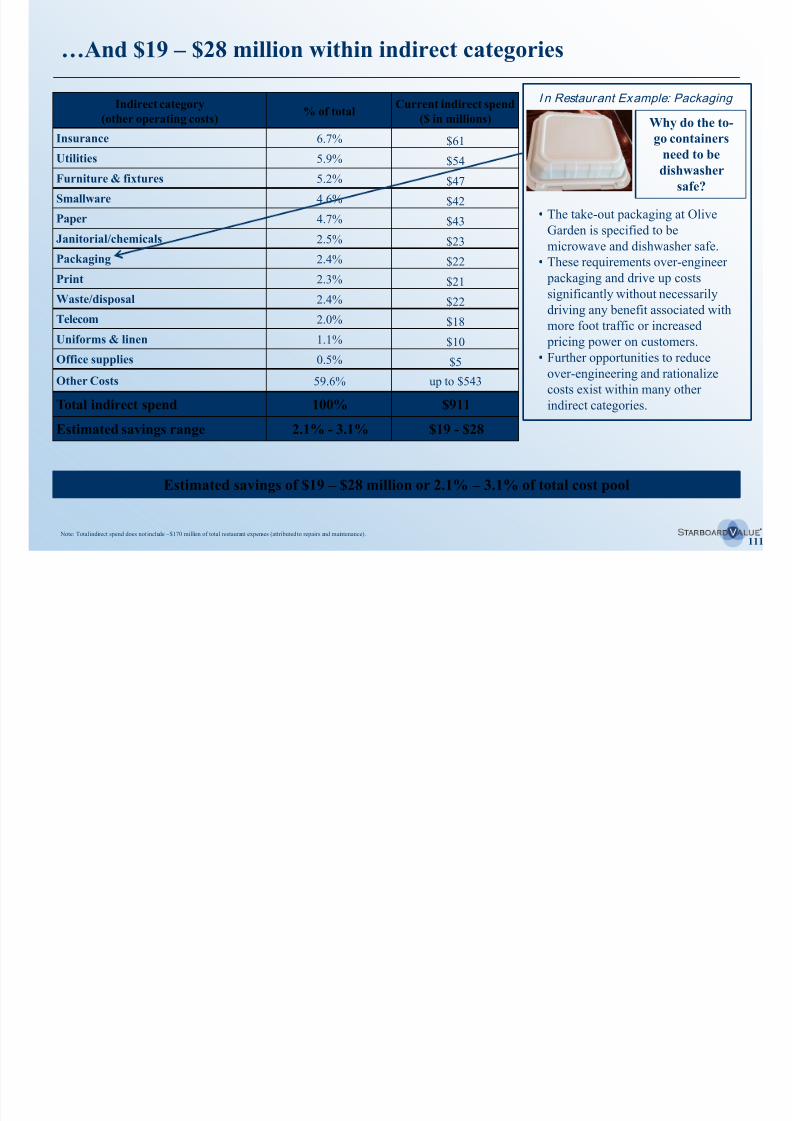
8/11/2019 Starboard Value Transforming Darden
http://slidepdf.com/reader/full/starboard-value-transforming-darden 111/294
111
• The take-out packaging at Olive
Garden is specified to be
microwave and dishwasher safe.
• These requirements over-engineer
packaging and drive up costssignificantly without necessarily
driving any benefit associated with
more foot traffic or increased
pricing power on customers.
• Further opportunities to reduce
over-engineering and rationalize
costs exist within many other
indirect categories.
I n Restaurant Example: PackagingIndirect category
(other operating costs)% of total
Current indirect spend
($ in millions)
Insurance 6.7%$61
Utilities 5.9% $54
Furniture & fixtures 5.2% $47
Smallware 4.6% $42
Paper 4.7% $43
Janitorial/chemicals 2.5% $23
Packaging 2.4% $22
Print 2.3% $21
Waste/disposal 2.4% $22
Telecom 2.0% $18
Uniforms & linen 1.1% $10
Office supplies 0.5% $5
Other Costs 59.6% up to $543
Total indirect spend 100% $911
Estimated savings range 2.1% - 3.1% $19 - $28
Why do the to-
go containers
need to be
dishwasher
safe?
Estimated savings of $19 – $28 million or 2.1% – 3.1% of total cost pool
Note: Total indirect spend does not include ~$170 million of total restaurant expenses (attributed to repairs and maintenance).
Implementing the procurement and supply chain opportunity

8/11/2019 Starboard Value Transforming Darden
http://slidepdf.com/reader/full/starboard-value-transforming-darden 112/294
112
Infuse the organization with a “quality-up, cost-down” mentality.
Establish strict all-you-can-eat breadsticks and salad serving policies to minimize waste and improve customer satisfaction.
Establish a top supplier program promoting long-term relationships with suppliers who offer the most efficient solutions.
– Focus on direct and intense negotiations executed by cross-functional teams while leveraging volume requirements.
– Leverage current relationships with preferred suppliers who implement savings ideas for Darden.
– Do not be afraid to switch suppliers if it makes sense from a cost and quality perspective.
Use industry-standard specs for products that will not effect the customer experience.
– Prioritize areas of spec rationalization opportunity based on $ savings and include R&D team in this discussion. For
products that may need non-standard specs, conduct in-depth consumer testing to determine the impact on guests.
We estimate the opportunity to improve EBITDA through implementing procurement and supply chain
discipline and improving execution around food waste is $75 million, or more.
Areas not quantified
Food waste opportunities
other than breadsticks
2.7% of cur rent
procurement costs
Previous opportunities $39.0 million
+ Olive Garden breadsticks opportunity $5.0 million
+ Direct food and packaging costs opportunity $42.0 million
+ Indirect costs opportunity $28.0 million
Cumulative opportunity $114 million
8/11/2019 Starboard Value Transforming Darden
http://slidepdf.com/reader/full/starboard-value-transforming-darden 113/294
113
V. Company-wide margin improvement
opportunityC. Labor
Despite a higher average check than most peers, Darden’s laborcosts are above peers
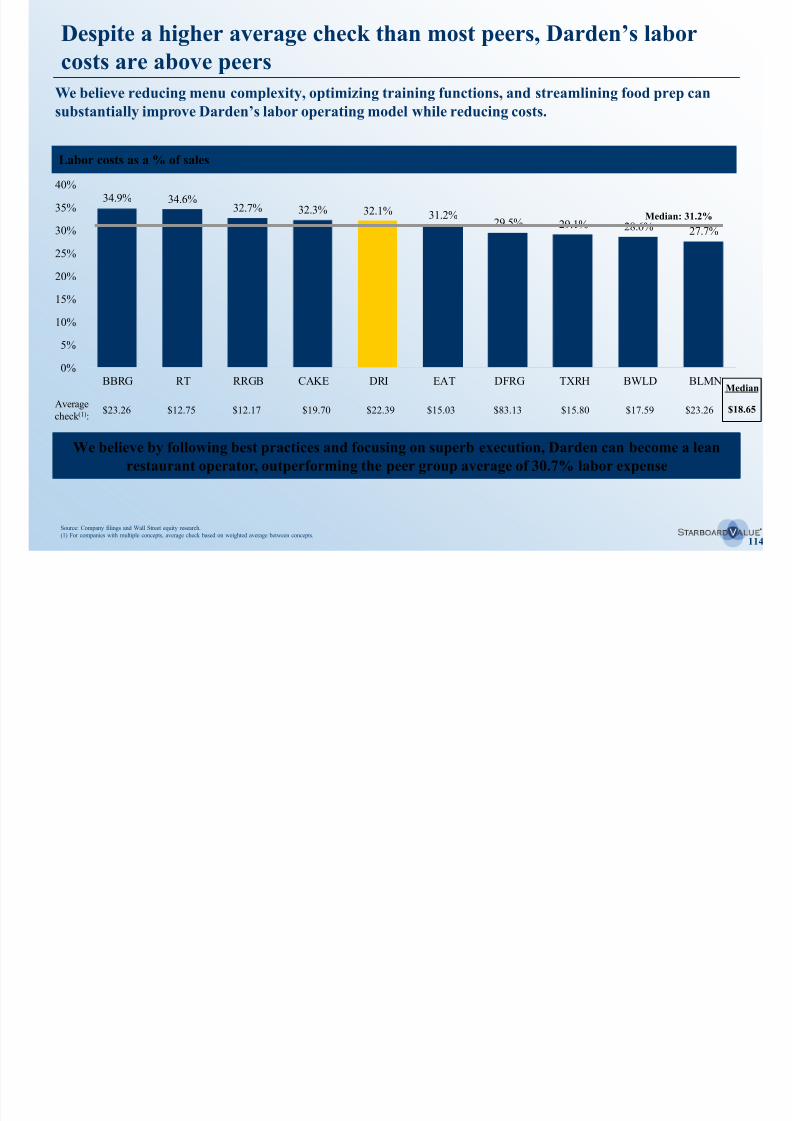
8/11/2019 Starboard Value Transforming Darden
http://slidepdf.com/reader/full/starboard-value-transforming-darden 114/294
114
We believe by following best practices and focusing on superb execution, Darden can become a lean
restaurant operator, outperforming the peer group average of 30.7% labor expense
Source: Company filings and Wall Street equity research.
(1) For companies with multiple concepts, average check based on weighted average between concepts.
Labor costs as a % of sales
34.9% 34.6%32.7% 32.3% 32.1% 31.2%
29.5% 29.1% 28.6% 27.7%
0%
5%
10%
15%
20%
25%
30%
35%
40%
BBRG RT RRGB CAKE DRI EAT DFRG TXRH BWLD BLMN
Median: 31.2%
We believe reducing menu complexity, optimizing training functions, and streamlining food prep can
substantially improve Darden’s labor operating model while reducing costs.
$12.17 $15.03$19.70 $23.26$15.80$22.39$23.26 $12.75 $83.13Averagecheck (1):
$18.65
Median
$17.59
Olive Garden and LongHorn perform more food prep in-house
than others, even items traditionally prepped by suppliers

8/11/2019 Starboard Value Transforming Darden
http://slidepdf.com/reader/full/starboard-value-transforming-darden 115/294
1151) Chopping of salad is done in-house at Olive Garden, while its peers usually outsource this task.
Olive Garden preps more food in-house than industry peers – significantly increasing costs.
– On average, Olive Garden uses 4 prep employees all day while competitors use 1-2 in the morning and
potentially another 1 during peak times.
Soup preparation: We believe Darden should bring the base in and add a few ingredients in the restaurant, not cook fromscratch at each individual restaurant as it currently does, since it gets little credit from customers for its “homemade”
soups.
Buying select finished or partially-prepped food items:
– Maintains product consistency across the chain.
– Reduces food safety risks associated with sloppy preparation.
– Reduces costs as suppliers have inherent efficiencies in food preparation for certain items.
– Will drive Olive Garden to focus more on the things that drive traffic – superior service and the customerexperience.
– Reduces training requirements.
Select example items Industry
Sauces √ √ XBreadstick X NA X
Soups √ √ X
Salads(1) X X X
Make vs. buy at Olive Garden / LongHorn vs. industry peers (X - Buy; √ - Make in-house)
Outsourcing prep in selected areas will reduce costs while improving quality and consistency
We believe large labor cost opportunity exists if food preparation is
improved

8/11/2019 Starboard Value Transforming Darden
http://slidepdf.com/reader/full/starboard-value-transforming-darden 116/294
116
Olive Garden Current Reductionof 1 FTE Reduction of1.5 FTEs
Number of Prep FTEs per store/day 4 1 1.5
Est. Costs Per Store per day @ $10/hr. $320 $80 $120
Est. Total System Costs/day $264,960 $66,240 $99,360
Est. Total Annual Costs $96,180,480 $24,045,120 $36,067,680
Est. Total Combined Store Labor Cost Reduction
for Olive Garden(1)$96,180,480 $24 million $36 million
Several factors are driving Darden’s high labor costs – each of which we believe can be addressed:
– Complexity: The Olive Garden and LongHorn menus appear too complex with too many items, making it
inefficient to prep and make entrees; increased complexity also drives more effort tied to training of restaurant
staff.
– Back-of-the-house labor: Olive Garden performs many prep activities that other chains have asked their
suppliers to perform, with these competitors driving higher quality and consistency while lowering costs.
– Technology: Inefficient use of technology solutions for labor management has seemingly prevented Darden
from implementing best practices across concepts.
We estimate Olive Garden can save $24 – $36 million in labor associated with food preparation
(1) Assumes $10 per hour labor cost (2,000 hours per year) at 835 restaurants.
We believe this opportunity also exists at LongHorn, as competitors
long ago outsourced items LongHorn still makes in-house
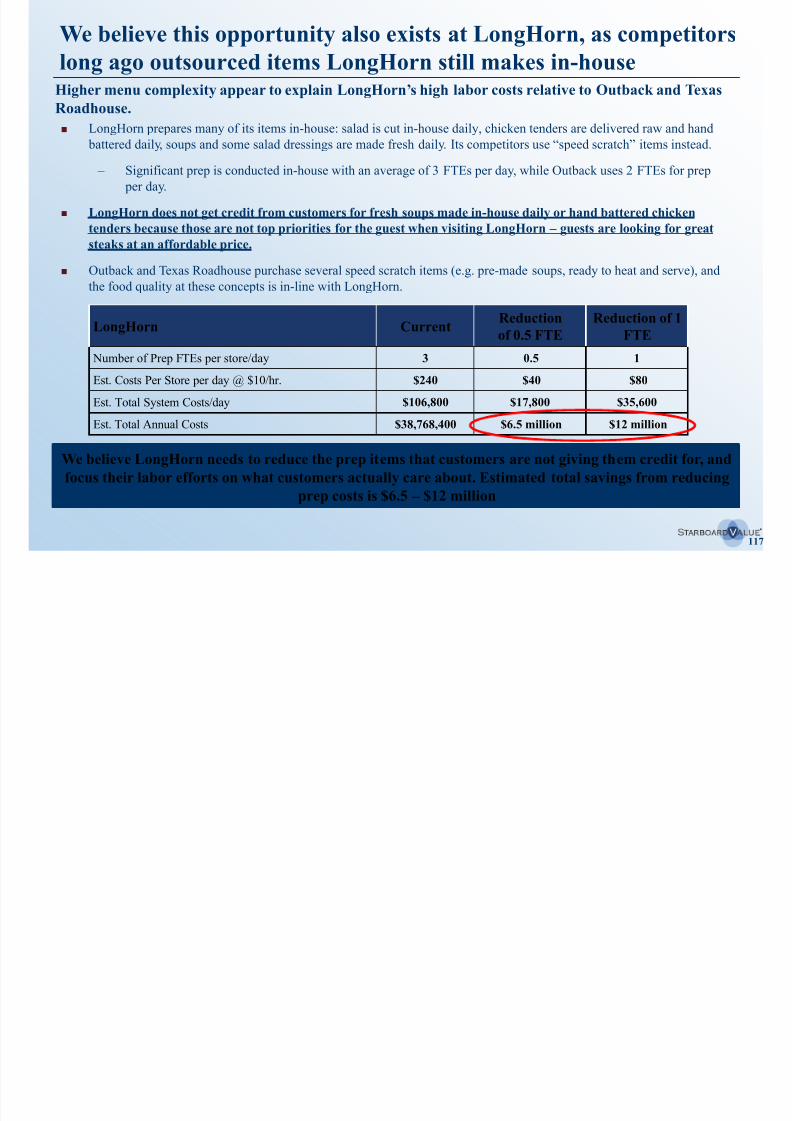
8/11/2019 Starboard Value Transforming Darden
http://slidepdf.com/reader/full/starboard-value-transforming-darden 117/294
117
LongHorn CurrentReduction
of 0.5 FTE
Reduction of 1
FTE
Number of Prep FTEs per store/day 3 0.5 1
Est. Costs Per Store per day @ $10/hr. $240 $40 $80
Est. Total System Costs/day $106,800 $17,800 $35,600
Est. Total Annual Costs $38,768,400 $6.5 million $12 million
LongHorn prepares many of its items in-house: salad is cut in-house daily, chicken tenders are delivered raw and hand
battered daily, soups and some salad dressings are made fresh daily. Its competitors use “speed scratch” items instead.
– Significant prep is conducted in-house with an average of 3 FTEs per day, while Outback uses 2 FTEs for prep
per day.
LongHorn does not get credit from customers for fresh soups made in-house daily or hand battered chicken
tenders because those are not top priorities for the guest when visiting LongHorn – guests are looking for great
steaks at an affordable price.
Outback and Texas Roadhouse purchase several speed scratch items (e.g. pre-made soups, ready to heat and serve), andthe food quality at these concepts is in-line with LongHorn.
We believe LongHorn needs to reduce the prep items that customers are not giving them credit for, and
focus their labor efforts on what customers actually care about. Estimated total savings from reducing
prep costs is $6.5 – $12 million
Higher menu complexity appear to explain LongHorn’s high labor costs relative to Outback and Texas
Roadhouse.
We believe Olive Garden’s menu has become far toocomplex
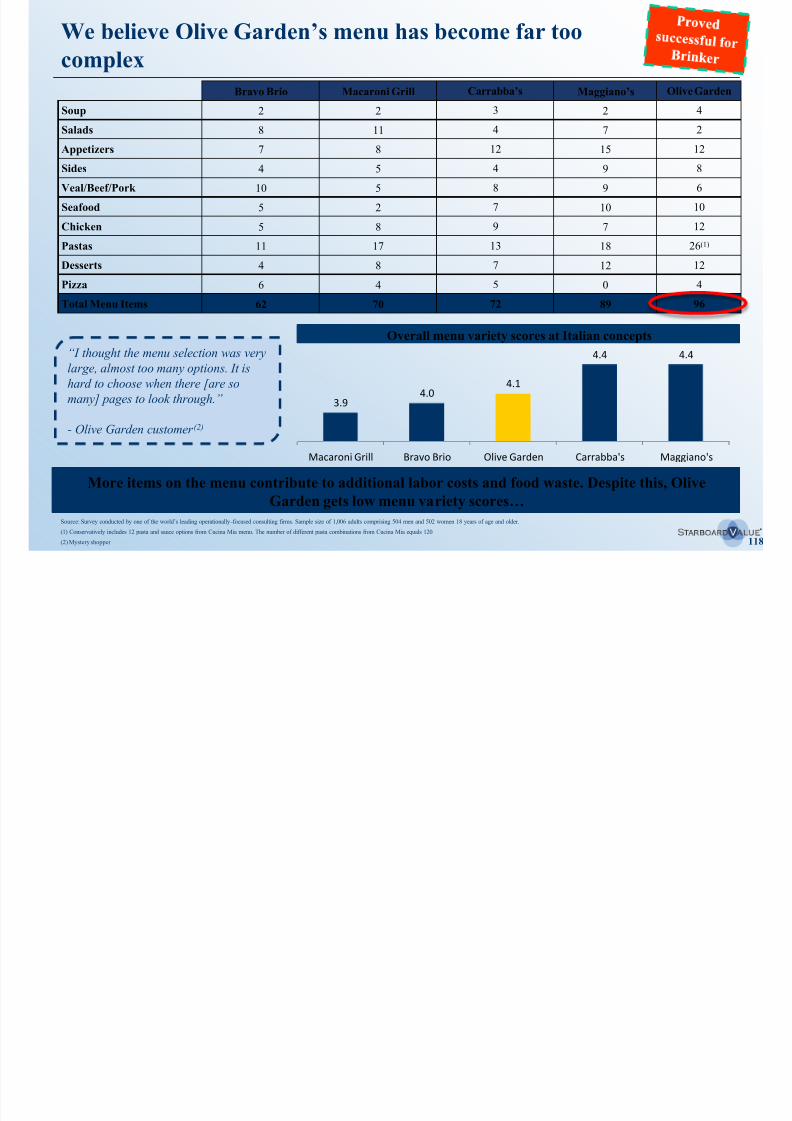
8/11/2019 Starboard Value Transforming Darden
http://slidepdf.com/reader/full/starboard-value-transforming-darden 118/294
118
Bravo Brio Macaroni Grill Carrabba’s Maggiano’s Olive Garden
Soup 2 2 3 2 4
Salads 8 11 4 7 2
Appetizers 7 8 12 15 12
Sides 4 5 4 9 8
Veal/Beef/Pork 10 5 8 9 6
Seafood 5 2 7 10 10
Chicken 5 8 9 7 12
Pastas 11 17 13 18 26(1)
Desserts 4 8 7 12 12
Pizza 6 4 5 0 4
Total Menu Items 62 70 72 89 96
Overall menu variety scores at Italian concepts
Source: Survey conducted by one of the world’s leading operationally -focused consulting firms. Sample size of 1,006 adults comprising 504 men and 502 women 18 years of age and older.
(1) Conservatively includes 12 pasta and sauce options from Cucina Mia menu. The number of different pasta combinations from Cucina Mia equals 120.(2) Mystery shopper.
3.9
4.04.1
4.4 4.4
Macaroni Grill Bravo Brio Olive Garden Carrabba's Maggiano's
“I thought the menu selection was very
large, almost too many options. It is
hard to choose when there [are so
many] pages to look through.”
- Olive Garden customer (2)
More items on the menu contribute to additional labor costs and food waste. Despite this, Olive
Garden gets low menu variety scores…
We believe the LongHorn menu is also overly complex, leading to
higher costs
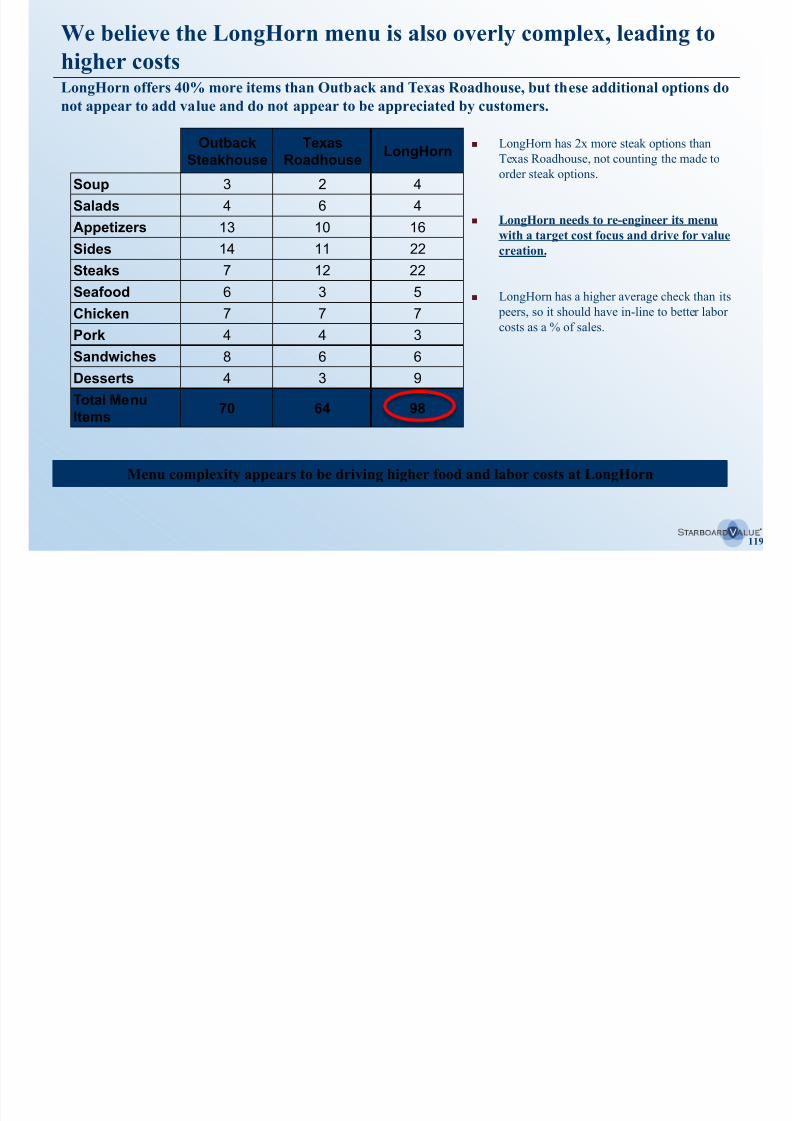
8/11/2019 Starboard Value Transforming Darden
http://slidepdf.com/reader/full/starboard-value-transforming-darden 119/294
119
Menu complexity appears to be driving higher food and labor costs at LongHorn
LongHorn offers 40% more items than Outback and Texas Roadhouse, but these additional options do
not appear to add value and do not appear to be appreciated by customers.
OutbackSteakhouse TexasRoadhouse LongHorn
Soup 3 2 4
Salads 4 6 4
Appetizers 13 10 16
Sides 14 11 22
Steaks 7 12 22Seafood 6 3 5
Chicken 7 7 7
Pork 4 4 3
Sandwiches 8 6 6
Desserts 4 3 9
Total MenuItems 70 64 98
LongHorn has 2x more steak options thanTexas Roadhouse, not counting the made to
order steak options.
LongHorn needs to re-engineer its menu
with a target cost focus and drive for value
creation.
LongHorn has a higher average check than its
peers, so it should have in-line to better labor
costs as a % of sales.
We believe menu complexity was also an issue at Red Lobster…
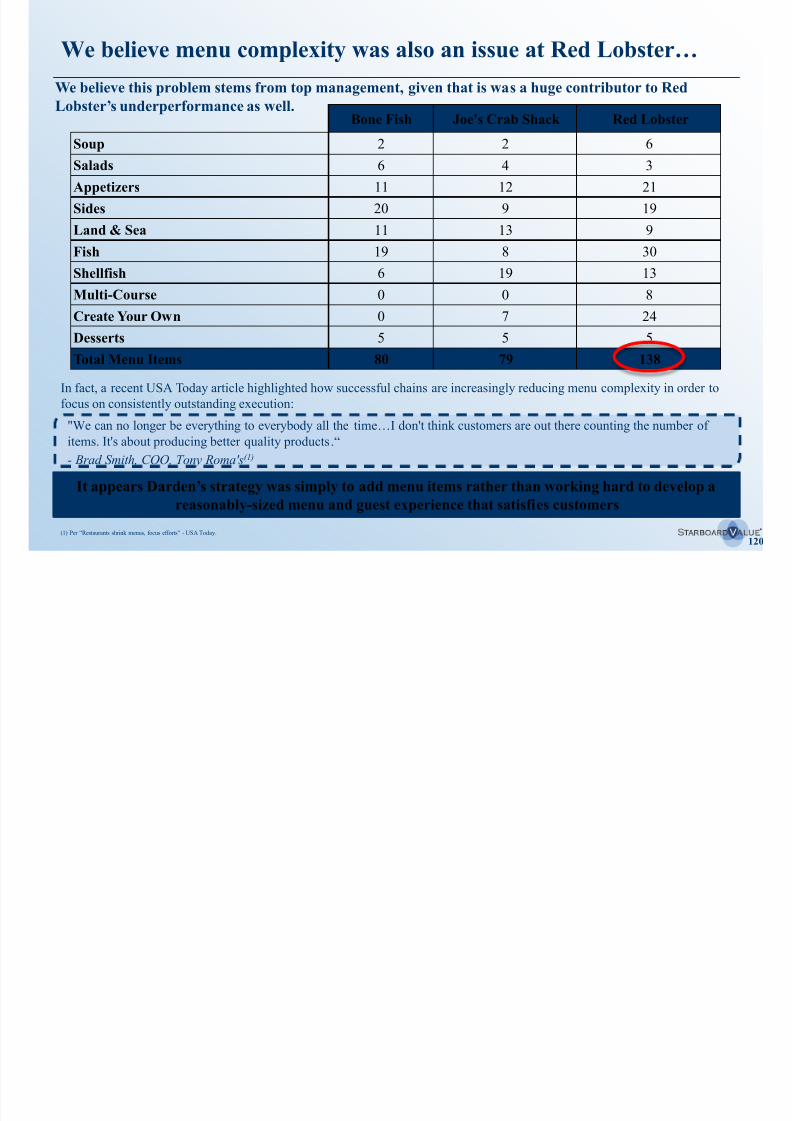
8/11/2019 Starboard Value Transforming Darden
http://slidepdf.com/reader/full/starboard-value-transforming-darden 120/294
120
It appears Darden’s strategy was simply to add menu items rather than working hard to develop areasonably-sized menu and guest experience that satisfies customers
We believe this problem stems from top management, given that is was a huge contributor to Red
Lobster’s underperformance as well. Bone Fish Joe's Crab Shack Red Lobster
Soup 2 2 6Salads 6 4 3
Appetizers 11 12 21
Sides 20 9 19
Land & Sea 11 13 9
Fish 19 8 30
Shellfish 6 19 13Multi-Course 0 0 8
Create Your Own 0 7 24
Desserts 5 5 5
Total Menu Items 80 79 138
"We can no longer be everything to everybody all the time…I don't think customers are out there counting the number of
items. It's about producing better quality products.“
- Brad Smith, COO, Tony Roma's(1)
(1) Per “Restaurants shrink menus, focus efforts” - USA Today.
In fact, a recent USA Today article highlighted how successful chains are increasingly reducing menu complexity in order to
focus on consistently outstanding execution:
We believe menu complexity has led to higher costs and
inefficiencies
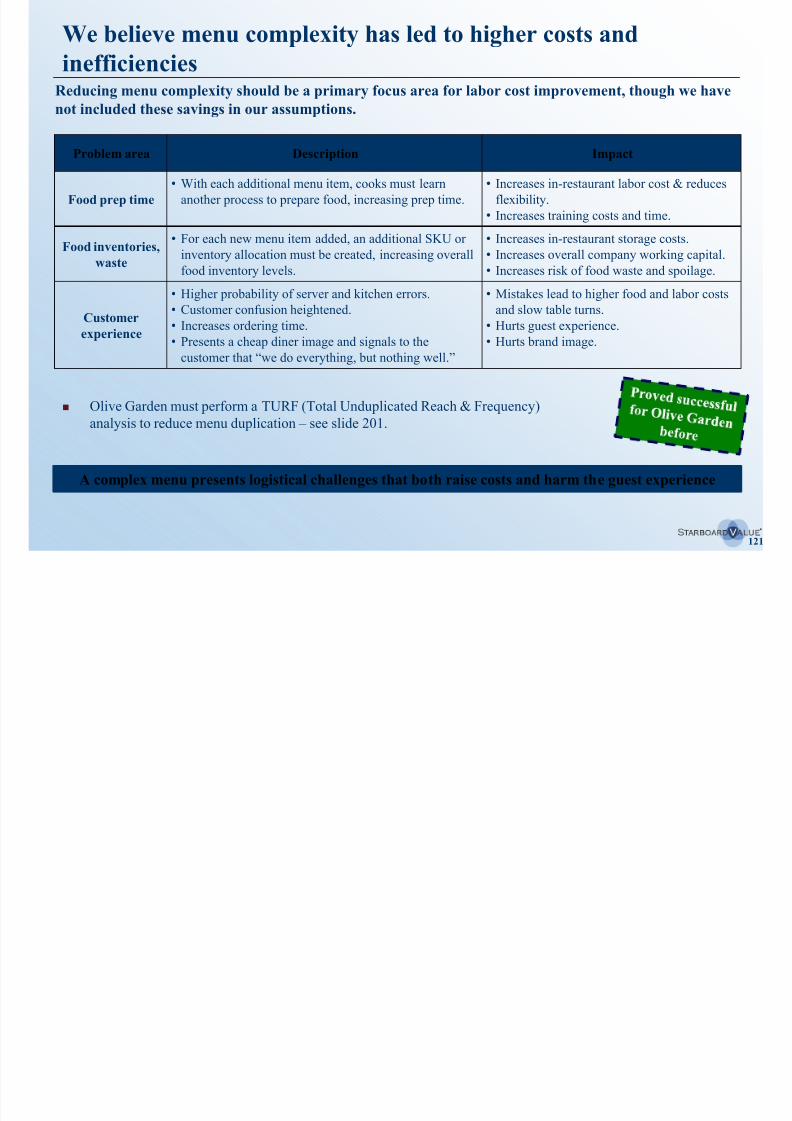
8/11/2019 Starboard Value Transforming Darden
http://slidepdf.com/reader/full/starboard-value-transforming-darden 121/294
121
Problem area Description Impact
Food prep time
• With each additional menu item, cooks must learn
another process to prepare food, increasing prep time.
• Increases in-restaurant labor cost & reduces
flexibility.
• Increases training costs and time.
Food inventories,
waste
• For each new menu item added, an additional SKU or
inventory allocation must be created, increasing overall
food inventory levels.
• Increases in-restaurant storage costs.
• Increases overall company working capital.
•
Increases risk of food waste and spoilage.
Customer
experience
• Higher probability of server and kitchen errors.
• Customer confusion heightened.
• Increases ordering time.
• Presents a cheap diner image and signals to the
customer that “we do everything, but nothing well.”
• Mistakes lead to higher food and labor costs
and slow table turns.
• Hurts guest experience.
• Hurts brand image.
Reducing menu complexity should be a primary focus area for labor cost improvement, though we have
not included these savings in our assumptions.
A complex menu presents logistical challenges that both raise costs and harm the guest experience
Olive Garden must perform a TURF (Total Unduplicated Reach & Frequency)analysis to reduce menu duplication – see slide 201.
We believe menu complexity has led to additional staffing within
each restaurant
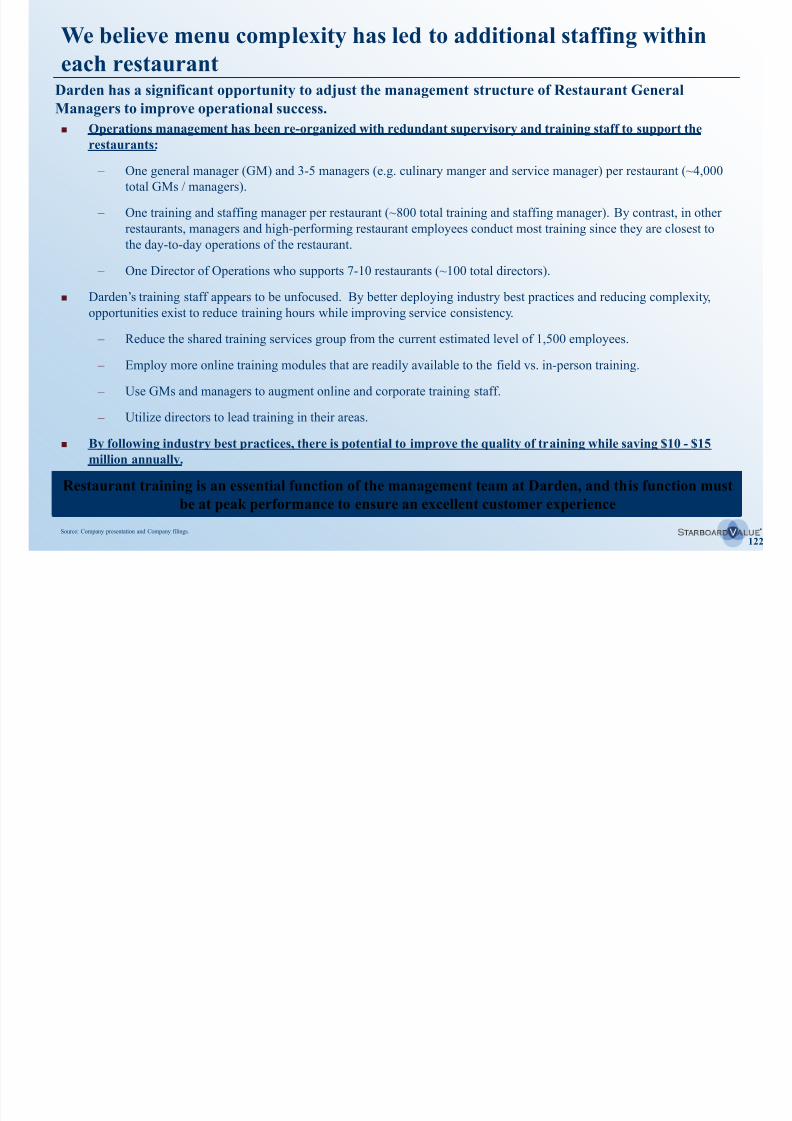
8/11/2019 Starboard Value Transforming Darden
http://slidepdf.com/reader/full/starboard-value-transforming-darden 122/294
122
Operations management has been re-organized with redundant supervisory and training staff to support the
restaurants:
– One general manager (GM) and 3-5 managers (e.g. culinary manger and service manager) per restaurant (~4,000
total GMs / managers).
– One training and staffing manager per restaurant (~800 total training and staffing manager). By contrast, in other
restaurants, managers and high-performing restaurant employees conduct most training since they are closest to
the day-to-day operations of the restaurant.
– One Director of Operations who supports 7-10 restaurants (~100 total directors). Darden’s training staff appears to be unfocused. By better deploying industry best practices and reducing complexity,
opportunities exist to reduce training hours while improving service consistency.
– Reduce the shared training services group from the current estimated level of 1,500 employees.
– Employ more online training modules that are readily available to the field vs. in-person training.
– Use GMs and managers to augment online and corporate training staff.
– Utilize directors to lead training in their areas.
By following industry best practices, there is potential to improve the quality of training while saving $10 - $15
million annually.
Restaurant training is an essential function of the management team at Darden, and this function must
be at peak performance to ensure an excellent customer experience
Darden has a significant opportunity to adjust the management structure of Restaurant General
Managers to improve operational success.
Source: Company presentation and Company filings.
Strict corporate policies appear to forbid GMs from enhancing the
guest experience(1)
8/11/2019 Starboard Value Transforming Darden
http://slidepdf.com/reader/full/starboard-value-transforming-darden 123/294
123
Corporate imposes a strict quota on weekly labor hours, leaving GMs little discretion to add labor that will lead directly
to profitable sales and guest satisfaction.
– Once GMs reach the weekly labor hour cap allotted, GMs are incentivized to understaff rather than properlystaff the restaurant – this leads to restaurants that are not prepared to handle their respective guest traffic.
– For example, Olive Garden restaurants are often busy on Friday or Saturday nights, sometimes with false waits of
up to 90 minutes, but if a store is already at its labor hour cap, Darden’s corporate policies encourage GMs to turn
away hungry customers rather than staff additional servers during peak hours.
– This contradicts the guest and employee-focused culture Bill Darden and Joe Lee wanted to instill.
The current operating model appears to prioritize corporate mandates that show little regard for the
day-to-day realities of running a restaurant. This is a problem when your business lives and dies on
customer service
Shockingly, GMs are seemingly incentivized to create false waits (1) rather than adequately staff restaurants.
“The goal is to be fully staffed in every restaurant with every position, with talented, skilled and experienced
employees.”
- Joe Lee, November 9, 2005
Further, even the best servers have a limited number of tables they are “allowed” to cover.
– Imagine an Olive Garden on Monday afternoon (traffic is slow) and there are 3 servers currently working.
Each one of these servers is only “allowed” to cover 3 tables.
– Now imagine an Olive Garden “regular” requesting his or her favorite server who always works Mondays. If thatserver already has 3 tables, the guest must wait in the lobby until one of those tables is free – despite 50+ open
tables in the restaurant.
(1) A false wait is where the restaurant makes the guest wait even when the restaurant is not at full capacity.
We believe there is an opportunity to work with equipment
suppliers to modernize the kitchens and create efficienciesD d k ith it i t li t th t ffi i t d l t t kit h
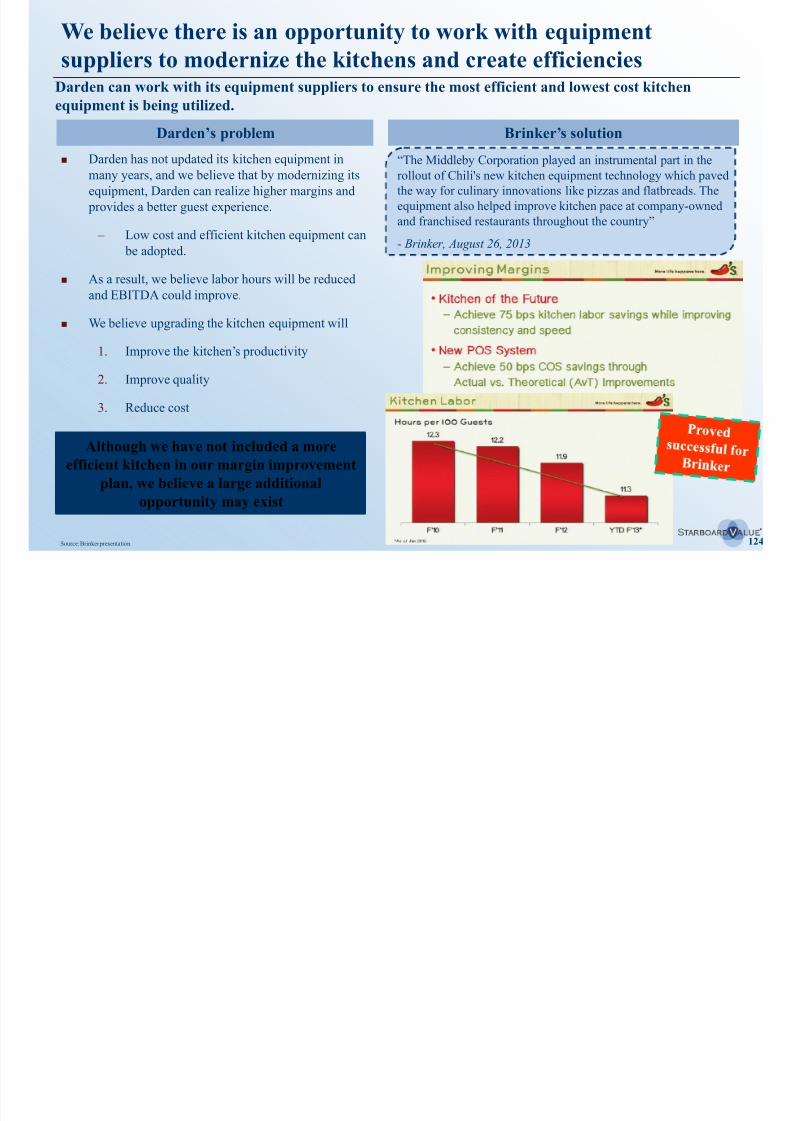
8/11/2019 Starboard Value Transforming Darden
http://slidepdf.com/reader/full/starboard-value-transforming-darden 124/294
124
Darden has not updated its kitchen equipment in
many years, and we believe that by modernizing its
equipment, Darden can realize higher margins and
provides a better guest experience.
– Low cost and efficient kitchen equipment can
be adopted.
As a result, we believe labor hours will be reducedand EBITDA could improve.
We believe upgrading the kitchen equipment will
1. Improve the kitchen’s productivity
2. Improve quality
3. Reduce cost
Although we have not included a more
efficient kitchen in our margin improvement
plan, we believe a large additional
opportunity may exist
Darden can work with its equipment suppliers to ensure the most efficient and lowest cost kitchen
equipment is being utilized.
“The Middleby Corporation played an instrumental part in the
rollout of Chili's new kitchen equipment technology which paved
the way for culinary innovations like pizzas and flatbreads. The
equipment also helped improve kitchen pace at company-owned
and franchised restaurants throughout the country”
- Brinker, August 26, 2013
Darden’s problem Brinker’s solution
Source: Brinker presentation.
Implementing the labor costs opportunity
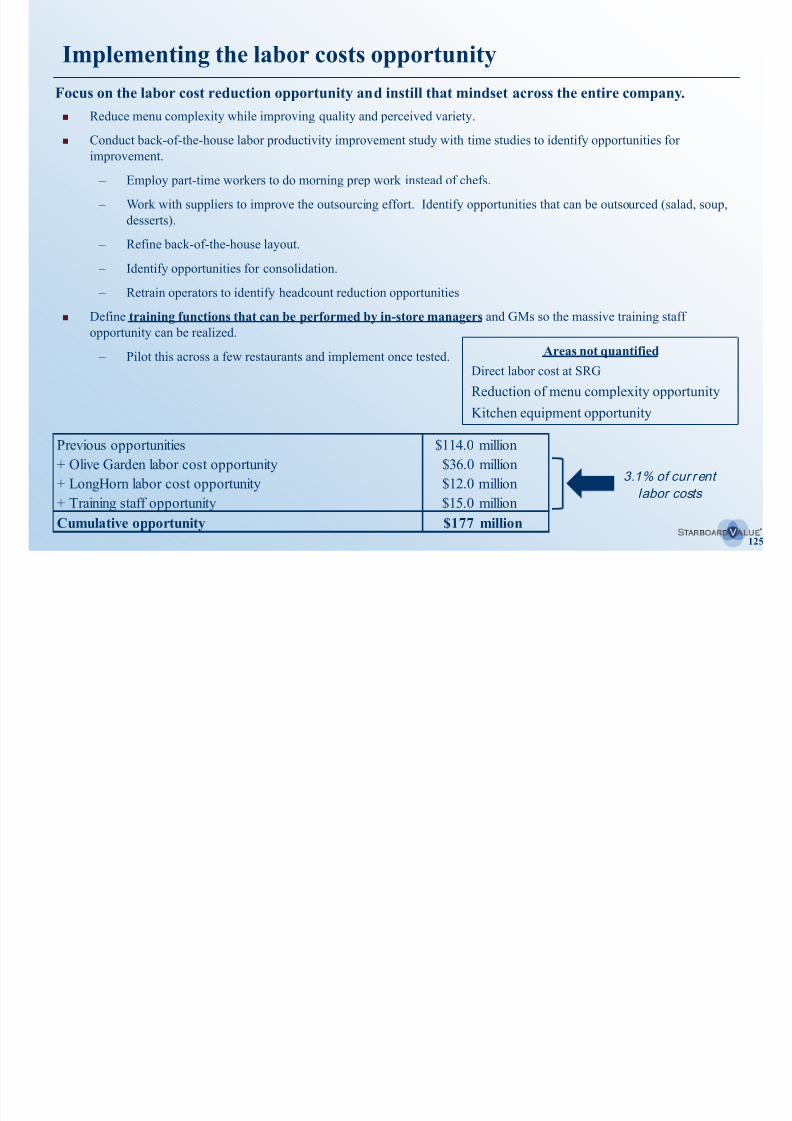
8/11/2019 Starboard Value Transforming Darden
http://slidepdf.com/reader/full/starboard-value-transforming-darden 125/294
125
Reduce menu complexity while improving quality and perceived variety.
Conduct back-of-the-house labor productivity improvement study with time studies to identify opportunities for
improvement.
– Employ part-time workers to do morning prep work instead of chefs.
– Work with suppliers to improve the outsourcing effort. Identify opportunities that can be outsourced (salad, soup,
desserts).
– Refine back-of-the-house layout.
– Identify opportunities for consolidation.
– Retrain operators to identify headcount reduction opportunities
Define training functions that can be performed by in-store managers and GMs so the massive training staff
opportunity can be realized.
– Pilot this across a few restaurants and implement once tested.
Focus on the labor cost reduction opportunity and instill that mindset across the entire company.
Areas not quantified
Direct labor cost at SRG
Reduction of menu complexity opportunity
Kitchen equipment opportunity
3.1% of cur rent
labor costs
Previous opportunities $114.0 million
+ Olive Garden labor cost opportunity $36.0 million
+ LongHorn labor cost opportunity $12.0 million
+ Training staff opportunity $15.0 million
Cumulative opportunity $177 million

8/11/2019 Starboard Value Transforming Darden
http://slidepdf.com/reader/full/starboard-value-transforming-darden 126/294
126
V. Company-wide margin improvement
opportunityD. Facilities
Darden appears to lag behind its peers in areas of facilities
management like repairs and maintenance (R&M)
8/11/2019 Starboard Value Transforming Darden
http://slidepdf.com/reader/full/starboard-value-transforming-darden 127/294
127
While Darden launched an R&M centralization program in 2012, the program ran into implementation issues and
Darden failed to realize its projected savings.
– In fact, it appears that Darden now has the worst of both worlds – we believe corporate has restricted the
freedom of General Managers without actually generating any savings for Darden.
– Several possible cultural factors could explain Darden’s lack of success in R&M program implementation:
Unwillingness to negotiate with contractors.
Bureaucratic and rigid processes.
Darden is a leader in energy efficiency, but despite lower utility costs, Darden’s restaurant expenses increased in 2014
(17.2%) vs. 2013 (16.6%), showing that R&M functions within the Company are not improving.
Several large chains, such as Bloomin’ Brands and McDonald’s, have successfully implemented outsourcing to reduce
R&M costs.
– Brinker made R&M a major focus and was able to achieve tangible reductions
to increase profitability.
An estimated $7 - $10 million savings can be realized by employing best practices that others have
already implemented
Without a robust R&M operation, Darden overpays for services and maintenance from contractors.
We believe Darden’s prior initiatives to better manage R&M have
been ineffective
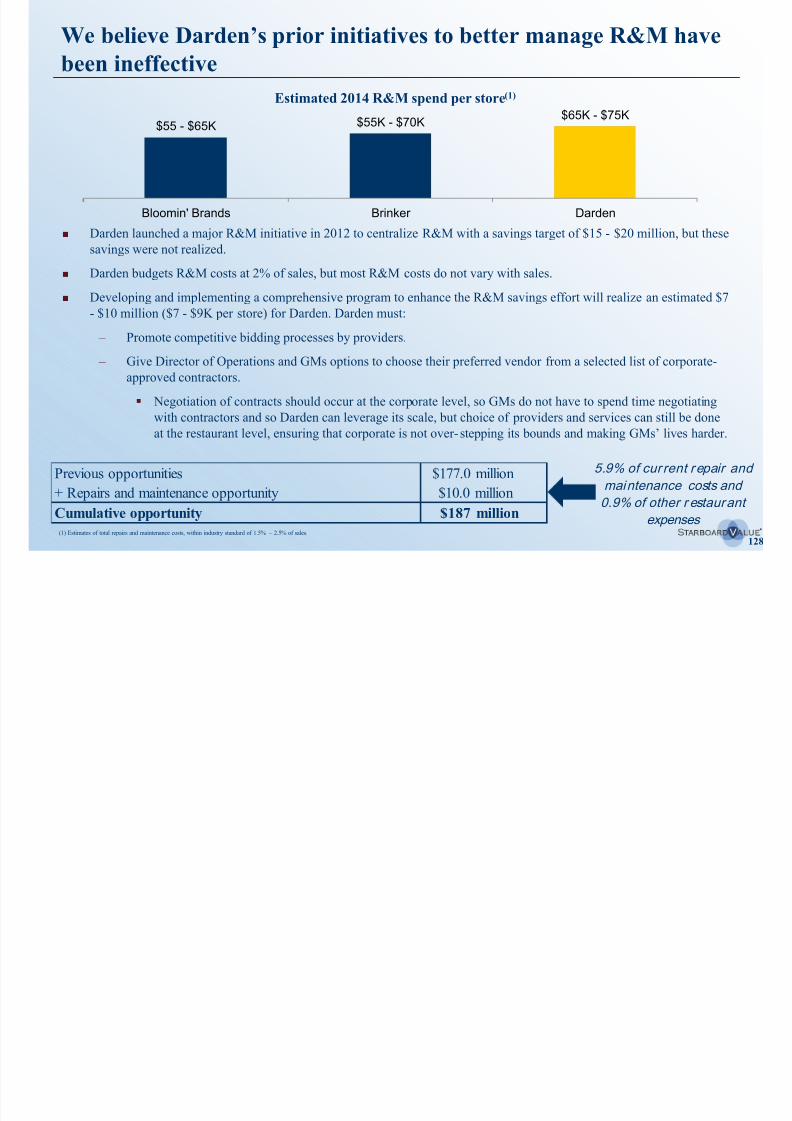
8/11/2019 Starboard Value Transforming Darden
http://slidepdf.com/reader/full/starboard-value-transforming-darden 128/294
128
Estimated 2014 R&M spend per store(1)
$55 - $65K $55K - $70K$65K - $75K
Bloomin' Brands Brinker Darden
Darden launched a major R&M initiative in 2012 to centralize R&M with a savings target of $15 - $20 million, but these
savings were not realized.
Darden budgets R&M costs at 2% of sales, but most R&M costs do not vary with sales. Developing and implementing a comprehensive program to enhance the R&M savings effort will realize an estimated $7
- $10 million ($7 - $9K per store) for Darden. Darden must:
– Promote competitive bidding processes by providers.
– Give Director of Operations and GMs options to choose their preferred vendor from a selected list of corporate-
approved contractors.
Negotiation of contracts should occur at the corporate level, so GMs do not have to spend time negotiatingwith contractors and so Darden can leverage its scale, but choice of providers and services can still be done
at the restaurant level, ensuring that corporate is not over-stepping its bounds and making GMs’ lives harder.
5.9% of cur rent repair and
maintenance costs and
0.9% of other r estaurant
expenses(1) Estimates of total repairs and maintenance costs, within industry standard of 1.5% – 2.5% of sales.
Previous opportunities $177.0 million
+ Repairs and maintenance opportunity $10.0 million
Cumulative opportunity $187 million
8/11/2019 Starboard Value Transforming Darden
http://slidepdf.com/reader/full/starboard-value-transforming-darden 129/294
129
V. Company-wide margin improvement
opportunityE. Advertising and marketing
We believe Darden has ineffective and inefficient marketing and
advertising
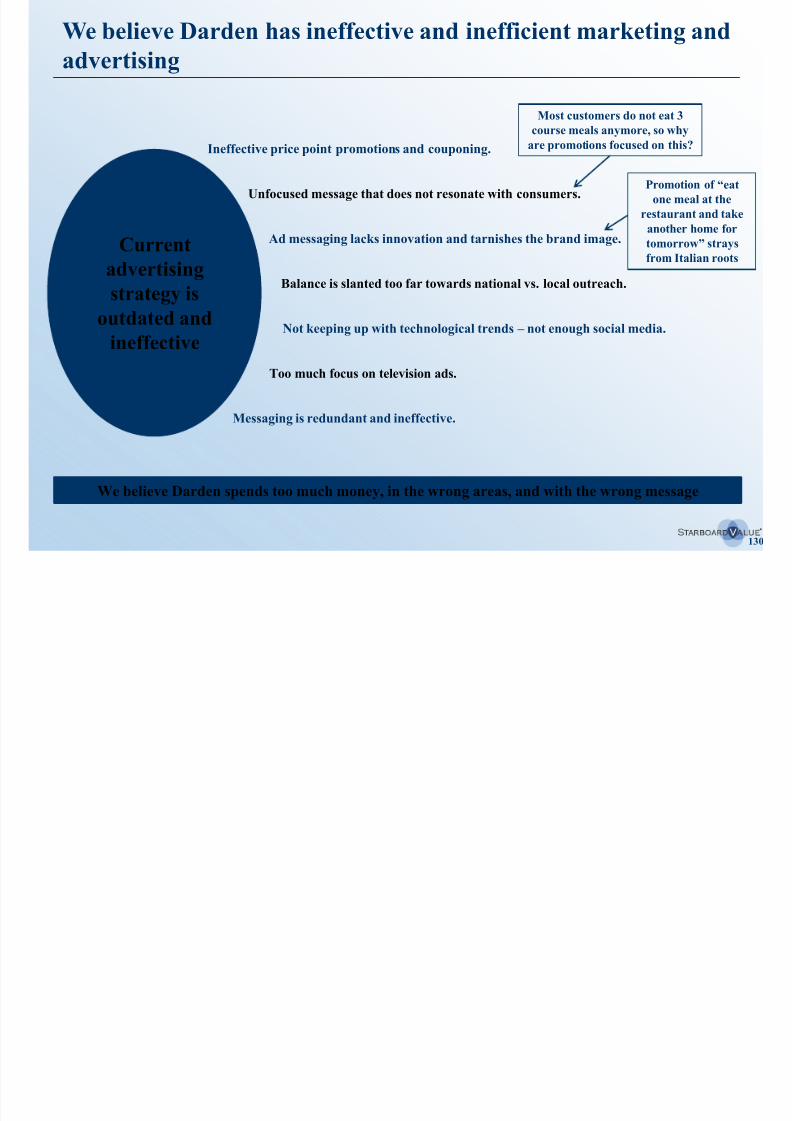
8/11/2019 Starboard Value Transforming Darden
http://slidepdf.com/reader/full/starboard-value-transforming-darden 130/294
130
Current
advertisingstrategy is
outdated and
ineffective
Unfocused message that does not resonate with consumers.
Ad messaging lacks innovation and tarnishes the brand image.
Ineffective price point promotions and couponing.
Balance is slanted too far towards national vs. local outreach.
Not keeping up with technological trends – not enough social media.
Too much focus on television ads.
Messaging is redundant and ineffective.
Promotion of “eatone meal at the
restaurant and take
another home for
tomorrow” strays
from Italian roots
Most customers do not eat 3
course meals anymore, so why
are promotions focused on this?
We believe Darden spends too much money, in the wrong areas, and with the wrong message
Effectiveness of ad spend can be substantially improved through
a clear and focused advertising strategy
In an attempt to make up for its unfocused message and inefficient advertising mix Darden has simply
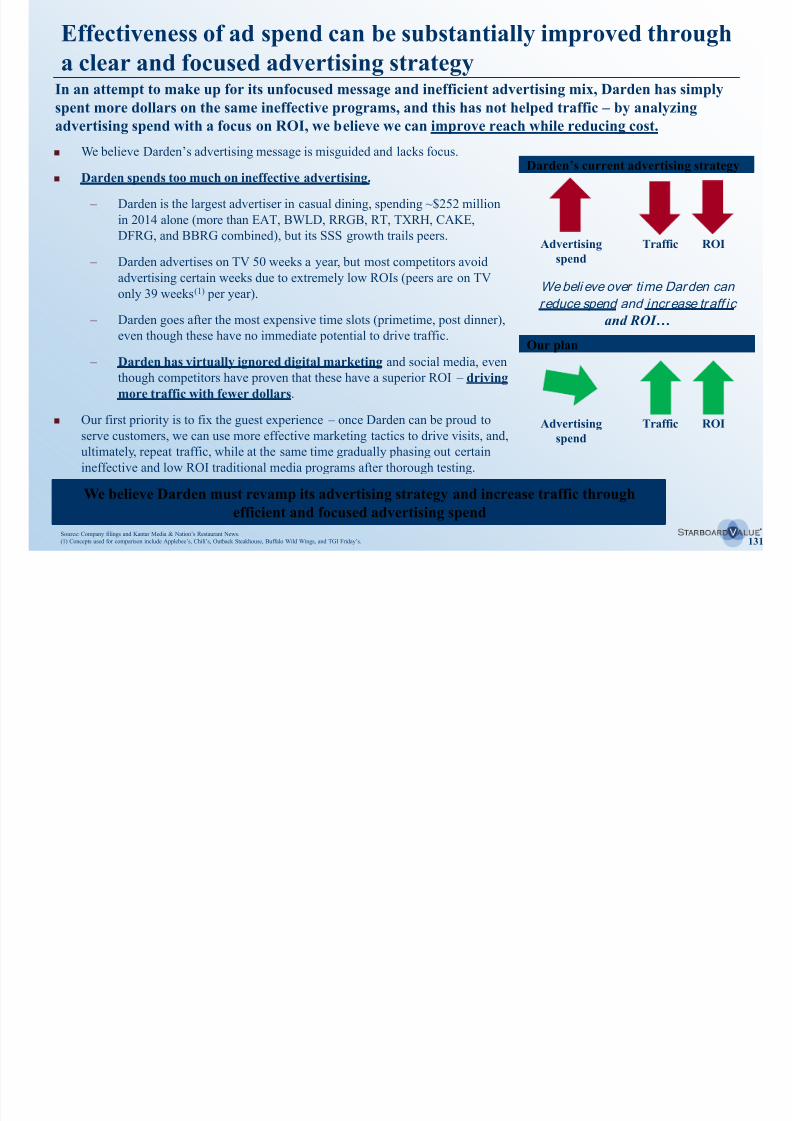
8/11/2019 Starboard Value Transforming Darden
http://slidepdf.com/reader/full/starboard-value-transforming-darden 131/294
131
We believe Darden’s advertising message is misguided and lacks focus.
Darden spends too much on ineffective advertising.
– Darden is the largest advertiser in casual dining, spending ~$252 million
in 2014 alone (more than EAT, BWLD, RRGB, RT, TXRH, CAKE,
DFRG, and BBRG combined), but its SSS growth trails peers.
– Darden advertises on TV 50 weeks a year, but most competitors avoid
advertising certain weeks due to extremely low ROIs (peers are on TVonly 39 weeks(1) per year).
– Darden goes after the most expensive time slots (primetime, post dinner),
even though these have no immediate potential to drive traffic.
– Darden has virtually ignored digital marketing and social media, even
though competitors have proven that these have a superior ROI – driving
more traffic with fewer dollars.
Our first priority is to fix the guest experience – once Darden can be proud to
serve customers, we can use more effective marketing tactics to drive visits, and,
ultimately, repeat traffic, while at the same time gradually phasing out certain
ineffective and low ROI traditional media programs after thorough testing.
We believe Darden must revamp its advertising strategy and increase traffic through
efficient and focused advertising spend
In an attempt to make up for its unfocused message and inefficient advertising mix, Darden has simply
spent more dollars on the same ineffective programs, and this has not helped traffic – by analyzing
advertising spend with a focus on ROI, we believe we can improve reach while reducing cost.
Darden’s current advertising strategy
Advertising
spend
Traffic ROI
Our plan
Advertising
spend
Traffic ROI
We beli eve over time Darden can
reduce spend and increase traff ic
and ROI…
Source: Company filings and Kantar Media & Nation’s Restaurant News. (1) Concepts used for comparison include Applebee’s, Chili’s, Outback Steakhouse, Buffalo Wild Wings, and TGI Friday’s.
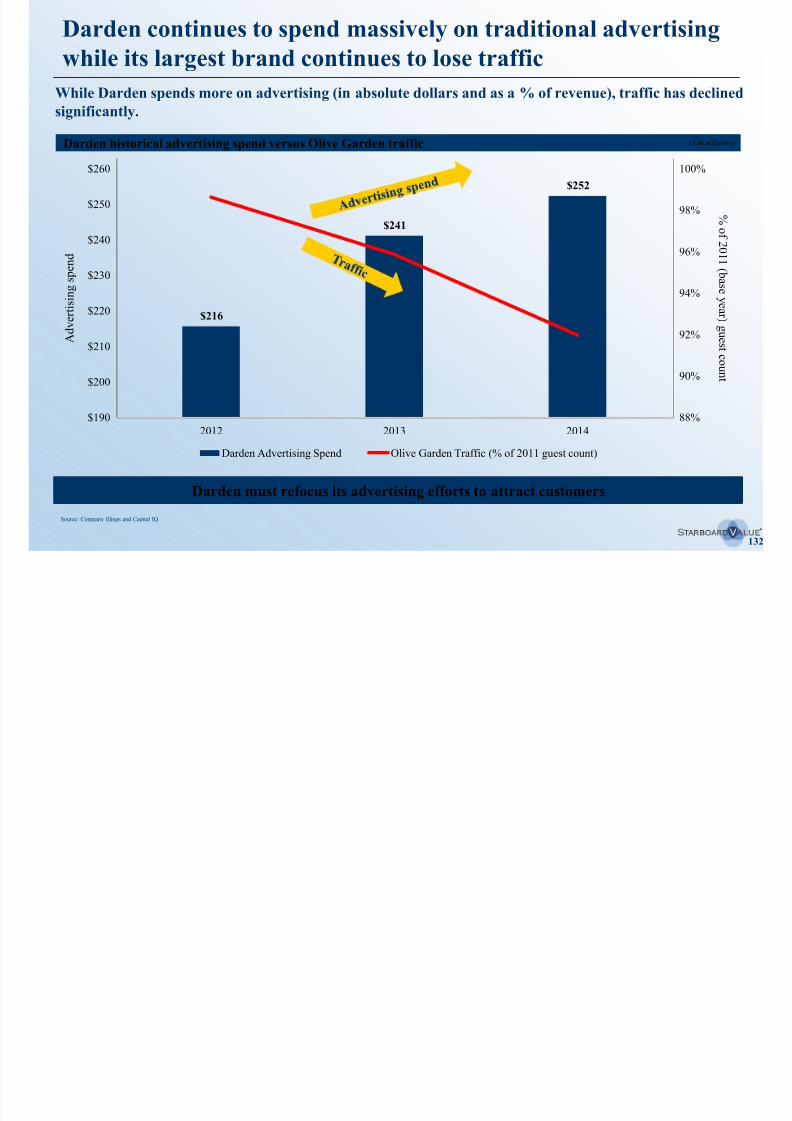
8/11/2019 Starboard Value Transforming Darden
http://slidepdf.com/reader/full/starboard-value-transforming-darden 132/294
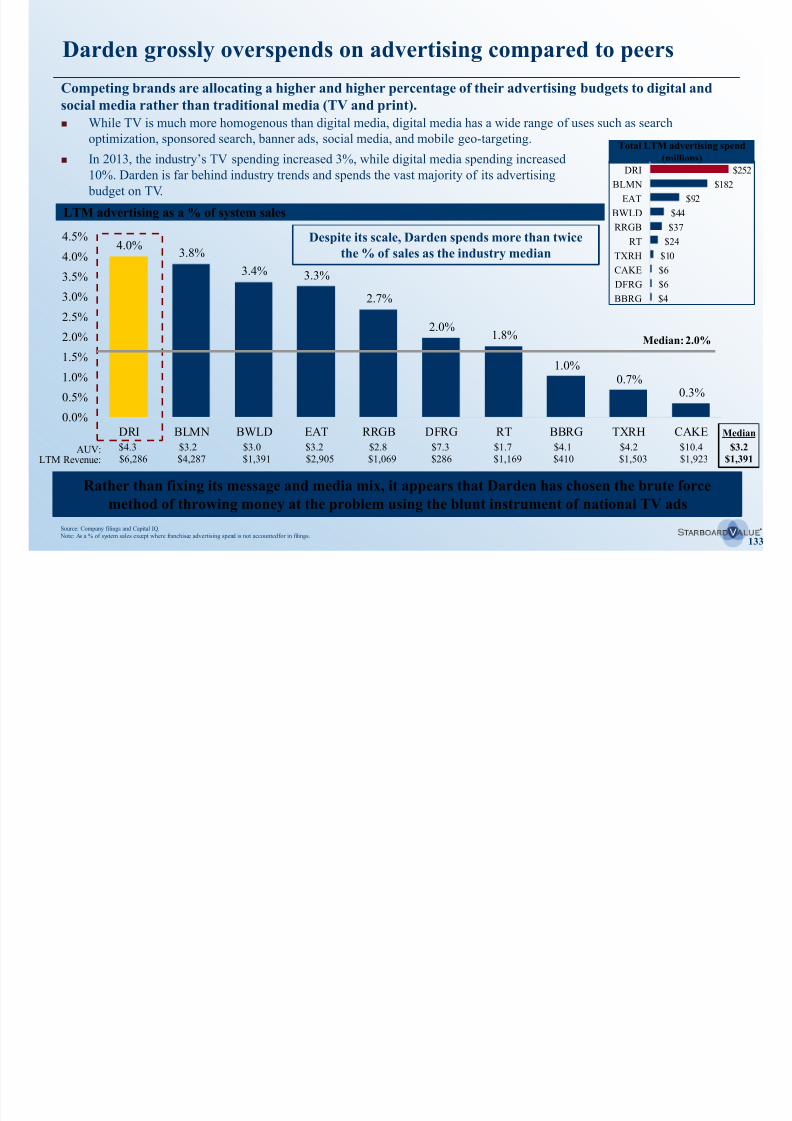
8/11/2019 Starboard Value Transforming Darden
http://slidepdf.com/reader/full/starboard-value-transforming-darden 133/294
Darden has failed to adopt current and what we believe to be more
effective advertising strategiesDarden’s marketing efforts are mainly rooted in traditional media, while peers have adapted to more
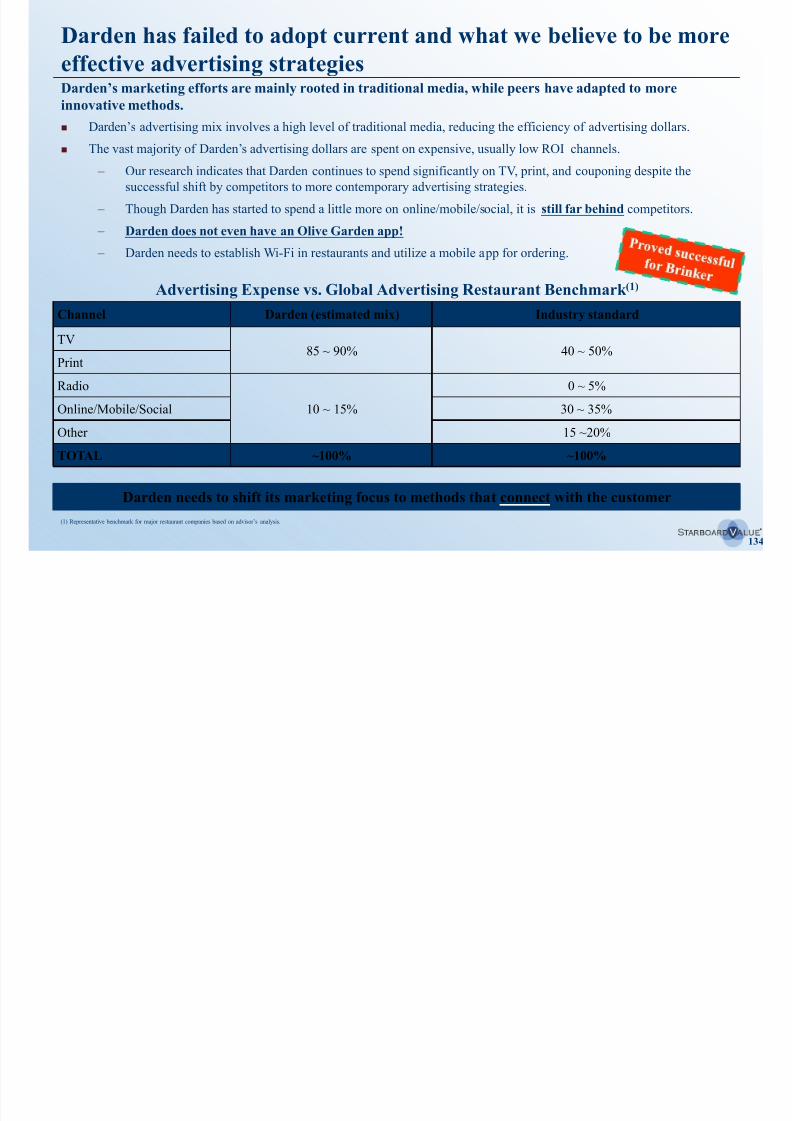
8/11/2019 Starboard Value Transforming Darden
http://slidepdf.com/reader/full/starboard-value-transforming-darden 134/294
134
(1) Representative benchmark for major restaurant companies based on advisor’s analysis.
Darden’s advertising mix involves a high level of traditional media, reducing the efficiency of advertising dollars.
The vast majority of Darden’s advertising dollars are spent on expensive, usually low ROI channels.
– Our research indicates that Darden continues to spend significantly on TV, print, and couponing despite the
successful shift by competitors to more contemporary advertising strategies.
– Though Darden has started to spend a little more on online/mobile/social, it is still far behind competitors.
– Darden does not even have an Olive Garden app!
– Darden needs to establish Wi-Fi in restaurants and utilize a mobile app for ordering.
Advertising Expense vs. Global Advertising Restaurant Benchmark (1)
Channel Darden (estimated mix) Industry standard
TV85 ~ 90% 40 ~ 50%
Radio
10 ~ 15%
0 ~ 5%
Online/Mobile/Social 30 ~ 35%
Other 15 ~20%
TOTAL ~100% ~100%
Darden needs to shift its marketing focus to methods that connect with the customer
Darden s marketing efforts are mainly rooted in traditional media, while peers have adapted to moreinnovative methods.
Darden has failed to adopt current and what we believe to be more
effective advertising strategies (cont’d) We believe Darden’s over reliance in traditional advertising and its ineffective messaging are hurting Darden’s
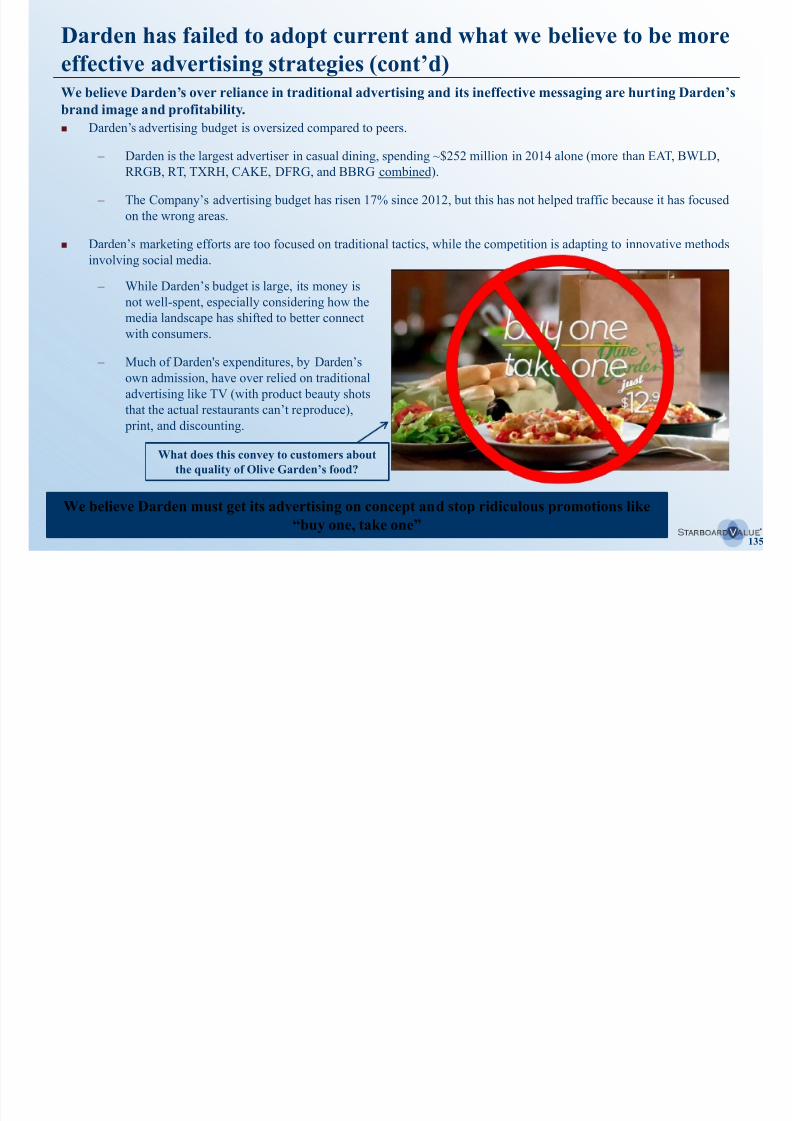
8/11/2019 Starboard Value Transforming Darden
http://slidepdf.com/reader/full/starboard-value-transforming-darden 135/294
135
Darden’s advertising budget is oversized compared to peers.
– Darden is the largest advertiser in casual dining, spending ~$252 million in 2014 alone (more than EAT, BWLD,
RRGB, RT, TXRH, CAKE, DFRG, and BBRG combined).
– The Company’s advertising budget has risen 17% since 2012, but this has not helped traffic because it has focused
on the wrong areas.
Darden’s marketing efforts are too focused on traditional tactics, while the competition is adapting to innovative methods
involving social media.
We believe Darden’s over reliance in traditional advertising and its ineffective messaging are hurting Darden’sbrand image and profitability.
– While Darden’s budget is large, its money is
not well-spent, especially considering how the
media landscape has shifted to better connect
with consumers.
– Much of Darden's expenditures, by Darden’s
own admission, have over relied on traditional
advertising like TV (with product beauty shots
that the actual restaurants can’t reproduce), print, and discounting.
We believe Darden must get its advertising on concept and stop ridiculous promotions like
“buy one, take one”
What does this convey to customers about
the quality of Olive Garden’s food?
Darden is being outmaneuvered by smaller competitors who
appear to use technology to their advantageInnovation is key to growing traffic by attracting new customers while satisfying existing customers
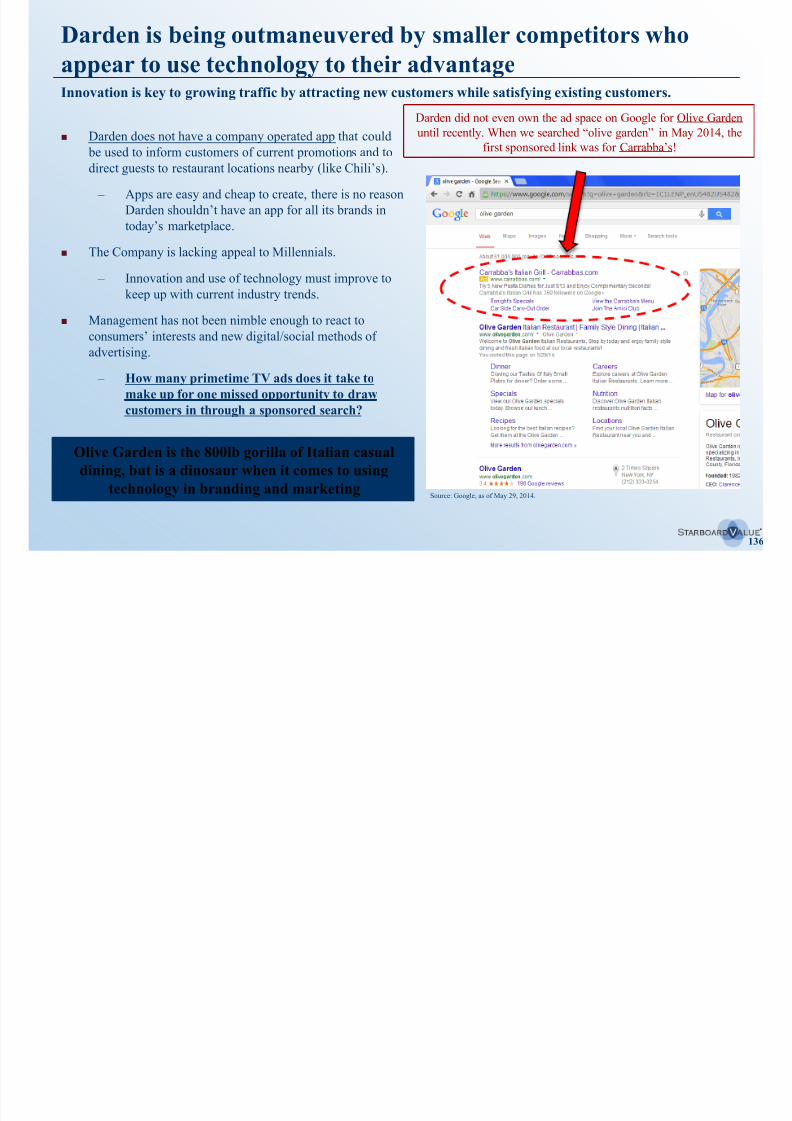
8/11/2019 Starboard Value Transforming Darden
http://slidepdf.com/reader/full/starboard-value-transforming-darden 136/294
136
Darden does not have a company operated app that could
be used to inform customers of current promotions and todirect guests to restaurant locations nearby (like Chili’s).
– Apps are easy and cheap to create, there is no reason
Darden shouldn’t have an app for all its brands in
today’s marketplace.
The Company is lacking appeal to Millennials.
– Innovation and use of technology must improve tokeep up with current industry trends.
Management has not been nimble enough to react to
consumers’ interests and new digital/social methods of
advertising.
– How many primetime TV ads does it take to
make up for one missed opportunity to draw
customers in through a sponsored search?
Innovation is key to growing traffic by attracting new customers while satisfying existing customers.
Darden did not even own the ad space on Google for Olive Garden
until recently. When we searched “olive garden” in May 2014, the
first sponsored link was for Carrabba’s!
Olive Garden is the 800lb gorilla of Italian casual
dining, but is a dinosaur when it comes to using
technology in branding and marketingSource: Google, as of May 29, 2014.
We believe Olive Garden can easily replicate the technology
competitors are utilizing to drive traffic through an outstanding app
Brinker’s app for Chili’s is user friendly and offers customers with valuable options
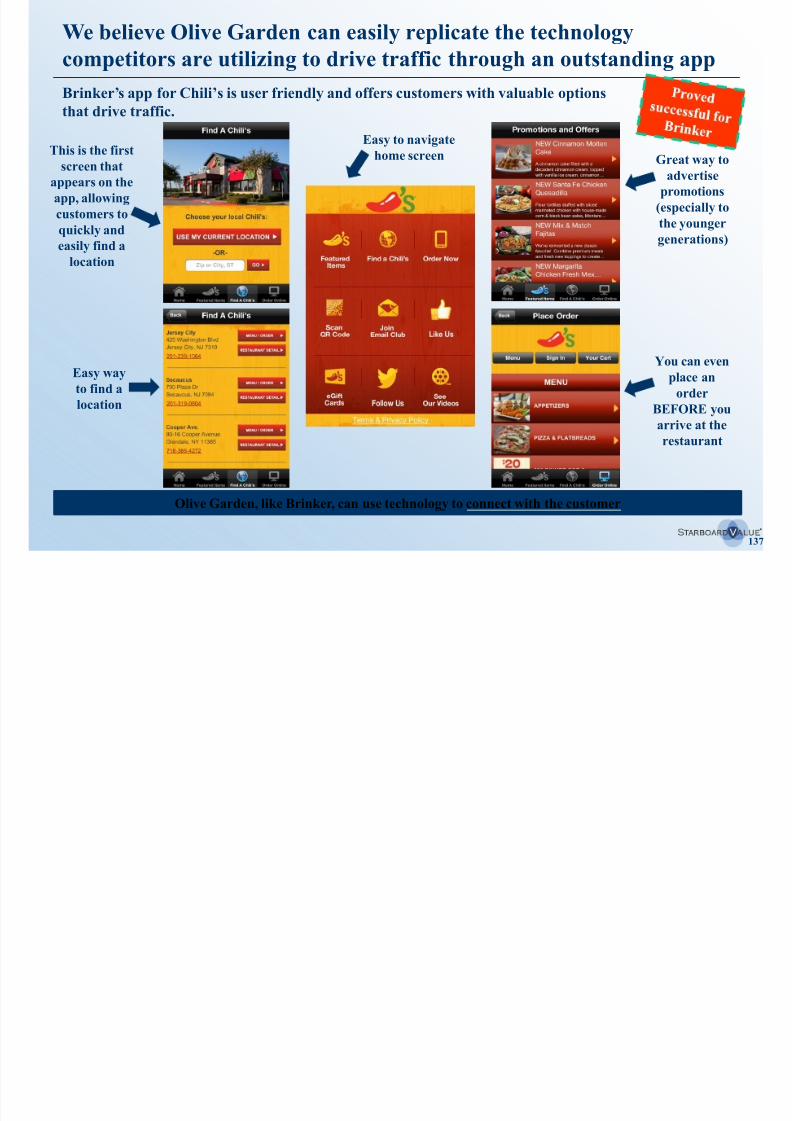
8/11/2019 Starboard Value Transforming Darden
http://slidepdf.com/reader/full/starboard-value-transforming-darden 137/294
137
Brinker s app for Chili s is user friendly and offers customers with valuable optionsthat drive traffic.
Easy way
to find a
location
Great way to
advertise
promotions
(especially to
the younger
generations)
You can even
place an
order
BEFORE youarrive at the
restaurant
This is the firstscreen that
appears on the
app, allowing
customers to
quickly and
easily find a
location
Easy to navigate
home screen
Olive Garden, like Brinker, can use technology to connect with the customer
A significant opportunity exists to optimize the ROI from Darden’sadvertising and marketing expenseWe estimate a $55 - $62 million EBITDA improvement opportunity through a more effective advertising spend
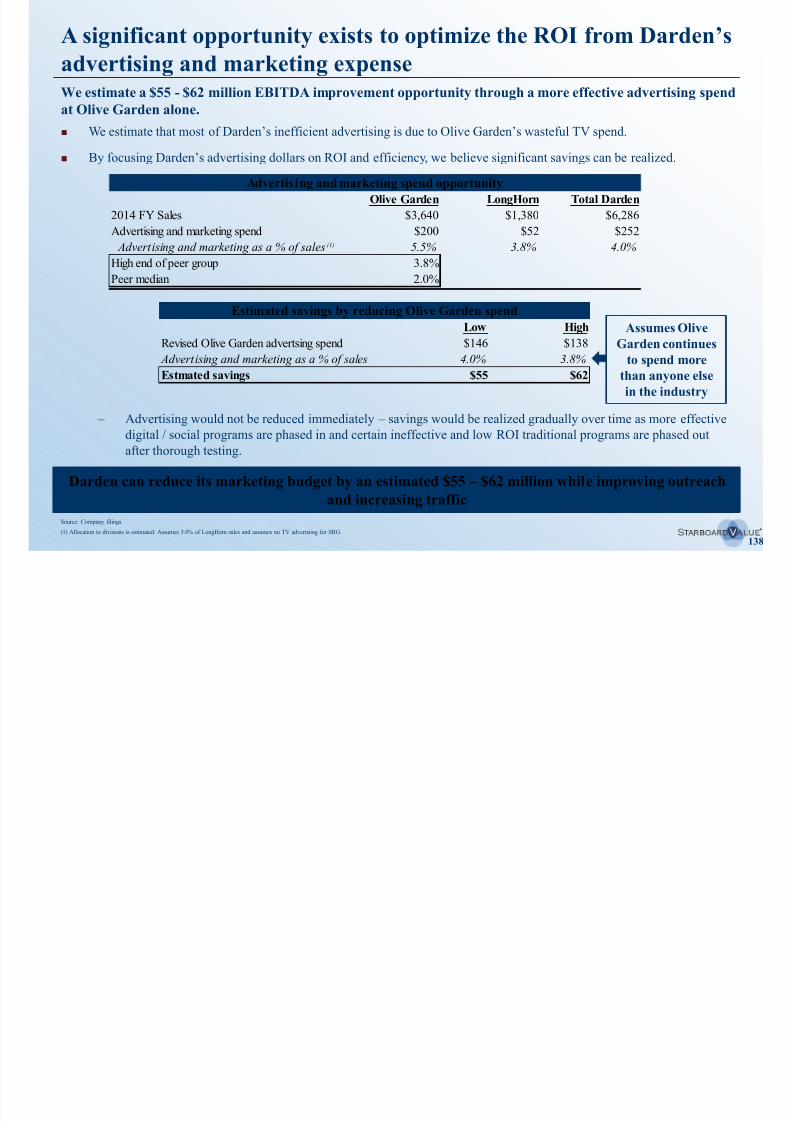
8/11/2019 Starboard Value Transforming Darden
http://slidepdf.com/reader/full/starboard-value-transforming-darden 138/294
138
Source: Company filings.
(1) Allocation to divisions is estimated. Assumes 3.8% of LongHorn sales and assumes no TV advertising for SRG.
We estimate a $55 - $62 million EBITDA improvement opportunity through a more effective advertising spend
at Olive Garden alone.
Darden can reduce its marketing budget by an estimated $55 – $62 million while improving outreach
and increasing traffic
Assumes Olive
Garden continues
to spend more
than anyone else
in the industry
We estimate that most of Darden’s inefficient advertising is due to Olive Garden’s wasteful TV spend.
By focusing Darden’s advertising dollars on ROI and efficiency, we believe significant savings can be realized.
– Advertising would not be reduced immediately – savings would be realized gradually over time as more effective
digital / social programs are phased in and certain ineffective and low ROI traditional programs are phased out
after thorough testing.
(1)
Advertising and marketing spend opportunity
Olive Garden LongHorn Total Darden
2014 FY Sales $3,640 $1,380 $6,286
Advertising and marketing spend $200 $52 $252
Advertising and marketing as a % of sales 5.5% 3.8% 4.0%
High end of peer group 3.8%
Peer median 2.0%
Estimated savings by reducing Olive Garden spend
Low High
Revised Olive Garden advertsing spend $146 $138
Advertising and marketing as a % of sales 4.0% 3.8%
Estmated savings $55 $62
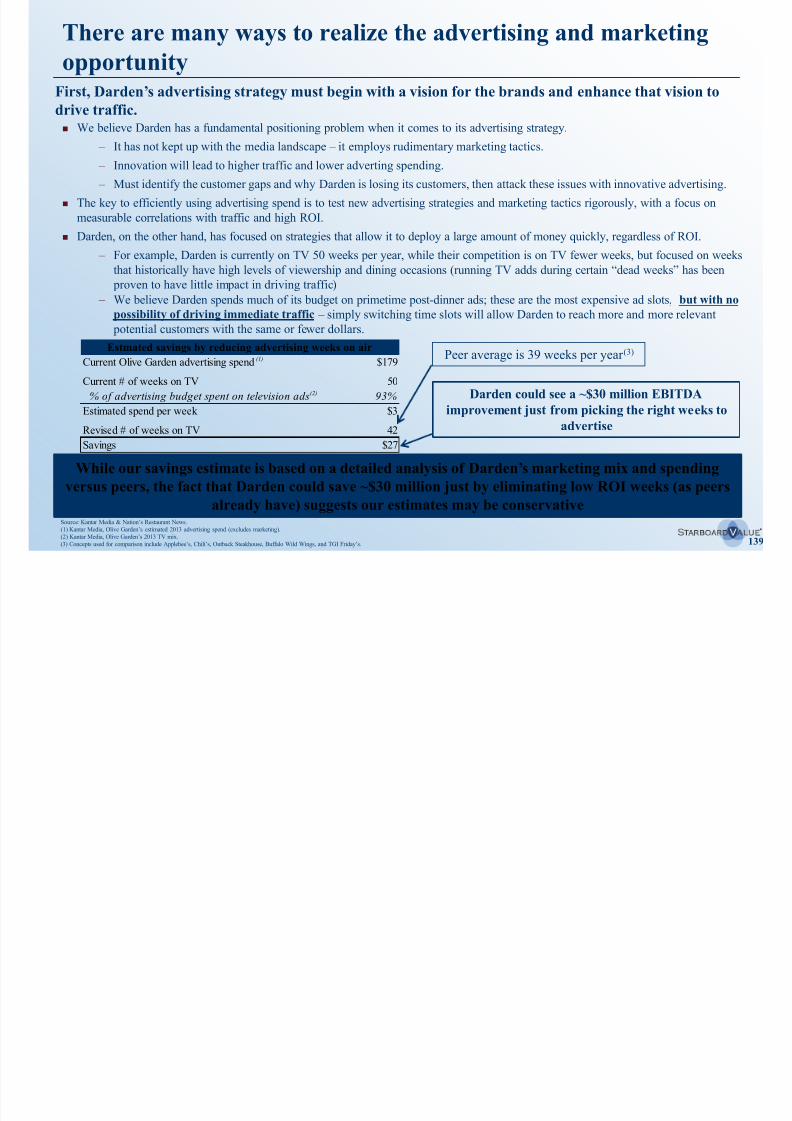
8/11/2019 Starboard Value Transforming Darden
http://slidepdf.com/reader/full/starboard-value-transforming-darden 139/294
Implementing the advertising and marketing opportunity
By aligning advertising spend closer to industry standards at Olive Garden, we estimate Darden could

8/11/2019 Starboard Value Transforming Darden
http://slidepdf.com/reader/full/starboard-value-transforming-darden 140/294
140
Substantially shift
advertising spend to
digital media to mirror
peers.
For print-based
advertising, reduce costs
through a program-basedmodel, instead of job-by-
job transaction model
(through long term
pricing agreements).
Campaign optimization
focused on best mix of
national programming,
local shows, socialmedia, and others.
y g g g p y ,
improve EBITDA by $62 million – coupled with an increase in traffic.
Shift in spending Marketing strategy Digital marketing
Utilize technology and
develop Twitter /
Facebook team.
Develop benchmarks to
evaluate media cost per
thousand (CPM), and
focus on ROImaximization.
Establish nimble strategy
to react to consumers’
interests and new
digital/social methods of
advertising.
Improve mix of value-
based menu vs. limited
time offers (LTOs).
Focus on streamlined and
efficient communication
between marketing
department, suppliers,senior management, and
culinary department.
Evaluate the overall
success of all campaigns,
focus on ROI, and review
success of previous
campaigns instead of
throwing money at TVadvertising and LTOs.
24.6% of cur rent adver tising costs (assumes a ~40%
reduction in traditional media combined with a
~120% increase in digi tal/social media)
Phase-in plan
Analyze advertising spend
with a disciplined focus on
ROI.
Over time, test phasing out
low-ROI TV spend.
First few months will be
spent creating digital media
programs and evaluating
current strategy.
Certain ineffective and low-
ROI traditional media
campaigns will be phased
out gradually as more-
effective new platformsramp.
Previous opportunities $187.0 million
+ Olive Garden advertising and marketing opportunity $62.0 million
Cumulative opportunity $249 million
8/11/2019 Starboard Value Transforming Darden
http://slidepdf.com/reader/full/starboard-value-transforming-darden 141/294
141
V. Company-wide margin improvement
opportunityF. Alcoholic beverage
Improving the alcoholic beverage mix is a substantial opportunity
to increase profits
Adult beverage service is an important and profitable part of casual dining. Darden’s peers have
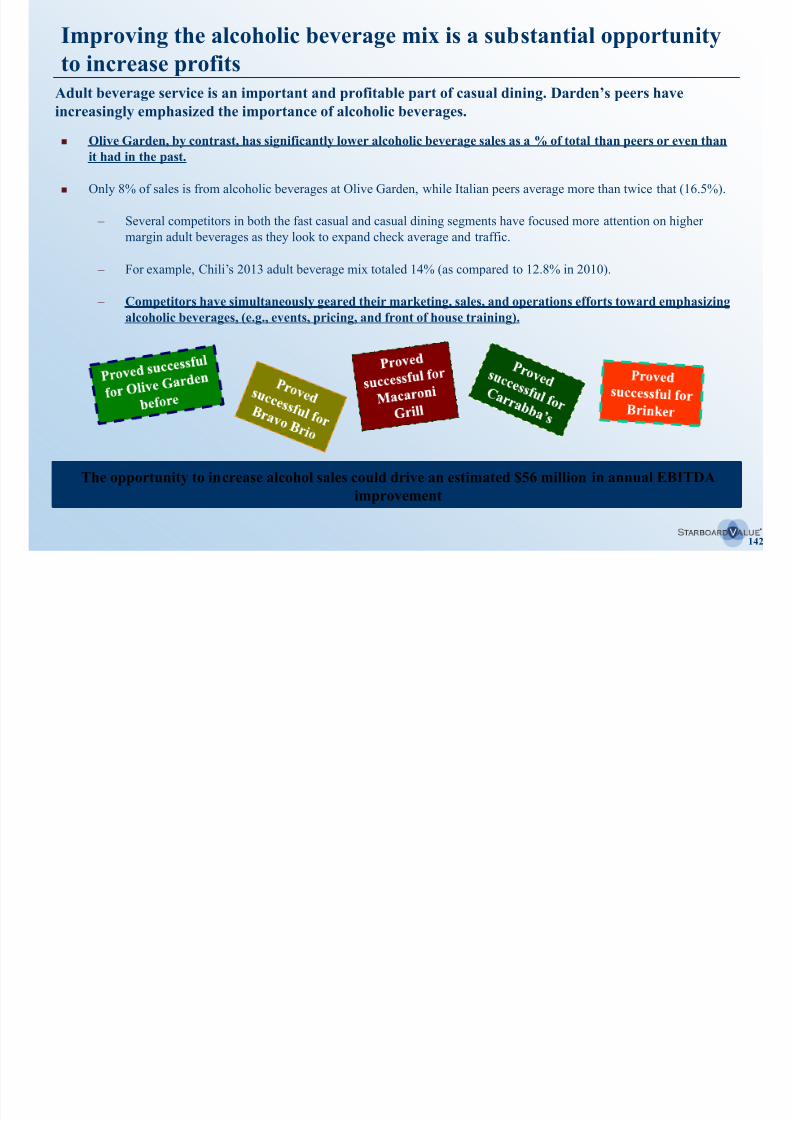
8/11/2019 Starboard Value Transforming Darden
http://slidepdf.com/reader/full/starboard-value-transforming-darden 142/294
142
Olive Garden, by contrast, has significantly lower alcoholic beverage sales as a % of total than peers or even than
it had in the past.
Only 8% of sales is from alcoholic beverages at Olive Garden, while Italian peers average more than twice that (16.5%).
– Several competitors in both the fast casual and casual dining segments have focused more attention on higher
margin adult beverages as they look to expand check average and traffic.
– For example, Chili’s 2013 adult beverage mix totaled 14% (as compared to 12.8% in 2010).
– Competitors have simultaneously geared their marketing, sales, and operations efforts toward emphasizing
alcoholic beverages, (e.g., events, pricing, and front of house training).
The opportunity to increase alcohol sales could drive an estimated $56 million in annual EBITDA
improvement
Adult beverage service is an important and profitable part of casual dining. Darden s peers have
increasingly emphasized the importance of alcoholic beverages.
Given how well wine pairs with Italian food, we believe Italian
concepts should have a high alcohol mixWine is an integral part of the authentic Italian family dining experience. It appears that management
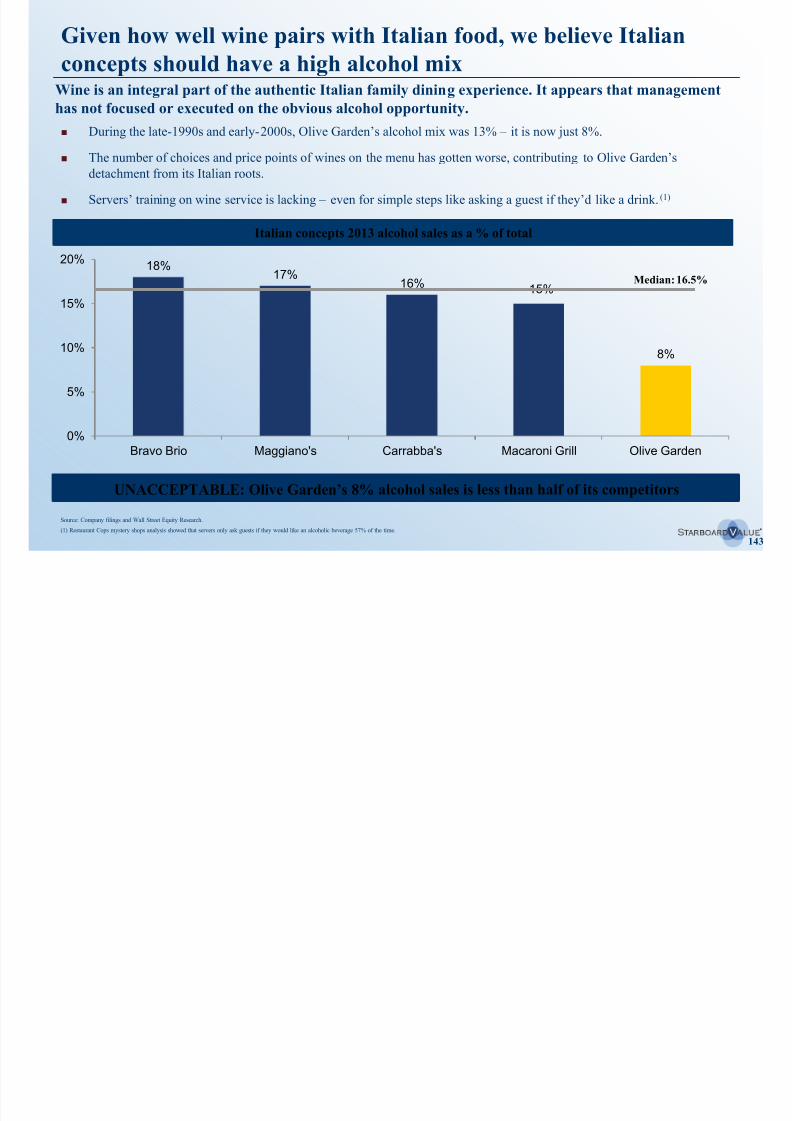
8/11/2019 Starboard Value Transforming Darden
http://slidepdf.com/reader/full/starboard-value-transforming-darden 143/294
143
During the late-1990s and early-2000s, Olive Garden’s alcohol mix was 13% – it is now just 8%.
The number of choices and price points of wines on the menu has gotten worse, contributing to Olive Garden’s
detachment from its Italian roots.
Servers’ training on wine service is lacking – even for simple steps like asking a guest if they’d like a drink.(1)
18%
17% 16% 15%
8%
0%
5%
10%
15%
20%
Bravo Brio Maggiano's Carrabba's Macaroni Grill Olive Garden
Italian concepts 2013 alcohol sales as a % of total
Median: 16.5%
g p y g p pp g
has not focused or executed on the obvious alcohol opportunity.
Source: Company filings and Wall Street Equity Research.
(1) Restaurant Cops mystery shops analysis showed that servers only ask guests if they would like an alcoholic beverage 57% of the time.
UNACCEPTABLE: Olive Garden’s 8% alcohol sales is less than half of its competitors
The Olive Garden customer base is not averse to alcohol, in fact we
believe they prefer alcohol with dinnerOlive Garden customers order alcoholic beverages just as frequently as customers of Olive Garden’s
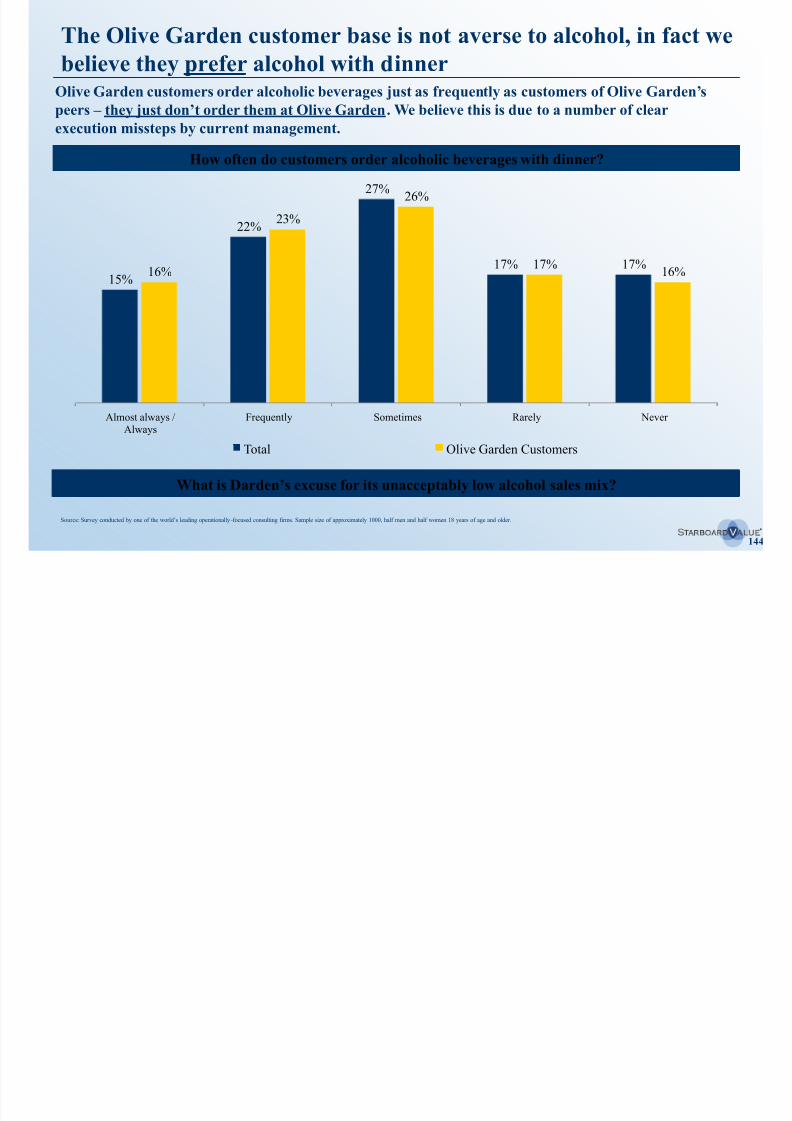
8/11/2019 Starboard Value Transforming Darden
http://slidepdf.com/reader/full/starboard-value-transforming-darden 144/294
144
g j q ypeers – they just don’t order them at Olive Garden. We believe this is due to a number of clear
execution missteps by current management.
15%
22%
27%
17% 17%16%
23%
26%
17%16%
Almost always /Always
Frequently Sometimes Rarely Never
Total Olive Garden Customers
How often do customers order alcoholic beverages with dinner?
What is Darden’s excuse for its unacceptably low alcohol sales mix?
Source: Survey conducted by one of the world’s leading operationally -focused consulting firms. Sample size of approximately 1000, half men and half women 18 years of age and older.
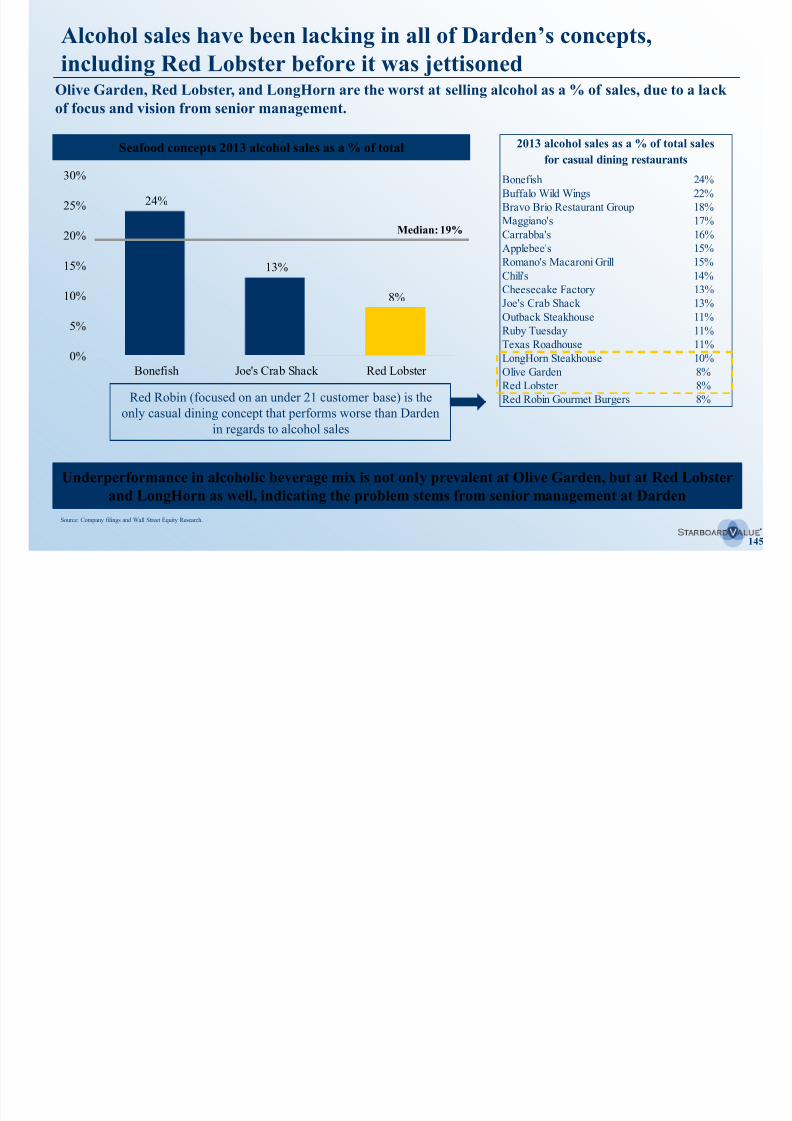
8/11/2019 Starboard Value Transforming Darden
http://slidepdf.com/reader/full/starboard-value-transforming-darden 145/294
LongHorn’s alcohol sales as a % of total lag behind its steakhousepeers
LongHorn alcohol sales lag behind peers by 1 – 2%.
Steakhouse concepts alcohol sales as a % of total
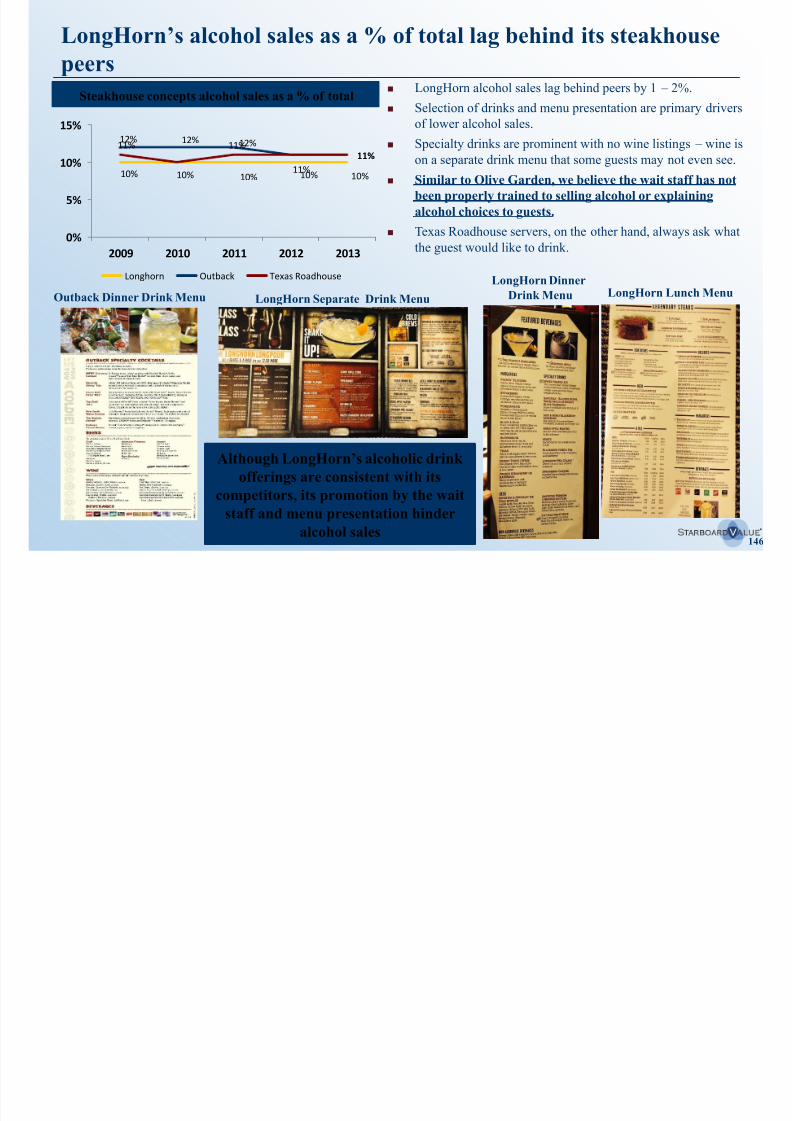
8/11/2019 Starboard Value Transforming Darden
http://slidepdf.com/reader/full/starboard-value-transforming-darden 146/294
146
LongHorn DinnerDrink MenuOutback Dinner Drink Menu LongHorn Lunch Menu
LongHorn Separate Drink Menu
Selection of drinks and menu presentation are primary drivers
of lower alcohol sales.
Specialty drinks are prominent with no wine listings – wine is
on a separate drink menu that some guests may not even see.
Similar to Olive Garden, we believe the wait staff has not
been properly trained to selling alcohol or explaining
alcohol choices to guests.
Texas Roadhouse servers, on the other hand, always ask what
the guest would like to drink.
10% 10% 10% 10%
12% 12% 12%
11%11%
10%
11%
11%
11%
0%
5%
10%
15%
2009 2010 2011 2012 2013
Longhorn Outback Texas Roadhouse
Steakhouse concepts alcohol sales as a % of total
Although LongHorn’s alcoholic drinkofferings are consistent with its
competitors, its promotion by the wait
staff and menu presentation hinder
alcohol sales
Several casual dining peers have successfully launched efforts to
drive significant increases in alcoholic beverage sales
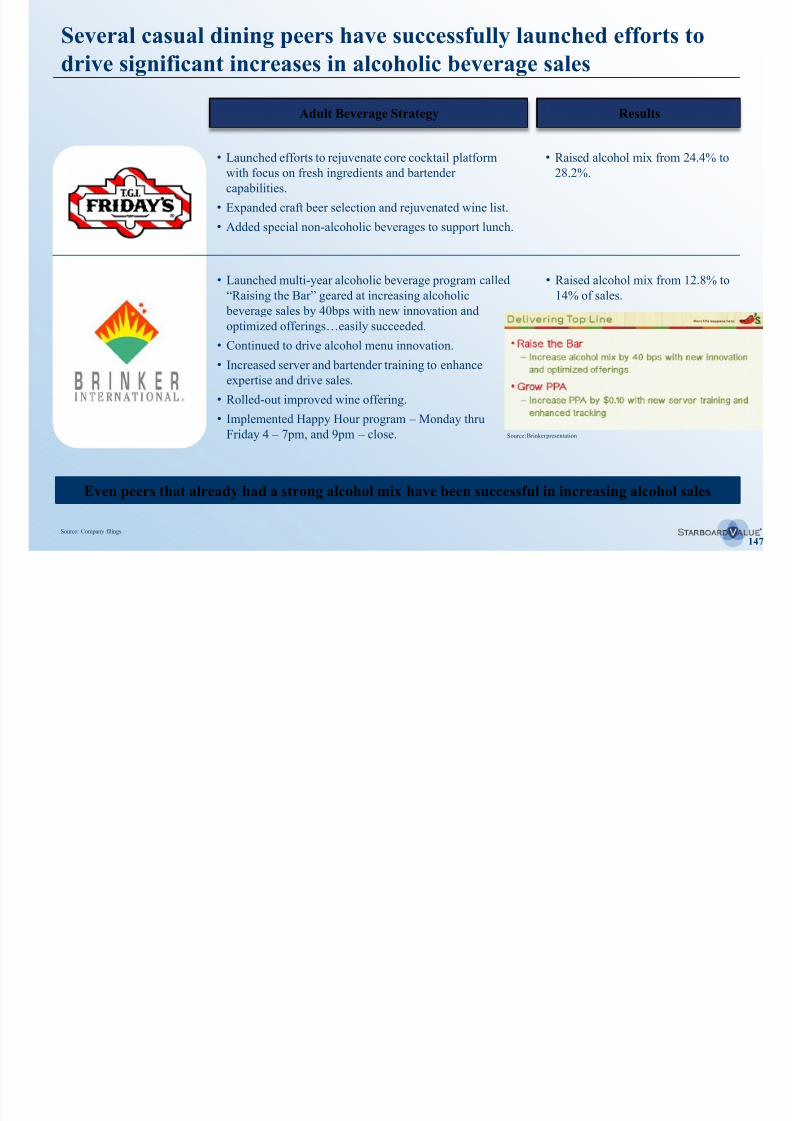
8/11/2019 Starboard Value Transforming Darden
http://slidepdf.com/reader/full/starboard-value-transforming-darden 147/294
147
Source: Company filings.
• Launched efforts to rejuvenate core cocktail platform
with focus on fresh ingredients and bartender
capabilities.
• Expanded craft beer selection and rejuvenated wine list.
• Added special non-alcoholic beverages to support lunch.
• Launched multi-year alcoholic beverage program called“Raising the Bar” geared at increasing alcoholic
beverage sales by 40bps with new innovation and
optimized offerings…easily succeeded.
• Continued to drive alcohol menu innovation.
• Increased server and bartender training to enhance
expertise and drive sales.
• Rolled-out improved wine offering.
• Implemented Happy Hour program – Monday thru
Friday 4 – 7pm, and 9pm – close.
Adult Beverage Strategy Results
• Raised alcohol mix from 24.4% to
28.2%.
• Raised alcohol mix from 12.8% to14% of sales.
Even peers that already had a strong alcohol mix have been successful in increasing alcohol sales
Source: Brinker presentation
Darden can easily implement programs to improve its alcohol sales
mixWe believe Darden needs to follow its peers and implement alcoholic beverage programs.
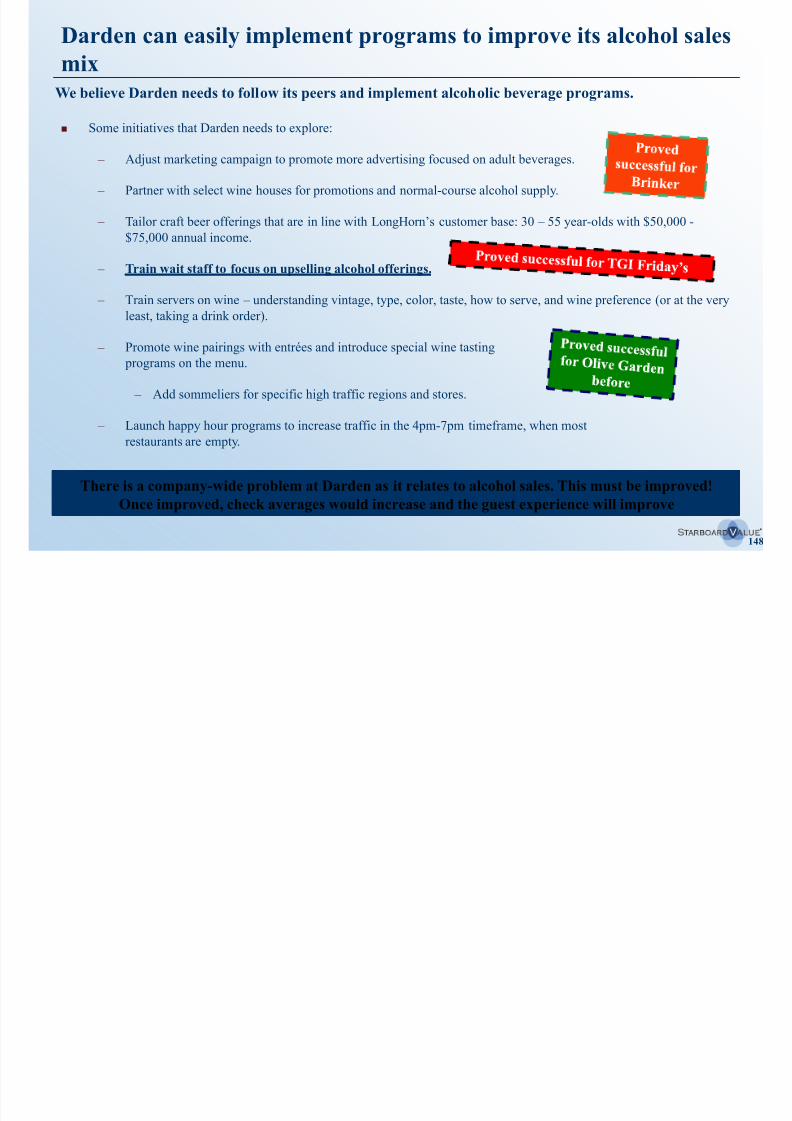
8/11/2019 Starboard Value Transforming Darden
http://slidepdf.com/reader/full/starboard-value-transforming-darden 148/294
148
Some initiatives that Darden needs to explore:
– Adjust marketing campaign to promote more advertising focused on adult beverages.
– Partner with select wine houses for promotions and normal-course alcohol supply.
– Tailor craft beer offerings that are in line with LongHorn’s customer base: 30 – 55 year-olds with $50,000 -
$75,000 annual income.
– Train wait staff to focus on upselling alcohol offerings.
– Train servers on wine – understanding vintage, type, color, taste, how to serve, and wine preference (or at the very
least, taking a drink order).
– Promote wine pairings with entrées and introduce special wine tasting
programs on the menu.
– Add sommeliers for specific high traffic regions and stores.
– Launch happy hour programs to increase traffic in the 4pm-7pm timeframe, when most
restaurants are empty.
p p g p g
There is a company-wide problem at Darden as it relates to alcohol sales. This must be improved!
Once improved, check averages would increase and the guest experience will improve
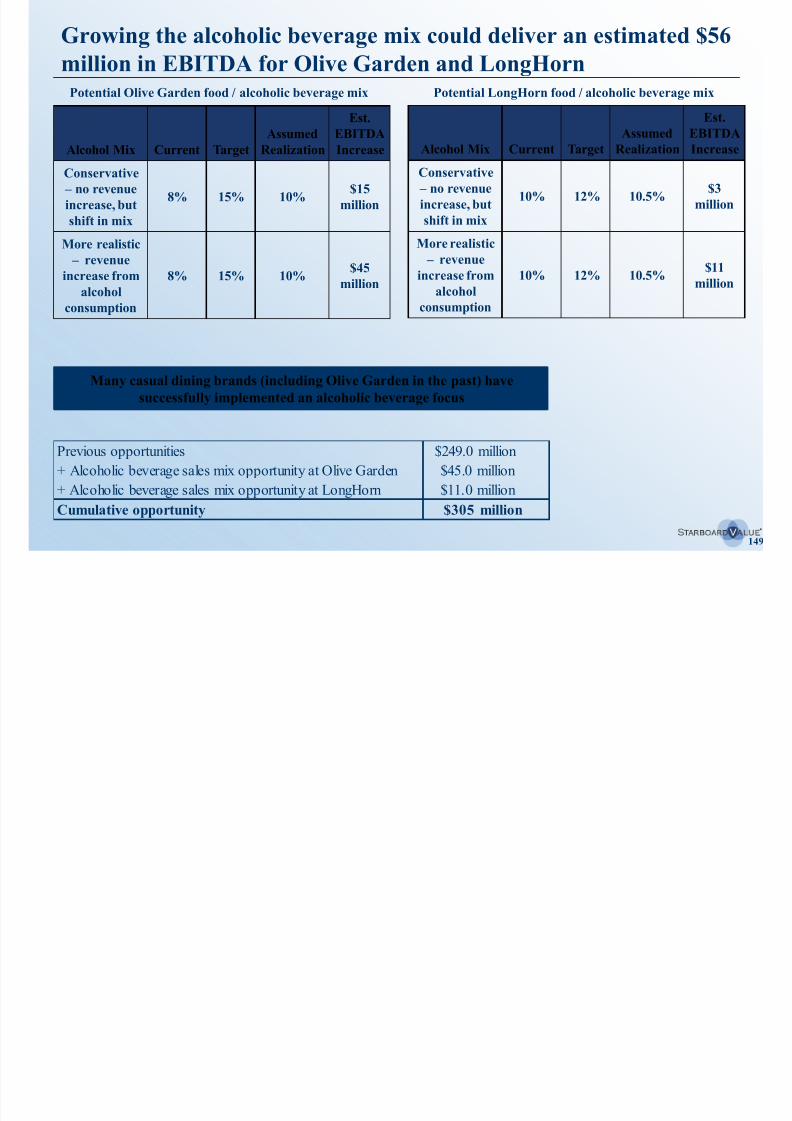
8/11/2019 Starboard Value Transforming Darden
http://slidepdf.com/reader/full/starboard-value-transforming-darden 149/294
8/11/2019 Starboard Value Transforming Darden
http://slidepdf.com/reader/full/starboard-value-transforming-darden 150/294
150
V. Company-wide margin improvement
opportunityG. Table-turns
We believe improving the table turns at Darden’s restaurants(especially Olive Garden) can substantially improve profitability
On Friday and Saturday nights, the average Olive Garden experiences 60-90 minute wait times.(1)
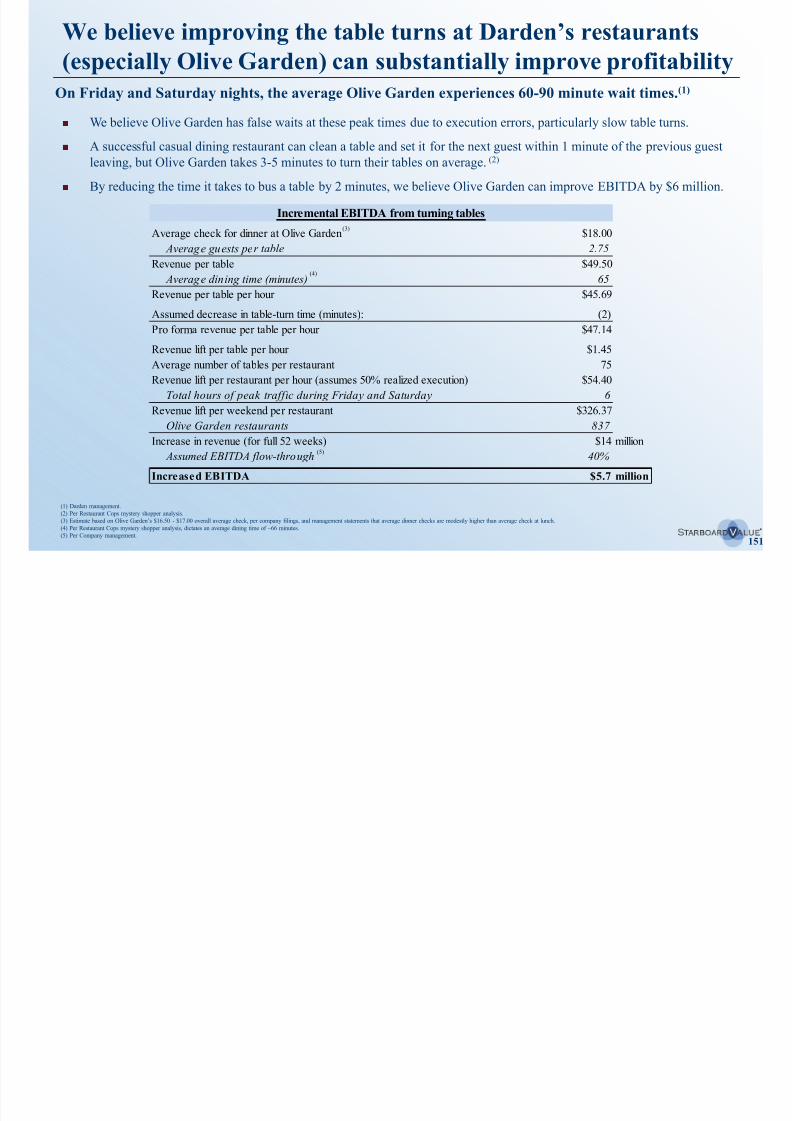
8/11/2019 Starboard Value Transforming Darden
http://slidepdf.com/reader/full/starboard-value-transforming-darden 151/294
151
Incremental EBITDA from turning tables
Average check for dinner at Olive Garden $18.00
Average guests per table 2.75
Revenue per table $49.50
Average dining time (minutes) 65Revenue per table per hour $45.69
Assumed decrease in table-turn time (minutes): (2)
Pro forma revenue per table per hour $47.14
Revenue lift per table per hour $1.45
Average number of tables per restaurant 75
Revenue lift per restaurant per hour (assumes 50% realized execution) $54.40
Total hours of peak traffic during Friday and Saturday 6
Revenue lift per weekend per restaurant $326.37Olive Garden restaurants 837
Increase in revenue (for full 52 weeks) $14 million
Assumed EBITDA flow-through 40%
Increased EBITDA $5.7 million
We believe Olive Garden has false waits at these peak times due to execution errors, particularly slow table turns.
A successful casual dining restaurant can clean a table and set it for the next guest within 1 minute of the previous guestleaving, but Olive Garden takes 3-5 minutes to turn their tables on average. (2)
By reducing the time it takes to bus a table by 2 minutes, we believe Olive Garden can improve EBITDA by $6 million.
(1) Darden management.
(2) Per Restaurant Cops mystery shopper analysis.
(3) Estimate based on Olive Garden’s $16.50 - $17.00 overall average check, per company filings, and management statements that average dinner checks are modestly higher than average check at lunch.
(4) Per Restaurant Cops mystery shopper analysis, dictates an average dining time of ~66 minutes.
(5) Per Company management.
(3)
(4)
(5)
A successful rollout of tabletop tablets could lead to more efficient
dining experiences, further reducing wait times
“Darden remains behind the competition when it comes to implementing technology at restaurants. The use
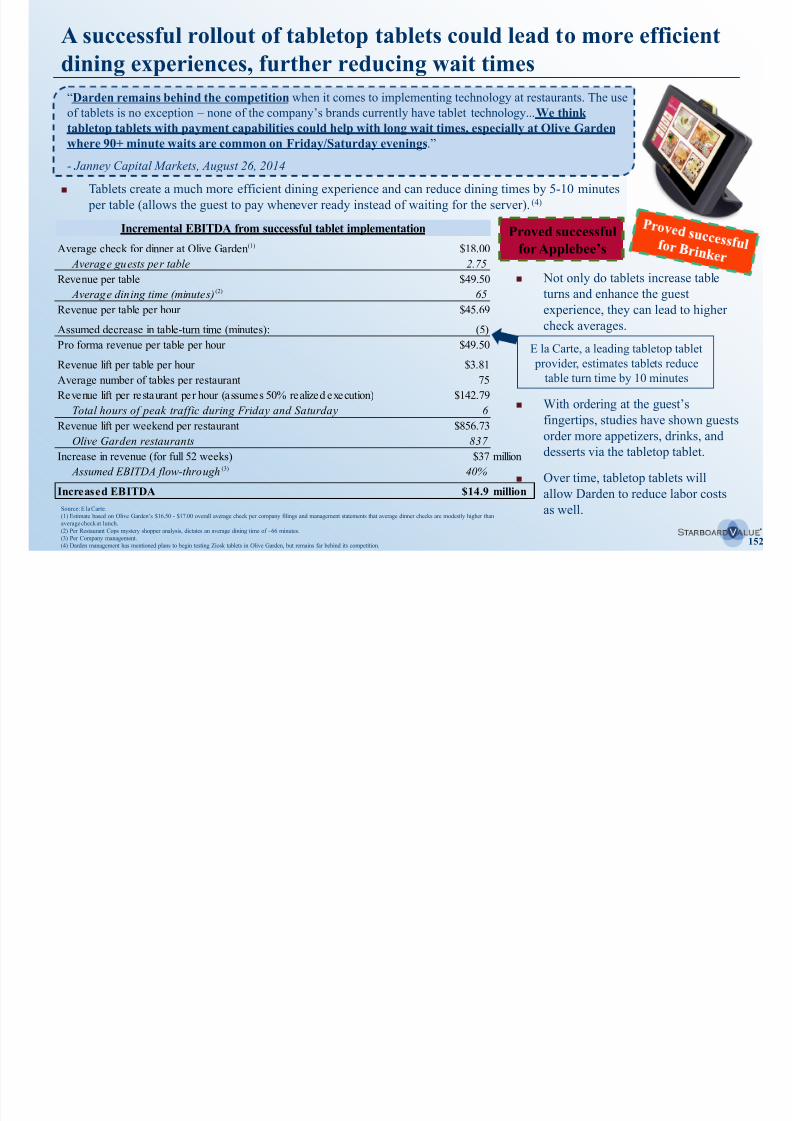
8/11/2019 Starboard Value Transforming Darden
http://slidepdf.com/reader/full/starboard-value-transforming-darden 152/294
152
Incremental EBITDA from successful tablet implementation
Average check for dinner at Olive Garden $18.00
Average guests per table 2.75
Revenue per table $49.50 Average dining time (minutes) 65
Revenue per table per hour $45.69
Assumed decrease in table-turn time (minutes): (5)
Pro forma revenue per table per hour $49.50
Revenue lift per table per hour $3.81
Average number of tables per restaurant 75
Revenue lift per restaurant per hour (assumes 50% realized execution) $142.79
Total hours of peak traffic during Friday and Saturday 6 Revenue lift per weekend per restaurant $856.73
Olive Garden restaurants 837
Increase in revenue (for full 52 weeks) $37 million
Assumed EBITDA flow-through 40%
Increased EBITDA $14.9 million
Tablets create a much more efficient dining experience and can reduce dining times by 5-10 minutes
per table (allows the guest to pay whenever ready instead of waiting for the server).(4)
Not only do tablets increase tableturns and enhance the guest
experience, they can lead to higher
check averages.
With ordering at the guest’s
fingertips, studies have shown guests
order more appetizers, drinks, and
desserts via the tabletop tablet.
Over time, tabletop tablets will
allow Darden to reduce labor costs
as well.Source: E la Carte.
(1) Estimate based on Olive Garden’s $16.50 - $17.00 overall average check per company filings and management statements that average dinner checks are modestly higher than
average check at lunch.
(2) Per Restaurant Cops mystery shopper analysis, dictates an average dining time of ~66 minutes.
(3) Per Company management.(4) Darden management has mentioned plans to begin testing Ziosk tablets in Olive Garden, but remains far behind its competition.
(1)
(2)
(3)
E la Carte, a leading tabletop tablet
provider, estimates tablets reduce
table turn time by 10 minutes
Proved successful
for Applebee’s
p p g gy
of tablets is no exception – none of the company’s brands currently have tablet technology...We think
tabletop tablets with payment capabilities could help with long wait times, especially at Olive Garden
where 90+ minute waits are common on Friday/Saturday evenings.”
- Janney Capital Markets, August 26, 2014
Apps can help Darden to improve table turns, further reducing
wait times, and enhancing the guest experience
For example, OpenTable and TGI Friday’s (introduced in 2012) apps allow the customer to pay their
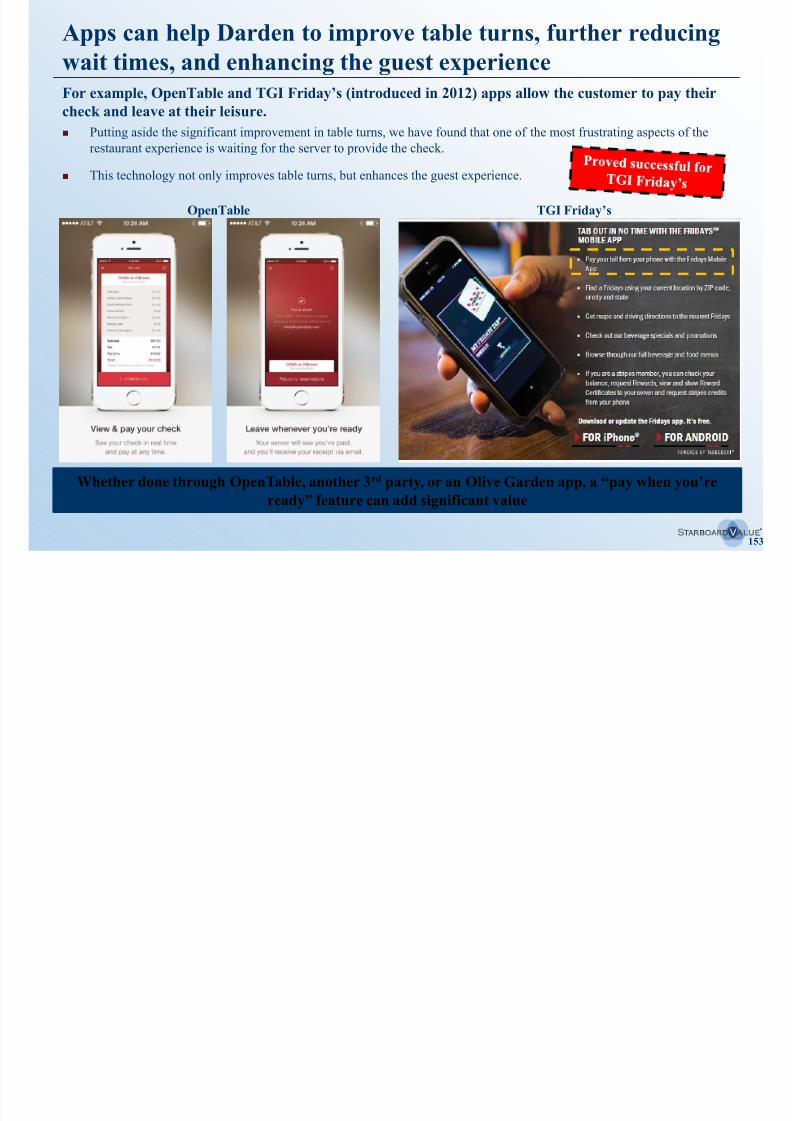
8/11/2019 Starboard Value Transforming Darden
http://slidepdf.com/reader/full/starboard-value-transforming-darden 153/294
153
check and leave at their leisure.
Putting aside the significant improvement in table turns, we have found that one of the most frustrating aspects of the
restaurant experience is waiting for the server to provide the check.
This technology not only improves table turns, but enhances the guest experience.
Whether done through OpenTable, another 3rd party, or an Olive Garden app, a “pay when you’reready” feature can add significant value
TGI Friday’s OpenTable
Improving table turns at Olive Garden can deliver an estimated$20 million in EBITDA improvements
Due to waits at Olive Garden on Friday and Saturday nights, there is an opportunity to greatly improve
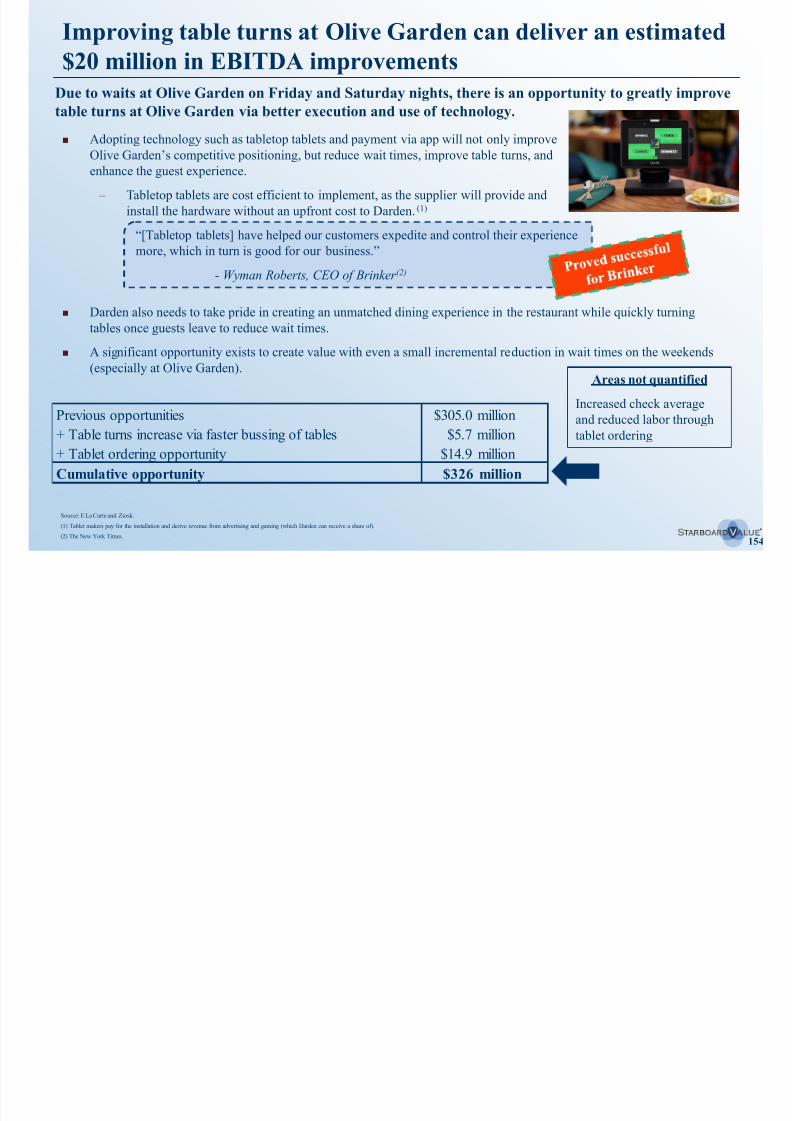
8/11/2019 Starboard Value Transforming Darden
http://slidepdf.com/reader/full/starboard-value-transforming-darden 154/294
154
Adopting technology such as tabletop tablets and payment via app will not only improve
Olive Garden’s competitive positioning, but reduce wait times, improve table turns, andenhance the guest experience.
– Tabletop tablets are cost efficient to implement, as the supplier will provide and
install the hardware without an upfront cost to Darden.(1)
“[Tabletop tablets] have helped our customers expedite and control their experience
more, which in turn is good for our business.”
- Wyman Roberts, CEO of Brinker (2)
table turns at Olive Garden via better execution and use of technology.
Areas not quantified
Increased check average
and reduced labor through
tablet ordering
Source: E La Carte and Ziosk.
(1) Tablet makers pay for the installation and derive revenue from advertising and gaming (which Darden can receive a share of).
(2) The New York Times.
Darden also needs to take pride in creating an unmatched dining experience in the restaurant while quickly turning
tables once guests leave to reduce wait times.
A significant opportunity exists to create value with even a small incremental reduction in wait times on the weekends
(especially at Olive Garden).
Previous opportunities $305.0 million+ Table turns increase via faster bussing of tables $5.7 million
+ Tablet ordering opportunity $14.9 million
Cumulative opportunity $326 million

8/11/2019 Starboard Value Transforming Darden
http://slidepdf.com/reader/full/starboard-value-transforming-darden 155/294
155
V. Company-wide margin improvement
opportunity
H. Summary
An operationally focused management team can substantially
improve annual EBITDA
Midpoint of potential EBITDA impact from enhanced operational execution ($ in millions)
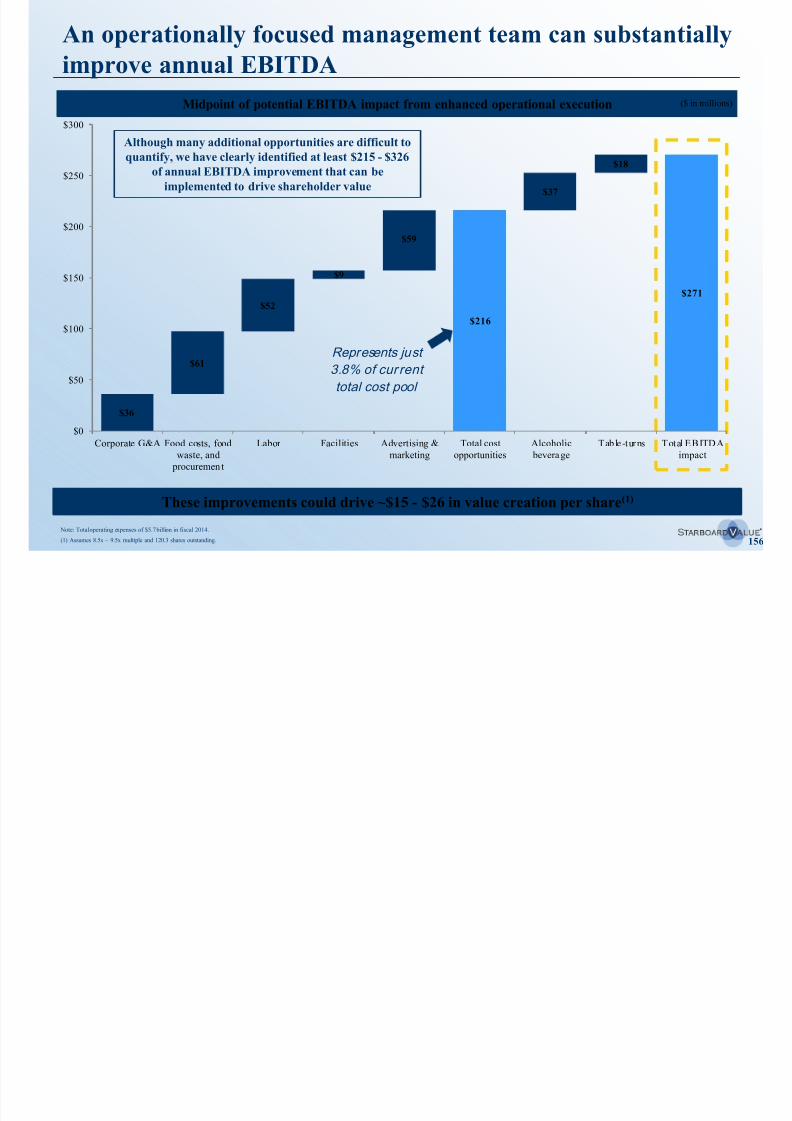
8/11/2019 Starboard Value Transforming Darden
http://slidepdf.com/reader/full/starboard-value-transforming-darden 156/294
156
Midpoint of potential EBITDA impact from enhanced operational execution ($ )
Although many additional opportunities are difficult to
quantify, we have clearly identified at least $215 - $326of annual EBITDA improvement that can be
implemented to drive shareholder value
Note: Total operating expenses of $5.7 billion in fiscal 2014.
(1) Assumes 8.5x – 9.5x multiple and 120.3 shares outstanding.
These improvements could drive ~$15 - $26 in value creation per share(1)
Represents just
3.8% of cur rent
total cost pool
$36
$216
$271
$61
$52
$9
$59
$37
$18
$0
$50
$100
$150
$200
$250
$300
Corporate G&A Food costs, food
waste, and procuremen t
Labor Facilities Advertising &
marketing
Total cost
opportunities
Alcoholic
beverage
Table-turns Total EBITDA
impact
Summary of potential EBITDA impact from quantifiablemargin opportunities
EBITDA improvement opportunity $ of EBITDA increase Value per share
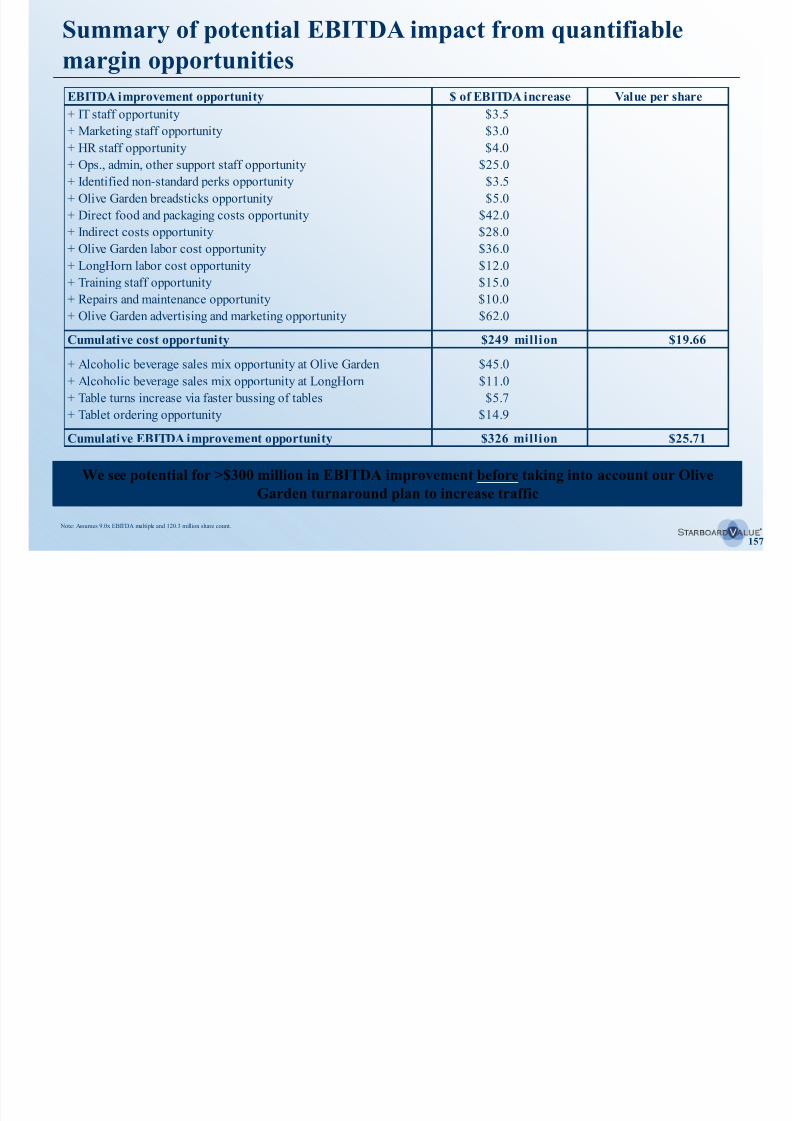
8/11/2019 Starboard Value Transforming Darden
http://slidepdf.com/reader/full/starboard-value-transforming-darden 157/294
157
Note: Assumes 9.0x EBITDA multiple and 120.3 million share count.
We see potential for >$300 million in EBITDA improvement before taking into account our Olive
Garden turnaround plan to increase traffic
+ IT staff opportunity $3.5
+ Marketing staff opportunity $3.0
+ HR staff opportunity $4.0+ Ops., admin, other support staff opportunity $25.0
+ Identified non-standard perks opportunity $3.5
+ Olive Garden breadsticks opportunity $5.0
+ Direct food and packaging costs opportunity $42.0
+ Indirect costs opportunity $28.0
+ Olive Garden labor cost opportunity $36.0
+ LongHorn labor cost opportunity $12.0
+ Training staff opportunity $15.0+ Repairs and maintenance opportunity $10.0
+ Olive Garden advertising and marketing opportunity $62.0
Cumulative cost opportunity $249 million $19.66
+ Alcoholic beverage sales mix opportunity at Olive Garden $45.0
+ Alcoholic beverage sales mix opportunity at LongHorn $11.0
+ Table turns increase via faster bussing of tables $5.7
+ Tablet ordering opportunity $14.9
Cumulative EBITDA improvement opportunity $326 million $25.71
Benchmarking the high-end of our identified EBITDAimprovements suggest our estimates may be conservative
Darden’s costs as a % of sales would still be above peers even AFTER implementing our identified savings.
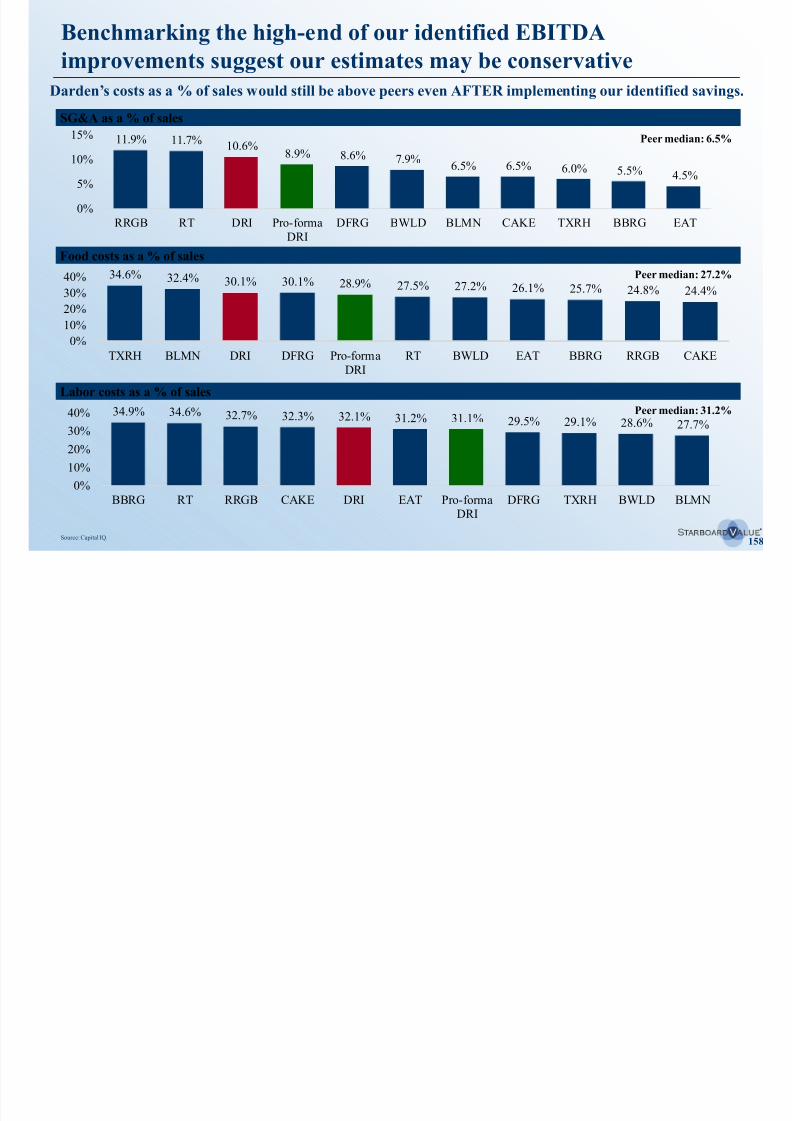
8/11/2019 Starboard Value Transforming Darden
http://slidepdf.com/reader/full/starboard-value-transforming-darden 158/294
158
SG&A as a % of sales
11.9% 11.7%10.6%
8.9% 8.6% 7.9%6.5% 6.5% 6.0% 5.5% 4.5%
0%
5%
10%
15%
RRGB RT DRI Pro-formaDRI
DFRG BWLD BLMN CAKE TXRH BBRG EAT
Food costs as a % of sales
Labor costs as a % of sales
34.9% 34.6% 32.7% 32.3% 32.1% 31.2% 31.1% 29.5% 29.1% 28.6% 27.7%
0%
10%
20%
30%40%
BBRG RT RRGB CAKE DRI EAT Pro-formaDRI
DFRG TXRH BWLD BLMN
Source: Capital IQ.
Peer median: 6.5%
Peer median: 27.2%
Peer median: 31.2%
34.6%32.4% 30.1% 30.1% 28.9% 27.5% 27.2% 26.1% 25.7% 24.8% 24.4%
0%
10%
20%
30%40%
TXRH BLMN DRI DFRG Pro-formaDRI
RT BWLD EAT BBRG RRGB CAKE
8/11/2019 Starboard Value Transforming Darden
http://slidepdf.com/reader/full/starboard-value-transforming-darden 159/294
Olive Garden has seemingly lost its way…but we believe it canbe turned aroundTo return to an industry leading and profitable position, Olive Garden must address the basics of
operating efficient restaurants
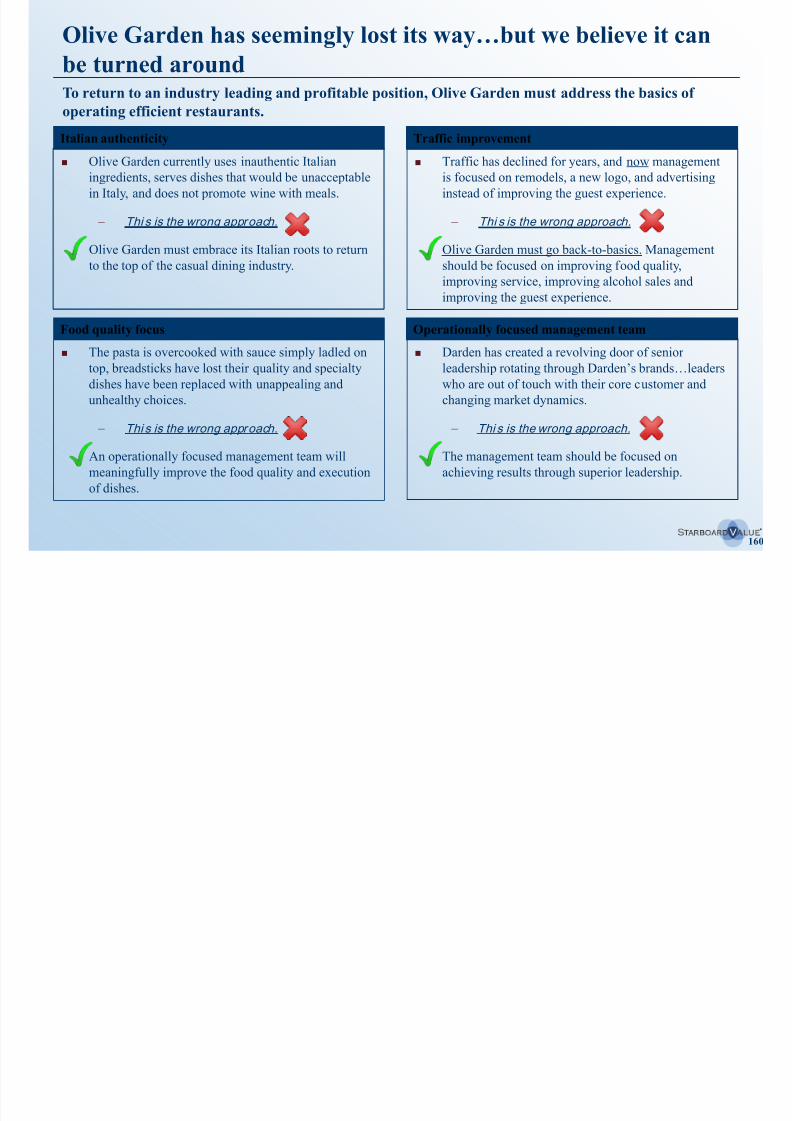
8/11/2019 Starboard Value Transforming Darden
http://slidepdf.com/reader/full/starboard-value-transforming-darden 160/294
160
Italian authenticity
Food quality focus
operating efficient restaurants.
Traffic improvement
Operationally focused management team
The pasta is overcooked with sauce simply ladled on
top, breadsticks have lost their quality and specialty
dishes have been replaced with unappealing and
unhealthy choices.
– Thi s is the wrong approach.
An operationally focused management team will
meaningfully improve the food quality and execution
of dishes.
Darden has created a revolving door of senior
leadership rotating through Darden’s brands…leaders
who are out of touch with their core customer and
changing market dynamics.
– Thi s is the wrong approach.
The management team should be focused on
achieving results through superior leadership.
Olive Garden currently uses inauthentic Italian
ingredients, serves dishes that would be unacceptable
in Italy, and does not promote wine with meals.
– Thi s is the wrong approach.
Olive Garden must embrace its Italian roots to return
to the top of the casual dining industry.
Traffic has declined for years, and now management
is focused on remodels, a new logo, and advertising
instead of improving the guest experience.
– Thi s is the wrong approach.
Olive Garden must go back-to-basics. Management
should be focused on improving food quality,
improving service, improving alcohol sales andimproving the guest experience.
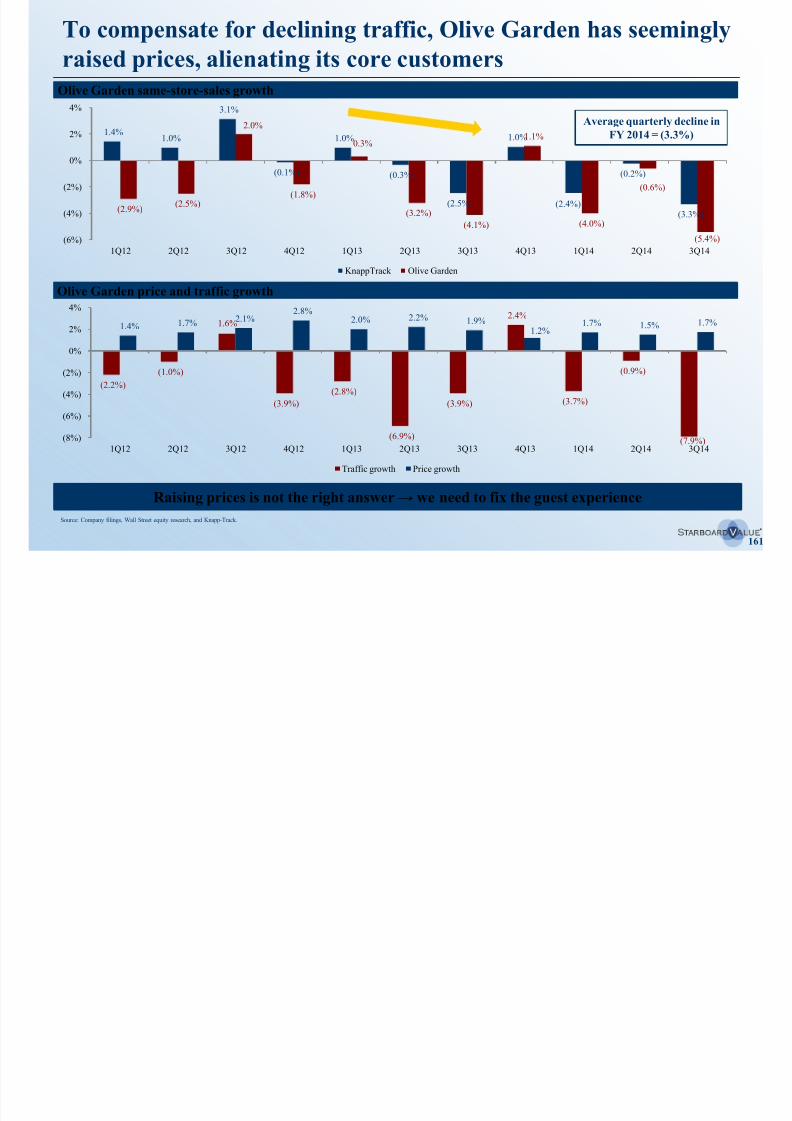
8/11/2019 Starboard Value Transforming Darden
http://slidepdf.com/reader/full/starboard-value-transforming-darden 161/294
Olive Garden has seemingly lost its Italian heritage andauthenticityOlive Garden has moved away from its authentic Italian roots and now offers what appears to be a
low-end Italian-American experience.
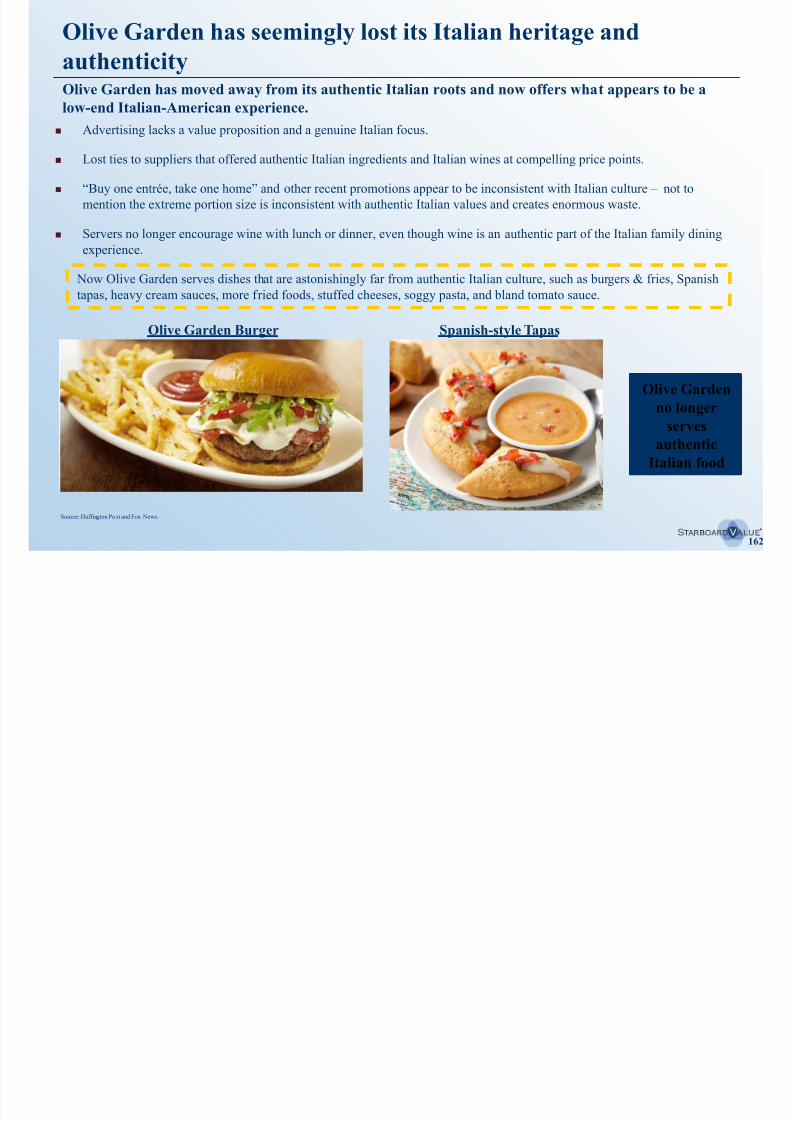
8/11/2019 Starboard Value Transforming Darden
http://slidepdf.com/reader/full/starboard-value-transforming-darden 162/294
162
Advertising lacks a value proposition and a genuine Italian focus.
Lost ties to suppliers that offered authentic Italian ingredients and Italian wines at compelling price points.
“Buy one entrée, take one home” and other recent promotions appear to be inconsistent with Italian culture – not to
mention the extreme portion size is inconsistent with authentic Italian values and creates enormous waste.
Servers no longer encourage wine with lunch or dinner, even though wine is an authentic part of the Italian family dining
experience.
Now Olive Garden serves dishes that are astonishingly far from authentic Italian culture, such as burgers & fries, Spanishtapas, heavy cream sauces, more fried foods, stuffed cheeses, soggy pasta, and bland tomato sauce.
Source: Huffington Po st and Fox News.
Olive Garden Burger Spanish-style Tapas
low end Italian American experience.
Olive Garden
no longerserves
authentic
Italian food
Food quality appears to have deteriorated significantly
We believe the pasta is poorly handled and generally overcooked.
Olive Garden’s food quality has deteriorated while competitors’ has improved.
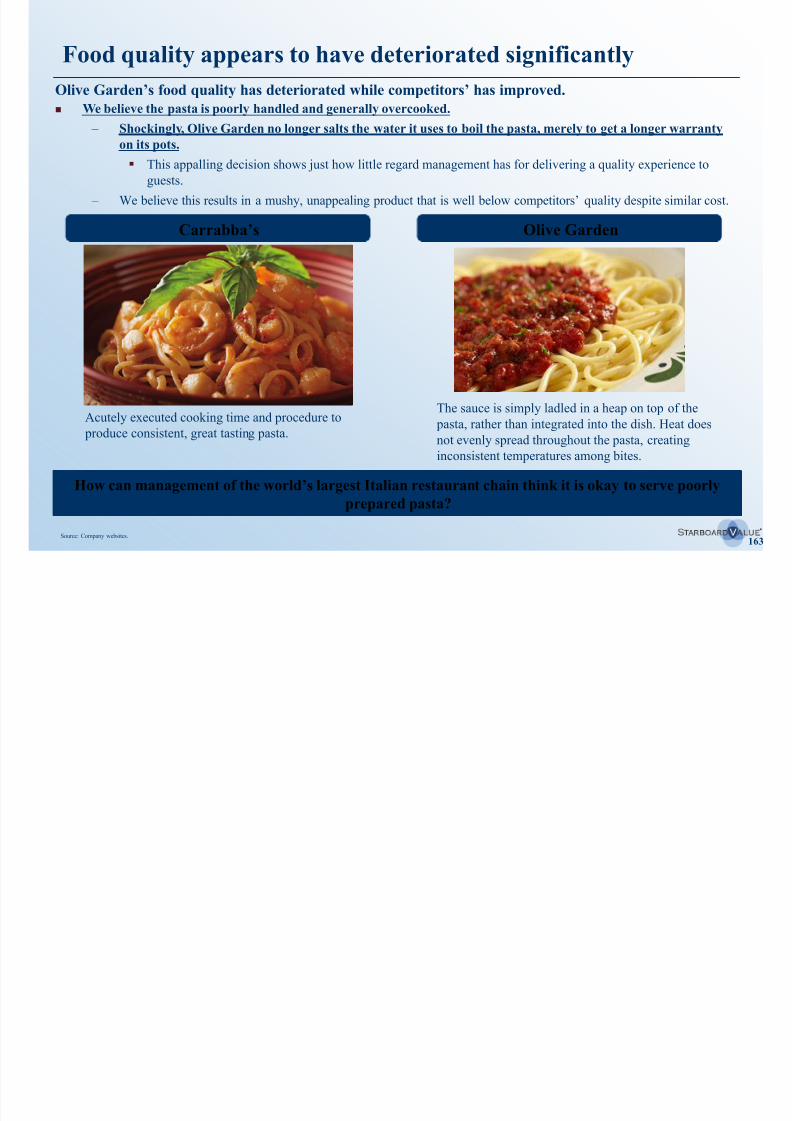
8/11/2019 Starboard Value Transforming Darden
http://slidepdf.com/reader/full/starboard-value-transforming-darden 163/294
163
We believe the pasta is poorly handled and generally overcooked.
– Shockingly, Olive Garden no longer salts the water it uses to boil the pasta, merely to get a longer warranty
on its pots.
This appalling decision shows just how little regard management has for delivering a quality experience to
guests.
– We believe this results in a mushy, unappealing product that is well below competitors’ quality despite similar cost.
Carrabba’s Olive Garden
The sauce is simply ladled in a heap on top of the pasta, rather than integrated into the dish. Heat does
not evenly spread throughout the pasta, creating
inconsistent temperatures among bites.
Acutely executed cooking time and procedure to produce consistent, great tasting pasta.
Source: Company websites.
How can management of the world’s largest Italian restaurant chain think it is okay to serve poorlyprepared pasta?
Darden stopped salting the water in which it boils pasta
According to Darden management, Darden decided to stop salting the water to get an extended
warranty on their pots Pasta is Olive Garden’s core dish and must be prepared properly
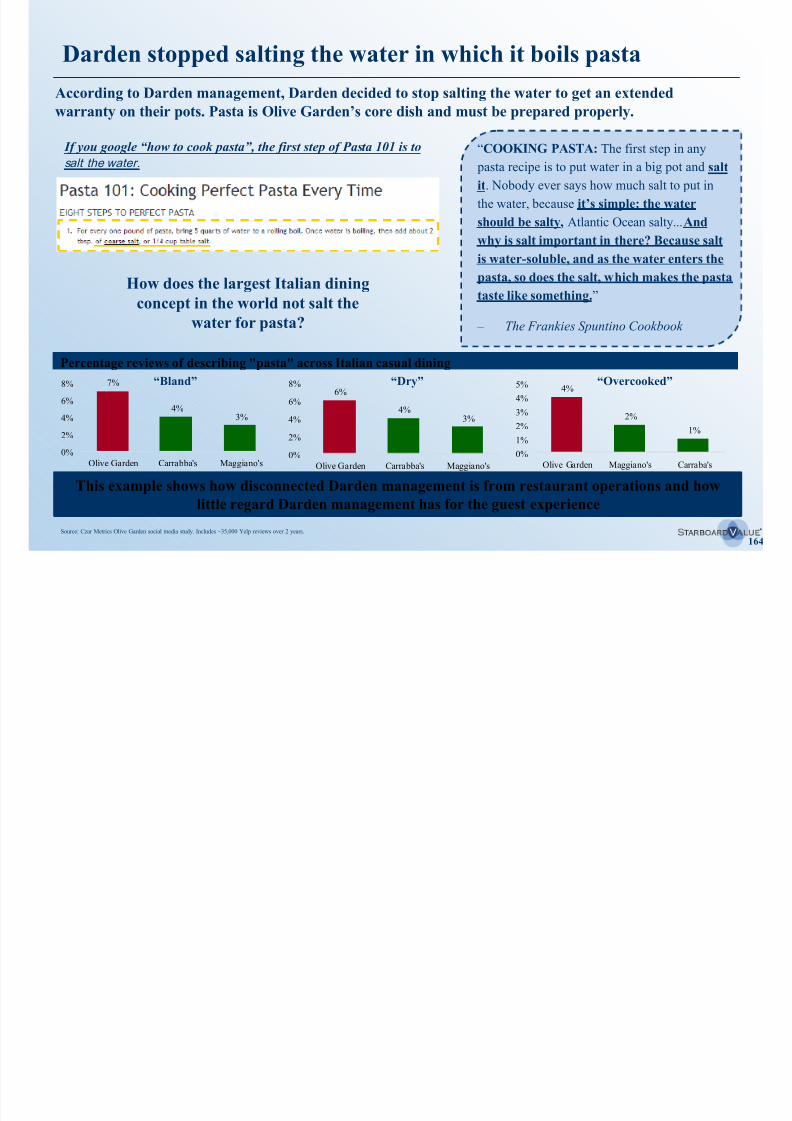
8/11/2019 Starboard Value Transforming Darden
http://slidepdf.com/reader/full/starboard-value-transforming-darden 164/294
164
warranty on their pots. Pasta is Olive Garden s core dish and must be prepared properly.
This example shows how disconnected Darden management is from restaurant operations and how
little regard Darden management has for the guest experience
If you google “how to cook pasta”, the first step of Pasta 101 is to
salt the water.
How does the largest Italian diningconcept in the world not salt the
water for pasta?
“COOKING PASTA: The first step in any pasta recipe is to put water in a big pot and salt
it. Nobody ever says how much salt to put in
the water, because it’s simple: the watershould be salty, Atlantic Ocean salty...And
why is salt important in there? Because salt
is water-soluble, and as the water enters the
pasta, so does the salt, which makes the pastataste like something.”
– The Frankies Spuntino Cookbook
Source: Czar Metrics Olive Garden social media study. Includes ~35,000 Yelp reviews over 2 years.
7%
4% 3%
0%
2%
4%
6%
8%
Olive Garden Carrabba's Maggiano's
Percentage reviews of describing "pasta" across Italian casual dining
“Bland” “Dry” “Overcooked” 6%
4% 3%
0%
2%
4%
6%
8%
Olive Garden Carrabba's Maggiano's
4%
2%
1%
0%
1%
2%3%
4%
5%
Olive Garden Maggiano's Carraba's
Food quality appears to have deteriorated significantly
The preparation of the breadsticks appears to have changed for the worse.
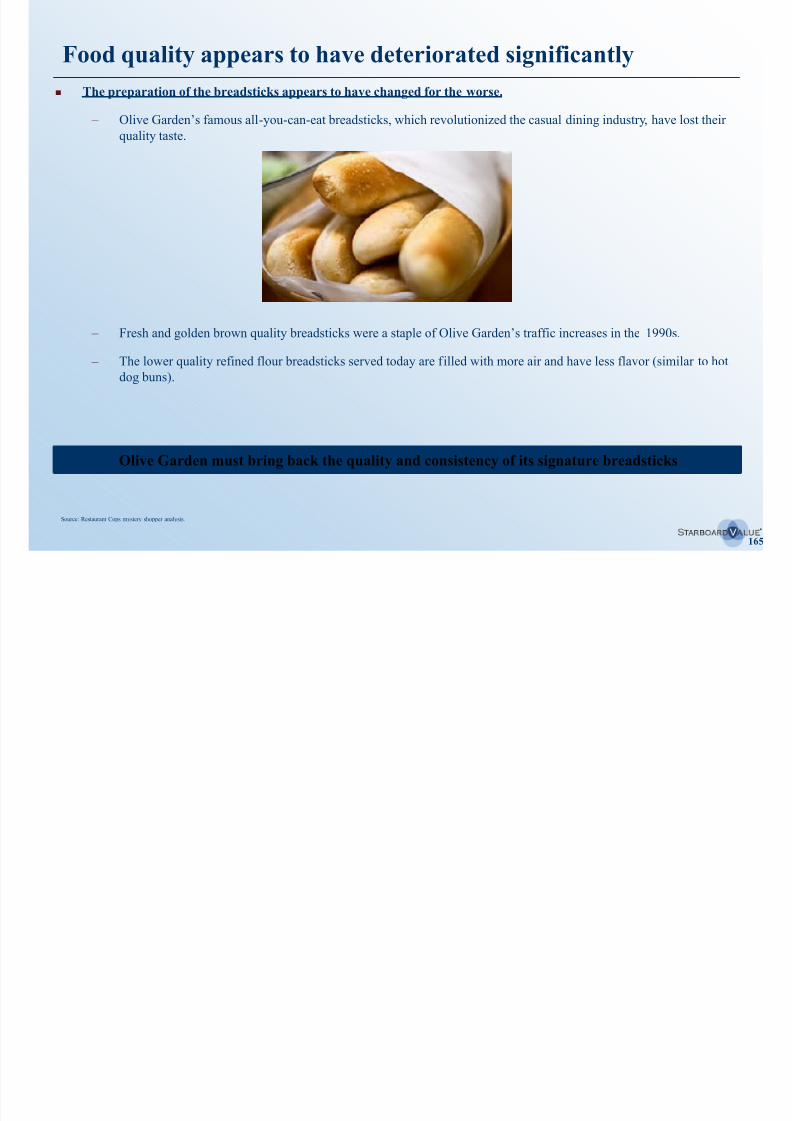
8/11/2019 Starboard Value Transforming Darden
http://slidepdf.com/reader/full/starboard-value-transforming-darden 165/294
165
– Olive Garden’s famous all-you-can-eat breadsticks, which revolutionized the casual dining industry, have lost their
quality taste.
– Fresh and golden brown quality breadsticks were a staple of Olive Garden’s traffic increases in the 1990s.
– The lower quality refined flour breadsticks served today are filled with more air and have less flavor (similar to hot
dog buns).
Olive Garden must bring back the quality and consistency of its signature breadsticks
Source: Restaurant Cops mystery shopper analysis.
Darden has replaced popular authentic dishes with…
Darden has replaced many of the appealing, fresh, healthy, authentic, and profitable Italian dishes with fried and
inauthentic dishes that we believe many customers find extremely unappealing.
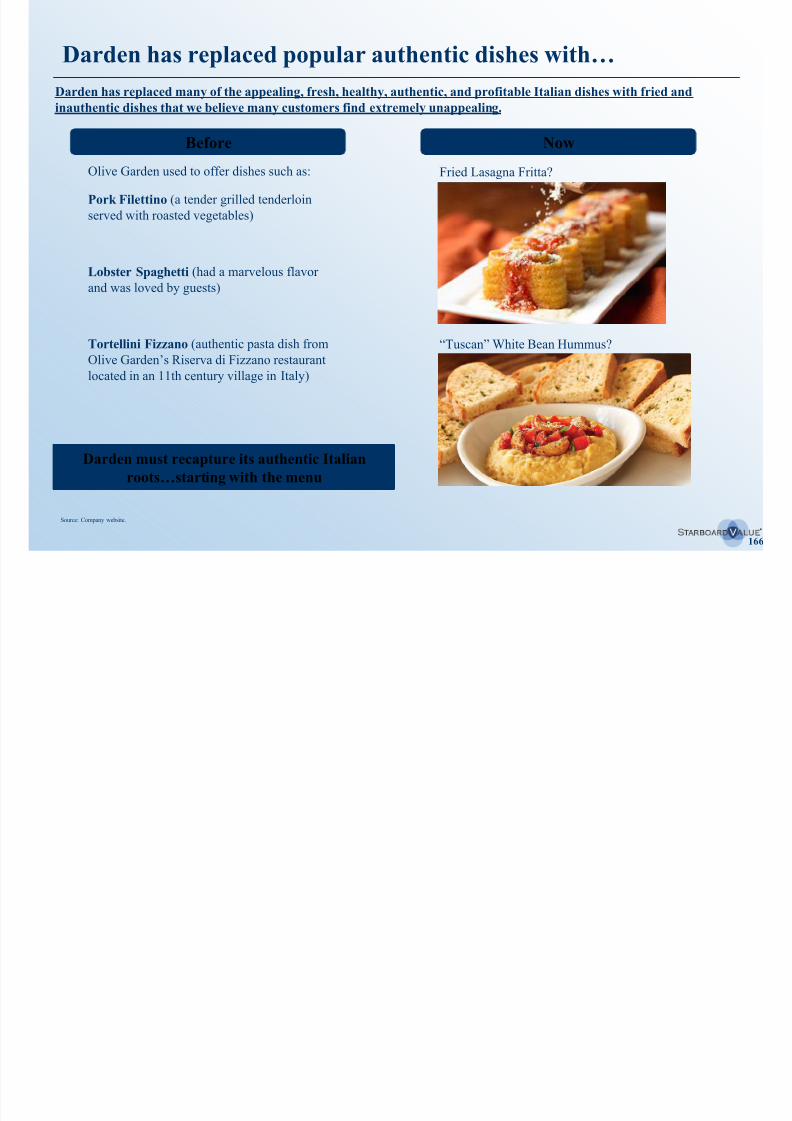
8/11/2019 Starboard Value Transforming Darden
http://slidepdf.com/reader/full/starboard-value-transforming-darden 166/294
166
y y pp g
Before Now
Olive Garden used to offer dishes such as:
Pork Filettino (a tender grilled tenderloin
served with roasted vegetables)
Lobster Spaghetti (had a marvelous flavor
and was loved by guests)
Tortellini Fizzano (authentic pasta dish from
Olive Garden’s Riserva di Fizzano restaurant
located in an 11th century village in Italy)
“Tuscan” White Bean Hummus?
Fried Lasagna Fritta?
Source: Company website.
Darden must recapture its authentic Italian
roots…starting with the menu
Execution appears to be a huge issue at Olive Garden…
Lasagna Primavera with Grilled Chicken
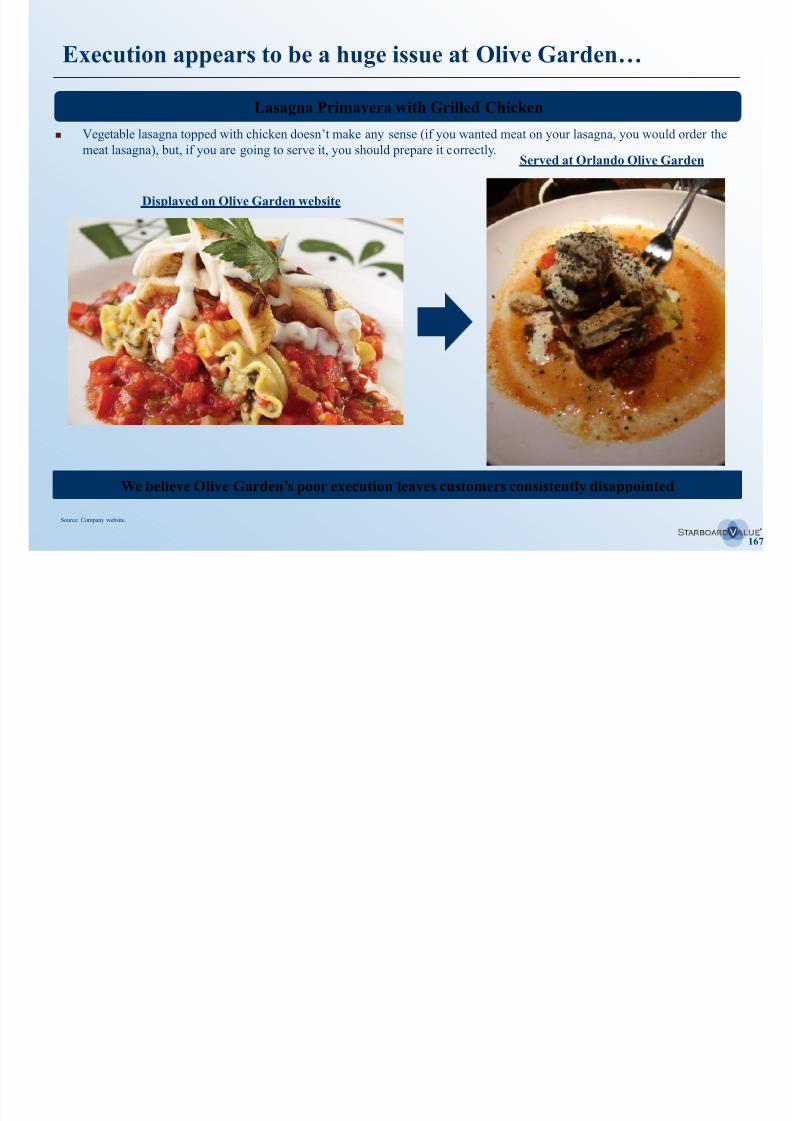
8/11/2019 Starboard Value Transforming Darden
http://slidepdf.com/reader/full/starboard-value-transforming-darden 167/294
167
g
Source: Company website.
Displayed on Olive Garden website
Served at Orlando Olive Garden
We believe Olive Garden’s poor execution leaves customers consistently disappointed
Vegetable lasagna topped with chicken doesn’t make any sense (if you wanted meat on your lasagna, you would order the
meat lasagna), but, if you are going to serve it, you should prepare it correctly.
Execution appears to be a huge issue at Olive Garden… (cont’d)
Lasagna Fritta
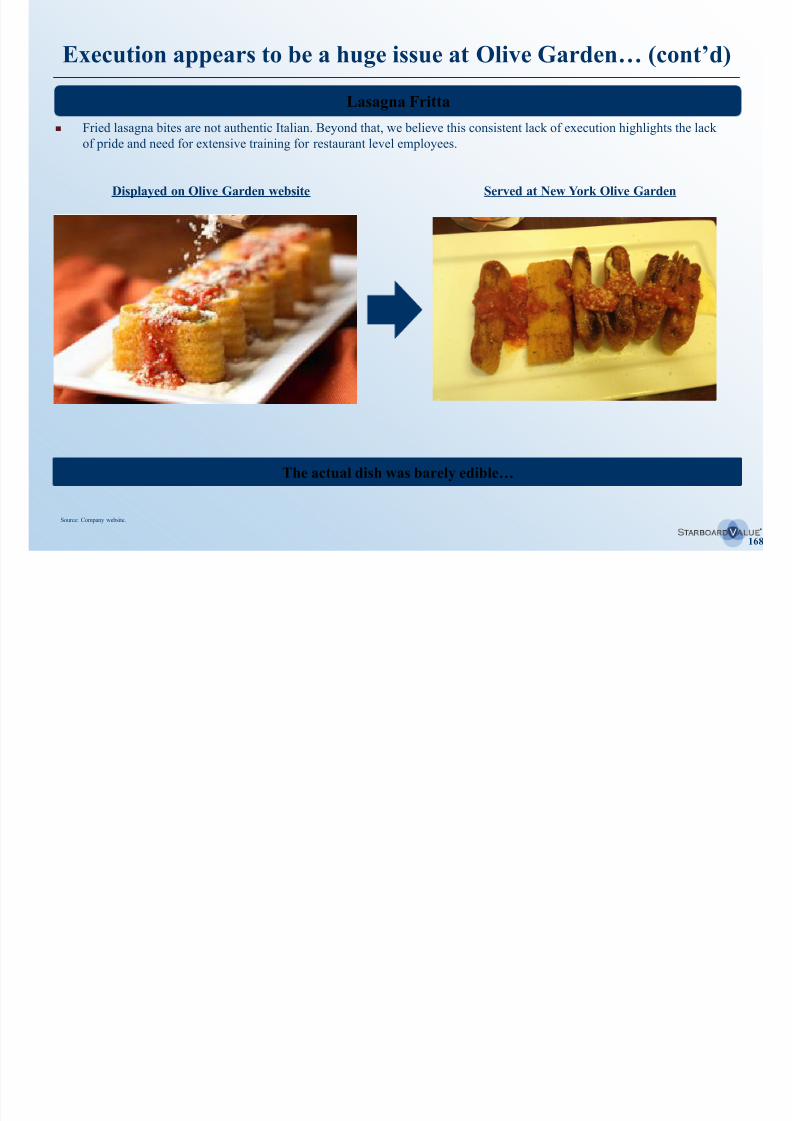
8/11/2019 Starboard Value Transforming Darden
http://slidepdf.com/reader/full/starboard-value-transforming-darden 168/294
168
Source: Company website.
Displayed on Olive Garden website Served at New York Olive Garden
Fried lasagna bites are not authentic Italian. Beyond that, we believe this consistent lack of execution highlights the lack
of pride and need for extensive training for restaurant level employees.
The actual dish was barely edible…
Execution appears to be a huge issue at Olive Garden… (cont’d)
Fried Asparagus
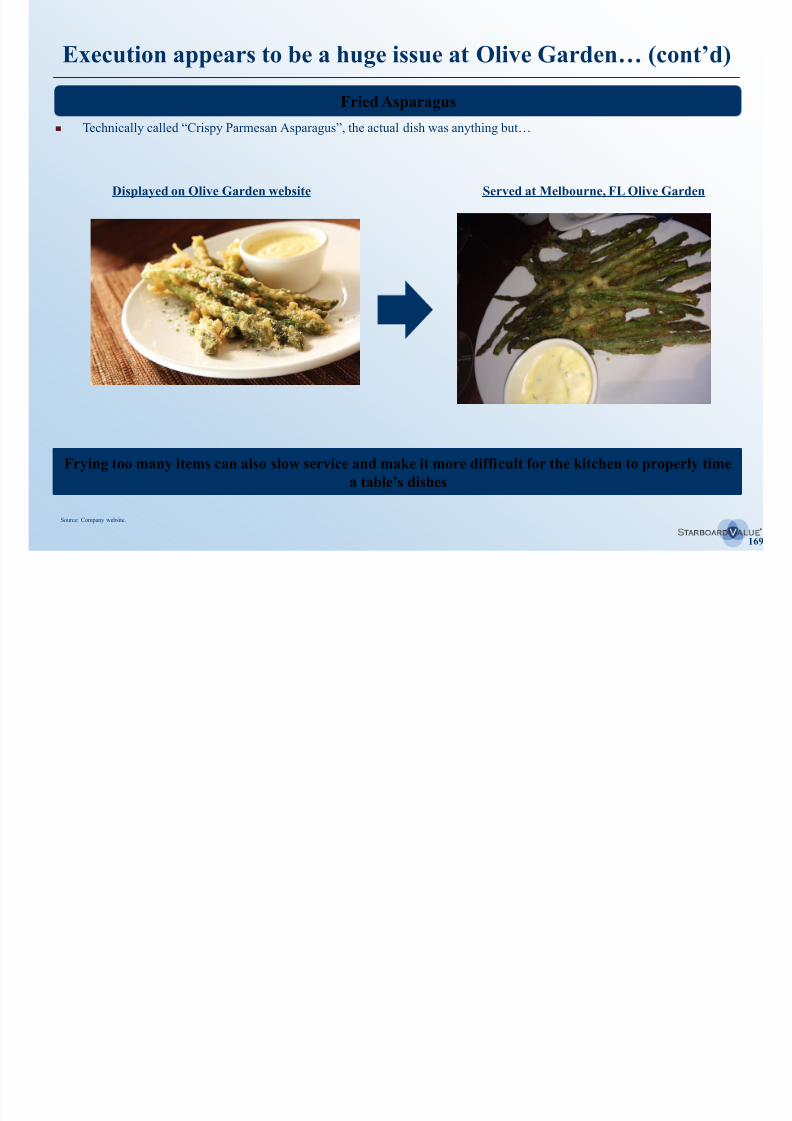
8/11/2019 Starboard Value Transforming Darden
http://slidepdf.com/reader/full/starboard-value-transforming-darden 169/294
169
Source: Company website.
Displayed on Olive Garden website Served at Melbourne, FL Olive Garden
Technically called “Crispy Parmesan Asparagus”, the actual dish was anything but…
Frying too many items can also slow service and make it more difficult for the kitchen to properly time
a table’s dishes
…And menu design is confusedOlive Garden already has some building blocks to work with, but even when it has introduced a quality
dish, the implementation has been lacking.
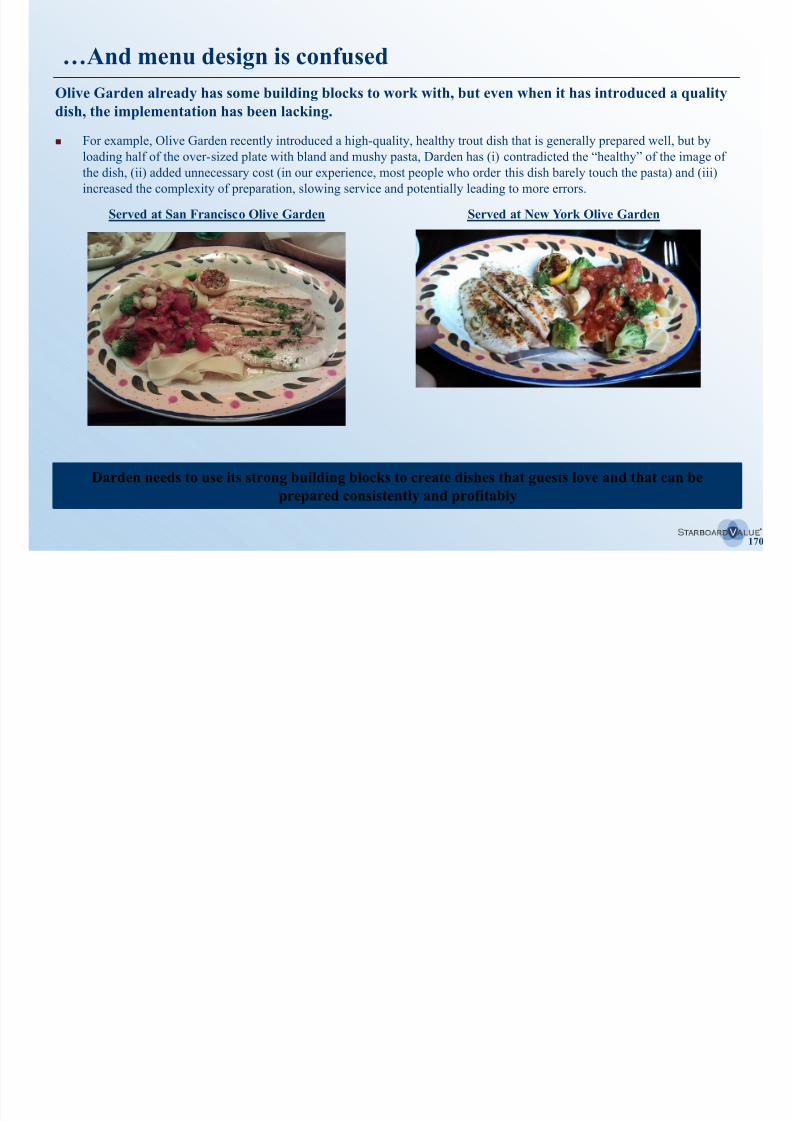
8/11/2019 Starboard Value Transforming Darden
http://slidepdf.com/reader/full/starboard-value-transforming-darden 170/294
170
For example, Olive Garden recently introduced a high-quality, healthy trout dish that is generally prepared well, but by
loading half of the over-sized plate with bland and mushy pasta, Darden has (i) contradicted the “healthy” of the image ofthe dish, (ii) added unnecessary cost (in our experience, most people who order this dish barely touch the pasta) and (iii)
increased the complexity of preparation, slowing service and potentially leading to more errors.
Darden needs to use its strong building blocks to create dishes that guests love and that can be
prepared consistently and profitably
d s , t e p e e tat o as bee ac g.
Served at San Francisco Olive Garden Served at New York Olive Garden
Olive Garden’s inconsistent leadership has led to poor results
We believe recent management teams have taken Olive Garden further and further away from the
vision that made Olive Garden great.
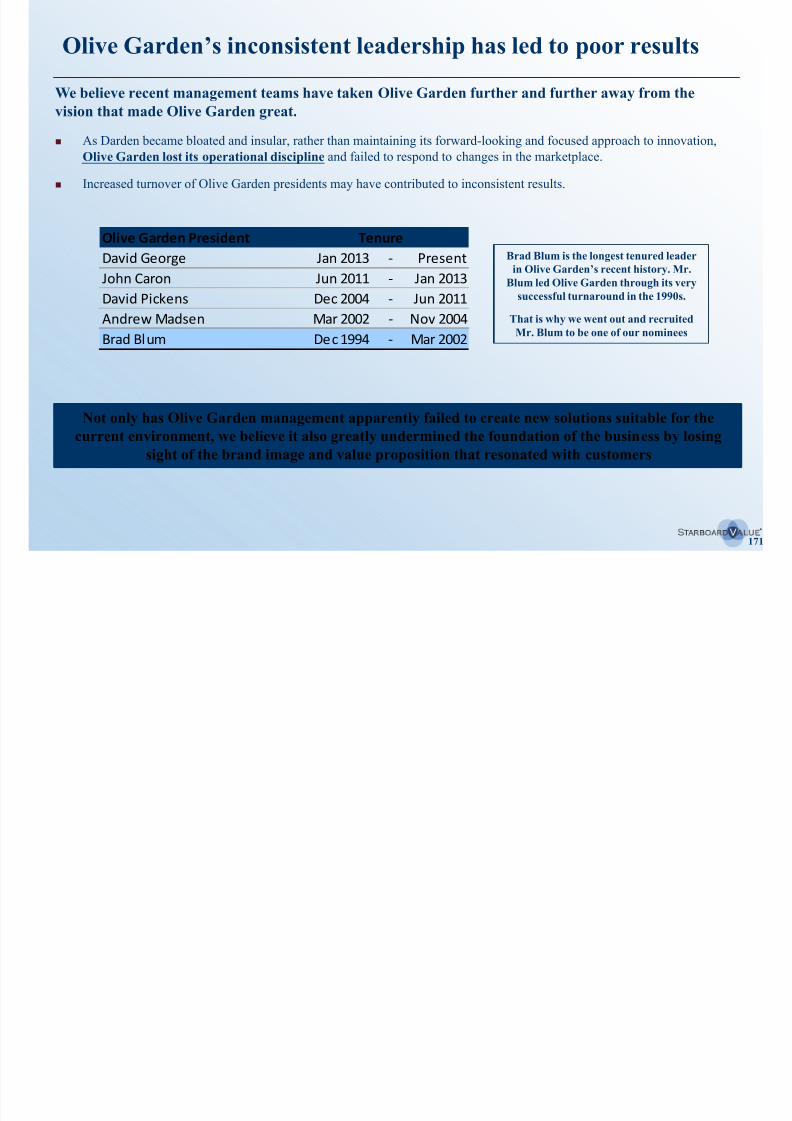
8/11/2019 Starboard Value Transforming Darden
http://slidepdf.com/reader/full/starboard-value-transforming-darden 171/294
171
As Darden became bloated and insular, rather than maintaining its forward-looking and focused approach to innovation,
Olive Garden lost its operational discipline and failed to respond to changes in the marketplace.
Increased turnover of Olive Garden presidents may have contributed to inconsistent results.
Olive Garden President Tenure
David George Jan 2013 - Present
John Caron Jun 2011 - Jan 2013David Pickens Dec 2004 - Jun 2011
Andrew Madsen Mar 2002 - Nov 2004
Brad Blum Dec 1994 - Mar 2002
g
Brad Blum is the longest tenured leader
in Olive Garden’s recent history. Mr.
Blum led Olive Garden through its verysuccessful turnaround in the 1990s.
That is why we went out and recruited
Mr. Blum to be one of our nominees
Not only has Olive Garden management apparently failed to create new solutions suitable for thecurrent environment, we believe it also greatly undermined the foundation of the business by losing
sight of the brand image and value proposition that resonated with customers
Darden should fix the guest experience before remodelingrestaurants and using discounting tacticsWe believe Darden management has approached operational challenges the wrong way.
Instead of focusing on improving the operations of the
“Why not give the menu changes an opportunity to take

8/11/2019 Starboard Value Transforming Darden
http://slidepdf.com/reader/full/starboard-value-transforming-darden 172/294
172
Source: Company presentations.
(1) Per Orlando Sentinel.
g p g p
business to enhance the guest experience, Darden is spending
substantial capital to remodel its buildings and lure in
customers through heavy discounting and limited time offers.
– Guests will only find the same disappointing service
and experience as before.
This is the same strategy that failed for Red Lobster
under the current Board’s watch.
Invest in remodels($500-600k per
restaurant) and LTOs /advertising ($50m+
excess spend)(1)
Lackscompelling and
authenticadvertising
message
Fails to fix theoperations of
the restaurants
Guest have aBAD
experience
Fix the food and theservice, ensureItalian authenticity
Create a distinct
compelling messagethat resonates with
customers
Spend advertisingdollars intelligently
Guests have a
GREAT genuineItalian dining
experience
Darden’s current strategy
Winning strategy
Why would Darden spend money to attract customers into the restaurant, only to disappoint them
with more the same underwhelming food and poor service?
Why not give the menu changes an opportunity to take
hold, instead of providing doubters further reason to
gripe if the store remodeling doesn't work
quickly?...And just as they aren't going to Chipotle to
admire the art on the wall, they're not avoiding Olive
Garden because they find the window treatments
lacking in character .”
- Yahoo Finance, July 9, 2014
Current management appears to be focused on the wrong issues
Out of all the problems currently at Olive Garden, the last thing management should be focused on is Olive
Garden’s logo. The new logo is yet another example of how we believe:
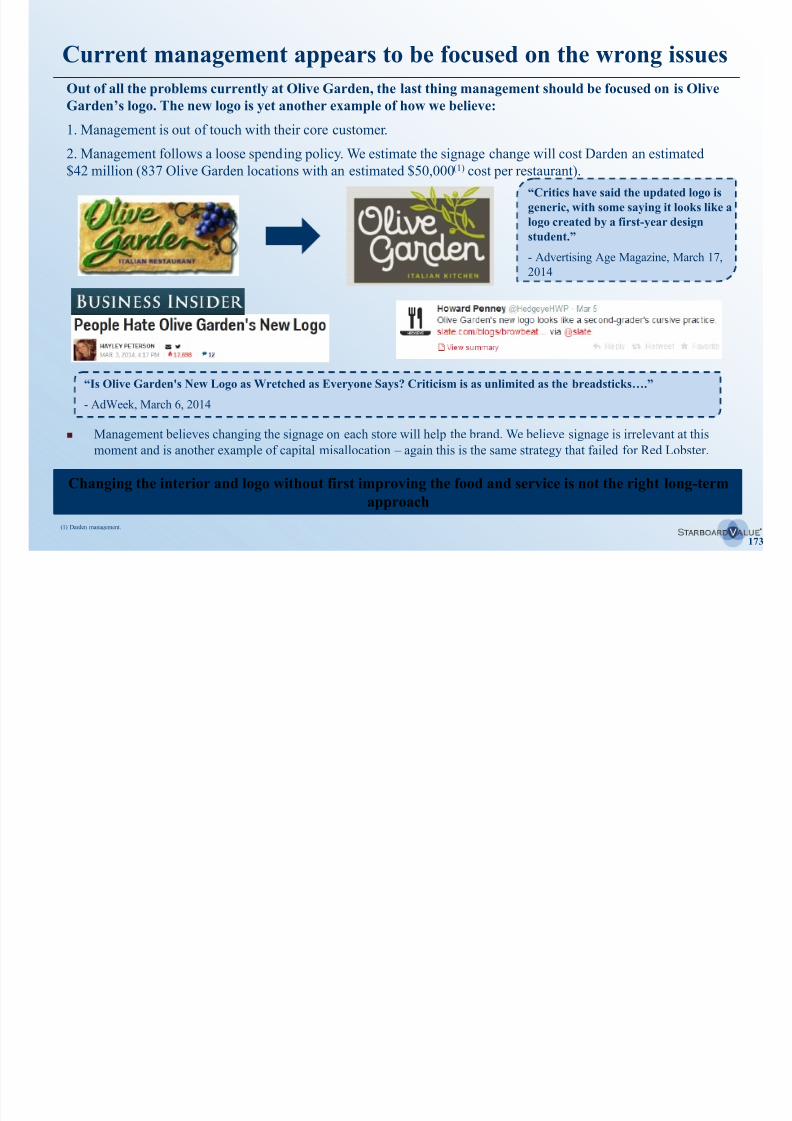
8/11/2019 Starboard Value Transforming Darden
http://slidepdf.com/reader/full/starboard-value-transforming-darden 173/294
173
1. Management is out of touch with their core customer.
2. Management follows a loose spending policy. We estimate the signage change will cost Darden an estimated$42 million (837 Olive Garden locations with an estimated $50,000(1) cost per restaurant).
“Critics have said the updated logo isgeneric, with some saying it looks like a
logo created by a first-year design
student.”
- Advertising Age Magazine, March 17,
2014
“Is Olive Garden's New Logo as Wretched as Everyone Says? Criticism is as unlimited as the breadsticks….”
- AdWeek, March 6, 2014
(1) Darden management.
Management believes changing the signage on each store will help the brand. We believe signage is irrelevant at this
moment and is another example of capital misallocation – again this is the same strategy that failed for Red Lobster.
Changing the interior and logo without first improving the food and service is not the right long-term
approach
We believe Olive Garden needs to improve the experience,service, and food quality in order to fortify its customer baseWith the help of a leading social media consulting firm, we conducted a study to see what customers
think of Olive Garden’s brand, food quality, and service vs its competitors.
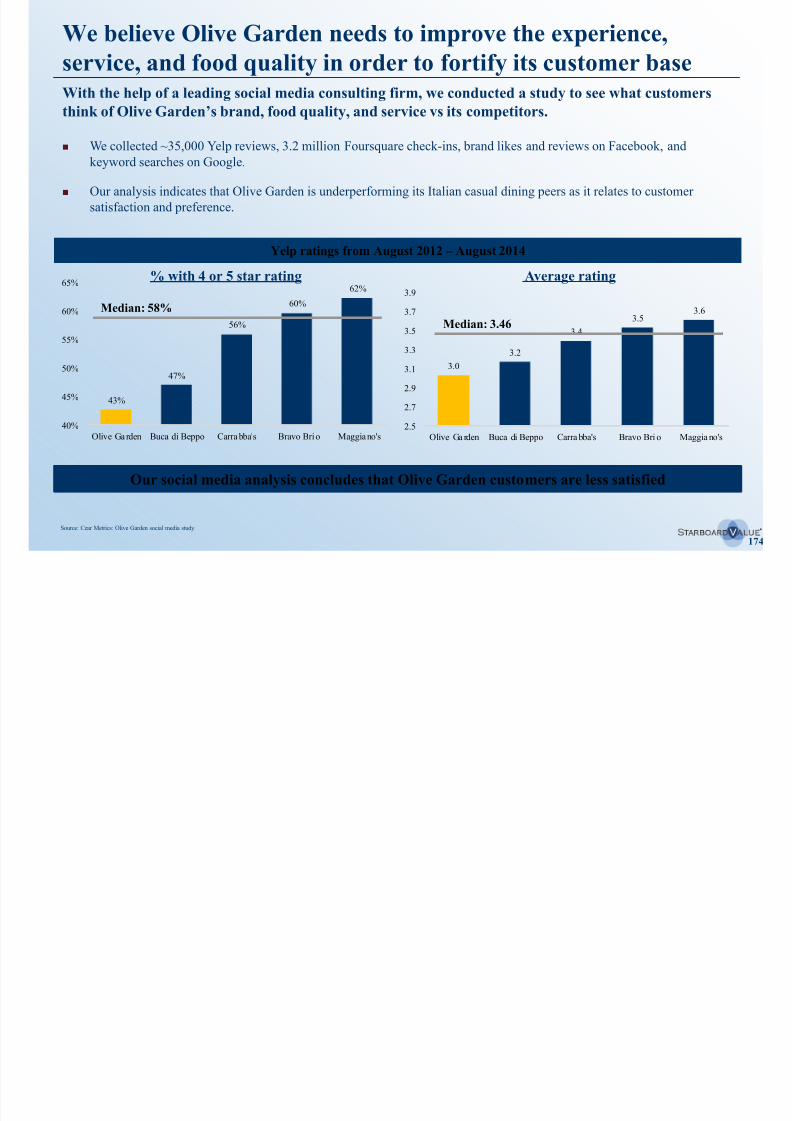
8/11/2019 Starboard Value Transforming Darden
http://slidepdf.com/reader/full/starboard-value-transforming-darden 174/294
174
We collected ~35,000 Yelp reviews, 3.2 million Foursquare check-ins, brand likes and reviews on Facebook, and
keyword searches on Google.
Our analysis indicates that Olive Garden is underperforming its Italian casual dining peers as it relates to customer
satisfaction and preference.
q y p
Our social media analysis concludes that Olive Garden customers are less satisfied
Source: Czar Metrics: Olive Garden social media study.
Yelp ratings from August 2012 – August 2014
43%
47%
56%
60%
62%
40%
45%
50%
55%
60%
65%
Olive Garden Buca di Beppo Carrabba's Bravo Bri o Maggiano's
3.0
3.2
3.4
3.53.6
2.5
2.7
2.9
3.1
3.3
3.5
3.7
3.9
Olive Ga rden Buca di Beppo Carra bba's Bravo Bri o Maggia no's
% with 4 or 5 star rating Average rating
Median: 3.46
Median: 58%
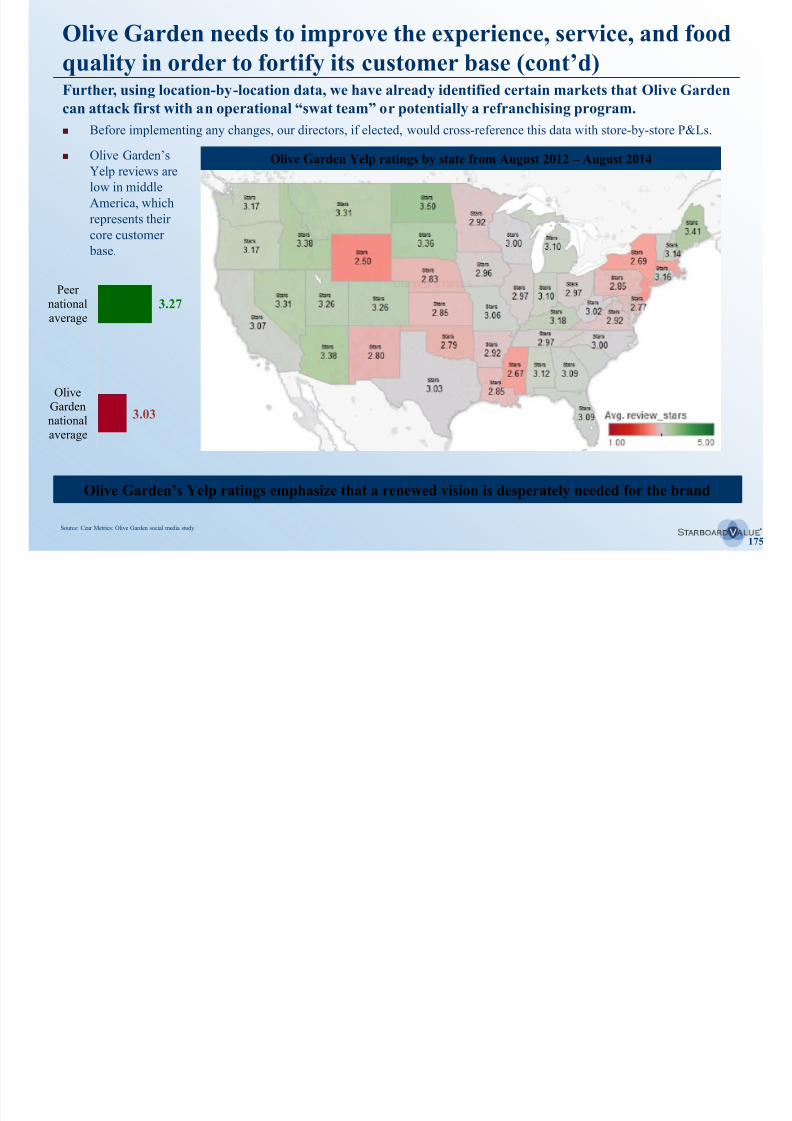
8/11/2019 Starboard Value Transforming Darden
http://slidepdf.com/reader/full/starboard-value-transforming-darden 175/294
Olive Garden is still by far the most searched Italian casualdining concept
Search frequency can indicate an affinity for the brand, and we are excited that Olive Garden customers
are still interested in the brand – by fixing the experience, we believe we can drive significant traffic.
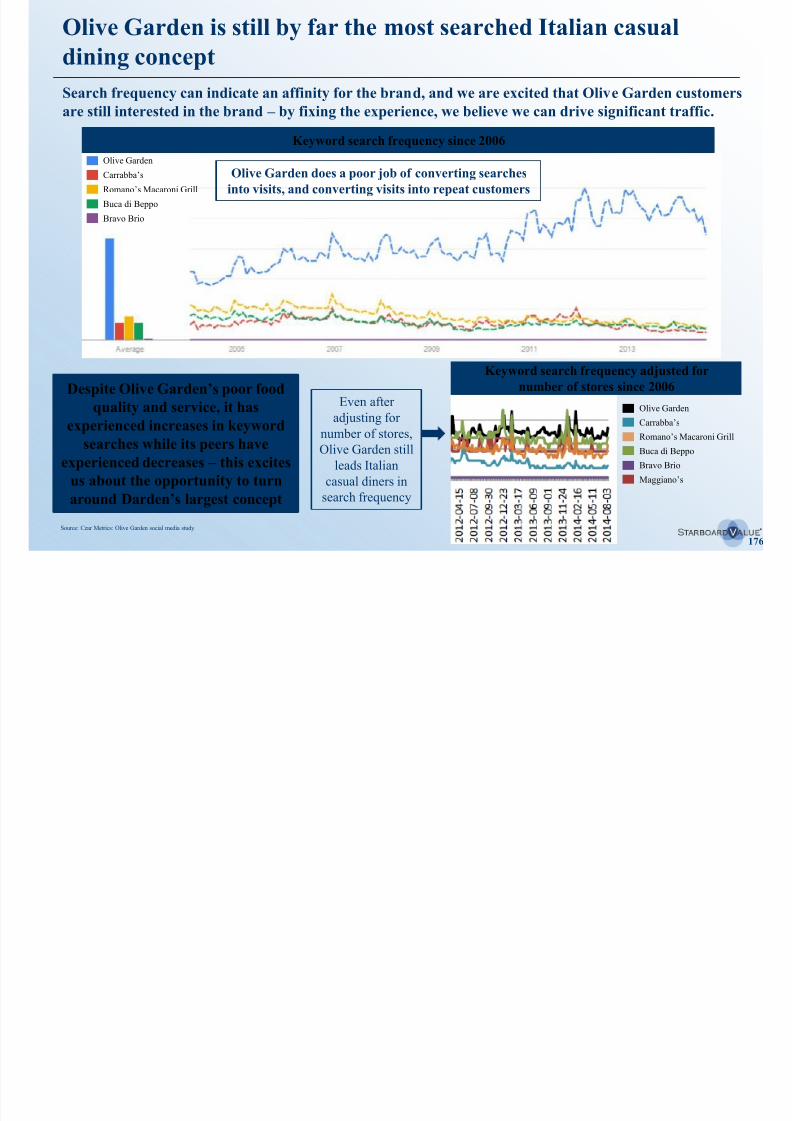
8/11/2019 Starboard Value Transforming Darden
http://slidepdf.com/reader/full/starboard-value-transforming-darden 176/294
176
Despite Olive Garden’s poor food
quality and service, it hasexperienced increases in keyword
searches while its peers have
experienced decreases – this excites
us about the opportunity to turn
around Darden’s largest concept
Keyword search frequency since 2006
Olive Garden
Carrabba’s
Romano’s Macaroni Grill
Buca di Beppo
Bravo Brio
Keyword search frequency adjusted for
number of stores since 2006
Olive Garden
Carrabba’s
Romano’s Macaroni Grill
Buca di Beppo
Bravo Brio
Maggiano’s
Even after
adjusting fornumber of stores,
Olive Garden still
leads Italian
casual diners in
search frequency
Source: Czar Metrics: Olive Garden social media study.
Olive Garden does a poor job of converting searches
into visits, and converting visits into repeat customers
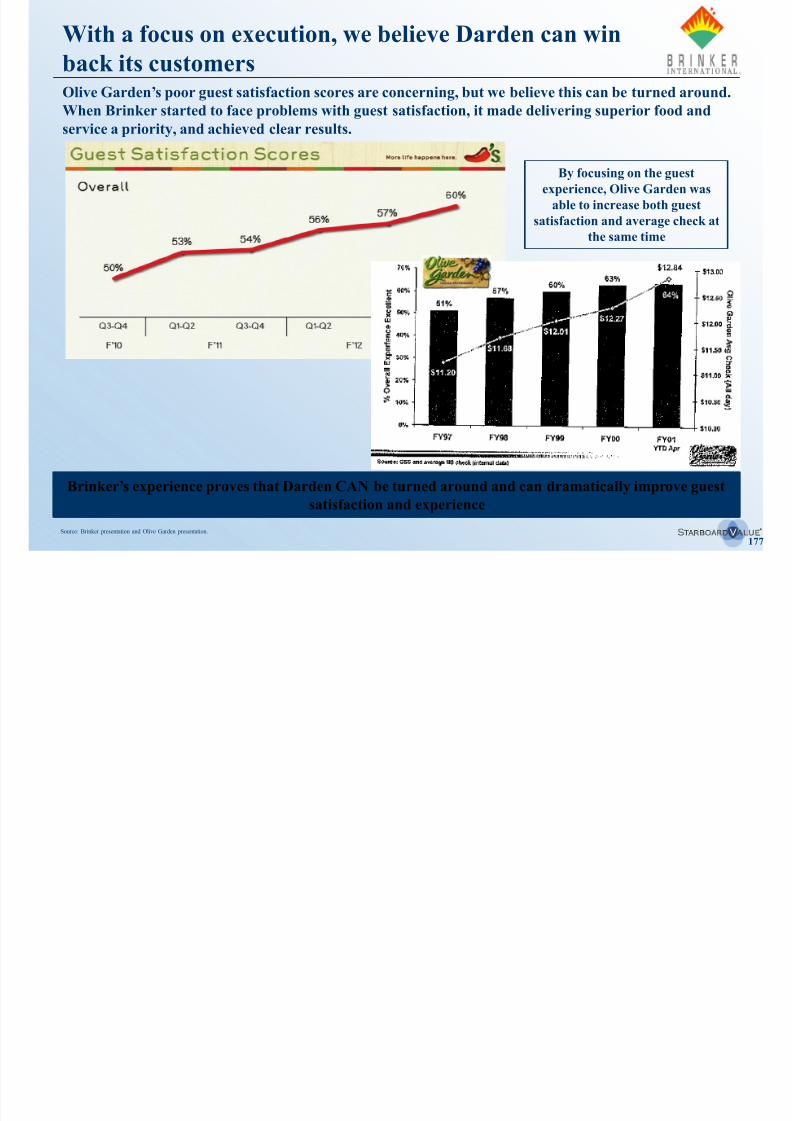
8/11/2019 Starboard Value Transforming Darden
http://slidepdf.com/reader/full/starboard-value-transforming-darden 177/294

8/11/2019 Starboard Value Transforming Darden
http://slidepdf.com/reader/full/starboard-value-transforming-darden 178/294
Olive Garden’s 1st successful turnaround
Olive Garden was built on 3 principles.
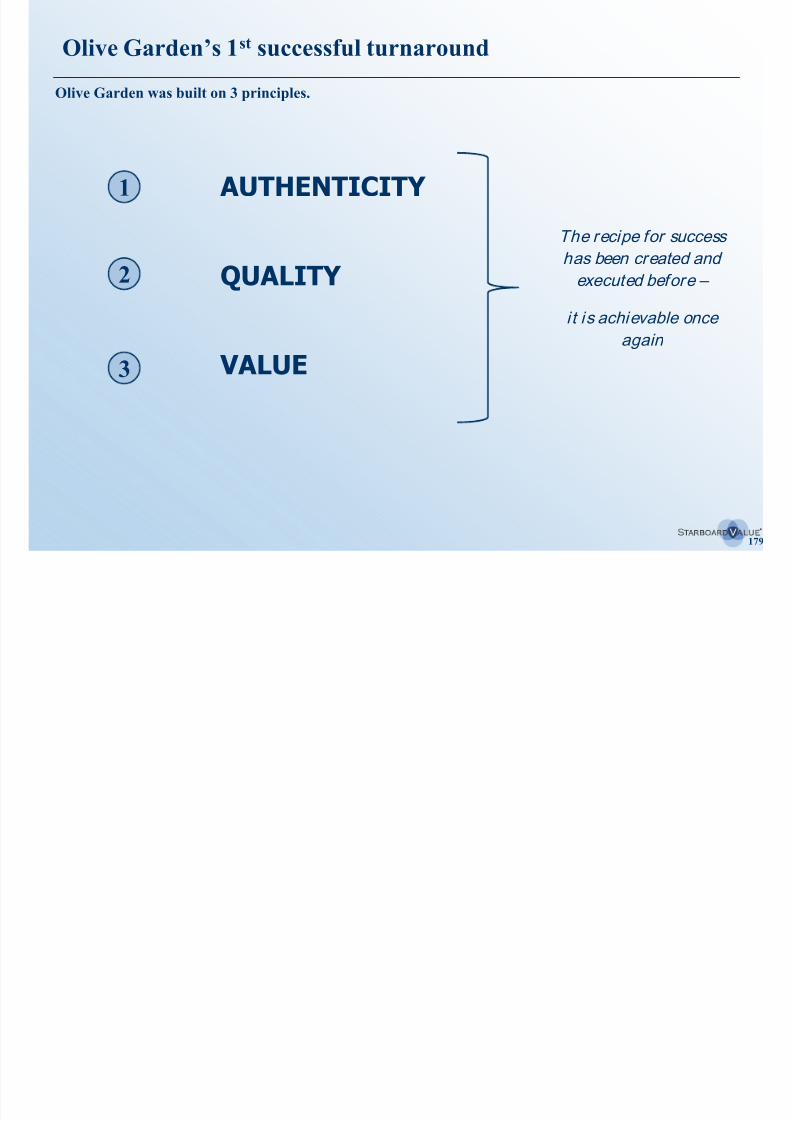
8/11/2019 Starboard Value Transforming Darden
http://slidepdf.com/reader/full/starboard-value-transforming-darden 179/294
179
AUTHENTICITY
QUALITY
VALUE
1
2
3
The recipe for success
has been created and
executed before –
it is achievable once
again
Our nominee, Brad Blum, led the first Olive Gardenturnaround
Mr. Blum brings a passion for the casual dining industry and an affinity for Darden, specifically Olive
Garden He can provide unparalleled insight and guidance as Olive Garden embarks on its turnaround
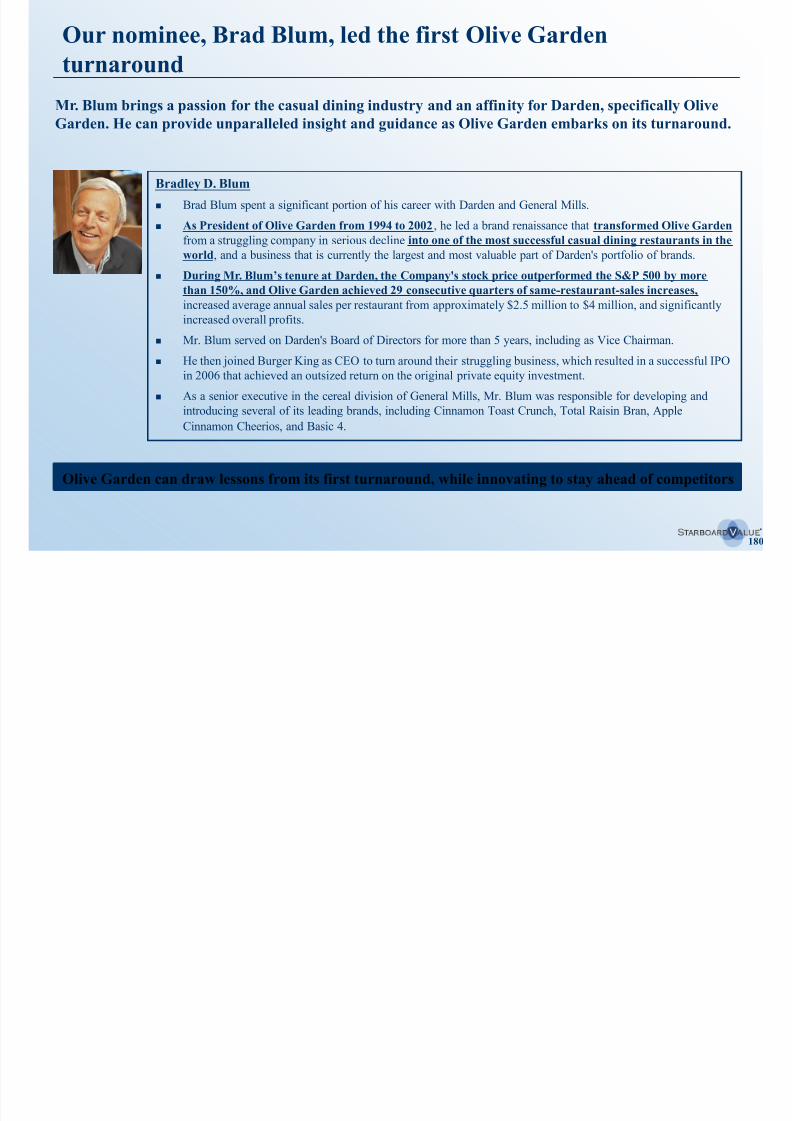
8/11/2019 Starboard Value Transforming Darden
http://slidepdf.com/reader/full/starboard-value-transforming-darden 180/294
180
Bradley D. Blum
Brad Blum spent a significant portion of his career with Darden and General Mills.
As President of Olive Garden from 1994 to 2002, he led a brand renaissance that transformed Olive Garden
from a struggling company in serious decline into one of the most successful casual dining restaurants in the
world, and a business that is currently the largest and most valuable part of Darden's portfolio of brands.
During Mr. Blum’s tenure at Darden, the Company's stock price outperformed the S&P 500 by more
than 150%, and Olive Garden achieved 29 consecutive quarters of same-restaurant-sales increases, increased average annual sales per restaurant from approximately $2.5 million to $4 million, and significantly
increased overall profits.
Mr. Blum served on Darden's Board of Directors for more than 5 years, including as Vice Chairman.
He then joined Burger King as CEO to turn around their struggling business, which resulted in a successful IPO
in 2006 that achieved an outsized return on the original private equity investment.
As a senior executive in the cereal division of General Mills, Mr. Blum was responsible for developing and
introducing several of its leading brands, including Cinnamon Toast Crunch, Total Raisin Bran, AppleCinnamon Cheerios, and Basic 4.
Garden. He can provide unparalleled insight and guidance as Olive Garden embarks on its turnaround.
Olive Garden can draw lessons from its first turnaround, while innovating to stay ahead of competitors
8/11/2019 Starboard Value Transforming Darden
http://slidepdf.com/reader/full/starboard-value-transforming-darden 181/294
Olive Garden’s first successful turnaround (cont’d)
In the 1990s Olive Garden was transformed from a struggling concept on the brink of failure to one of
the most successful brands in casual dining history.
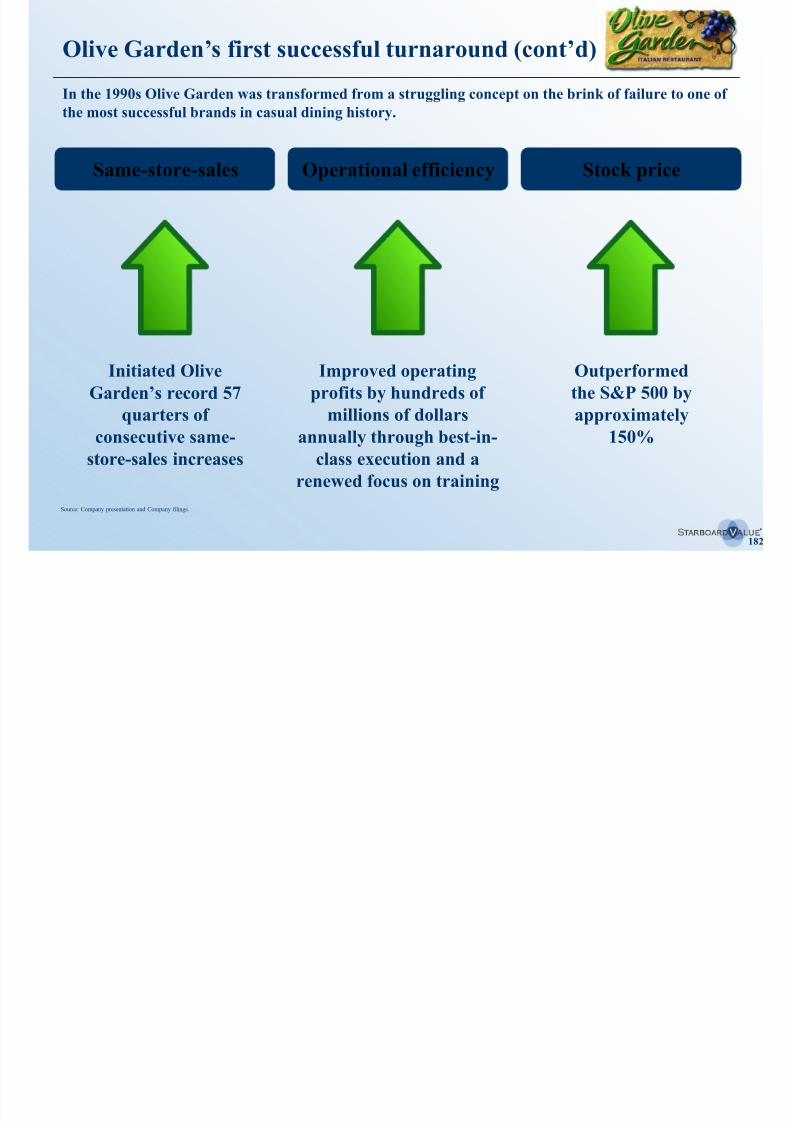
8/11/2019 Starboard Value Transforming Darden
http://slidepdf.com/reader/full/starboard-value-transforming-darden 182/294
182
Source: Company presentation and Company filings.
Initiated Olive
Garden’s record 57
quarters ofconsecutive same-
store-sales increases
Same-store-sales
Outperformed
the S&P 500 by
approximately150%
Stock price
Improved operating
profits by hundreds of
millions of dollarsannually through best-in-
class execution and a
renewed focus on training
Operational efficiency
Leadership: It’s all about the people
Mr. Blum and Mr. Mock traveled throughout the country to meet with every General Manager (GM) at Olive Garden to
li it id h t d i f i th t t Th ti h ld t
When Mr. Blum and Mr. Mock turned around Olive Garden the first time, they focused on the people.
8/11/2019 Starboard Value Transforming Darden
http://slidepdf.com/reader/full/starboard-value-transforming-darden 183/294
183
solicit ideas on how to and improve performance in the restaurants. These meetings were held once a quarter.
– In order to achieve superior results, Mr. Blum and Mr. Mock realized they must:
1) Treat employees with the utmost of respect.
2) Hold employees to the highest of standards.
– These meetings resulted in a great sense of ownership and innovative ideas that were critical for Olive Garden’s
turnaround.
Creating a sense of ownership is imperative in running a successful restaurant business.
– Before beginning this program, when customers complained to servers and GMs in restaurants, GMs typically
explained the problem by saying “they” (corporate) created the issue and the GMs have no control.
– Mr. Blum and Mr. Mock encouraged GMs to speak up if they had ideas to fix inefficiencies and eliminated the word
“they” – replaced it with “we”. Unfortunately, under current management’s reign, the “us vs. them” dynamic
between the restaurants and corporate has resurfaced – new leadership is needed to bring back Darden’s
collaboration and restaurant focused culture.
– GMs had their names displayed on a plaque on the front of their restaurants to promote pride and ownership in the
Olive Garden culture.
This skilled and involved management style led to the most successful financial performance in Olive Garden’s history.
“You just have to have good people if you are going have a good operation, without them you are lost.”
– Bi ll Darden
Leadership: It’s all about the people (cont’d)
Mr. Blum and Mr. Mock established a 4 question screen for any decision made by restaurant and
corporate employees.
8/11/2019 Starboard Value Transforming Darden
http://slidepdf.com/reader/full/starboard-value-transforming-darden 184/294
184
Olive Garden needs a management team that will bring innovative ideas, create a sense of ownership,
and instill a common vision
Is it good for the guest?
Does it reinforce the brand?
Does it set the employee(s) up for success?
Does it have a long-term positive impact on earnings and cash flow?
1
2
3
4
Decision making strategy at Olive Garden
When in doubt, they asked “is this authentically Italian?”
“Let them know what their role is in
developing the brand promise and
delivering the brand promise. We want to
go beyond their intellectual agreement to
their emotional commitment.”
- Joe Lee, November 9, 2005
Same-store-sales: Superior top-line results
Mr. Blum and Mr. Mock saved a struggling brand, reversing same-store-sales declines that were as
severe as (12%).
8/11/2019 Starboard Value Transforming Darden
http://slidepdf.com/reader/full/starboard-value-transforming-darden 185/294
185
Innovative brand positioning through “When You’re Here, You’re Family” mantra.
Used limited strategic couponing to drive traffic AFTER the guest experience was
fixed, then weaned off coupons.
Advertising
Italian authenticity
Brought back the focus on a genuine Italian dining experience.
Previously, there was no olive oil in the kitchens – just one example of the lack ofItalian authenticity. Mr. Blum and Mr. Mock brought a keen emphasis on taste and
appearance, mirroring an authentic Italian dining experience.
Menu
Complete upgrade to the menu, with major product improvements (starting with the
breadsticks) and appealing new products – fresher, higher quality, authentic food that
had much better taste and visual appeal with good margins.
Reduced the number of items on the menu, but increased the variety of options –
created a fulsome dining experience while simplifying the burden to the kitchen.
– Implemented the TURF (Total Unduplicated Reach and Frequency) philosophy.
These improvements drove an AUV increase from approximately $2.5 million to $4.0 million
“Brilliant with the Basics” attitude focusing on blocking and tackling restaurant
operations.
Served food at the correct temperatures with the preferred pace of service.
Superior execution
Same-store-sales: Superior top-line results (cont’d)
With a lean and nimble team that kept their focus on innovation and consistency, Olive Garden was
able to deliver a truly superior value proposition.
8/11/2019 Starboard Value Transforming Darden
http://slidepdf.com/reader/full/starboard-value-transforming-darden 186/294
186
Renewed program promoting wine as an integral part of the authentic Italian
experience – while keeping the family restaurant mentality.
Wine program was wildly successful and alcohol sales improved from 8% to
13%.
Doubled wine selection, offered a wider range of price points from $3.95 per glass to
much higher priced wines, and started wine training at the director level to instill the
priority of driving alcohol sales.
Family positioning
Wine program
Tuscan farmhouse
Store remodels
Created an authentic and cost effective Tuscan Farmhouse new restaurant design
that further distinguished the brand and helped drive strong new restaurant openings.
The iconic Tuscan f armhouse design was the result of management’s time in Italy.
After guest experience was fixed, remodeled existing restaurants with new Revitalia
design driving incremental +4-5% same-store-sales growth – a superb return on
investment.
Drove sales through the addition of “family tables” in restaurants (seating 10-12
guests) while eliminating TVs. This welcomed large parties and promoted genuine
Italian dining.
Operational efficiency: “Invest in the Guest”
Mr. Blum and Mr. Mock increased annual operating profits by hundreds of millions of dollars.
Instilled a “Brilliant with the basics” mentality and set priorities for operational

8/11/2019 Starboard Value Transforming Darden
http://slidepdf.com/reader/full/starboard-value-transforming-darden 187/294
187
excellence.
Implemented the Guest Satisfaction Survey to judge progress and achievedsignificant increases in guest satisfaction.
Promoted a comprehensive internal training program, but also hired from the outside
(from independents and other strong brands).
Cleanliness
Superior service
Kitchen
Introduced the computerized PAR Pull system, which reduced waste from 22% to
6% and improved both labor and food quality.
Simplified the sauces and introduced pre-portioning for pasta.
Strived to have the cleanest and safest restaurants in the casual dining industry.
Improved internal health score from 81% to 96% in their first year.
Food
Identified major issues with serving food at inappropriate temperatures, so developed
“Hot food go, can’t say no” motto, helping to drive improvement in food temperature
scores from 32% to 68%, which greatly improved the overall experience.
Standardized and slightly decreased the portion size and reduced calories from fat,
improving both margins and the guest experience.
“There is only one boss. The customer. And he can fire everybody in the company from the
chairman on down, simply by spending his money somewhere else.”
– Sam Walton
Operational efficiency: Great people drive results
Placed priority and importance on the restaurant General Manager position.
Held GMs to high standards, treated them with great respect, and created a strong sense
8/11/2019 Starboard Value Transforming Darden
http://slidepdf.com/reader/full/starboard-value-transforming-darden 188/294
188
of ownership.
Initiated a new program that granted annual stock options for GMs.
– Created hand engraved plaques on imported travertine tablets to be installed on
the front of GMs’ restaurants to promote an ownership mentality.
GM turnover went from 34% the year before Mr. Blum and Mr. Mock started to 4%
annual voluntary turnover, plus 5% forced turnover each year to provide room for strong
and upcoming junior managers (currently the turnover is 16-17%(1)).
Restaurant GeneralManagers (GMs)
Leadership
The Olive Garden team outperformed their plan to drive shareholder value creation whilestill providing great bonuses and motivation to the employees.
Focused primarily on the restaurant, the food, and general managers.
Hands-on management approach designed to inspire, teach, uphold high standards, and
respect employees. This led to RESULTS with integrity.
Went above and beyond to recognize outstanding performance, but always held employees
to the highest standards.
“I am convinced that the only edge we have on our competitors, is the quality of our employees as reflected
each day by the job they do.”
– Bil l Darden
(1) Per Company management.
8/11/2019 Starboard Value Transforming Darden
http://slidepdf.com/reader/full/starboard-value-transforming-darden 189/294
Stock price: These improvements greatly contributedto Darden’s stock price growth of more than 200%
Olive Garden was the major driver of performance at Darden as the chain with the most restaurants
and highest AUV.
R l ti St k P i P f
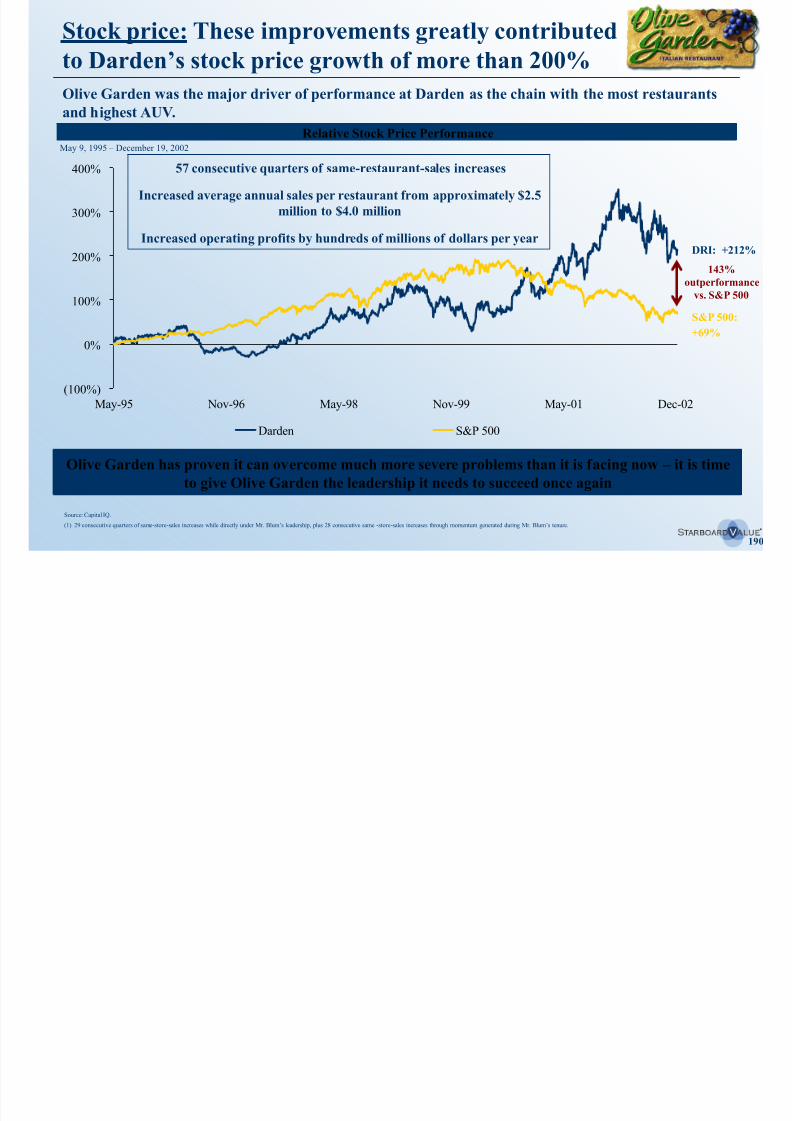
8/11/2019 Starboard Value Transforming Darden
http://slidepdf.com/reader/full/starboard-value-transforming-darden 190/294
190
Source: Capital IQ.
(1) 29 consecutive quarters of same-store-sales increases while directly under Mr. Blum’s leadership, plus 28 consecutive same -store-sales increases through momentum generated during Mr. Blum’s tenure.
(100%)
0%
100%
200%
300%
400%
May-95 Nov-96 May-98 Nov-99 May-01 Dec-02
Darden S&P 500
S&P 500:
+69%
DRI: +212%
May 9, 1995 – December 19, 2002
Relative Stock Price Performance
143%
outperformance
vs. S&P 500
57 consecutive quarters of same-restaurant-sales increases
Increased average annual sales per restaurant from approximately $2.5
million to $4.0 million
Increased operating profits by hundreds of millions of dollars per year
Olive Garden has proven it can overcome much more severe problems than it is facing now – it is time
to give Olive Garden the leadership it needs to succeed once again
Use past success as guideposts, but innovate for the future
We can draw lessons from past successes, but will still need to innovate in the future to create the
best possible guest experience today.
8/11/2019 Starboard Value Transforming Darden
http://slidepdf.com/reader/full/starboard-value-transforming-darden 191/294
191
We have been advised by many of the leaders who managed Olive Garden in its most successful period.
Many of the strategies and best practices instilled at Olive Garden can be revisited to drive success.
However, to drive future successes, we also must innovate and stay with the times.
– This begins with great leaders and industry-leading restaurateurs at the helm.
We believe our slate of nominees will provide the best oversight and guidance to Darden’s management
team as it begins blending elements of Olive Garden’s past success with new ideas to take the brand to thenext level.
With the right leaders in place and with a culture of innovation, we believe Olive Garden will be
successful

8/11/2019 Starboard Value Transforming Darden
http://slidepdf.com/reader/full/starboard-value-transforming-darden 192/294
192
VI. Olive Garden
C. Olive Garden turnaround plan
An innovative and disciplined strategy at Olive Garden coulddrive significant shareholder value creation
Turning around Olive Garden starts with the people.
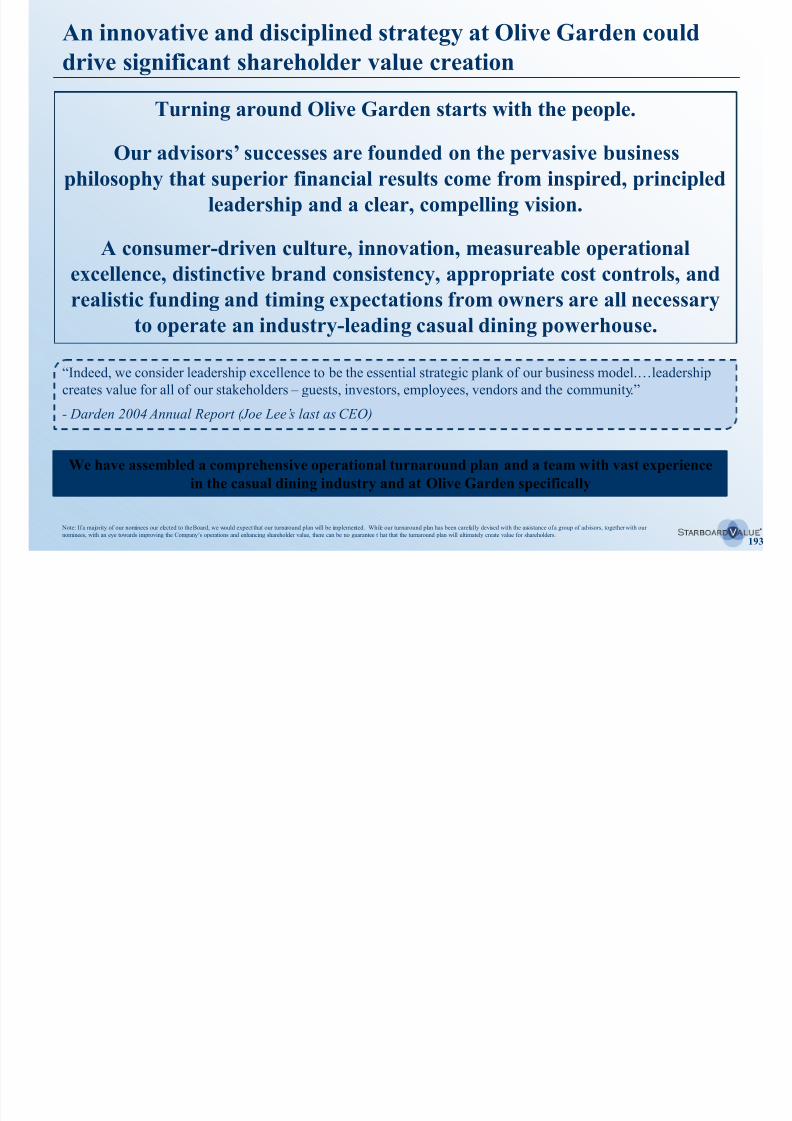
8/11/2019 Starboard Value Transforming Darden
http://slidepdf.com/reader/full/starboard-value-transforming-darden 193/294
193
Our advisors’ successes are founded on the pervasive businessphilosophy that superior financial results come from inspired, principled
leadership and a clear, compelling vision.
A consumer-driven culture, innovation, measureable operational
excellence, distinctive brand consistency, appropriate cost controls, and
realistic funding and timing expectations from owners are all necessary
to operate an industry-leading casual dining powerhouse.
We have assembled a comprehensive operational turnaround plan and a team with vast experience
in the casual dining industry and at Olive Garden specifically
“Indeed, we consider leadership excellence to be the essential strategic plank of our business model.…leadership
creates value for all of our stakeholders – guests, investors, employees, vendors and the community.”
- Darden 2004 Annual Report (Joe Lee’s last as CEO)
Note: If a majority of our nominees our elected to the Board, we would expect that our turnaround plan will be implemented. While our turnaround plan has been carefully devised with the assistance of a group of advisors, together with our
nominees, with an eye towards improving the Company’s operations and enhancing shareholder value, there can be no guarantee t hat that the turnaround plan will ultimately create value for shareholders.
Turnaround Plan objectives
Empower the entire organization, with particular emphasis on restaurant General Managers.
Restore and create compelling brand relevance through:
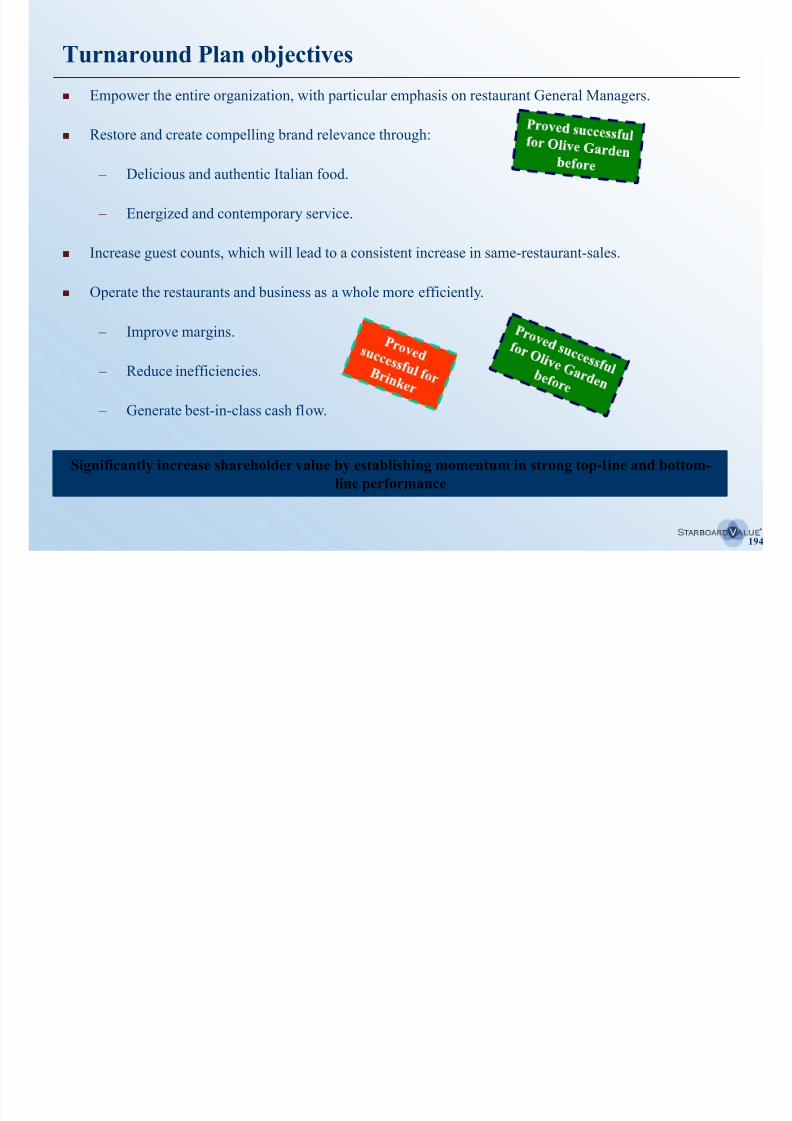
8/11/2019 Starboard Value Transforming Darden
http://slidepdf.com/reader/full/starboard-value-transforming-darden 194/294
194
Restore and create compelling brand relevance through:
– Delicious and authentic Italian food.
– Energized and contemporary service.
Increase guest counts, which will lead to a consistent increase in same-restaurant-sales.
Operate the restaurants and business as a whole more efficiently.
– Improve margins.
– Reduce inefficiencies.
– Generate best-in-class cash flow.
Significantly increase shareholder value by establishing momentum in strong top-line and bottom-
line performance
Olive Garden values
Be of service with the highest of standards integrity and respect
Food, service, and atmosphere are the main components of a successful casual dining value proposition.
8/11/2019 Starboard Value Transforming Darden
http://slidepdf.com/reader/full/starboard-value-transforming-darden 195/294
195
Be of service…with the highest of standards, integrity, and respect.
When in the process of making a change (policies or practices), solicit the opinions of those closest to the action,
listen, and value their ideas (employees as well as guests).
– Management should strive to be as close to the guest as possible while focusing on efficient operations.
Create, innovate, work smartly, and achieve extraordinary results.
Develop and train our team to reach their full potential with private constructive criticism and public praise.
Celebrate successes yet remain humble and always stay hungry.
Always be mindful of authenticity, quality, and value
Olive Garden turnaround plan
Recreate Italian authenticity within Olive Garden1
Our Olive Garden turn around plan is centered around the following steps:
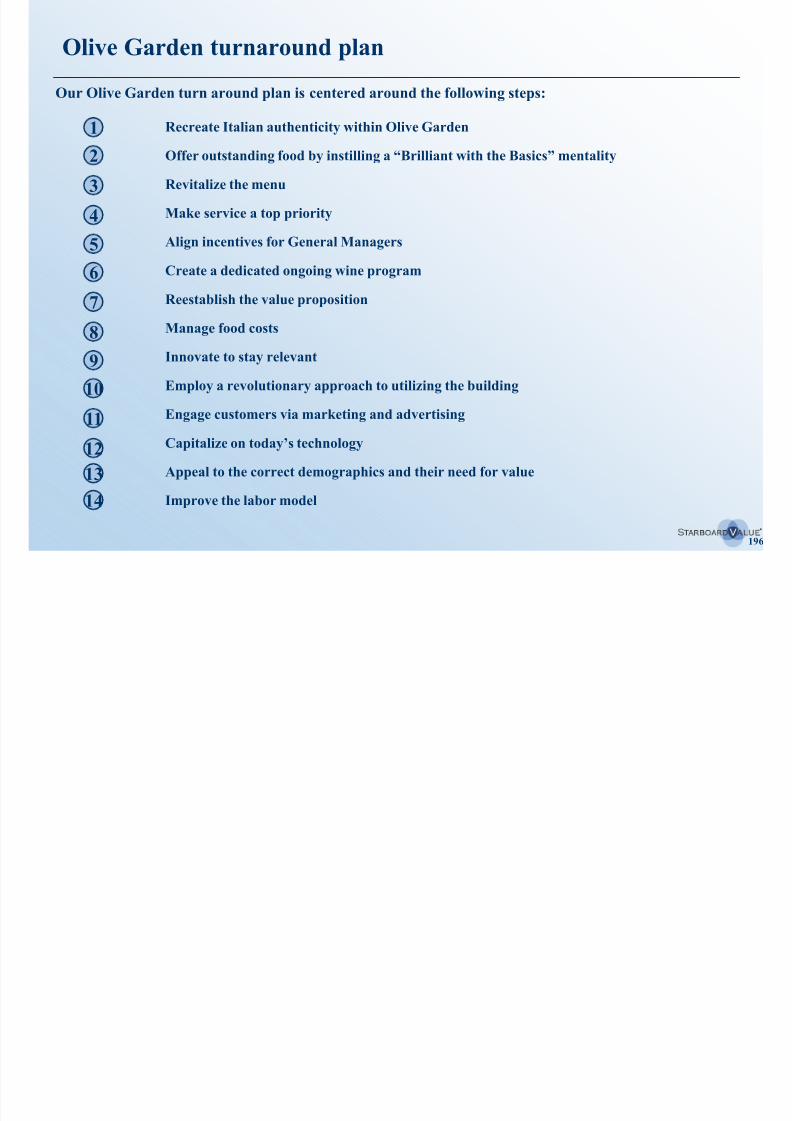
8/11/2019 Starboard Value Transforming Darden
http://slidepdf.com/reader/full/starboard-value-transforming-darden 196/294
196
y
Offer outstanding food by instilling a “Brilliant with the Basics” mentality
Revitalize the menu
Make service a top priority
Align incentives for General Managers
Create a dedicated ongoing wine program
Reestablish the value proposition
Manage food costs
Innovate to stay relevant
Employ a revolutionary approach to utilizing the building
Engage customers via marketing and advertising
Capitalize on today’s technology
Appeal to the correct demographics and their need for value
Improve the labor model
23
4
5
6
7
8
9
10
11
12
13
14
Recreate Italian authenticity within Olive Garden
We want to transform the look, feel, and taste to reflect genuine Italian dining.
1
Solution:
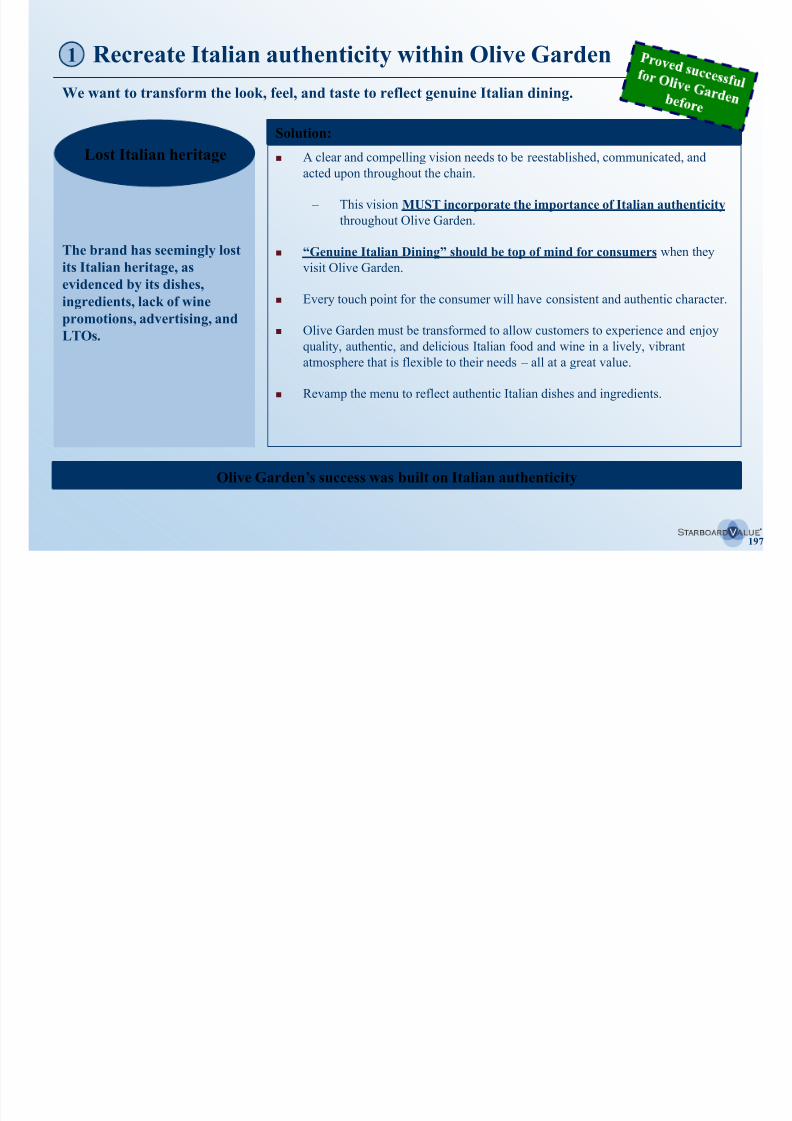
8/11/2019 Starboard Value Transforming Darden
http://slidepdf.com/reader/full/starboard-value-transforming-darden 197/294
197
A clear and compelling vision needs to be reestablished, communicated, andacted upon throughout the chain.
– This vision MUST incorporate the importance of Italian authenticity
throughout Olive Garden.
“Genuine Italian Dining” should be top of mind for consumers when they
visit Olive Garden.
Every touch point for the consumer will have consistent and authentic character.
Olive Garden must be transformed to allow customers to experience and enjoy
quality, authentic, and delicious Italian food and wine in a lively, vibrant
atmosphere that is flexible to their needs – all at a great value.
Revamp the menu to reflect authentic Italian dishes and ingredients.
Solution:
The brand has seemingly lost
its Italian heritage, as
evidenced by its dishes,ingredients, lack of wine
promotions, advertising, and
LTOs.
Lost Italian heritage
Olive Garden’s success was built on Italian authenticity
Offer outstanding food by instilling a “Brilliant with theBasics” mentality Before transforming the brand image, spending too much money on promotions,
or investing in expensive remodels and a new logo, Olive Garden must focus on
operational excellence, particularly with regard to the quality of food and service.
2
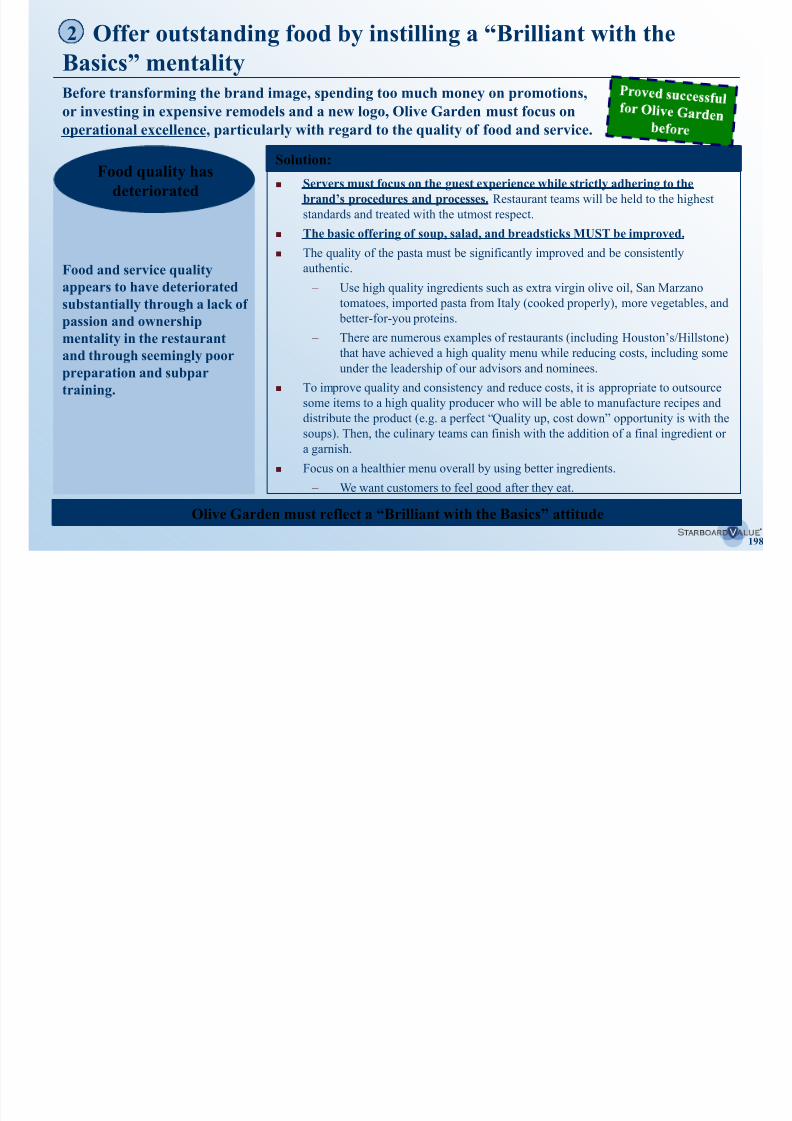
8/11/2019 Starboard Value Transforming Darden
http://slidepdf.com/reader/full/starboard-value-transforming-darden 198/294
198
p , p y g q y
Servers must focus on the guest experience while strictly adhering to the
brand’s procedures and processes. Restaurant teams will be held to the highest
standards and treated with the utmost respect.
The basic offering of soup, salad, and breadsticks MUST be improved.
The quality of the pasta must be significantly improved and be consistently
authentic.
– Use high quality ingredients such as extra virgin olive oil, San Marzanotomatoes, imported pasta from Italy (cooked properly), more vegetables, and
better-for-you proteins.
– There are numerous examples of restaurants (including Houston’s/Hillstone)
that have achieved a high quality menu while reducing costs, including some
under the leadership of our advisors and nominees.
To improve quality and consistency and reduce costs, it is appropriate to outsource
some items to a high quality producer who will be able to manufacture recipes and
distribute the product (e.g. a perfect “Quality up, cost down” opportunity is with thesoups). Then, the culinary teams can finish with the addition of a final ingredient or
a garnish.
Focus on a healthier menu overall by using better ingredients.
– We want customers to feel good after they eat.
Solution:
Food and service quality
appears to have deterioratedsubstantially through a lack of
passion and ownership
mentality in the restaurant
and through seemingly poor
preparation and subpar
training.
Food quality has
deteriorated
Olive Garden must reflect a “Brilliant with the Basics” attitude
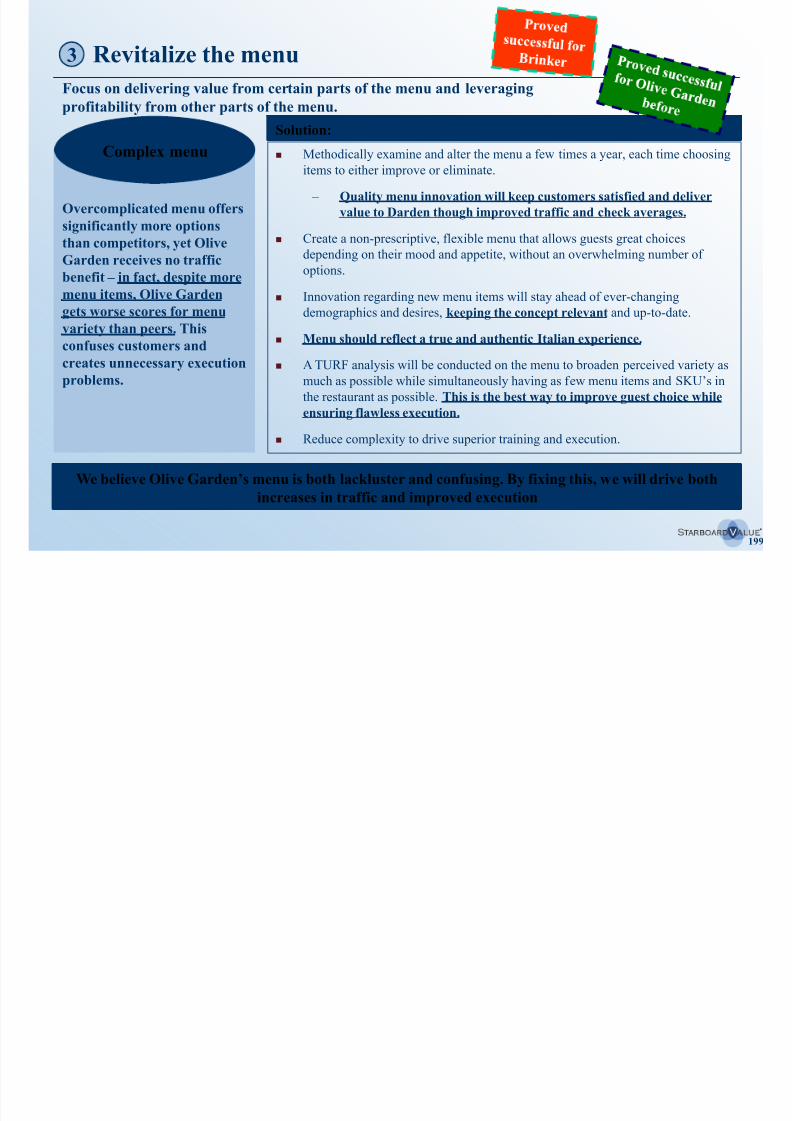
8/11/2019 Starboard Value Transforming Darden
http://slidepdf.com/reader/full/starboard-value-transforming-darden 199/294
Menu innovation is a top priority and is among our nominees’biggest strengths
The food will be fresh whenever possible, with simple choices.
The entire experience of food, service, and environment must be authentic and provide a joyful and
genuine Italian dining experience.
8/11/2019 Starboard Value Transforming Darden
http://slidepdf.com/reader/full/starboard-value-transforming-darden 200/294
200
Menu items will be designed to help facilitate operational excellence and consistency by the restaurant staff.
We will embrace authenticity, especially as it pertains to the absence of preservatives, stabilizers, gums, additives,
artificial colorings, and flavorings.
We will no longer disregard sound nutrition. Nutrition will not be the driving force, but it will now be carefully considered
while greatly improving the taste and appeal of every dish.
Some parts of the menu can be flavor-forward with fresh ingredients: extra virgin olive oil, lemons, ripe tomatoes, an
array of colorful vegetables, lean meats, and fresh fish.
Portion sizes may be gradually reduced, as guests will begin to equate Olive Garden’s value proposition more with qualityand excellence at fair prices, than with massive quantities of barely edible fried items, excessive cheeses, and heavy cream
sauces.
Olive Garden’s breadsticks are part of the brand equity, as they come to every table. The breadsticks need to be of the
highest quality, with a better taste and a firmer texture, and each table must receive hot breadsticks.
The pasta at Olive Garden must be significantly improved. It must be prepared at the proper water temperature, boiled in
salted water, precisely timed to not overcook, and tossed with sauces for each dish instead of the current practice of
ladling sauce on top of heaps of coagulated pasta.
We must rethink the amount of items from the fryer. Most fried foods are not authentically Italian and it slows service.
We will explore a few gluten-free options, as many consumers prefer gluten-free dishes.(1)
Based on extensive research and discussions with culinary experts and suppliers, we believe we can
accomplish these goals at Olive Garden’s current price points without hurting margins
Source: Czar gluten-free data.
(1) “Gluten” and “Gluten-free” are now among the top searches related to Olive Garden, per Czar Metrics.
Increasing variety while lowering costs will revolutionize OliveGarden’s menu
Adopting the TURF (Total Unduplicated Reach & Frequency) philosophy to menu innovation will
reduce food and labor costs while improving menu variety.
The TURF method ensures the menu will have as broad a consumer appeal as possible for as few menu items and SKU’s
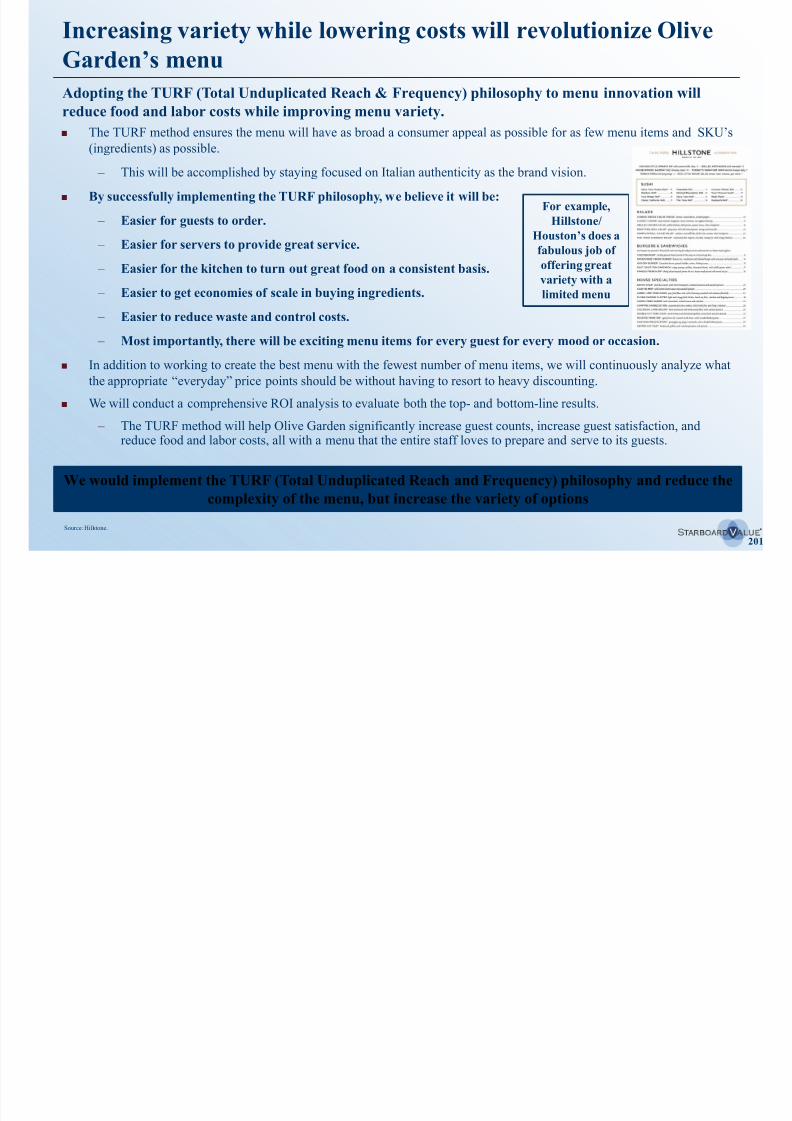
8/11/2019 Starboard Value Transforming Darden
http://slidepdf.com/reader/full/starboard-value-transforming-darden 201/294
201
We would implement the TURF (Total Unduplicated Reach and Frequency) philosophy and reduce the
complexity of the menu, but increase the variety of options
pp p
(ingredients) as possible.
– This will be accomplished by staying focused on Italian authenticity as the brand vision.
By successfully implementing the TURF philosophy, we believe it will be:
– Easier for guests to order.
– Easier for servers to provide great service.
– Easier for the kitchen to turn out great food on a consistent basis.
– Easier to get economies of scale in buying ingredients.
– Easier to reduce waste and control costs.
– Most importantly, there will be exciting menu items for every guest for every mood or occasion.
In addition to working to create the best menu with the fewest number of menu items, we will continuously analyze what
the appropriate “everyday” price points should be without having to resort to heavy discounting.
We will conduct a comprehensive ROI analysis to evaluate both the top- and bottom-line results.
– The TURF method will help Olive Garden significantly increase guest counts, increase guest satisfaction, andreduce food and labor costs, all with a menu that the entire staff loves to prepare and serve to its guests.
For example,
Hillstone/
Houston’s does afabulous job of
offering great
variety with a
limited menu
Source: Hillstone.
Going back to Olive Garden’s authentic roots...
Successful dishes like the Pork Filettino were popular, healthy, and profitable from Olive Garden’spast can be part of menu revitalization.
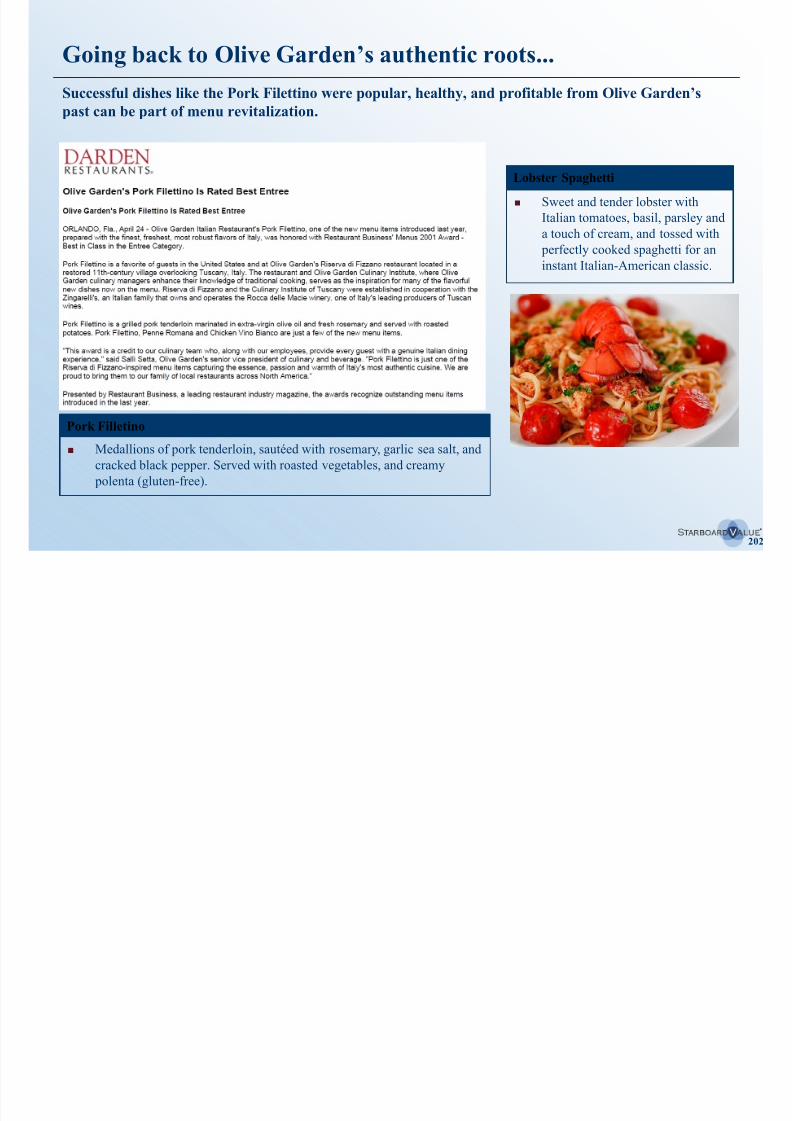
8/11/2019 Starboard Value Transforming Darden
http://slidepdf.com/reader/full/starboard-value-transforming-darden 202/294
202
Pork Filletino
Medallions of pork tenderloin, sautéed with rosemary, garlic sea salt, and
cracked black pepper. Served with roasted vegetables, and creamy
polenta (gluten-free).
Sweet and tender lobster with
Italian tomatoes, basil, parsley and
a touch of cream, and tossed with
perfectly cooked spaghetti for an
instant Italian-American classic.
Lobster Spaghetti
…while moving Olive Garden forward
We have already begun working with renowned chefs to develop dishes that may be perfect for the Olive
Garden customer today. Of course, these changes, and many others, will be thoroughly tested before
being rolled out.
8/11/2019 Starboard Value Transforming Darden
http://slidepdf.com/reader/full/starboard-value-transforming-darden 203/294
203
Nonna’s Chicken Soup
Best chicken soup in the industry, like grandma used
to make.
Rich chicken broth, with pulled natural chicken,
simmered vegetables, a touch of lemon zest and adrizzle of extra virgin olive oil. We suggest a spoonful
of grated Pecorino Romano to really set this off!
(Gluten Free).
Fresh Antipasti
Freshly roasted vegetables, olives, fresh mozzarella,
honeyed Pecorino Romano, thinly shaved Prosciutto
de Parma, and extra virgin olive oil.
Vegetable Bolognese
Roasted seasonal vegetables simmered in rich ripe
tomato sauce, with toasted fennel, fresh basil, and
parsley, finished with extra virgin olive oil. So rich
and layered in flavor that you would never know it
was meatless.
Olive Garden can offer numerous great tasting,
authentically Italian dishes that can be executed
consistently and profitably
Italian authenticity and fresh ingredients will bethe driving force behind our culinary decision
making
Make service a top priority
Focus should be on making the experience special for customers to drive recurring traffic.
4
Solution:
8/11/2019 Starboard Value Transforming Darden
http://slidepdf.com/reader/full/starboard-value-transforming-darden 204/294
204
Solution:
Current service appear tolacks energy, pride, passion,
and focus.
Service lacks energy
Good, consistent service is a key driver of traffic
Re-train personnel, starting with a clear understanding of the vision while specificallyclarifying responsibilities and accountabilities.
Servers would be knowledgeable, deft, happy, and genuinely passionate. The speed
of service will be comfortably fast from being seated, to servers taking your order, to
the delivery of the food to the table, to the placing of the check.
Restaurant teams will be held to the highest standards and be treated with the utmost of
respect. Environment should be focused on positivity rather than uncertainty and fear.
Create a sense of ownership among servers and managers.
What do employees want from management? i) to be held at the highest standards and
ii) to be treated with the utmost respect.
“The goal is to be fully staffed in every restaurant with every position, with
talented, skilled and experienced employees.” - Joe Lee, November 9, 2005
Align incentives for General Managers
Must properly incentivize the GMs so their interests are aligned with maximizing profits, while giving
them the ability to increase traffic in their restaurants.
5
Solution:
8/11/2019 Starboard Value Transforming Darden
http://slidepdf.com/reader/full/starboard-value-transforming-darden 205/294
205
Today, we believe Darden’s GMs are paid less than their counterparts atpeer firms. This must be changed, as Darden is currently losing their top
talent to competitors.
Ensure interests are aligned:
– Bloomin’ and Texas Roadhouse have recognized the importance of GMs
and have actually adopted a partner model where GMs have an ownership
or P&L interest in their respective restaurant.
– Establish simple to understand bonus targets such as traffic growth andcash flow generated to calculate GMs’ bonus payout.
GMs must feel as though they can speak up and affect change.
We wish to empower the GMs, servers, cooks, hostesses, and all other restaurant
employees by listening to their thoughts on restaurant operations. Darden must
return to the operationally-focused organization of the past and management
must have their “ear to the ground” on restaurant operations.
We believe the restaurant General Managers are the most important
individuals in a casual dining company – they should have a compensation
structure that promotes an ownership mentality.
Solution:
Incentive compensation
structure does not allow GMs
to act as though they have
skin in the game.
GMs lack ownership
mentality
Management must regularly empower the GMs by recognizing successes and encouraging new ideas to
improve the restaurants
Proved successful for Olive Garden before
“We really want the general
managers to know how much we
appreciate them and appreciate
their role.”
- Joe Lee, November 9, 2005
Source: Company filings.
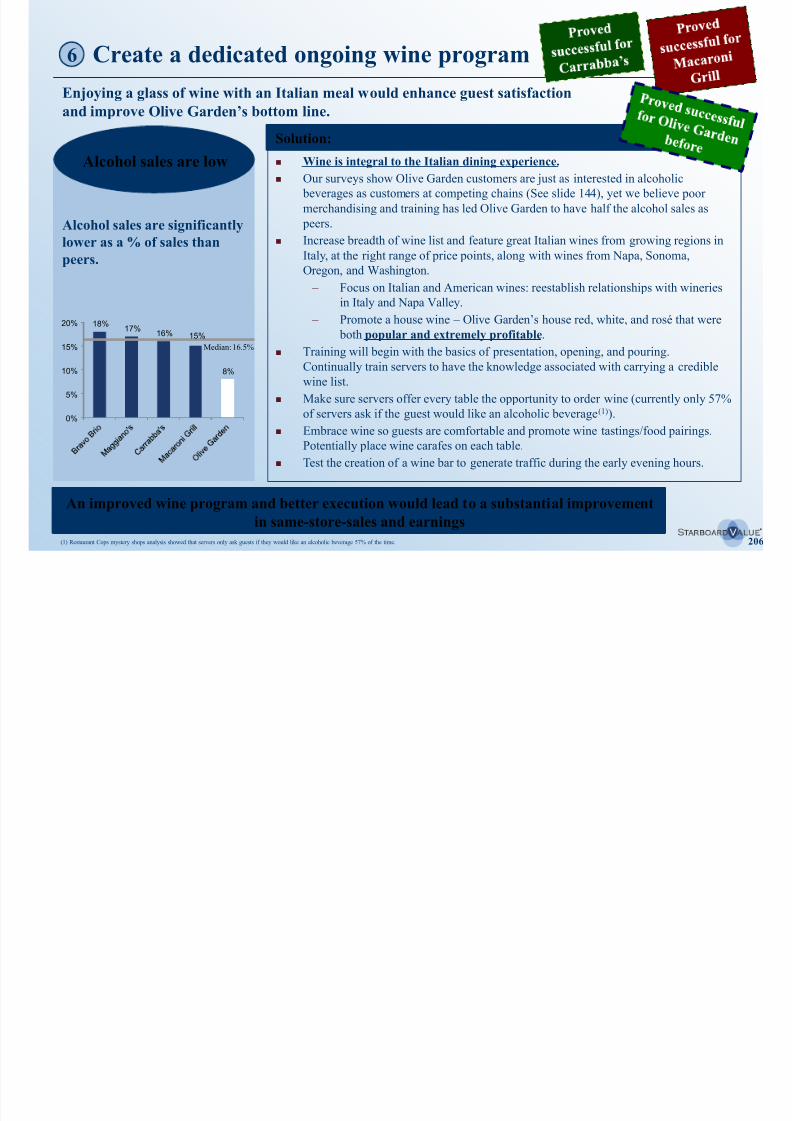
8/11/2019 Starboard Value Transforming Darden
http://slidepdf.com/reader/full/starboard-value-transforming-darden 206/294
8/11/2019 Starboard Value Transforming Darden
http://slidepdf.com/reader/full/starboard-value-transforming-darden 207/294
8/11/2019 Starboard Value Transforming Darden
http://slidepdf.com/reader/full/starboard-value-transforming-darden 208/294
Innovate to stay relevant
Reestablish a culture of innovation and forward-thinking.
9
It t l b i it t d t d d di t ’ d
Solution:Flat-footed when it
8/11/2019 Starboard Value Transforming Darden
http://slidepdf.com/reader/full/starboard-value-transforming-darden 209/294
209
It must always be a priority to understand and predict consumers’ needs.
– Continuously benchmark against best practices in the industry, but
with an eye toward innovation.
Be prepared to experiment, but in a controlled environment such as a “living
lab” at one or several restaurants.
Reestablish ties with Italy for food development, building design, and
advertising.
Solicit the opinions of those closest to the action, such as managers, cooks,servers, hosts, and dishwashers. Listen and value their ideas.
Potential introduction of antipasti and wine bar concept.
– Wine tastings on weekdays in the early evening with antipasti tastings for
a flat fee. This may increase traffic for the after-work crowd before
dinner.
Need great leaders and great sites to innovate and stay relevant.
Better understand the needs that are driving consumers to fast-casual and
better deliver on those needs, where appropriate.
We believe Olive Garden has
been lacking appeal to growthdemographics and is a
laggard in food quality and
relevance.
comes to innovation
Continuous innovation, rather than adherence to rigid bureaucracy, would allow Olive Garden to stay
relevant generation after generation
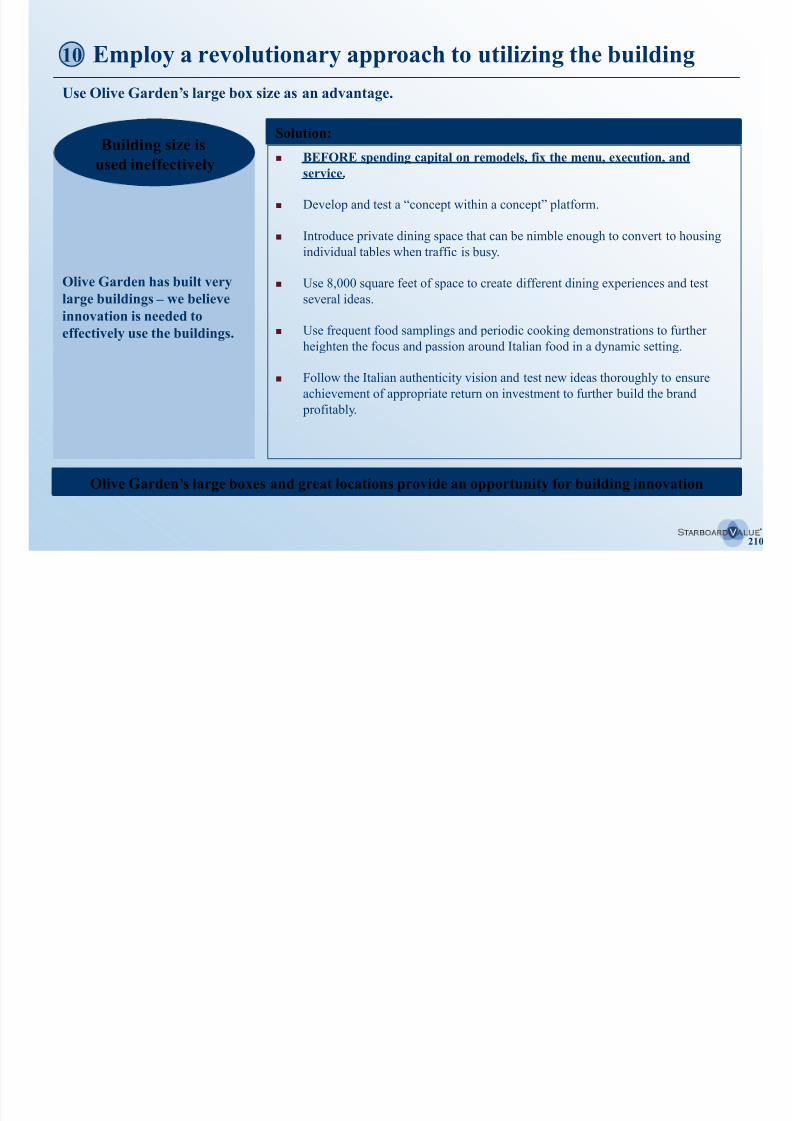
8/11/2019 Starboard Value Transforming Darden
http://slidepdf.com/reader/full/starboard-value-transforming-darden 210/294
Potential opportunity: “Concept within a concept”
Given the large box sizes of Olive Garden stores, we see an opportunity to drive profits by potentially
using 8,000 square feet of space to create different dining experiences and test several ideas.
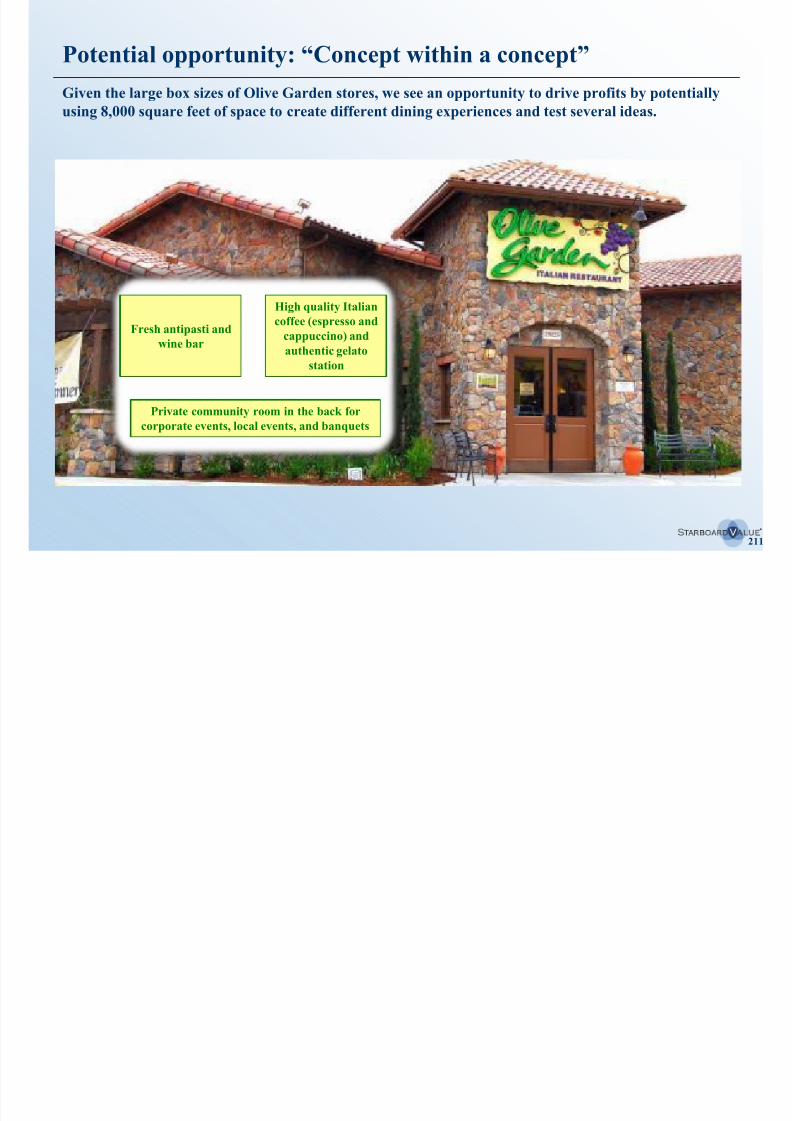
8/11/2019 Starboard Value Transforming Darden
http://slidepdf.com/reader/full/starboard-value-transforming-darden 211/294
211
Fresh antipasti and
wine bar
High quality Italian
coffee (espresso and
cappuccino) and
authentic gelato
station
Private community room in the back for
corporate events, local events, and banquets
Engage customers via marketing and advertising
Develop more focused and efficient advertising by improving customer engagement and evaluating the
spending mix for optimal effectiveness.
11
Solution:I ffi i t d ti i
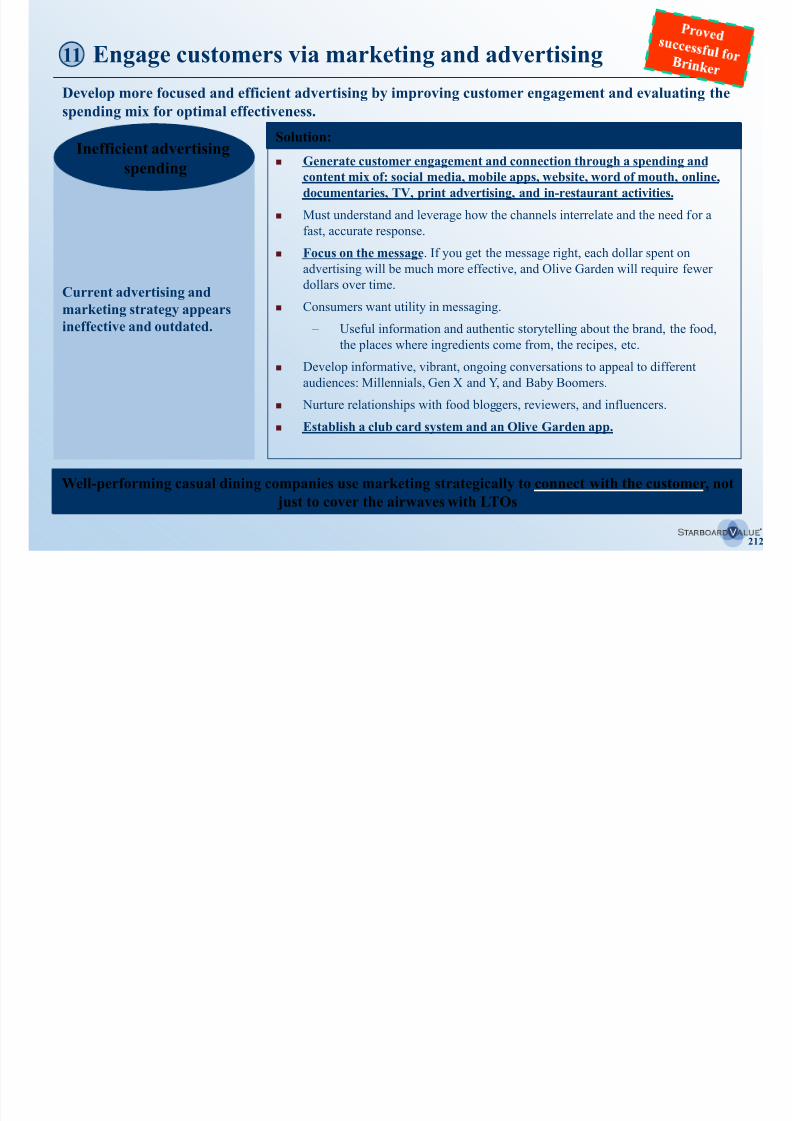
8/11/2019 Starboard Value Transforming Darden
http://slidepdf.com/reader/full/starboard-value-transforming-darden 212/294
212
Generate customer engagement and connection through a spending andcontent mix of: social media, mobile apps, website, word of mouth, online,
documentaries, TV, print advertising, and in-restaurant activities.
Must understand and leverage how the channels interrelate and the need for a
fast, accurate response.
Focus on the message. If you get the message right, each dollar spent on
advertising will be much more effective, and Olive Garden will require fewer
dollars over time.
Consumers want utility in messaging.
– Useful information and authentic storytelling about the brand, the food,
the places where ingredients come from, the recipes, etc.
Develop informative, vibrant, ongoing conversations to appeal to different
audiences: Millennials, Gen X and Y, and Baby Boomers.
Nurture relationships with food bloggers, reviewers, and influencers.
Establish a club card system and an Olive Garden app.
Current advertising andmarketing strategy appears
ineffective and outdated.
Inefficient advertising
spending
Well-performing casual dining companies use marketing strategically to connect with the customer, not
just to cover the airwaves with LTOs
Capitalize on today’s technology
Olive Garden must quickly embrace today’s technology and look to the future.
12
Understand that guests live in a digital world including while dining at a
Solution:Not using today’s
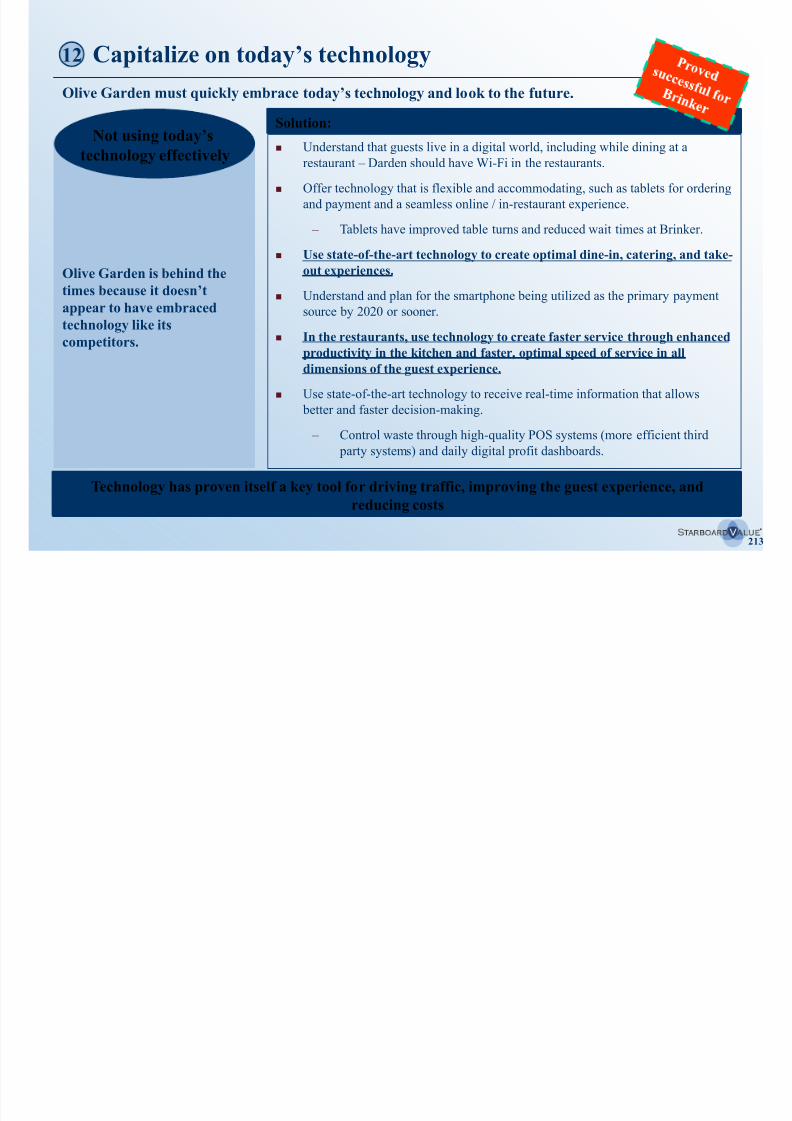
8/11/2019 Starboard Value Transforming Darden
http://slidepdf.com/reader/full/starboard-value-transforming-darden 213/294
213
Understand that guests live in a digital world, including while dining at a
restaurant – Darden should have Wi-Fi in the restaurants.
Offer technology that is flexible and accommodating, such as tablets for ordering
and payment and a seamless online / in-restaurant experience.
– Tablets have improved table turns and reduced wait times at Brinker.
Use state-of-the-art technology to create optimal dine-in, catering, and take-
out experiences.
Understand and plan for the smartphone being utilized as the primary paymentsource by 2020 or sooner.
In the restaurants, use technology to create faster service through enhanced
productivity in the kitchen and faster, optimal speed of service in all
dimensions of the guest experience.
Use state-of-the-art technology to receive real-time information that allows
better and faster decision-making.
– Control waste through high-quality POS systems (more efficient third
party systems) and daily digital profit dashboards.
Olive Garden is behind the
times because it doesn’tappear to have embraced
technology like its
competitors.
technology effectively
Technology has proven itself a key tool for driving traffic, improving the guest experience, and
reducing costs
We believe Olive Garden can use technology to become anattractive alternative to Fast Casual at lunch
By utilizing technology, guests can place their order on the way to the restaurant and, after being
We believe there is an opportunity for Olive Garden to compete in the fast lunch arena with a 20 – 30
minute lunch offering. Order in Advance…
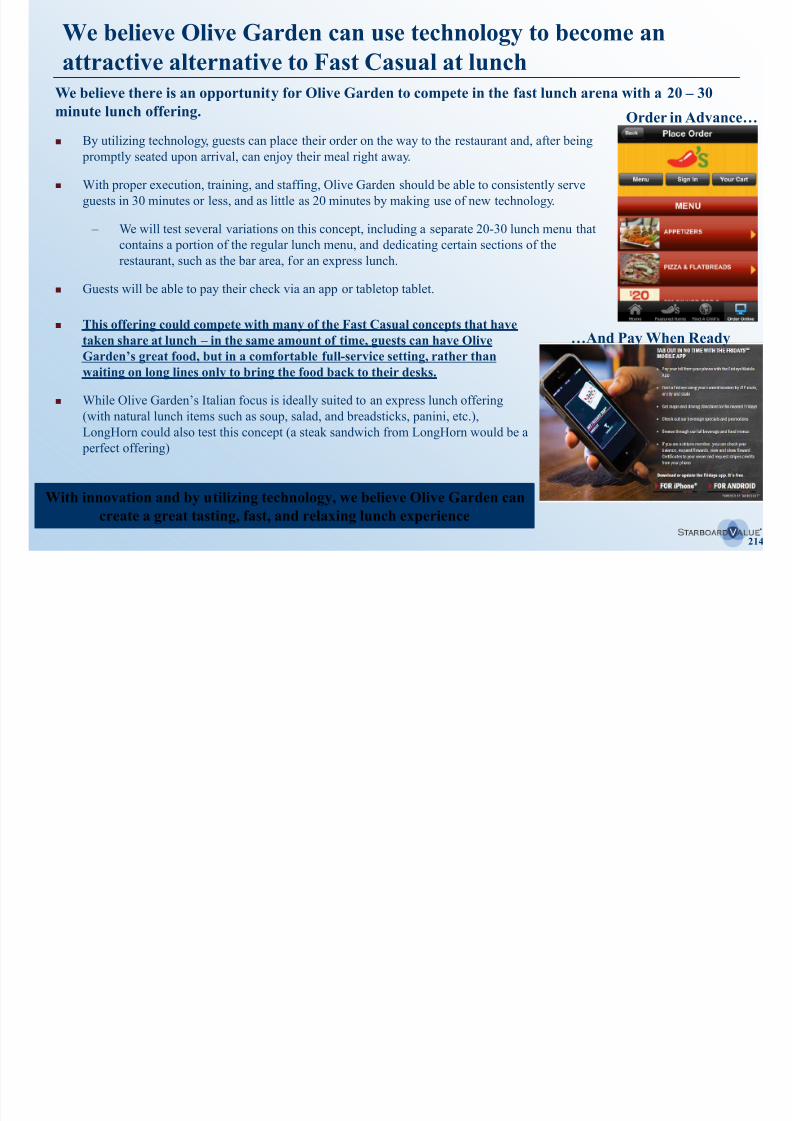
8/11/2019 Starboard Value Transforming Darden
http://slidepdf.com/reader/full/starboard-value-transforming-darden 214/294
214
y g gy g p y g
promptly seated upon arrival, can enjoy their meal right away.
With proper execution, training, and staffing, Olive Garden should be able to consistently serve
guests in 30 minutes or less, and as little as 20 minutes by making use of new technology.
– We will test several variations on this concept, including a separate 20-30 lunch menu that
contains a portion of the regular lunch menu, and dedicating certain sections of the
restaurant, such as the bar area, for an express lunch.
Guests will be able to pay their check via an app or tabletop tablet.
With innovation and by utilizing technology, we believe Olive Garden can
create a great tasting, fast, and relaxing lunch experience
This offering could compete with many of the Fast Casual concepts that have
taken share at lunch – in the same amount of time, guests can have Olive
Garden’s great food, but in a comfortable full-service setting, rather than
waiting on long lines only to bring the food back to their desks.
While Olive Garden’s Italian focus is ideally suited to an express lunch offering
(with natural lunch items such as soup, salad, and breadsticks, panini, etc.),LongHorn could also test this concept (a steak sandwich from LongHorn would be a
perfect offering)
…And Pay When Ready
Appeal to the correct demographics and their need for value
Embrace the Millennials, but never leave the Boomers behind.
13
Solution:Lost touch with
8/11/2019 Starboard Value Transforming Darden
http://slidepdf.com/reader/full/starboard-value-transforming-darden 215/294
215
Consumer insights require a deep understanding of how various consumer
segments live today, what they want, and what they need for a relevant and
satisfying restaurant experience.
– This is true for all Millennials, Gen X and Y, and Baby Boomers.
Offer flexible formats and experiences based on the customers’ mood and
needs.
Use environmentally friendly and sustainable practices.
Create a community feeling and a place where customers WANT to spend
time.
Become integrated into the neighborhood and community around each
restaurant.
Make the consumer feel happy and satisfied while offering a fair price.
We believe Olive Garden has
forgotten its main objective is
to deliver value to their core
customer.
core demographics
Olive Garden needs to tailor its guest experience to both current and future customers
Improve the labor model
Institute a better team service, including better execution from servers and in the kitchen.
14
Solution:
8/11/2019 Starboard Value Transforming Darden
http://slidepdf.com/reader/full/starboard-value-transforming-darden 216/294
216
One of the biggest drivers of increasing margins is labor.
– Focus on consistent food and faster service, while eliminating some
kitchen positions and reduce labor costs.
Engineer efficient kitchens to bring down labor costs.
Change the front-of-the-house service to rely more on tipped servers, less on
higher-salaried or higher-wage bussers and food runners.
Delivering a better guest experience through enhanced labor will satisfycustomers and reduce costs.
Effectively manage schedules so that cooks can do less prep work and delegate
that to part-timers.
Optimize scheduling to account for peak periods and slow times.
Increase performance-based incentive pay. Connect important financial
metrics and guest satisfaction measures to labor efficiencies.
Heightened importance on restaurant general managers with a keen focus on
superior training strategies.
With its very high AUV and
average check, Olive Garden
should be among the lowest in
terms of labor costs.
Surprisingly, Olive Garden
has some of the highest labor
costs.
High labor costs
Improved labor efficiency will improve margins and enhance the guest experience

8/11/2019 Starboard Value Transforming Darden
http://slidepdf.com/reader/full/starboard-value-transforming-darden 217/294
217
VII. Updated real estate valuation
Extensive real estate portfolio
Even after the Red Lobster Sale, Darden still has the largest real estate portfolio in the casual dining
industry, owning both the land and buildings on nearly 600 stores and the buildings on another 670.
In our March 31st Primer on Darden’s Real Estate (the “Real Estate Primer”, available at http://tinyurl.com/Primer-On-Darden-
Real-Estate), we presented an extensive valuation of Darden’s real estate based on proprietary work from Green Street Advisors
8/11/2019 Starboard Value Transforming Darden
http://slidepdf.com/reader/full/starboard-value-transforming-darden 218/294
218
) p p p y
(“Green Street”), the leading independent research firm specializing in real estate and REITs.(1)
In that presentation, weestablished that:
1. Darden’s real estate was worth approximately $4 billion, and possibly far more.
2. Separating the real estate could create an additional $1-2 billion of shareholder value.
3. A real estate separation could be structured with minimal debt breakage costs and management’s comments regarding
debt breakage costs are highly misleading.
4. In a real estate separation, Darden shareholders could maintain their current dividend on a combined basis, while the
combined companies will have lower payout ratios.
Although the Red Lobster Sale reduced the size of the real estate opportunity, the price paid by ARCP confirmed our belief that
Darden’s real estate is highly valuable, and in fact suggests that our original valuation was conservative.
– Pro forma for the Red Lobster Sale, we believe that Darden’s remaining real estate is worth $2.5 to $3 billion.
This is substantially more than the implied value that Darden receives by owning those properties from the “rent
subsidy” that it effectively receives.
– Net of the value that the properties are worth inside of Darden, we believe that a real estate separation could create
approximately $1 billion in shareholder value.
– Further, we still believe that a real estate separation can be structured in a tax-efficient manner and with minimal
breakage costs, all while enhancing Darden’s credit profile and supporting its dividend.
We believe that Darden’s remaining real estate is worth $2.5 to $3 billion, and that separating the realestate could create ~$6 - $10 of value per share
Note: The valuations referenced in the Real Estate Primer are estimates and, therefore, there can be no assurance that such estimates are reflective of actual realizable value. While there could be additional information regard ing Darden’s real estate assets that
could alter the valuations referenced in the Real Estate Primer, Starboard strongly believes that the assumptions used in such valuations are conservative, and that the incorporation of any such additional data would likely to lead to a higher valuation range.
(1) It cannot be guaranteed that the analysis performed by Green Street is, or would be, consistent with analyses performed by ot her financial advisors. Accordingly, different a nalyses may yield different results.
Substantial value creation opportunity
We believe the real estate is worth more separated from Darden.
Along with Green Street, we looked at a variety of valuation scenarios, including:
– A location-by-location analysis of appropriate rent and cap rates (the “Base Case”)
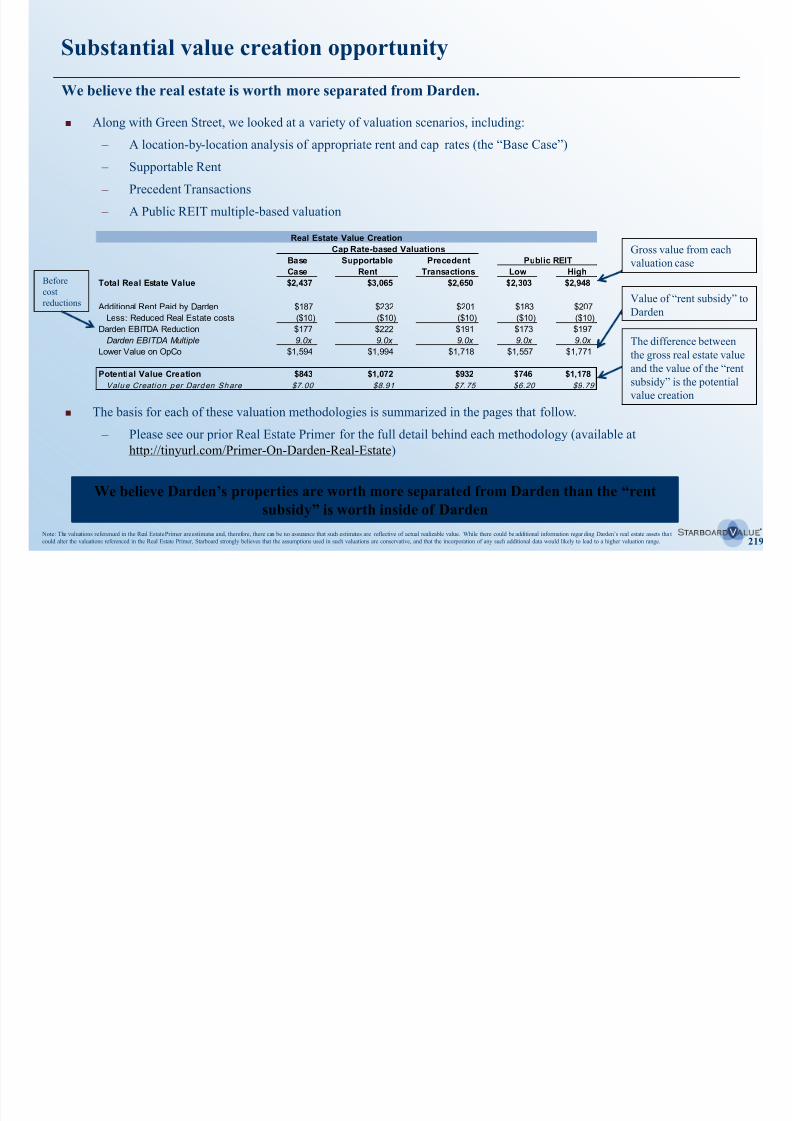
8/11/2019 Starboard Value Transforming Darden
http://slidepdf.com/reader/full/starboard-value-transforming-darden 219/294
219
We believe Darden’s properties are worth more separated from Darden than the “rentsubsidy” is worth inside of Darden
y y pp p p ( )
– Supportable Rent
– Precedent Transactions
– A Public REIT multiple-based valuation
The basis for each of these valuation methodologies is summarized in the pages that follow.
– Please see our prior Real Estate Primer for the full detail behind each methodology (available at
http://tinyurl.com/Primer-On-Darden-Real-Estate)
Real Estate Value Creation
Cap Rate-based Valuations
Base Supportable Precedent Public REIT
Case Rent Transactions Low High
Total Real Estate Value $2,437 $3,065 $2,650 $2,303 $2,948
Additional Rent Paid by Darden $187 $232 $201 $183 $207
Less: Reduced Real Estate costs ($10) ($10) ($10) ($10) ($10)
Darden EBITDA Reduction $177 $222 $191 $173 $197
Darden EBITDA Multiple 9.0x 9.0x 9.0x 9.0x 9.0x
Lower Value on OpCo $1,594 $1,994 $1,718 $1,557 $1,771
Potential Value Creation $843 $1,072 $932 $746 $1,178
Value Creati on per Darden Share $7.00 $8.91 $7.75 $6.20 $9.79
Before
costreductions
Gross value from each
valuation case
Value of “rent subsidy” to
Darden
The difference between
the gross real estate value
and the value of the “rent
subsidy” is the potential
value creation
Note: The valuations referenced in the Real Estate Primer are estimates and, therefore, there can be no assurance that such estimates are reflective of actual realizable value. While there could be additional information regar ding Darden’s real estate assets that
could alter the valuations referenced in the Real Estate Primer, Starboard strongly believes that the assumptions used in such valuations are conservative, and that the incorporation of any such additional data would likely to lead to a higher valuation range.
Numerous feasible structures
We believe that there are a number of highly attractive alternatives to realize value from Darden’s realestate.
8/11/2019 Starboard Value Transforming Darden
http://slidepdf.com/reader/full/starboard-value-transforming-darden 220/294
220
An outright sale of the properties, either in whole or in part
A spin-off of all of Darden’s real estate or just the fully owned (“Fee Simple”) properties as a publiclytraded REIT
A tax-efficient sale or merger with another REIT
1
2
3
We continue to believe that a tax-efficient sale or merger is likely to be the best alternative for Darden
shareholders
For each of these business alternatives, there are a variety of specific transaction structures that could be used, asillustrated in detail in our Real Estate Primer (available at http://tinyurl.com/Primer-On-Darden-Real-Estate).
Although the Red Lobster Sale reduces the size of any potential real estate separation, we still believe that each of these
alternatives is viable without Red Lobster’s real estate.
We also still believe that each of these three alternatives, or a combination thereof, could be accomplished while
maintaining and strengthening Darden’s current dividend and investment grade rating and minimizing debt breakage.
– In the Section XI, we lay out an illustrative transaction scenario that we believe will both accomplish these goals
and maximize value for Darden shareholders.
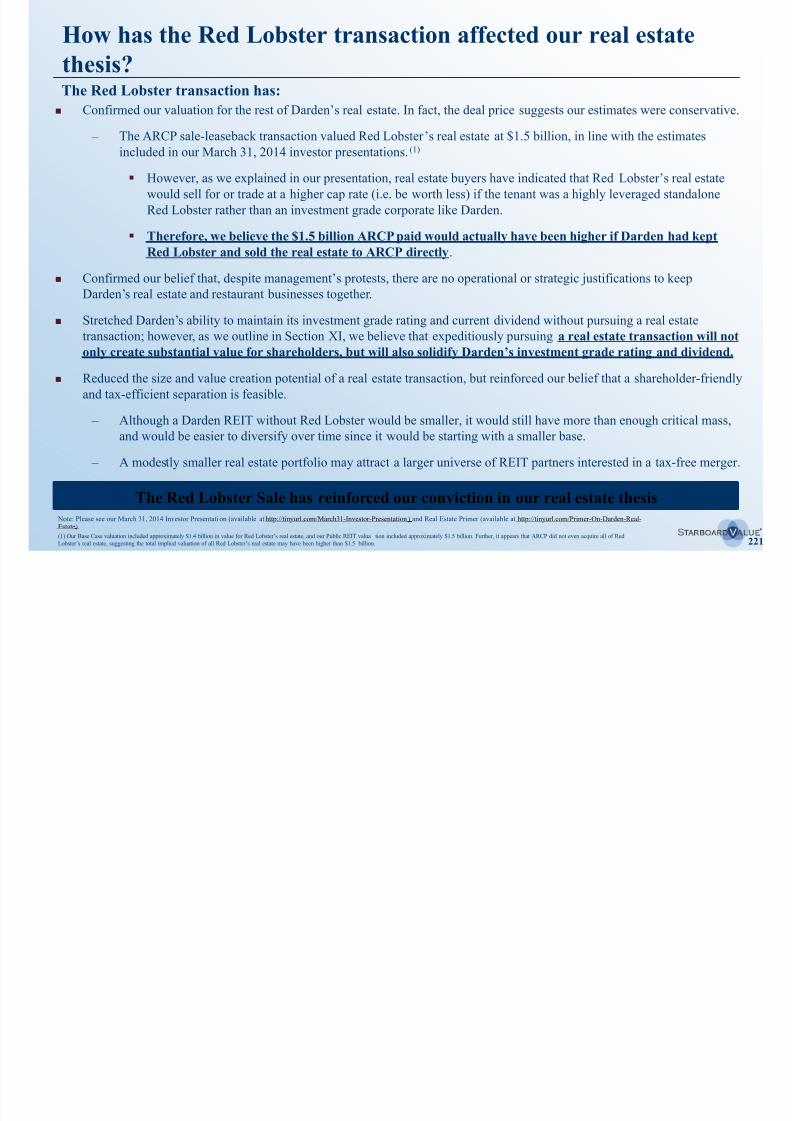
8/11/2019 Starboard Value Transforming Darden
http://slidepdf.com/reader/full/starboard-value-transforming-darden 221/294
Updated valuation: Base Case – key assumptions (cont’d)
Conservative assumptions support realistic valuation.
For Fee Simple stores, value is based on a cap rate and rent per square foot.
For Ground Leased stores, rental income is based on a “Second Lease” position, which reflects the rent that would be paid
on a fully owned store less the rent paid on the ground itself
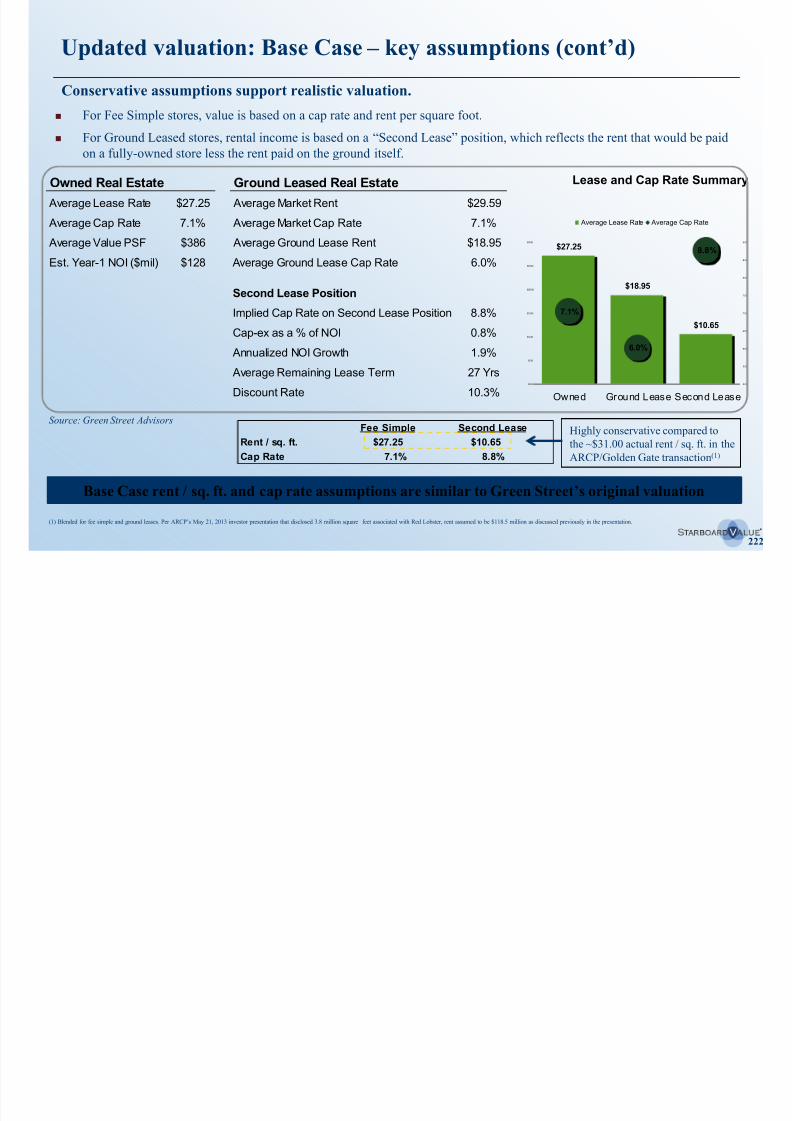
8/11/2019 Starboard Value Transforming Darden
http://slidepdf.com/reader/full/starboard-value-transforming-darden 222/294
222
on a fully-owned store less the rent paid on the ground itself.
Source: Green Street Advisors
Base Case rent / sq. ft. and cap rate assumptions are similar to Green Street’s original valuation
Owned Real Estate Ground Leased Real Estate
Average Lease Rate Average Market Rent
Average Cap Rate Average Market Cap Rate
Average Value PSF Average Ground Lease Rent
Est. Year-1 NOI ($mil) Average Ground Lease Cap Rate
Second Lease Position
Implied Cap Rate on Second Lease Position
Cap-ex as a % of NOI
Annualized NOI Growth
Average Remaining Lease Term
Discount Rate
1.9%
27 Yrs
10.3%
$386 $18.95
$128 6.0%
8.8%
0.8%
$27.25 $29.59
7.1% 7.1%
$27.25
$18.95
$10.65
7.1%
6.0%
8.8%
5.0%
5.5%
6.0%
6.5%
7.0%
7.5%
8.0%
8.5%
9.0%
$0.00
$5.00
$10.00
$15.00
$20.00
$25.00
$30.00
Owned Ground Lease Second Lease
Lease and Cap Rate Summary
Average Lease Rate Average Cap Rate
Fee Simple Second Lease
Rent / sq. ft. $27.25 $10.65
Cap Rate 7.1% 8.8%
Highly conservative compared to
the ~$31.00 actual rent / sq. ft. in the
ARCP/Golden Gate transaction(1)
(1) Blended for fee simple and ground leases. Per ARCP’s May 21, 2013 investor presentation that disclosed 3.8 million square feet associated with Red Lobster, rent assumed to be $118.5 million as discussed previously in the presentation.
Updated valuation: Base Case – Summary
In a base case, Green Street values the Fee Simple properties at approximately $1.8 billion and the
Ground Leased properties at approximately $0.6 billon.
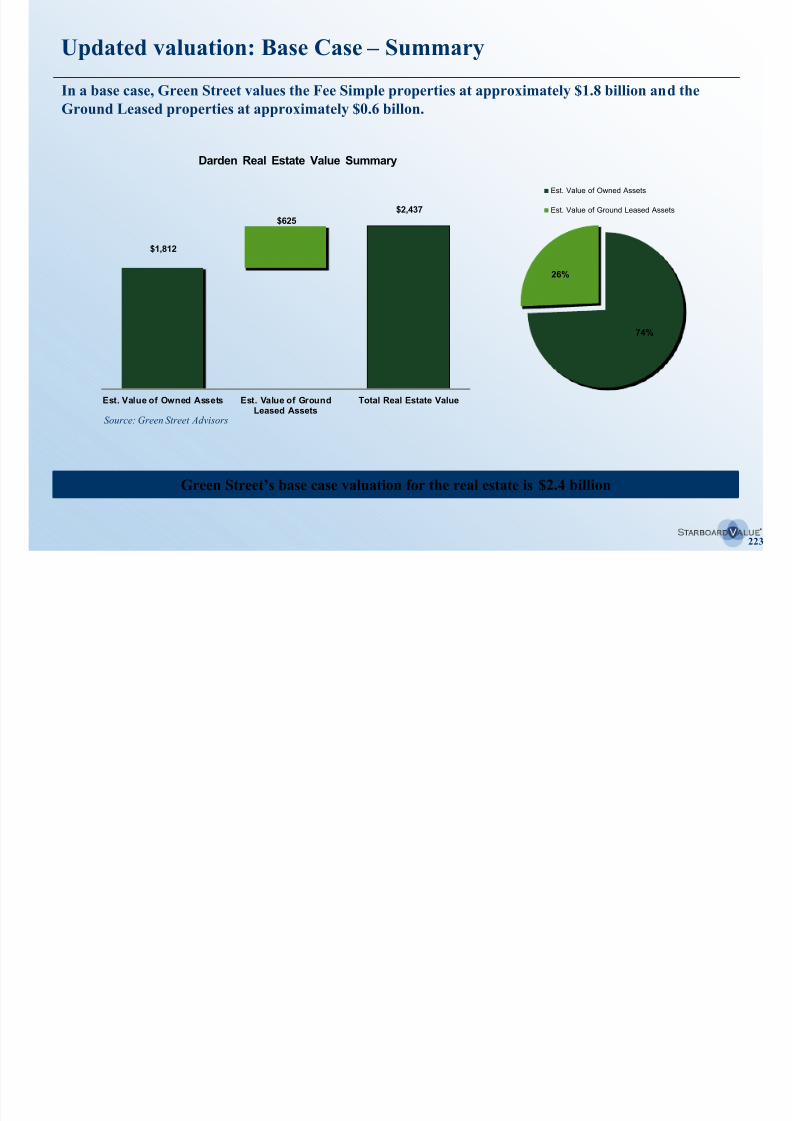
8/11/2019 Starboard Value Transforming Darden
http://slidepdf.com/reader/full/starboard-value-transforming-darden 223/294
223
Source: Green Street Advisors
Green Street’s base case valuation for the real estate is $2.4 billion
$1,812
$2,437
$625
Est. Value of Owned Assets Est. Value of GroundLeased Assets
Total Real Estate Value
Darden Real Estate Value Summary
74%
26%
Est. Value of Owned Assets
Est. Value of Ground Leased Assets
Updated valuation: Supportable Rent
In order to validate the Base Case, we analyzed the expected rent coverage in the Base Case and the
maximum supportable rent. According to Green Street, EBITDAR / rent coverage of 2.25x to 2.50x is often deemed adequate by net lease investors.
– This coverage range implies that the Darden operating company (“OpCo”) would have the ability to pay between
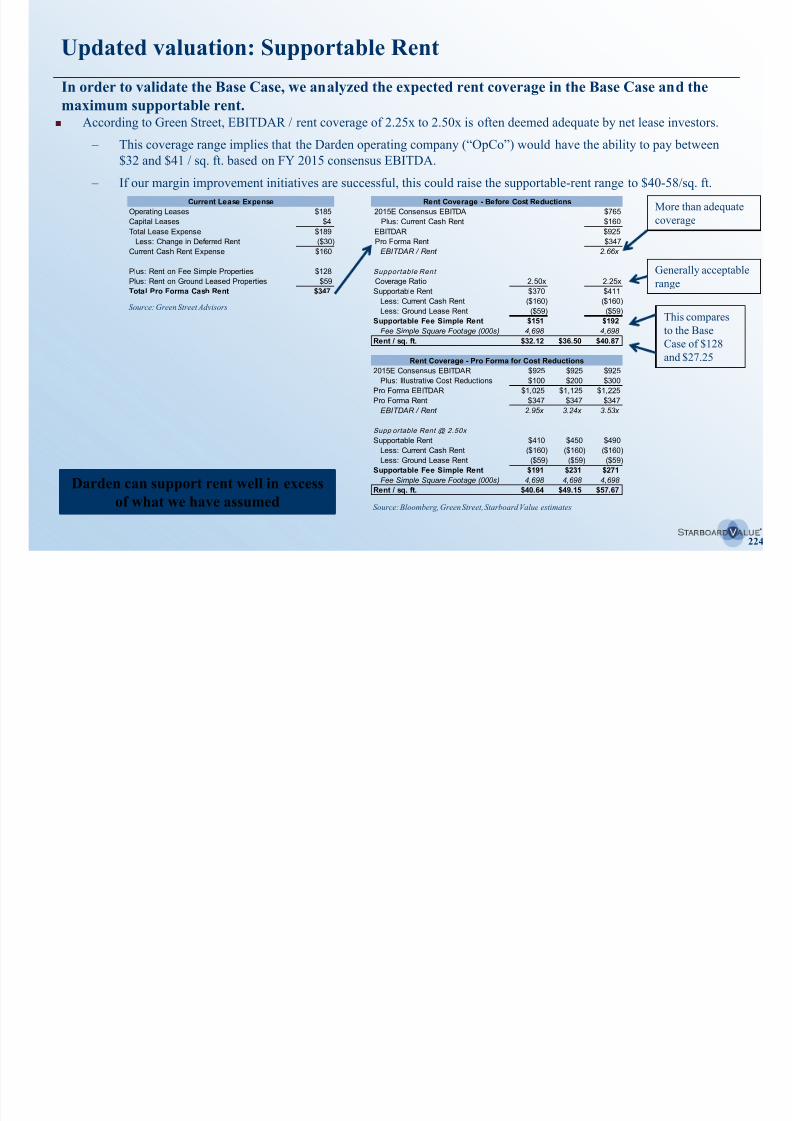
8/11/2019 Starboard Value Transforming Darden
http://slidepdf.com/reader/full/starboard-value-transforming-darden 224/294
224
Current Lease Expense Rent Coverage - Before Cost Reductions
Operating Leases $185 2015E Consensus EBITDA $765
Capital Leases $4 Plus: Current Cash Rent $160
Total Lease Expense $189 EBITDAR $925
Less: Change in Deferred Rent ($30) Pro Forma Rent $347
Current Cash Rent Expense $160 EBITDAR / Rent 2.66x
Plus: Rent on Fee Simple Properties $128 Supportable Rent
Plus: Rent on Ground Leased Properties $59 Coverage Ratio 2.50x 2.25x
Total Pro Forma Cash Rent $347 Supportable Rent $370 $411Less: Current Cash Rent ($160) ($160)
Less: Ground Lease Rent ($59) ($59)
Supportable Fee Simple Rent $151 $192
Fee Simple Square Footage (000s) 4,698 4,698
Rent / sq. ft. $32.12 $36.50 $40.87
Rent Coverage - Pro Forma for Cost Reductions
2015E Consensus EBITDAR $925 $925 $925
Plus: Illustrative Cost Reductions $100 $200 $300
Pro Forma EBITDAR $1,025 $1,125 $1,225
Pro Forma Rent $347 $347 $347
EBITDAR / Rent 2.95x 3.24x 3.53x
Supp ortable Rent @ 2.50x
Supportable Rent $410 $450 $490
Less: Current Cash Rent ($160) ($160) ($160)
Less: Ground Lease Rent ($59) ($59) ($59)
Supportable Fee Simple Rent $191 $231 $271
Fee Simple Square Footage (000s) 4,698 4,698 4,698
Rent / sq. ft. $40.64 $49.15 $57.67
$32 and $41 / sq. ft. based on FY 2015 consensus EBITDA. – If our margin improvement initiatives are successful, this could raise the supportable-rent range to $40-58/sq. ft.
Generally acceptable
range
This compares
to the Base
Case of $128
and $27.25
More than adequate
coverage
Source: Green Street Advisors
Source: Bloomberg, Green Street, Starboard Value estimates
Darden can support rent well in excess
of what we have assumed
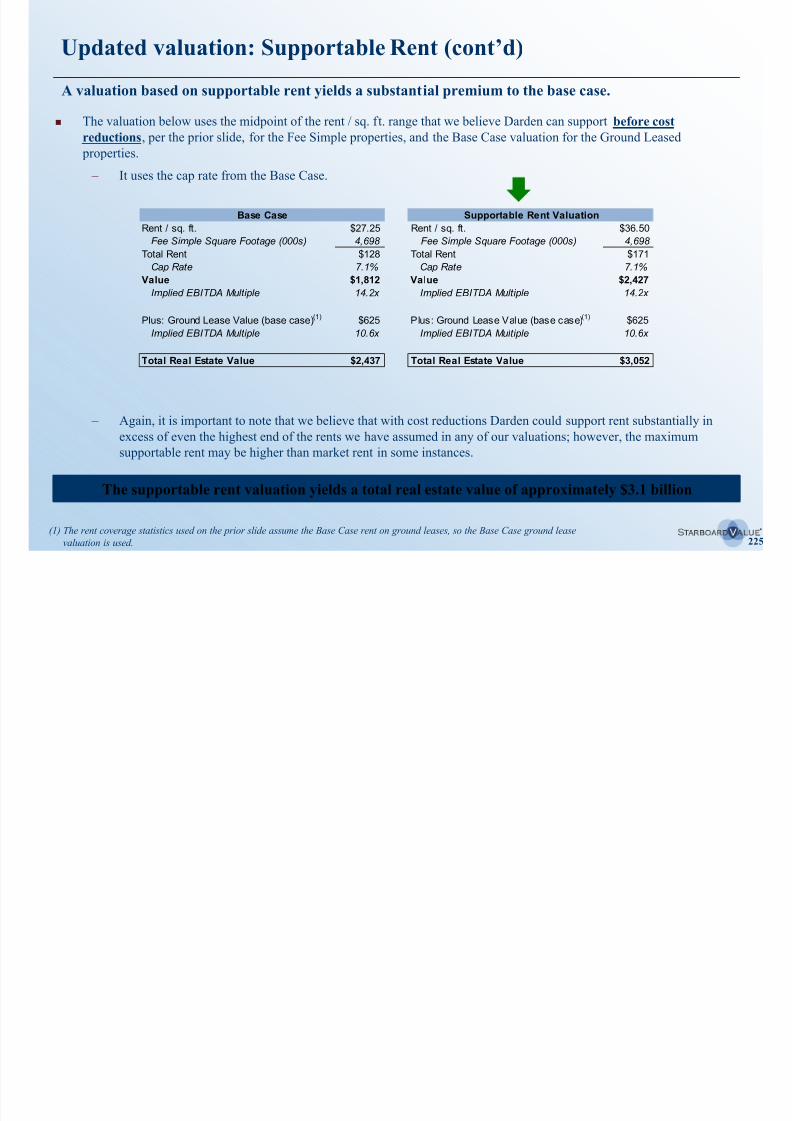
8/11/2019 Starboard Value Transforming Darden
http://slidepdf.com/reader/full/starboard-value-transforming-darden 225/294
Updated valuation: Precedent Transactions
We looked at a valuation based on the precedent transactions.
The valuation below uses the average rent / sq. ft. and cap rate for the middle 90% of transactions identified by Green
Street for the Fee Simple properties, and the Base Case valuation for the Ground Leased properties.

8/11/2019 Starboard Value Transforming Darden
http://slidepdf.com/reader/full/starboard-value-transforming-darden 226/294
226
– Please see our Real Estate Primer for a detailed listing of precedent transactions
We believe the 7.0% cap rate used is highly conservative, given that all of the units Darden would be selling are company-
owned, rather than franchised.
– According to Marcus & Millichap’s First Half 2014 Net-Leased Outlook , “Corporate-owned properties can change
hands in the low-6 percent range, while franchisee-occupied restaurants will trade at first-year returns
approximately 150 basis points higher.”
– The precedent transactions used were a mix of both corporate-owned and franchised stores.
(1) The precedent transactions did not include enough data on Second Lease transactions to provide a meaningfully different
alternative to the Base Case, so the Base Case assumptions were used.
Base Case Supportable Rent Valuation Precedent Transactions Valuation
Rent / sq. ft. $27.25 Rent / sq. ft. $36.50 Rent / sq. ft. $30.17
Fee Simple Square Footage (000s) 4,698 Fee Simple Square Footage (000s) 4,698 Fee Simple Square Footage (000s) 4,698
Total Rent $128 Total Rent $171 Total Rent $142
Cap Rate 7.1% Cap Rate 7.1% Cap Rate 7.0%
Value $1,812 Value $2,427 Value $2,025
Implied EBITDA Multiple 14.2x Implied EBITDA Multiple 14.2x Implied EBITDA Multiple 14.3x
Plus: Ground Lease Value (base case)(1) $625 Plus: Ground Lease Value (base case)(1) $625 Plus: Ground Lease Value (base case)(1) $625
Implied EBITDA Multiple 10.6x Implied EBITDA Multiple 10.6x Implied EBITDA Multiple 10.6x
Total Real Estate Value $2,437 Total Real Estate Value $3,052 Total Real Estate Value $2,650
The precedent transactions valuation yields a total real estate value of approximately $2.7 billion
Updated valuation: Public REIT
A valuation of a public REIT spin-off based on the average trading comparable yields a premium to
the Base Case.
The valuation uses a conservative multiple range that is a discount of approximately 15-25% to the LTM multiples of the
triple-net REIT peer group, to account for possible concerns about tenant concentration and ground leases.
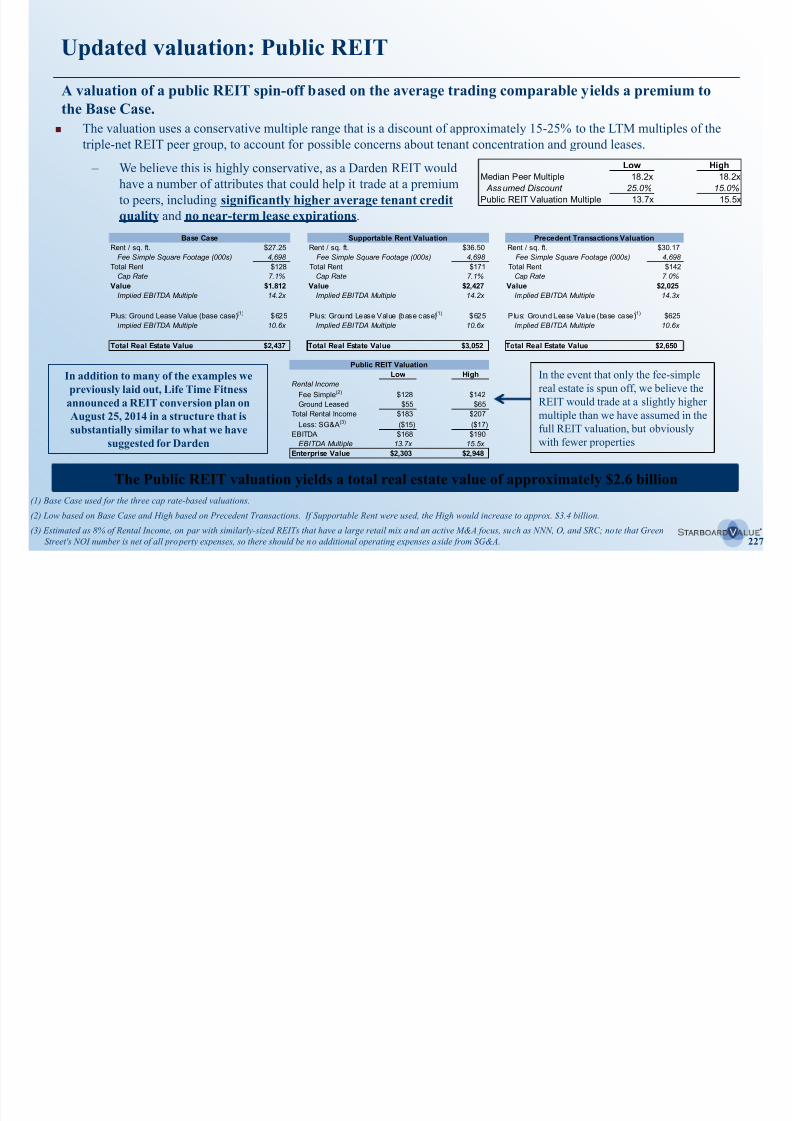
8/11/2019 Starboard Value Transforming Darden
http://slidepdf.com/reader/full/starboard-value-transforming-darden 227/294
227
Base Case Supportable Rent Valuation Precedent Transactions Valuation
Rent / sq. ft. $27.25 Rent / sq. ft. $36.50 Rent / sq. ft. $30.17
Fee Simple Square Footage (000s) 4,698 Fee Simple Square Footage (000s) 4,698 Fee Simple Square Footage (000s) 4,698
Total Rent $128 Total Rent $171 Total Rent $142
Cap Rate 7.1% Cap Rate 7.1% Cap Rate 7.0%
Value $1,812 Value $2,427 Value $2,025
Implied EBITDA Multiple 14.2x Implied EBITDA Multiple 14.2x Implied EBITDA Multiple 14.3x
Plus: Ground Lease Value (base case)(1) $625 Plus: Ground Lease Value (base case)(1) $625 Plus: Ground Lease Value (base case)(1) $625
Implied EBITDA Multiple 10.6x Implied EBITDA Multiple 10.6x Implied EBITDA Multiple 10.6x
Total Real Estate Value $2,437 Total Real Estate Value $3,052 Total Real Estate Value $2,650
Public REIT Valuation
Low High
Rental Income
Fee Simple(2) $128 $142
Ground Leased $55 $65
Total Rental Income $183 $207
Less: SG&A(3) ($15) ($17)EBITDA $168 $190
EBITDA Multiple 13.7x 15.5x
Enterprise Value $2,303 $2,948
(1) Base Case used for the three cap rate-based valuations.
(2) Low based on Base Case and High based on Precedent Transactions. If Supportable Rent were used, the High would increase to approx. $3.4 billion.
(3) Estimated as 8% of Rental Income, on par with similarly-sized REITs that have a large retail mix and an active M&A focus, such as NNN, O, and SRC; note that Green
Street's NOI number is net of all property expenses, so there should be no additional operating expenses aside from SG&A.
Low HighMedian Peer Multiple 18.2x 18.2x
Assumed Discount 25.0% 15.0%
Public REIT Valuation Multiple 13.7x 15.5x
– We believe this is highly conservative, as a Darden REIT wouldhave a number of attributes that could help it trade at a premium
to peers, including significantly higher average tenant credit
quality and no near-term lease expirations.
The Public REIT valuation yields a total real estate value of approximately $2.6 billion
In the event that only the fee-simple
real estate is spun off, we believe the
REIT would trade at a slightly higher
multiple than we have assumed in the
full REIT valuation, but obviously
with fewer properties
In addition to many of the examples we
previously laid out, Life Time Fitness
announced a REIT conversion plan on
August 25, 2014 in a structure that is
substantially similar to what we have
suggested for Darden
Updated valuation: Summary
Various methodologies support real estate value.
Along with Green Street, we have looked at a variety of valuation scenarios, including a location-by-location analysis of
appropriate rent and cap rates (Base Case), Supportable Rent, Precedent Transactions, and Public REIT analyses.
Based on these analyses, we believe the real estate is worth approximately $2.5 to $3 billion, and possibly far more.
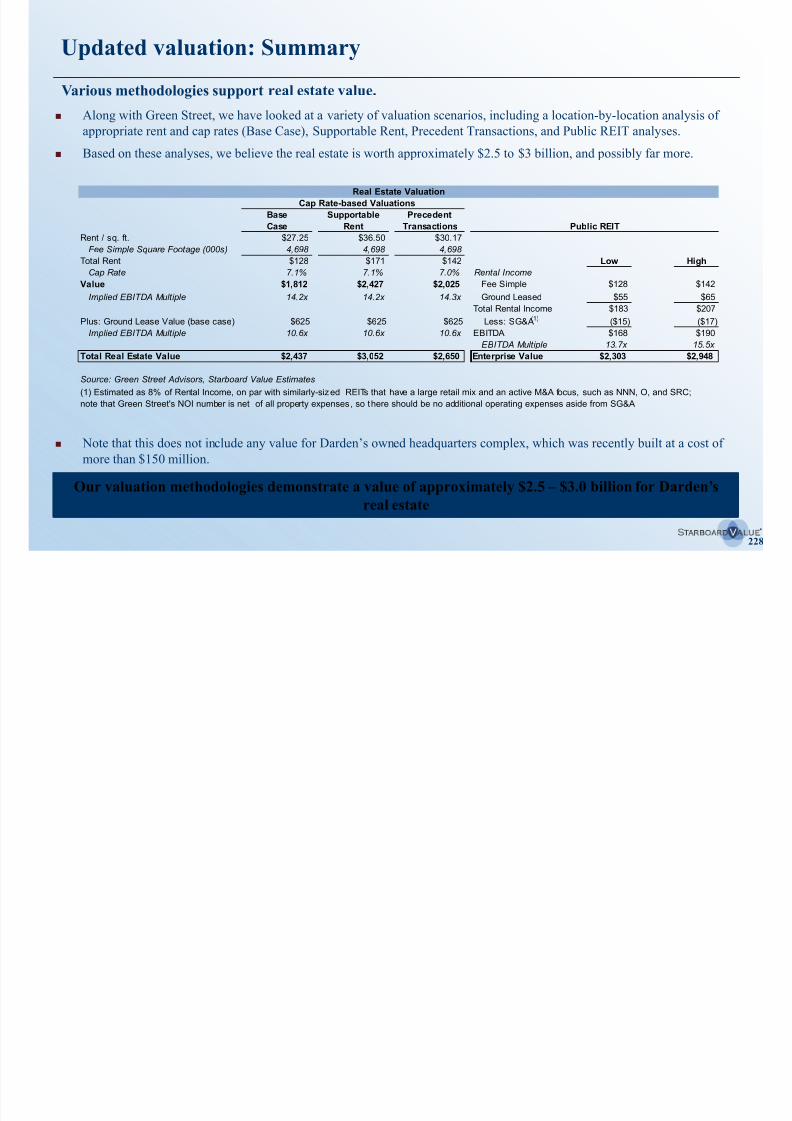
8/11/2019 Starboard Value Transforming Darden
http://slidepdf.com/reader/full/starboard-value-transforming-darden 228/294
228
Based on these analyses, we believe the real estate is worth approximately $2.5 to $3 billion, and possibly far more.
Note that this does not include any value for Darden’s owned headquarters complex, which was recently built at a cost of
more than $150 million.
Real Estate Valuation
Cap Rate-based Valuations
Base Supportable Precedent
Case Rent Transactions Public REIT
Rent / sq. ft. $27.25 $36.50 $30.17
Fee Simple Square Footage (000s) 4,698 4,698 4,698
Total Rent $128 $171 $142 Low High
Cap Rate 7.1% 7.1% 7.0% Rental Income
Value $1,812 $2,427 $2,025 Fee Simple $128 $142
Implied EBITDA Multiple 14.2x 14.2x 14.3x Ground Leased $55 $65Total Rental Income $183 $207
Plus: Ground Lease Value (base case) $625 $625 $625 Less: SG&A(1) ($15) ($17)
Implied EBITDA Multiple 10.6x 10.6x 10.6x EBITDA $168 $190
EBITDA Multiple 13.7x 15.5x
Total Real Estate Value $2,437 $3,052 $2,650 Enterprise Value $2,303 $2,948
Source: Green Street Advisors, Starboard Value Estimates
(1) Estimated as 8% of Rental Income, on par with similarly-sized REITs that have a large retail mix and an active M&A focus, such as NNN, O, and SRC;
note that Green Street's NOI number is net of all property expenses, so there should be no additional operating expenses aside from SG&A
Our valuation methodologies demonstrate a value of approximately $2.5 – $3.0 billion for Darden’sreal estate
Management’s incentives with regard to the real estate appear toconflict with those of shareholdersManagement seemingly gets a perceived benefit from owning real estate.
Since Darden owns substantially more real estate than peers, Darden’s reported operating expenses are meaningfully
understated compared to peers, and Darden’s margins are therefore overstated.
Excluding the rent “subsidy” that Darden currently gets from owning its properties, Darden’s operating performance is
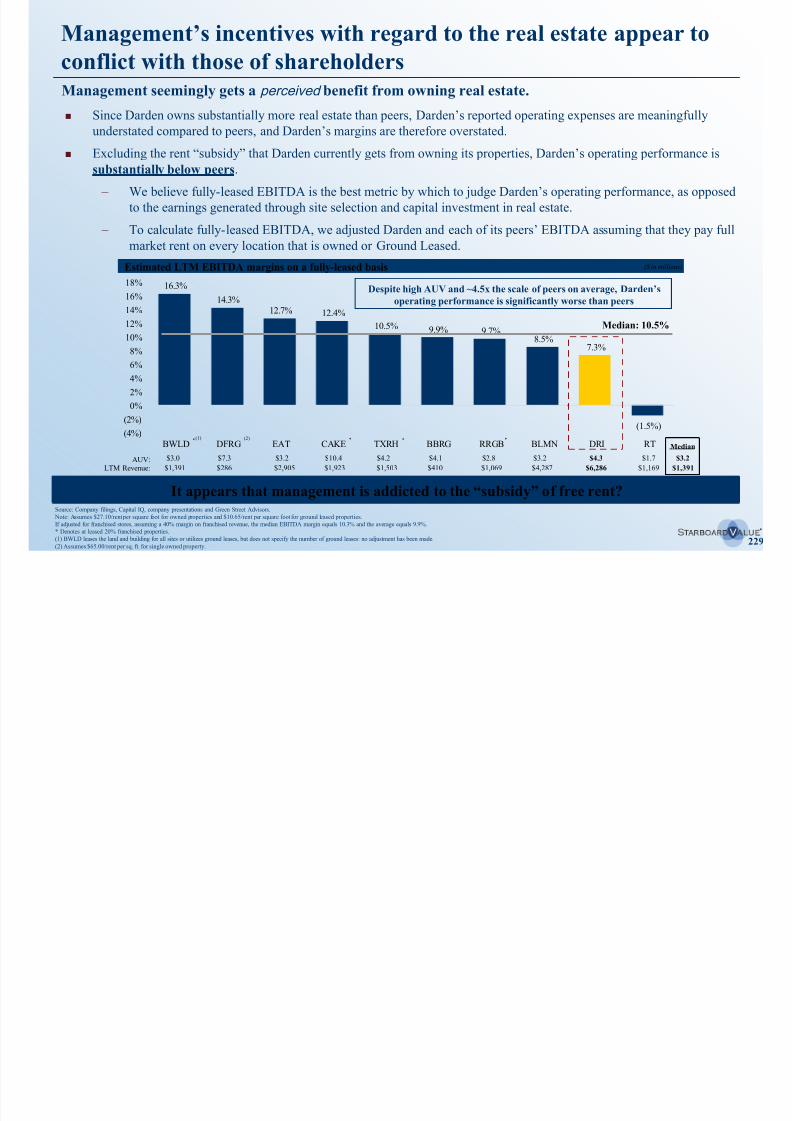
8/11/2019 Starboard Value Transforming Darden
http://slidepdf.com/reader/full/starboard-value-transforming-darden 229/294
229
c ud g t e e t subs dy t at a de cu e t y gets o ow g ts p ope t es, a de s ope at g pe o a ce s
substantially below peers.
– We believe fully-leased EBITDA is the best metric by which to judge Darden’s operating performance, as opposed
to the earnings generated through site selection and capital investment in real estate.
– To calculate fully-leased EBITDA, we adjusted Darden and each of its peers’ EBITDA assuming that they pay full
market rent on every location that is owned or Ground Leased.
Source: Company filings, Capital IQ, company presentations and Green Street Advisors.
Note: Assumes $27.10/rent per square foot for owned properties and $10.65/rent per square foot for ground leased properties.
If adjusted for franchised stores, assuming a 40% margin on franchised revenue, the median EBITDA margin equals 10.3% and the average equals 9.9%.
* Denotes at leased 20% franchised properties.
(1) BWLD leases the land and building for all sites or utilizes ground leases, but does not specify the number of ground leases: no adjustment has been made.
(2) Assumes $65.00/rent per sq. ft. for single owned property.
It appears that management is addicted to the “subsidy” of free rent?
16.3%
14.3%12.7% 12.4%
10.5% 9.9% 9.7%8.5%
7.3%
(1.5%)(4%)(2%)
0%
2%
4%
6%
8%
10%
12%
14%
16%
18%
BWLD DFRG EAT CAKE TXRH BBRG RRGB BLMN DRI RT
Estimated LTM EBITDA margins on a fully-leased basis
(1) (2) * ***
Median: 10.5%
Despite high AUV and ~4.5x the scale of peers on average, Darden’s
operating performance is significantly worse than peers
$3.0 $7.3 $3.2 $10.4 $4.2 $4.1 $2.8 $3.2 $4.3AUV:
($ in millions)
$1.7
$1,391 $286 $2,905 $1,923 $1,503 $410 $1,069 $4,287 $6,286 $1,169LTM Revenue:
$3.2
$1,391
Median

8/11/2019 Starboard Value Transforming Darden
http://slidepdf.com/reader/full/starboard-value-transforming-darden 230/294
230
VIII. Spin-off of Specialty Restaurant Group
Spin-off of Specialty Restaurant Group
SRG has a number of exciting and fast-growing concepts that we believe would be attractive in the
public markets, but that are difficult for investors to fully appreciate and value inside of Darden.
Core Darden SRG
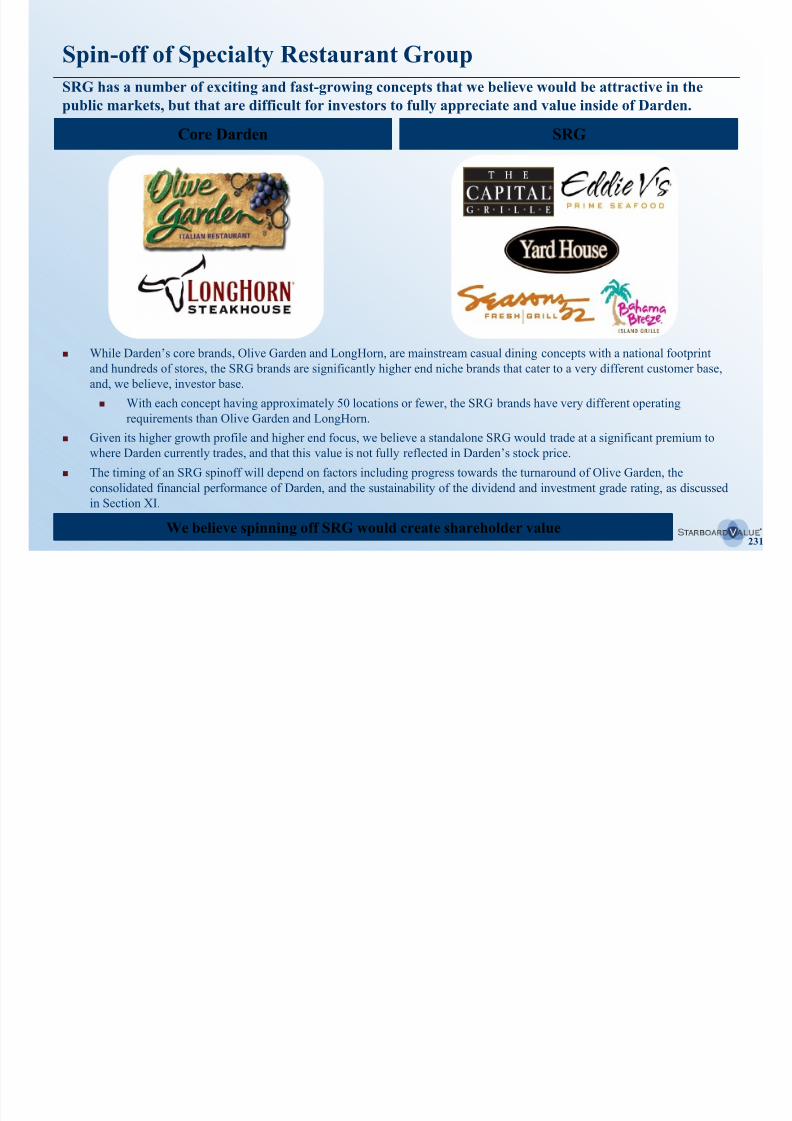
8/11/2019 Starboard Value Transforming Darden
http://slidepdf.com/reader/full/starboard-value-transforming-darden 231/294
231
While Darden’s core brands, Olive Garden and LongHorn, are mainstream casual dining concepts with a national footprint
and hundreds of stores, the SRG brands are significantly higher end niche brands that cater to a very different customer base,
and, we believe, investor base.
With each concept having approximately 50 locations or fewer, the SRG brands have very different operating
requirements than Olive Garden and LongHorn. Given its higher growth profile and higher end focus, we believe a standalone SRG would trade at a significant premium to
where Darden currently trades, and that this value is not fully reflected in Darden’s stock price.
The timing of an SRG spinoff will depend on factors including progress towards the turnaround of Olive Garden, the
consolidated financial performance of Darden, and the sustainability of the dividend and investment grade rating, as discussed
in Section XI.
We believe spinning off SRG would create shareholder value
$352$400
Attractive mix of high-end growth concepts
Exciting growth potential: Fiscal 2014 SRG sales grew 25% compared to fiscal 2013.
Unit count / AUV Revenue growth profileConcept description
Fine-dining concept known for its
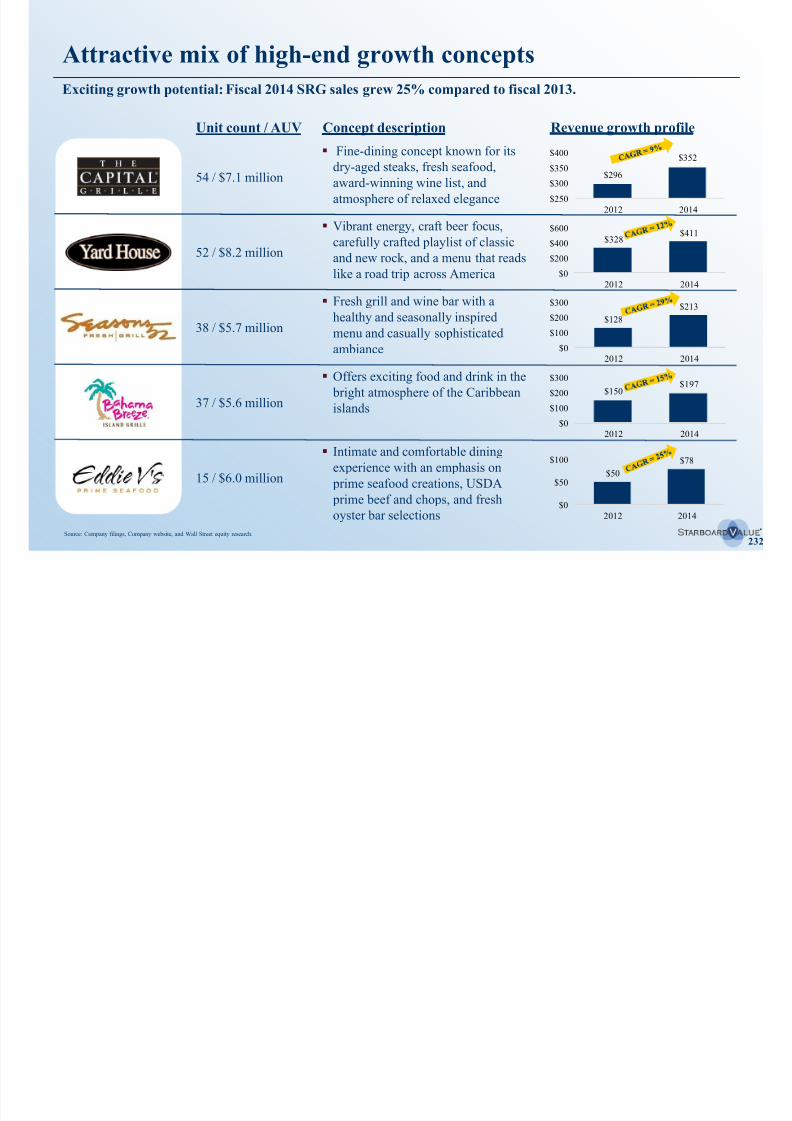
8/11/2019 Starboard Value Transforming Darden
http://slidepdf.com/reader/full/starboard-value-transforming-darden 232/294
232
$296
$352
$250
$300
$350
2012 2014
54 / $7.1 million
52 / $8.2 million
38 / $5.7 million
37 / $5.6 million
15 / $6.0 million
Offers exciting food and drink in the
bright atmosphere of the Caribbean
islands
Fresh grill and wine bar with a
healthy and seasonally inspired
menu and casually sophisticated
ambiance
Vibrant energy, craft beer focus,
carefully crafted playlist of classic
and new rock, and a menu that reads
like a road trip across America
dry-aged steaks, fresh seafood,award-winning wine list, and
atmosphere of relaxed elegance
Intimate and comfortable dining
experience with an emphasis on
prime seafood creations, USDA
prime beef and chops, and fresh
oyster bar selections
$328$411
$0
$200
$400
$600
2012 2014
$128
$213
$0
$100
$200
$300
2012 2014
$150$197
$0
$100
$200
$300
2012 2014
$50
$78
$0
$50
$100
2012 2014
Source: Company filings, Company website, and Wall Street equity research.
Attractive financial characteristics
SRG’s concepts and growth potential compare favorably to other specialty chains, with a high-end mix and projected(1)
While Darden does not break out the financials of SRG, based on an analysis of comparable chains, we believe
that on a standalone basis SRG would have approximately $1.2 billion - $1.3 billion in sales at an 11.0% -
12.0% EBITDA margin, and would trade at a 12x - 13x EBITDA multiple.
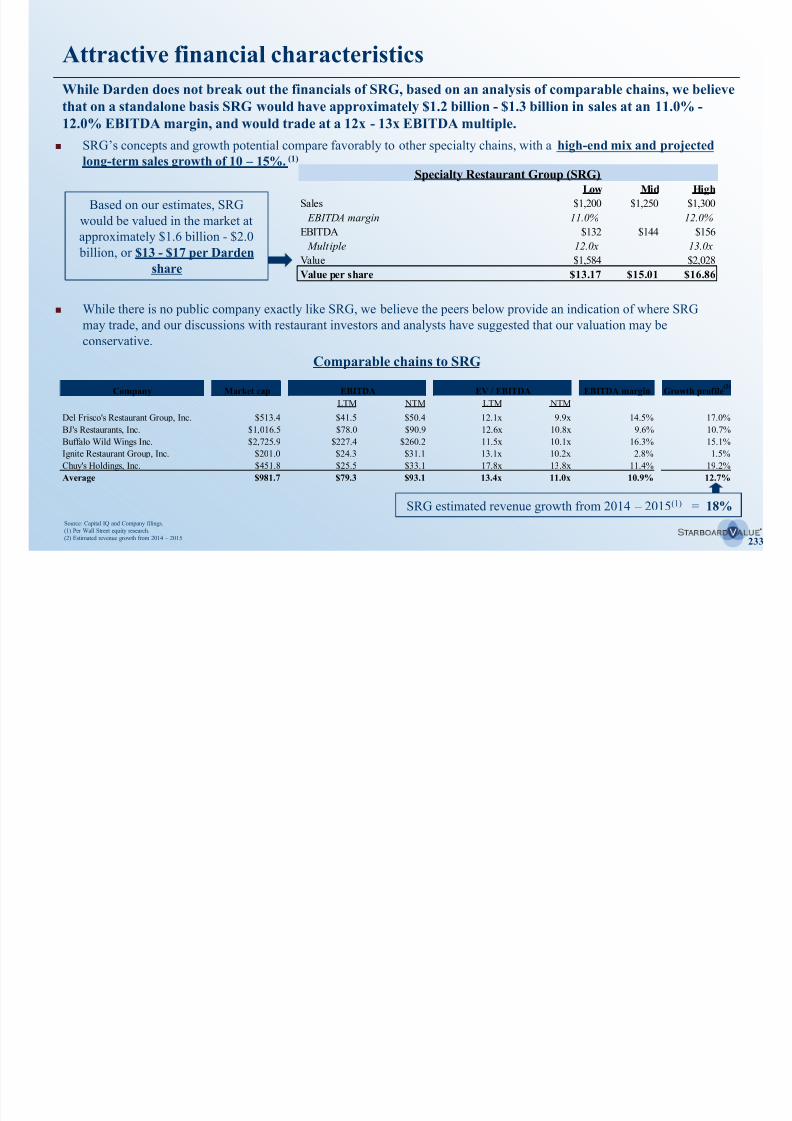
8/11/2019 Starboard Value Transforming Darden
http://slidepdf.com/reader/full/starboard-value-transforming-darden 233/294
233
long-term sales growth of 10 – 15%. (1)
Based on our estimates, SRG
would be valued in the market at
approximately $1.6 billion - $2.0
billion, or $13 - $17 per Darden
share
Source: Capital IQ and Company filings.
(1) Per Wall Street equity research.
(2) Estimated revenue growth from 2014 – 2015.
Comparable chains to SRG
While there is no public company exactly like SRG, we believe the peers below provide an indication of where SRG
may trade, and our discussions with restaurant investors and analysts have suggested that our valuation may be
conservative.
Specialty Restaurant Group (SRG)Low Mid High
Sales $1,200 $1,250 $1,300
EBITDA margin 11.0% 12.0%
EBITDA $132 $144 $156
Multiple 12.0x 13.0x
Value $1,584 $2,028
Value per share $13.17 $15.01 $16.86
Company Market cap EBITDA EV / EBITDA EBITDA margin Growth profile
LTM NTM LTM NTM
Del Frisco's Restaurant Group, Inc. $513.4 $41.5 $50.4 12.1x 9.9x 14.5% 17.0%
BJ's Restaurants, Inc. $1,016.5 $78.0 $90.9 12.6x 10.8x 9.6% 10.7%
Buffalo Wild Wings Inc. $2,725.9 $227.4 $260.2 11.5x 10.1x 16.3% 15.1%
Ignite Restaurant Group, Inc. $201.0 $24.3 $31.1 13.1x 10.2x 2.8% 1.5%
Chuy's Holdings, Inc. $451.8 $25.5 $33.1 17.8x 13.8x 11.4% 19.2%
Average $981.7 $79.3 $93.1 13.4x 11.0x 10.9% 12.7%
(2)
SRG estimated revenue growth from 2014 – 2015(1) = 18%
Market demographics confirm the disconnect between SRGand Darden’s core brands
Olive Garden, and
LongHorn are
located in very
SRG’s demographic
is clearly
differentiated from
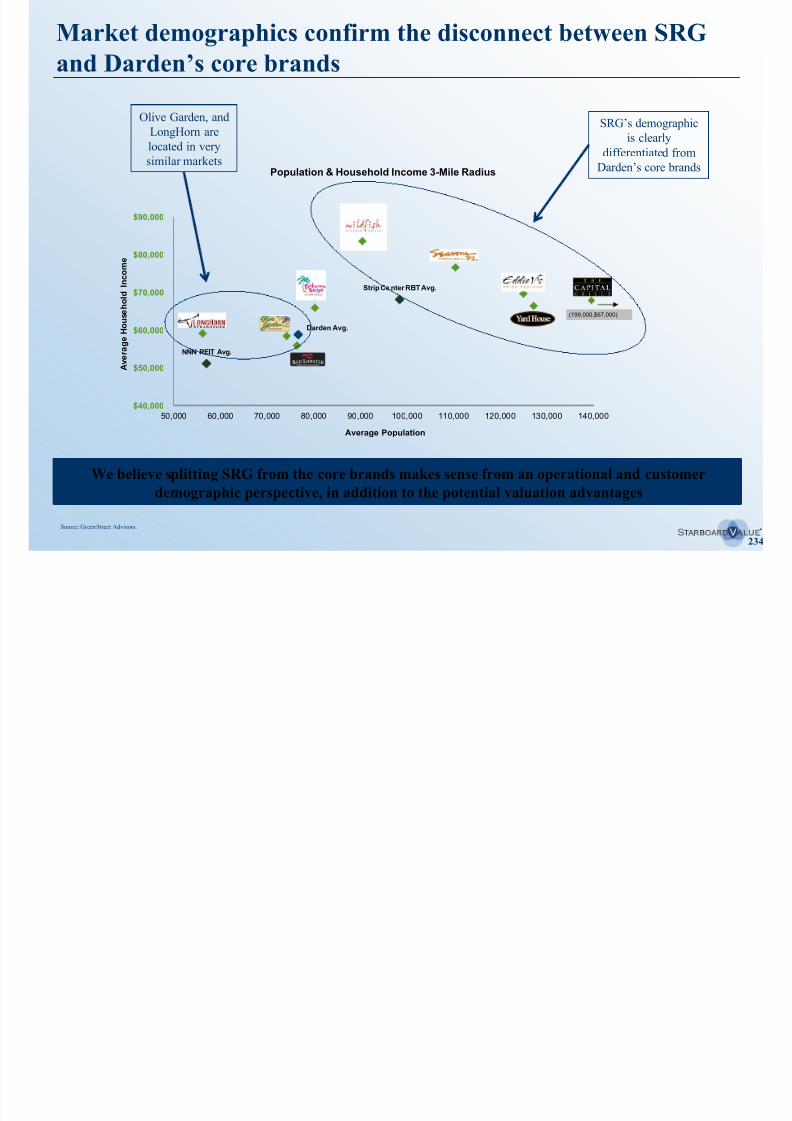
8/11/2019 Starboard Value Transforming Darden
http://slidepdf.com/reader/full/starboard-value-transforming-darden 234/294
234
Darden Avg.
NNN REIT Avg.
Strip Ce nter REIT Avg.
$40,000
$50,000
$60,000
$70,000
$80,000
$90,000
50,000 60,000 70,000 80,000 90,000 100,000 110,000 120,000 130,000 140,000
A v e r a g e H o u s e h o l d
I n c o m e
Average Population
Population & Household Income 3-Mile Radius
(199,000,$67,000)
similar markets Darden’s core brands
Source: Green Street Advisors.
We believe splitting SRG from the core brands makes sense from an operational and customer
demographic perspective, in addition to the potential valuation advantages
Spinning off SRG can likely be completed in 6 months, however,we would likely take a more conservative approach
1. Feasibility Study 2. Approval Process 3. Spin-off Preparation
Form standalone SRG
− Certificate of Incorporation
and Bylaws
Darden Board to review and
discuss spin-off
Establish teams at Darden and
SRG to manage principal spin-
Finalize SRG employee
benefit plans
4. Implementation
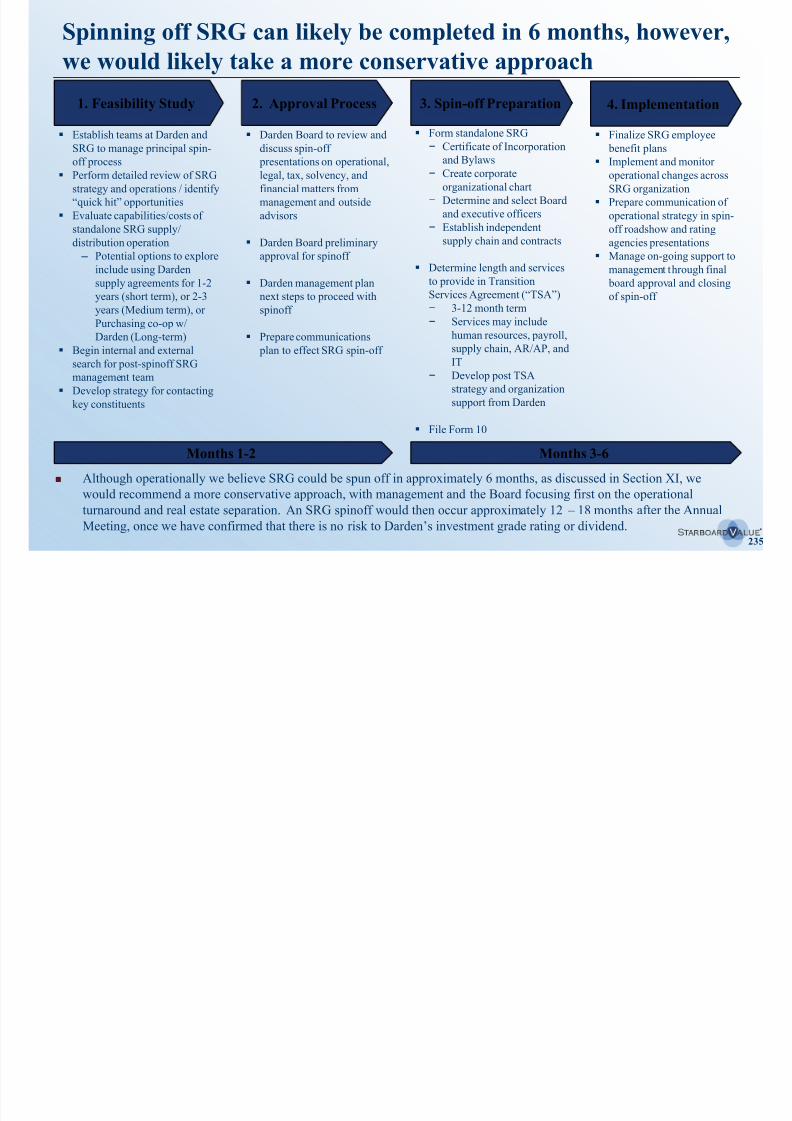
8/11/2019 Starboard Value Transforming Darden
http://slidepdf.com/reader/full/starboard-value-transforming-darden 235/294
235
Months 1-2 Months 3-6
and Bylaws
− Create corporate
organizational chart
− Determine and select Board
and executive officers
− Establish independent
supply chain and contracts
Determine length and services
to provide in Transition
Services Agreement (“TSA”) − 3-12 month term
− Services may include
human resources, payroll,
supply chain, AR/AP, and
IT
− Develop post TSA
strategy and organization
support from Darden
File Form 10
presentations on operational,legal, tax, solvency, and
financial matters from
management and outside
advisors
Darden Board preliminary
approval for spinoff
Darden management plan
next steps to proceed withspinoff
Prepare communications
plan to effect SRG spin-off
off process Perform detailed review of SRG
strategy and operations / identify
“quick hit” opportunities
Evaluate capabilities/costs of
standalone SRG supply/
distribution operation
‒ Potential options to explore
include using Darden
supply agreements for 1-2
years (short term), or 2-3years (Medium term), or
Purchasing co-op w/
Darden (Long-term)
Begin internal and external
search for post-spinoff SRG
management team
Develop strategy for contacting
key constituents
Implement and monitoroperational changes across
SRG organization
Prepare communication of
operational strategy in spin-
off roadshow and rating
agencies presentations
Manage on-going support to
management through final
board approval and closing
of spin-off
Although operationally we believe SRG could be spun off in approximately 6 months, as discussed in Section XI, we
would recommend a more conservative approach, with management and the Board focusing first on the operational
turnaround and real estate separation. An SRG spinoff would then occur approximately 12 – 18 months after the Annual
Meeting, once we have confirmed that there is no risk to Darden’s investment grade rating or dividend.
Mitigating factors to reduce risks in the spin-off
Risk
1. Incremental layer of executive
Mitigating Factors
• Existing strong and fully dedicated SRG leadership team across different functions –
HR, Marketing, Culinary, Development, Finance & Field Operations
• SRG currently has more than what it would need on a stand alone basis, and this does
not include Darden’s corporate employees that work on/monitor SRG
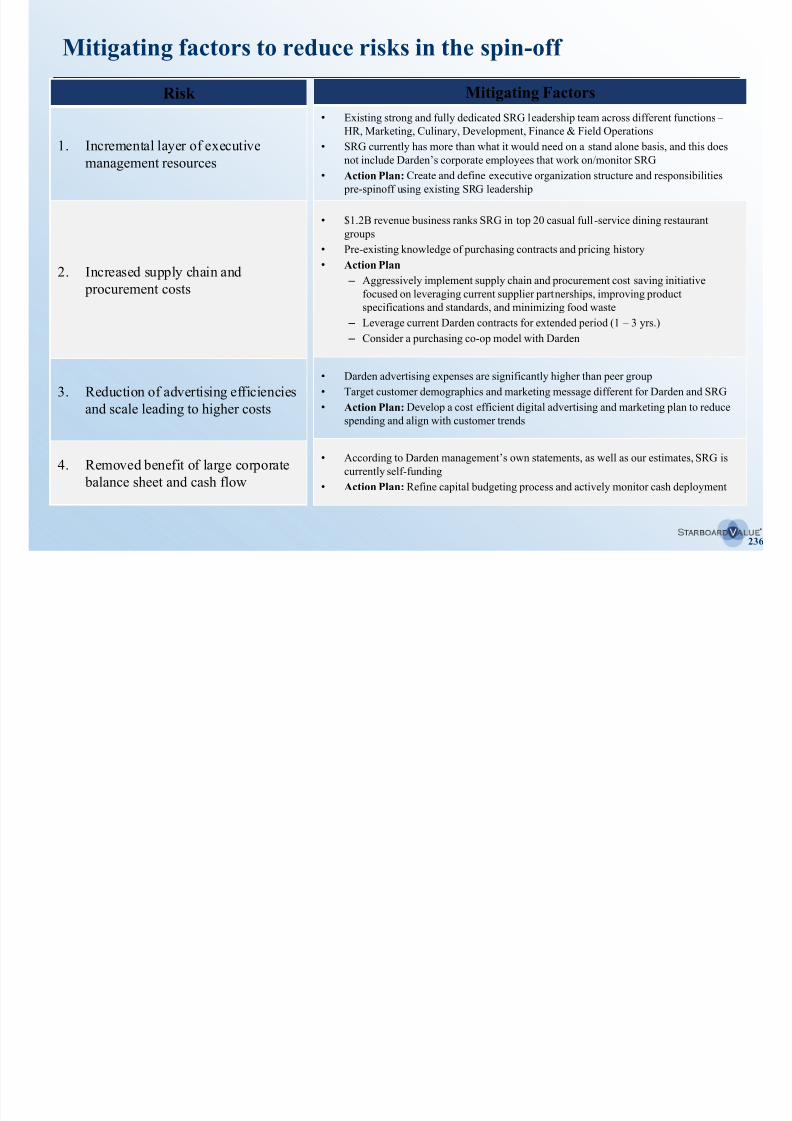
8/11/2019 Starboard Value Transforming Darden
http://slidepdf.com/reader/full/starboard-value-transforming-darden 236/294
236
management resources
2. Increased supply chain and
procurement costs
3. Reduction of advertising efficiencies
and scale leading to higher costs
4. Removed benefit of large corporate
balance sheet and cash flow
not include Darden s corporate employees that work on/monitor SRG
• Action Plan: Create and define executive organization structure and responsibilities
pre-spinoff using existing SRG leadership
• $1.2B revenue business ranks SRG in top 20 casual full-service dining restaurant
groups
• Pre-existing knowledge of purchasing contracts and pricing history
• Action Plan
‒ Aggressively implement supply chain and procurement cost saving initiative
focused on leveraging current supplier partnerships, improving productspecifications and standards, and minimizing food waste
‒ Leverage current Darden contracts for extended period (1 – 3 yrs.)
‒ Consider a purchasing co-op model with Darden
• Darden advertising expenses are significantly higher than peer group
• Target customer demographics and marketing message different for Darden and SRG
• Action Plan: Develop a cost efficient digital advertising and marketing plan to reduce
spending and align with customer trends
• According to Darden management’s own statements, as well as our estimates, SRG is
currently self-funding
• Action Plan: Refine capital budgeting process and actively monitor cash deployment

8/11/2019 Starboard Value Transforming Darden
http://slidepdf.com/reader/full/starboard-value-transforming-darden 237/294
237
IX. Franchising
Franchising represents a substantial opportunity
Darden’s concepts are well-suited for a franchising program.
– Industry experts have suggested to us that Olive Garden and LongHorn would be very attractive candidates for
Darden’s current store base is approximately 100% company-owned and operated, but substantial
value could be created through both domestic and international franchising.
8/11/2019 Starboard Value Transforming Darden
http://slidepdf.com/reader/full/starboard-value-transforming-darden 238/294
238
potential franchisees, and large, successful franchise operators have expressed serious interest i n becomingfranchisees.
– Unfortunately, Darden’s management has simply refused to believe that franchisees are capable operators, despite
substantial evidence to the contrary – in fact, given Darden’s underperformance compared to highly- or partially-
franchised peers, it is clear that Darden does not operate their restaurants as efficiently as a franchisee could.
Peers have consistently found that franchised restaurants generate higher restaurant-level margins and same-store-
sales than company-operated stores.
– Franchisees bring an ownership mentality to the restaurants.
– Darden has several markets that are underperforming, and could potentially be better-managed by franchisees with
extensive operating experience and superior store density in those markets.
– The best ideas for menu innovation and operational improvements often come from franchisees.
The opportunity for international growth without capital investment is substantial.
– In many international markets, experienced franchise operators or joint venture partners are in a better position to
operate a restaurant successfully, given local tastes, regulations, economic conditions, etc.
Domestically, LongHorn and SRG have significant growth potential, and could realize this growth faster and with higher
returns on capital through franchising.
Several casual dining competitors, including DineEquity, Brinker, and Denny’s, have refranchised a large portion of their
store base, driving significant improvements in their returns on capital and stock price performance.
Franchising can improve growth, operating performance, returns on capital, and valuation

8/11/2019 Starboard Value Transforming Darden
http://slidepdf.com/reader/full/starboard-value-transforming-darden 239/294
239
IX. Franchising
A. International
Darden trails its peers internationally
International expansion has been an area of profitable growth for almost every major casual dining
company but Darden.
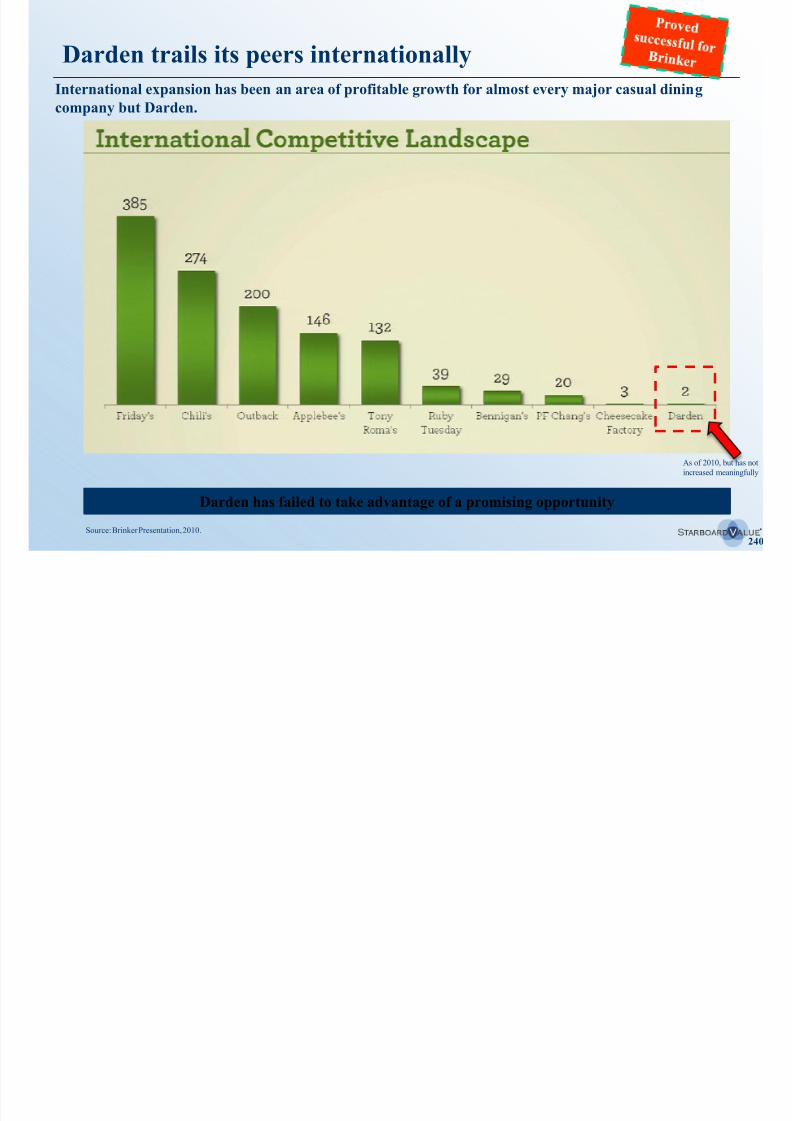
8/11/2019 Starboard Value Transforming Darden
http://slidepdf.com/reader/full/starboard-value-transforming-darden 240/294
240
Darden has failed to take advantage of a promising opportunity
Source: Brinker Presentation, 2010.
As of 2010, but has not
increased meaningfully
International expansion overview
TGI Friday’s, Brinker, Bloomin’, and DineEquity have all successfully expanded internationally, driven primarily by
franchising.
Darden’s brands have significant international expansion potential.
8/11/2019 Starboard Value Transforming Darden
http://slidepdf.com/reader/full/starboard-value-transforming-darden 241/294
241
– International markets are not close to saturated, with even Friday’s, already the largest international player, seeingroom to build more than 200 additional units overseas.
There is strong demand for American casual dining brands in South America, Asia, the Middle East, and parts of Europe at
compelling store-level economic performance.
– Although Darden has signed some token agreements with international franchisees, no significant store development
has occurred, indicating a lack of focus and poor execution by Darden management.
– Olive Garden’s pasta focus helps to minimize a number of challenges that more protein-centric concepts have hadadapting their model and serving consistent food in certain regions
We believe that Darden’s brands could ultimately support more than 300 units internationally, including approximately 140
Olive Gardens, 90 LongHorn’s, and 75 from SRG’s brands.
– This would translate into total franchise fees of approximately $50 million (a one-time capital infusion into Darden)
and ongoing annual royalty income of more than $60 million.
– Although such a rollout would be staged gradually over 5-7 years, it will provide an ongoing source of revenue
growth, margin expansion, and increasing returns on capital over the long term.
International franchising is an opportunity for long-term, highly profitable growth with negative
capital investment
647 672 679
600
700
800
Outback ($ in millions)
Intl. Revenue
No. Stores
571
451
565
500
600
Chili’s ($ in millions)
Intl. Revenue
No. Stores
Darden’s peers have viewed international expansion as asource for profitable growth
(1)
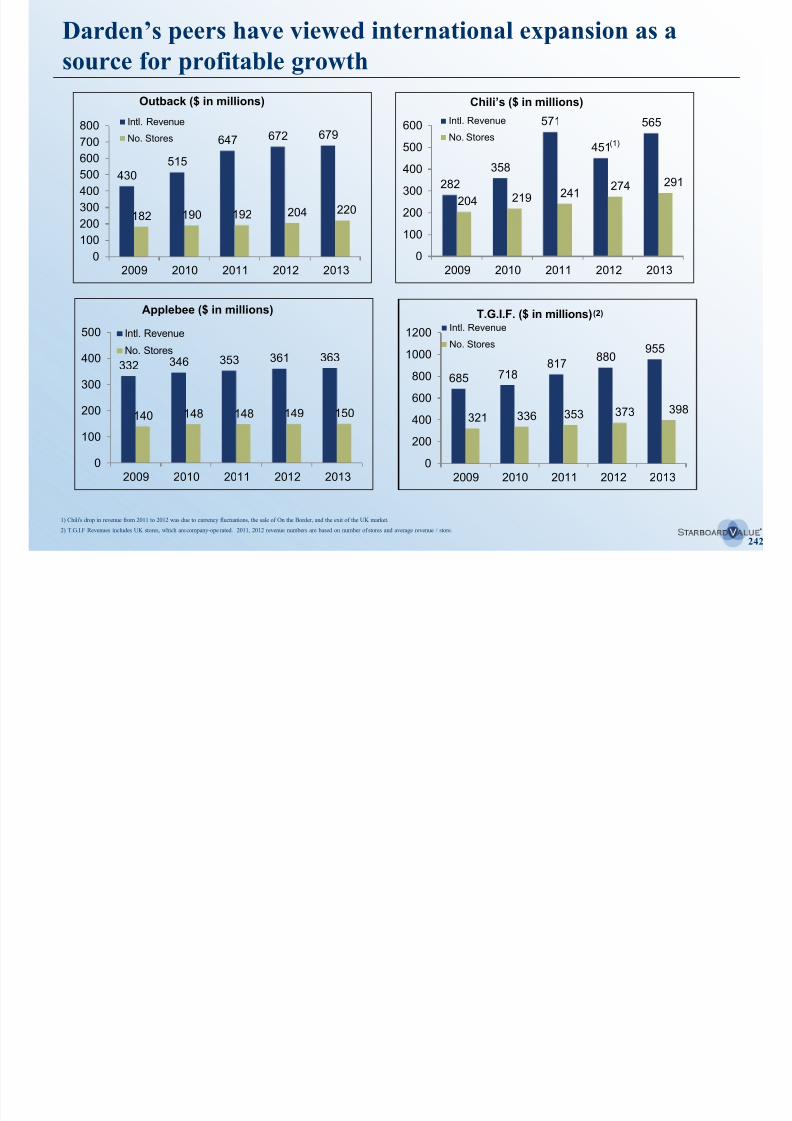
8/11/2019 Starboard Value Transforming Darden
http://slidepdf.com/reader/full/starboard-value-transforming-darden 242/294
242
430 515
182 190 192 204 220
0
100
200
300
400
500
2009 2010 2011 2012 2013
332 346 353 361 363
140 148 148 149 150
0
100
200
300
400
500
2009 2010 2011 2012 2013
Applebee ($ in millions)
Intl. Revenue
No. Stores
282358
204 219 241 274 291
0
100
200
300
400
2009 2010 2011 2012 2013
685 718817
880 955
321 336 353 373 398
0
200400
600
800
1000
1200
2009 2010 2011 2012 2013
T.G.I.F. ($ in millions)Intl. Revenue
No. Stores
1) Chili's drop in revenue from 2011 to 2012 was due to currency fluctuations, the sale of On the Border, and the exit of the UK market.
2) T.G.I.F Revenues includes UK stores, which are company-ope rated. 2011, 2012 revenue numbers are based on number of stores and average revenue / store.
(2)
Darden is far behind its competitors in international markets
2013 international landscape (number of stores)
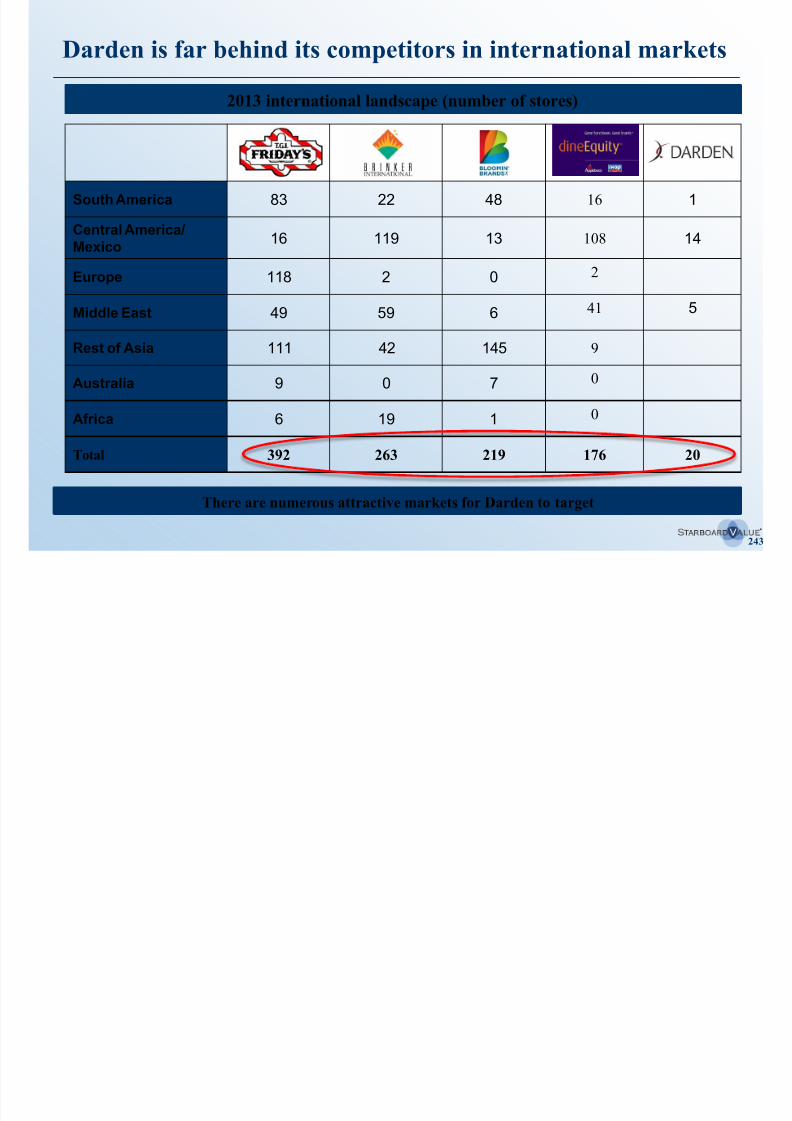
8/11/2019 Starboard Value Transforming Darden
http://slidepdf.com/reader/full/starboard-value-transforming-darden 243/294
243
South America 83 22 48 16 1
Central America/
Mexico16 119 13 108 14
Europe 118 2 0 2
Middle East 49 59 6 41 5
Rest of Asia 111 42 145 9
Australia 9 0 7 0
Africa 6 19 10
Total 392 263 219 176 20
There are numerous attractive markets for Darden to target
Target markets
Peers have already identified the markets that are best-suited for American casual dining brands, and
Darden can draw lessons from their experience.
Key markets with desirable customer demographics for Olive Garden and LongHorn include:
– Middle East
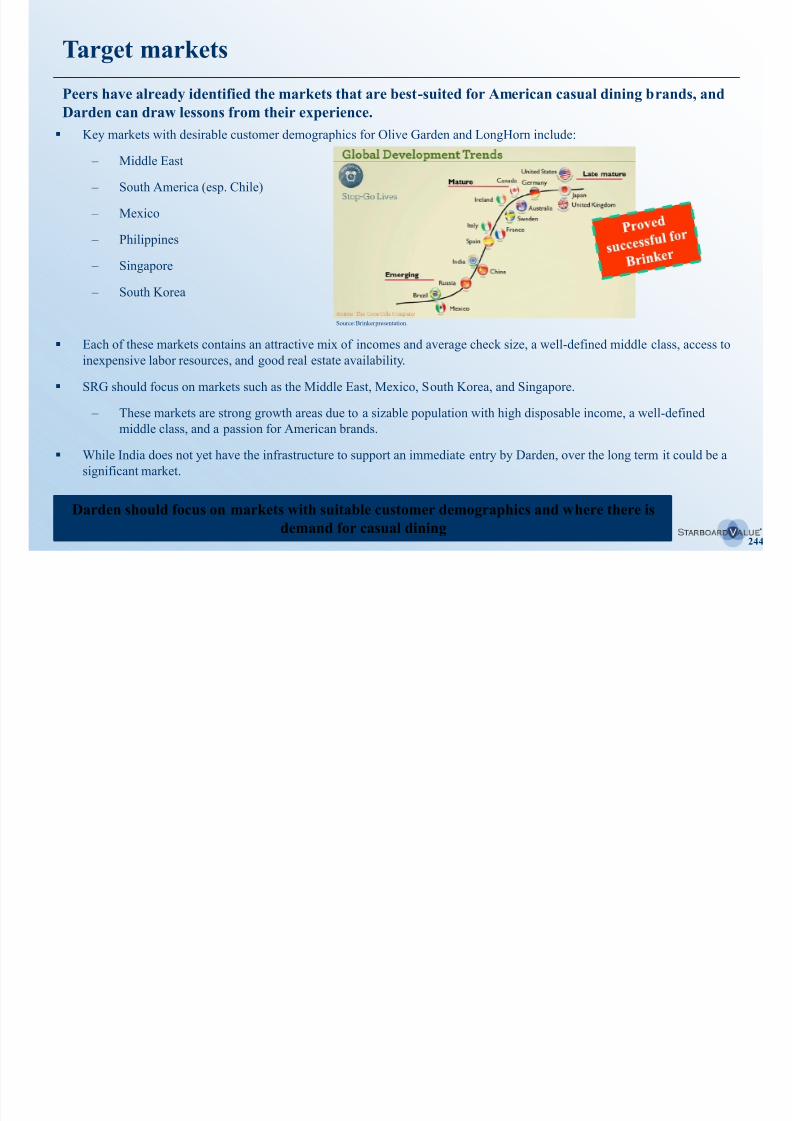
8/11/2019 Starboard Value Transforming Darden
http://slidepdf.com/reader/full/starboard-value-transforming-darden 244/294
244
Darden should focus on markets with suitable customer demographics and where there is
demand for casual dining
– South America (esp. Chile)
– Mexico
– Philippines
– Singapore
– South Korea
Each of these markets contains an attractive mix of incomes and average check size, a well-defined middle class, access to
inexpensive labor resources, and good real estate availability.
SRG should focus on markets such as the Middle East, Mexico, South Korea, and Singapore.
– These markets are strong growth areas due to a sizable population with high disposable income, a well-defined
middle class, and a passion for American brands.
While India does not yet have the infrastructure to support an immediate entry by Darden, over the long term it could be a
significant market.
Source: Brinker presentation.
Target markets (cont’d)
A market-by-market analysis for each brand reveals an incredible opportunity for Darden.
Illustrative Growth Potential in Key Regions
Specialty Restaurant Group
Olive Capital
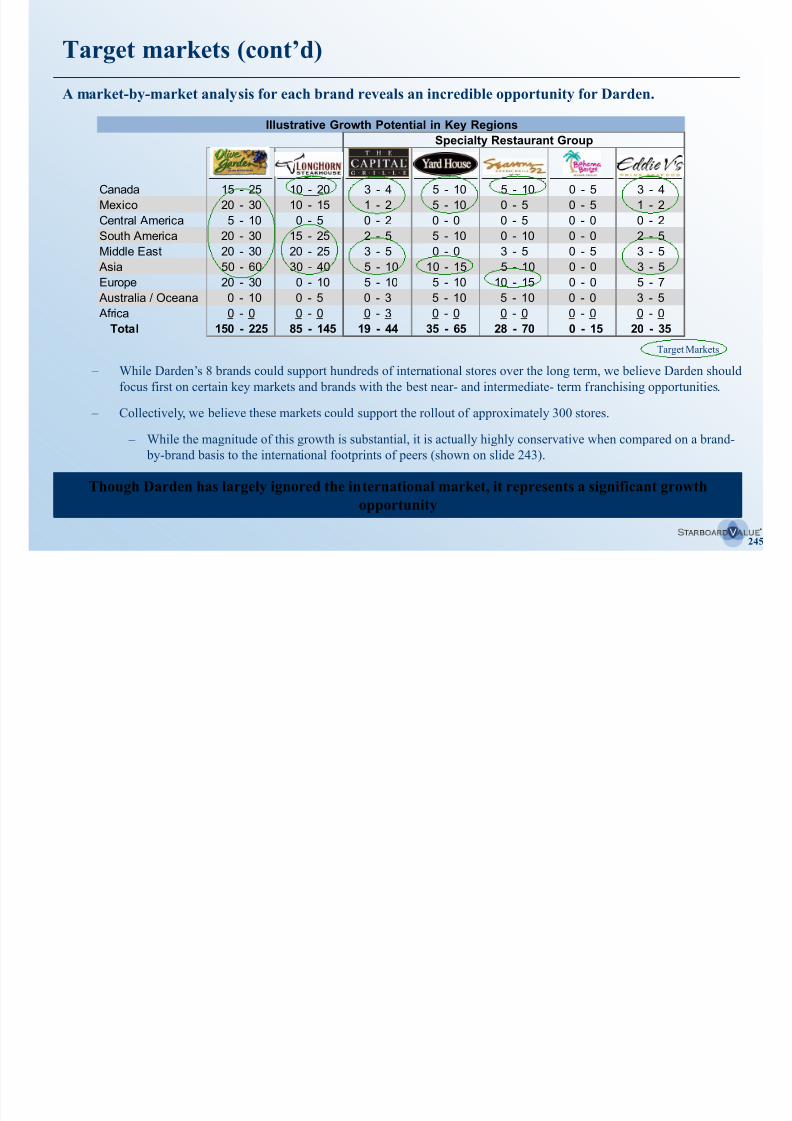
8/11/2019 Starboard Value Transforming Darden
http://slidepdf.com/reader/full/starboard-value-transforming-darden 245/294
245
Though Darden has largely ignored the international market, it represents a significant growth
opportunity
– While Darden’s 8 brands could support hundreds of international stores over the long term, we believe Darden should
focus first on certain key markets and brands with the best near- and intermediate- term franchising opportunities.
– Collectively, we believe these markets could support the rollout of approximately 300 stores.
– While the magnitude of this growth is substantial, it is actually highly conservative when compared on a brand-
by-brand basis to the international footprints of peers (shown on slide 243).
Garden LongHorn Grille House 52 Eddie V's
Canada 15 - 25 10 - 20 3 - 4 5 - 10 5 - 10 0 - 5 3 - 4
Mexico 20 - 30 10 - 15 1 - 2 5 - 10 0 - 5 0 - 5 1 - 2
Central America 5 - 10 0 - 5 0 - 2 0 - 0 0 - 5 0 - 0 0 - 2
South America 20 - 30 15 - 25 2 - 5 5 - 10 0 - 10 0 - 0 2 - 5
Middle East 20 - 30 20 - 25 3 - 5 0 - 0 3 - 5 0 - 5 3 - 5
Asia 50 - 60 30 - 40 5 - 10 10 - 15 5 - 10 0 - 0 3 - 5
Europe 20 - 30 0 - 10 5 - 10 5 - 10 10 - 15 0 - 0 5 - 7
Australia / Oceana 0 - 10 0 - 5 0 - 3 5 - 10 5 - 10 0 - 0 3 - 5 Africa 0 - 0 0 - 0 0 - 3 0 - 0 0 - 0 0 - 0 0 - 0
Total 150 - 225 85 - 145 19 - 44 35 - 65 28 - 70 0 - 15 20 - 35
Target Markets
International franchising can create substantial value
Even restricting a rollout to the target markets discussed on the prior slide, Darden could create
substantial value through international franchising while taking in, rather than spending, capital.
Illustrative Financial Impact of International Expansion
($ in millions, except where noted) Specialty Restaurant Group
G d L H G ill H 52 Eddi V' T t l
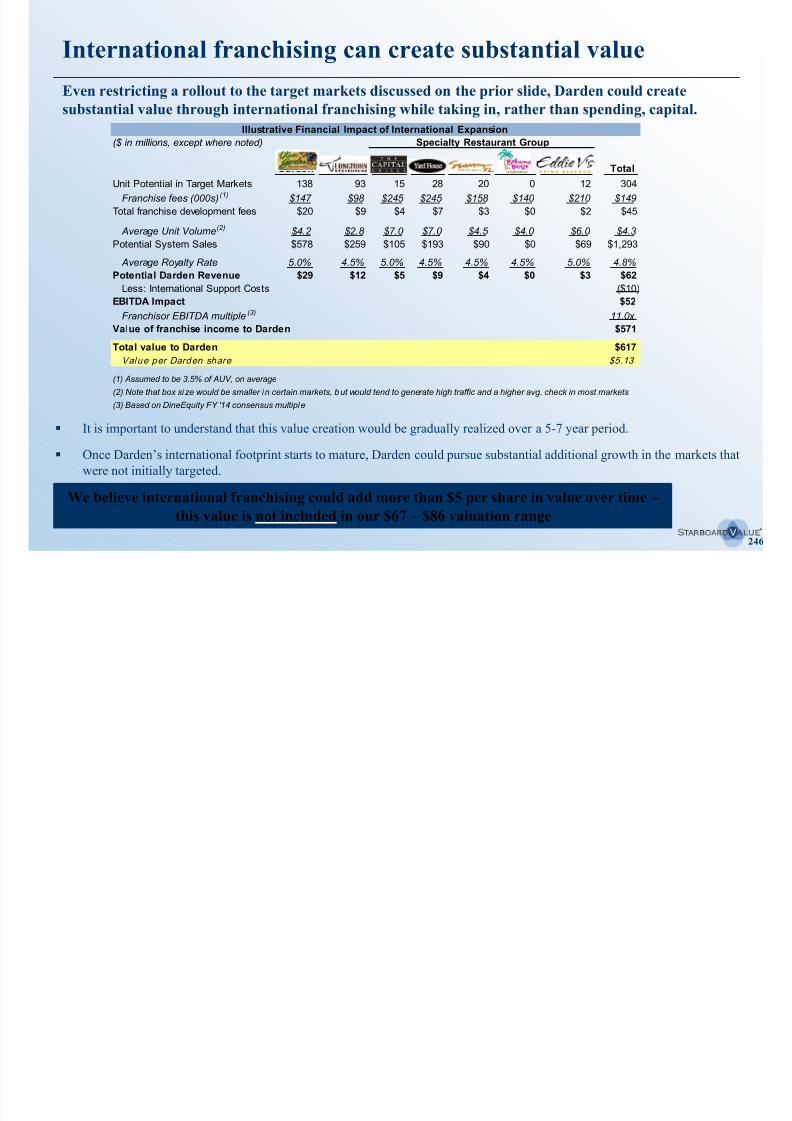
8/11/2019 Starboard Value Transforming Darden
http://slidepdf.com/reader/full/starboard-value-transforming-darden 246/294
246
It is important to understand that this value creation would be gradually realized over a 5-7 year period.
Once Darden’s international footprint starts to mature, Darden could pursue substantial additional growth in the markets that
were not initially targeted.
We believe international franchising could add more than $5 per share in value over time – this value is not included in our $67 – $86 valuation range
Garden LongHorn Grille House 52 Eddie V's TotalUnit Potential in Target Markets 138 93 15 28 20 0 12 304
Franchise fees (000s) (1) $147 $98 $245 $245 $158 $140 $210 $149
Total franchise development fees $20 $9 $4 $7 $3 $0 $2 $45
Average Unit Volume (2) $4.2 $2.8 $7.0 $7.0 $4.5 $4.0 $6.0 $4.3
Potential System Sales $578 $259 $105 $193 $90 $0 $69 $1,293
Average Royalty Rate 5.0% 4.5% 5.0% 4.5% 4.5% 4.5% 5.0% 4.8%
Potential Darden Revenue $29 $12 $5 $9 $4 $0 $3 $62
Less: International Support Costs ($10)
EBITDA Impact $52
Franchisor EBITDA multiple (3) 11.0x
Value of franchise income to Darden $571
Total value to Darden $617
Value per Darden share $5.13
(1) Assumed to be 3.5% of AUV, on average
(2) Note that box si ze would be smaller i n certain markets, but would tend to generate high traffic and a higher avg. check in most markets
(3) Based on DineEquity FY '14 consensus multiple
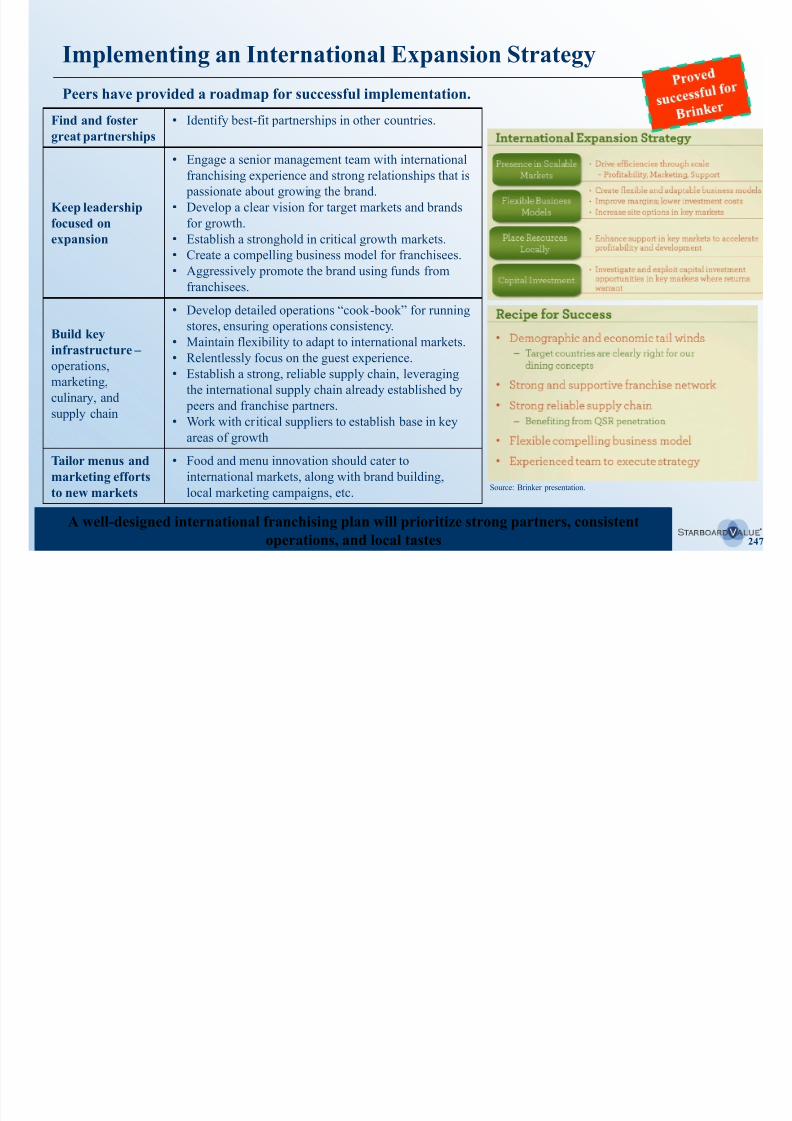
8/11/2019 Starboard Value Transforming Darden
http://slidepdf.com/reader/full/starboard-value-transforming-darden 247/294

8/11/2019 Starboard Value Transforming Darden
http://slidepdf.com/reader/full/starboard-value-transforming-darden 248/294
248
IX. Franchising
B. Domestic
Franchising can solve operational challenges while providingfinancial benefits
Lack of store density
Whil t t l l i i t t d t i ti f l l k t d it b j t i t t
A common and successful tactic is to franchise select markets where a corporation is not performing
well due to lack of local store density or local market expertise.
8/11/2019 Starboard Value Transforming Darden
http://slidepdf.com/reader/full/starboard-value-transforming-darden 249/294
249
– While total scale is an important advantage in operating performance, local market density can be just as important – operating a modest number of stores within a well-defined geographic cluster can be more efficient than operating a
large number of stores spread out over disparate geographies.
– Although Darden is the largest casual dining operator in the world, it still has numerous markets in which it lacks
sufficient local market density to maximize performance.
– Rather than committing capital to expand in these markets or exiting them, Darden can sell them to a franchisee
who already operates a critical mass of restaurants across a number of brands in those markets.
– As part of any agreement, the franchisee would commit to developing new restaurants in the market, providing
additional capital to Darden in the form of franchise fees and a continuing source of revenue and profit growth.
– As discussed on slides 254-255, we have identified a preliminary list of 6 markets for Olive Garden and 12 for LongHorn
that may be strong candidates for franchising.
Franchising select markets will create a more efficient operating model
Unique markets
– While many casual dining chains excel at operating in standardized environments like suburban strip centers in
the middle of the country, there are several markets that present unique challenges, yet can be highly profitable for
Certain markets present unique challenges for corporate operators.
Franchising can solve operational challenges while providingfinancial benefits (cont’d)
8/11/2019 Starboard Value Transforming Darden
http://slidepdf.com/reader/full/starboard-value-transforming-darden 250/294
250
local market experts.
– For example, in the New York City market, box size/configuration, rents, labor costs, day parts, operating
hours, pricing, and consumer tastes all differ significantly from Darden’s standardized model.
– Despite these challenges, certain franchisees have been very successful operating casual dining
restaurants across a number of brands in the New York City market.
– Similarly, in California labor laws and other differences can present challenges for corporate operators.
– In certain of these markets, franchisees can get better access to local real estate.
– We believe there are a number of markets in which Darden makes little-to-no net profit, but that a franchisee with
local market expertise could operate profitably.
– By franchising these markets, without giving up any meaningful current income Darden can get (i) an initial
infusion of capital, (ii) an ongoing royalty stream, and (iii) better-performing stores that serve to enhance, rather
than tarnish, the brand image.
Franchising problem markets is a win-win-win for Darden, the franchisee, and the customer
Franchisees add significant value to the system
Casual dining peers have consistently found that franchised restaurants generate higher restaurant-level margins and same-
store-sales than company-operated stores.
Franchisees bring an ownership mentality to the restaurants
Franchising stores is a proven method to improve operating performance and accelerate innovation.
8/11/2019 Starboard Value Transforming Darden
http://slidepdf.com/reader/full/starboard-value-transforming-darden 251/294
251
– Franchisees bring an ownership mentality to the restaurants.
– This can be partially replicated through a well-designed incentive plan for General Managers, but Darden has
failed to do this.
– Franchisees can monitor operating performance and respond to guest preferences in real time, rather than waiting
months or years for operational initiatives to work their way through a corporate bureaucracy.
– Darden will receive a benefit as better-performing stores enhance the brand image.
Casual dining peers have also found that the best ideas for menu innovation and process improvements often come from
franchisees.
– As a former Director of Operations for a leading casual dining chain put it, franchising gives a corporation dozens of
R&D departments, all directly connected to the customer on a daily basis, rather than one R&D department stuck at
corporate.
Franchising will improve performance and spur innovation – again, a win for Darden, the franchisee,
and the customer
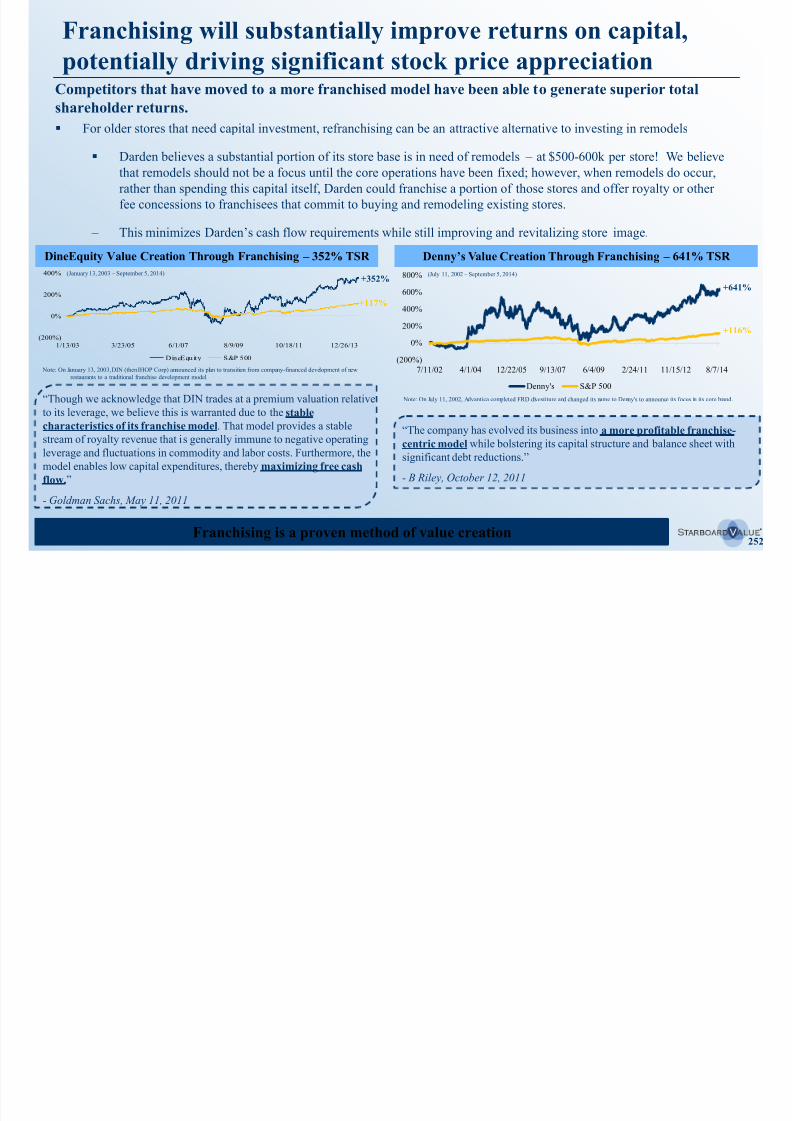
8/11/2019 Starboard Value Transforming Darden
http://slidepdf.com/reader/full/starboard-value-transforming-darden 252/294
Peers provide a roadmap for franchising select markets
The first step is to consider which markets peers have successfully franchised, indicating the presence of strong franchise
partners capable of operating casual dining brands.
Although this initial analysis was conducted by state our nominees if elected would conduct a more detailed
Based on a review of restaurant units by state and franchise mix of a select peer group, we believe there
are several markets that Olive Garden and LongHorn should consider franchising.
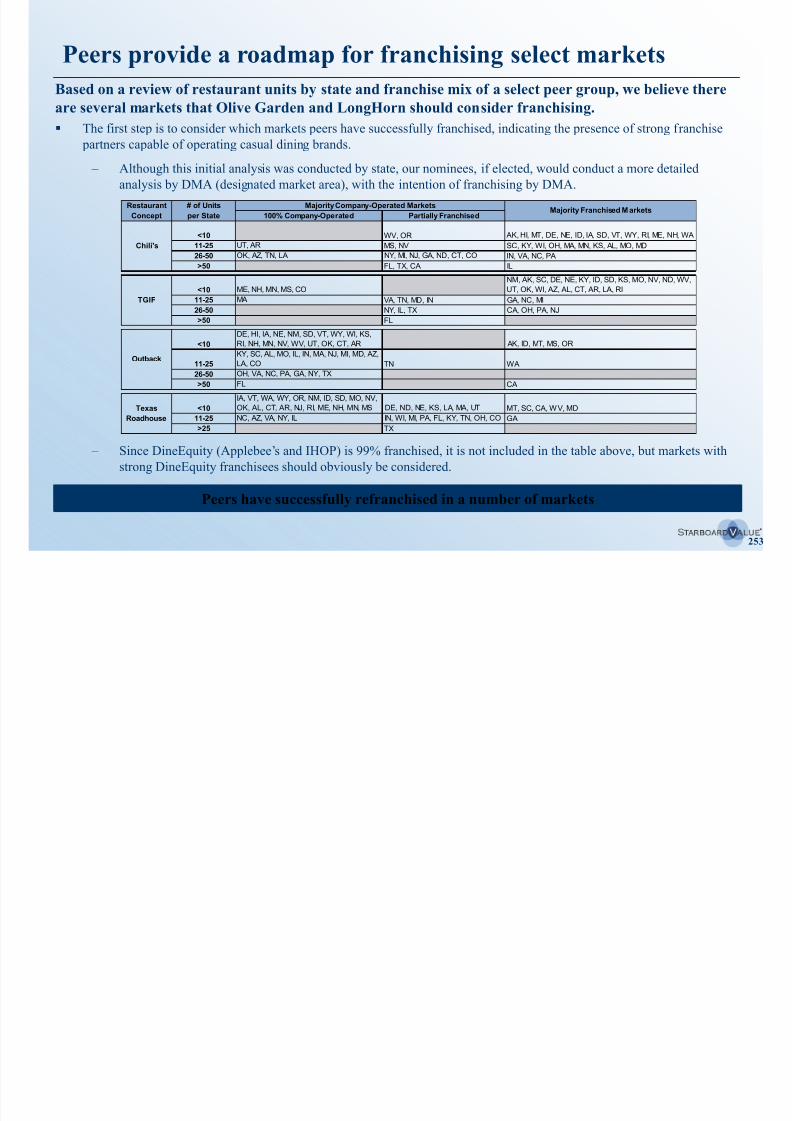
8/11/2019 Starboard Value Transforming Darden
http://slidepdf.com/reader/full/starboard-value-transforming-darden 253/294
253
– Although this initial analysis was conducted by state, our nominees, if elected, would conduct a more detailedanalysis by DMA (designated market area), with the intention of franchising by DMA.
– Since DineEquity (Applebee’s and IHOP) is 99% franchised, it is not included in the table above, but markets with
strong DineEquity franchisees should obviously be considered.
Peers have successfully refranchised in a number of markets
Majority Company-Operated Markets
100% Company-Operated Partially Franchised
<10 WV, OR AK, HI, MT, DE, NE, ID, IA, SD, VT, WY, RI, ME, NH, WA
11-25 UT, AR MS, NV SC, KY, WI, OH, MA, MN, KS, AL, MO, MD
26-50 OK, AZ, TN, LA NY, MI, NJ, GA, ND, CT, CO IN, VA, NC, PA
>50 FL, TX, CA IL
<10 ME, NH, MN, MS, CO
NM, AK, SC, DE, NE, KY, ID, SD, KS, MO, NV, ND, WV,
UT, OK, WI, AZ, AL, CT, AR, LA, RI
11-25 MA VA, TN, MD, IN GA, NC, MI26-50 NY, IL, TX CA, OH, PA, NJ
>50 FL
<10
DE, HI, IA, NE, NM, SD, VT, WY, WI, KS,
RI, NH, MN, NV, WV, UT, OK, CT, AR AK, ID, MT, MS, OR
11-25
KY, SC, AL, MO, IL, IN, MA, NJ, MI, MD, AZ,
LA, CO TN WA
26-50 OH, VA, NC, PA, GA, NY, TX
>50 FL CA
<10
IA, VT, WA, WY, OR, NM, ID, SD, MO, NV,
OK, AL, CT, AR, NJ, RI, ME, NH, MN, MS DE, ND, NE, KS, LA, MA, UT MT, SC, CA, WV, MD
11-25 NC, AZ, VA, NY, IL IN, WI, MI, PA, FL, KY, TN, OH, CO GA
>25 TX
Texas
Roadhouse
Majority Franchised M arketsRestaurant
Concept
# of Units
per State
Chili's
TGIF
Outback
Target markets – Olive Garden
Initial target markets would be ones with modest store density that have been very successful as franchised markets for peers.
– States with a minimum of 15 restaurants would attract well-capitalized franchisees that already operate a critical mass
of restaurants.
AL OH PA NC SC and MO would be among the first markets to consider
Olive Garden is well-represented in the US, with only a few under-penetrated markets.
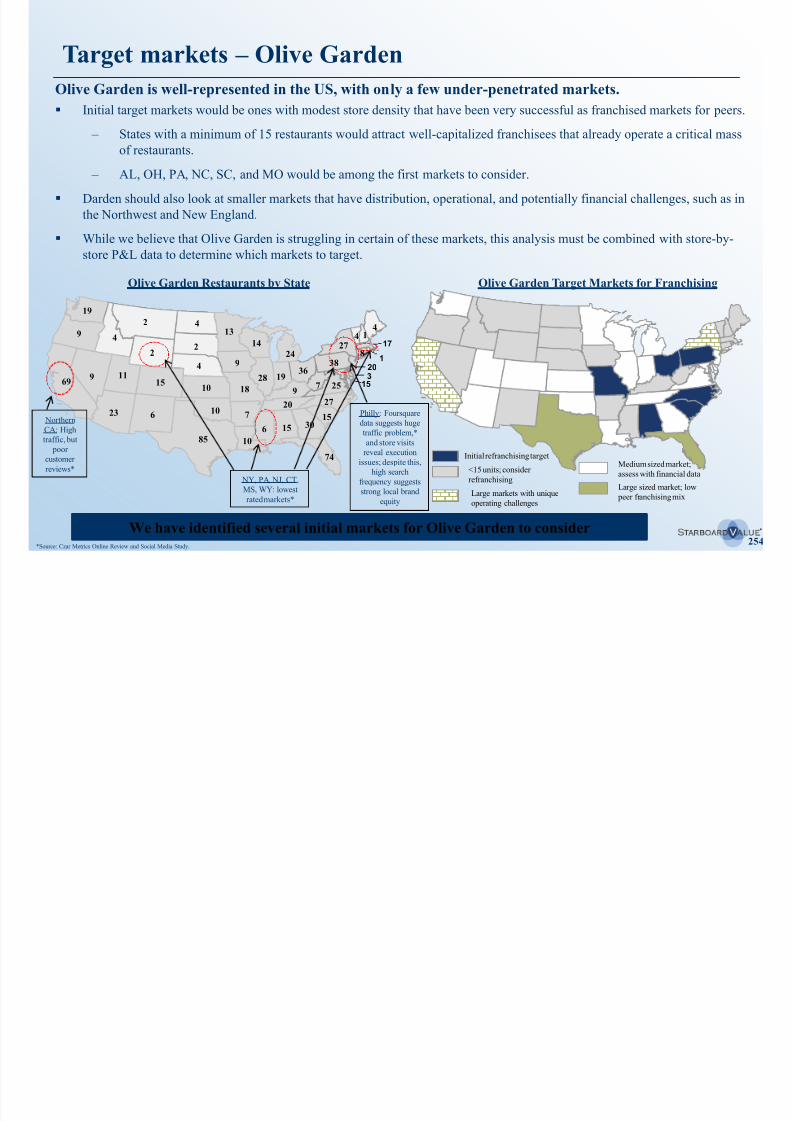
8/11/2019 Starboard Value Transforming Darden
http://slidepdf.com/reader/full/starboard-value-transforming-darden 254/294
254
– AL, OH, PA, NC, SC, and MO would be among the first markets to consider.
Darden should also look at smaller markets that have distribution, operational, and potentially financial challenges, such as in
the Northwest and New England.
While we believe that Olive Garden is struggling in certain of these markets, this analysis must be combined with store-by-
store P&L data to determine which markets to target.
We have identified several initial markets for Olive Garden to consider
Olive Garden Restaurants by State Olive Garden Target Markets for Franchising
Initial refranchising target
<15 units; consider
refranchising
Medium sized market;
assess with financial data
Large sized market; low
peer franchising mix
19
244
22
144 4
139 1
94
1936
28
910 18
1020
69
23
9 1115
85
6
156
7
10
2427
388
7 25
27
30
15
74
315
17
201
Large markets with unique
operating challenges
Northern
CA: Hightraffic, but
poor
customer
reviews*
NY, PA, NJ, CT,
MS, WY: lowest
rated markets*
*Source: Czar Metrics Online Review and Social Media Study.
Philly: Foursquare
data suggests huge
traffic problem,*
and store visits
reveal execution
issues; despite this,
high search
frequency suggests
strong local brand
equity
Target markets – LongHorn
Initial targets would be markets with modest store density that have been very successful as franchised markets for peers.
– Similar to Olive Garden, LongHorn has medium-density markets that align with Outback and Texas Roadhouse
franchised markets such as VA KS IN PA and MD
LongHorn is concentrated in the Southeast, with limited penetration in the North and West, indicating
that franchising can be a tool to both improve operations and accelerate growth
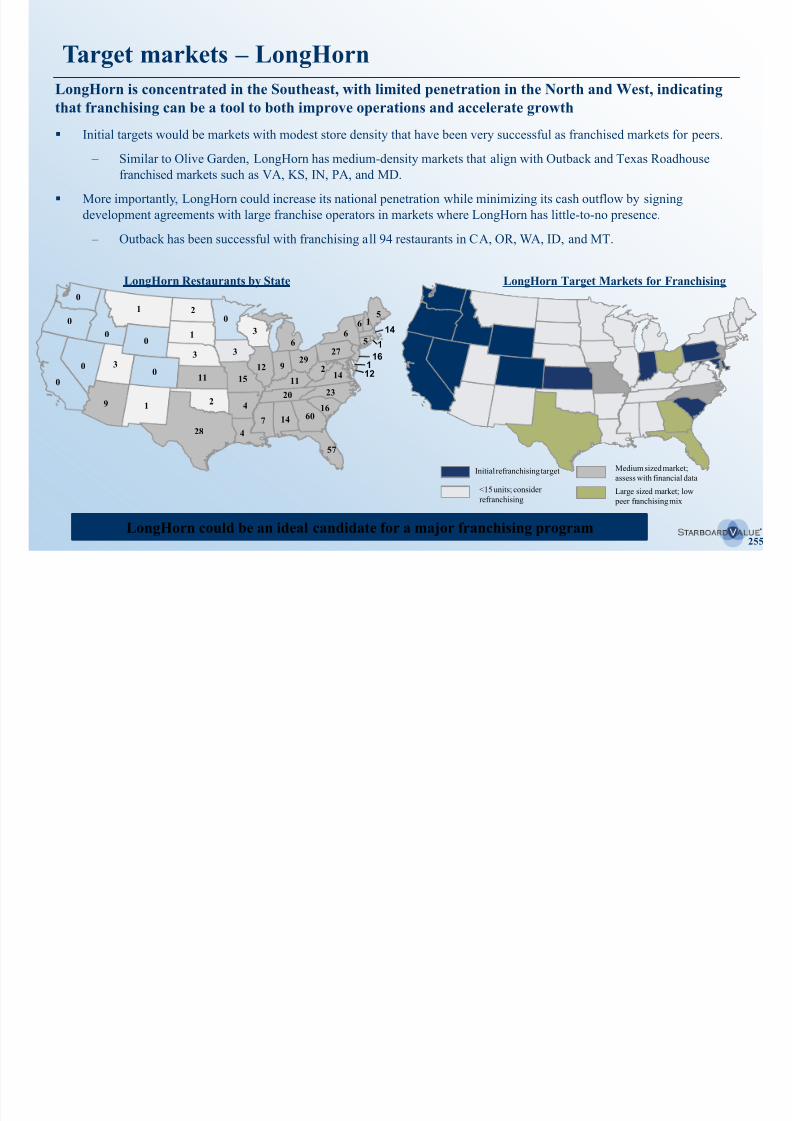
8/11/2019 Starboard Value Transforming Darden
http://slidepdf.com/reader/full/starboard-value-transforming-darden 255/294
255
franchised markets such as VA, KS, IN, PA, and MD.
More importantly, LongHorn could increase its national penetration while minimizing its cash outflow by signing
development agreements with large franchise operators in markets where LongHorn has little-to-no presence.
– Outback has been successful with franchising all 94 restaurants in CA, OR, WA, ID, and MT.
LongHorn could be an ideal candidate for a major franchising program
01
52
10
30
600 1
33
929
12 2
1111 15
220
0
9
0 30
28
1
147
4
4
66
275
14
23
6016
57
112
14
16
1
LongHorn Restaurants by State LongHorn Target Markets for Franchising
Initial refranchising target
<15 units; consider
refranchising Large sized market; low
peer franchising mix
Medium sized market;
assess with financial data
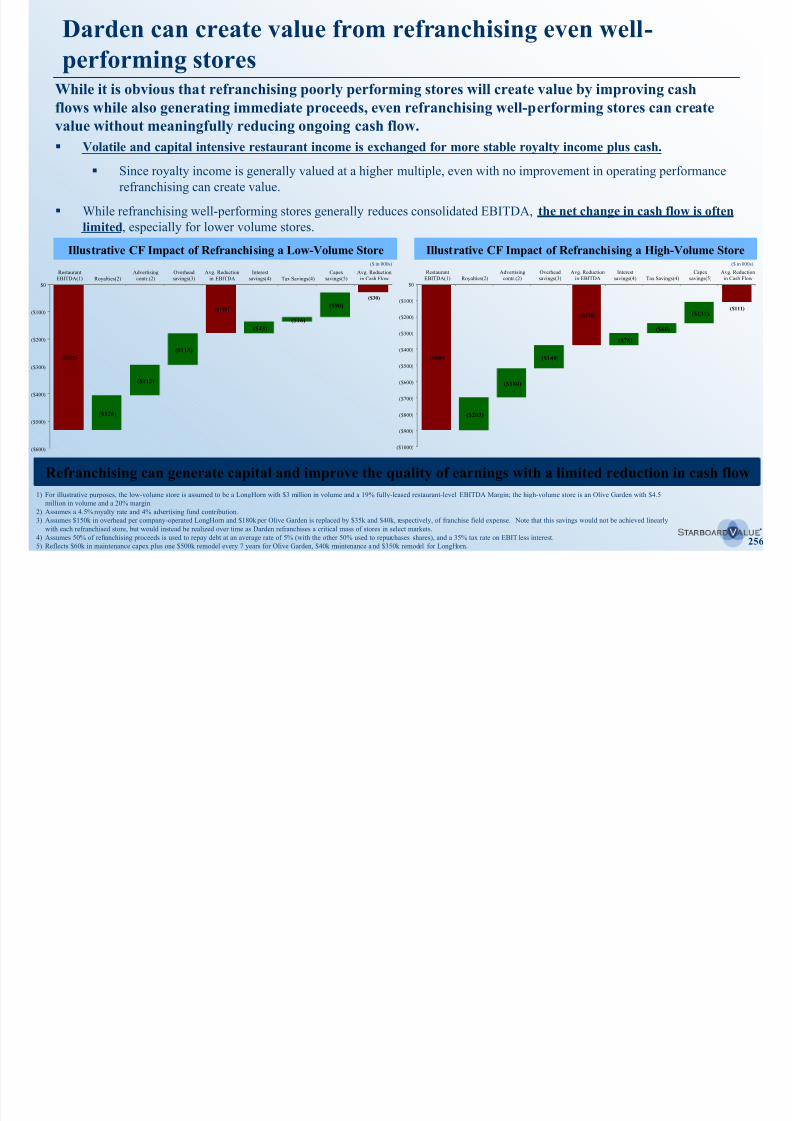
8/11/2019 Starboard Value Transforming Darden
http://slidepdf.com/reader/full/starboard-value-transforming-darden 256/294
Refranchising underperforming stores and markets will necessarily improve Darden’s dividend coverage and credit rating,
as these stores generate little-to-no current earnings or cash flow, yet can be sold to a franchisee that will provide Darden
with an initial infusion of capital and an ongoing income stream
Refranchising will help to solidify Darden’s credit rating anddividendBy using half of the proceeds from refranchising to repay debt and half to repurchase shares, Darden
would lower its lease-adjusted leverage ratio and its dividend payout ratio.
8/11/2019 Starboard Value Transforming Darden
http://slidepdf.com/reader/full/starboard-value-transforming-darden 257/294
257
with an initial infusion of capital and an ongoing income stream.
For well-performing stores, the impact on the dividend coverage and credit rating depends on a number of factors(1), but
will generally be positive, especially for the types of stores that would be the target of a typical refranchising program.
For all but the highest-volume, best performing stores, the proceeds generated from refranchising, net of taxes, will
be sufficient to repay enough debt and repurchase enough shares to more than offset any reduction in cash flow.
Further, since most refranchising deals are coupled with development agreements, Darden can expect an ongoing influx of(i) capital from franchise fees, which could be used to pay down more debt and buy back more shares, and (ii) increasing
royalty payments, which will further improve Darden’s credit and dividend coverage metrics.
In addition to the quantifiable benefits, the increased stability of cash flows and higher returns on capital will be viewed
favorably by both lenders and income-oriented shareholders.
Refranchising a modest portion of the current store base will help Darden to maintain its investment
grade rating and improve the safety of its dividend
1) These factors include the reduction in cash flow, if any, due to the sale of the store, the proceeds received, net of taxes, the use of proceeds, the increased EBITA margin and ROA resulting from refranchising, and the
reduction in total revenue
8/11/2019 Starboard Value Transforming Darden
http://slidepdf.com/reader/full/starboard-value-transforming-darden 258/294

8/11/2019 Starboard Value Transforming Darden
http://slidepdf.com/reader/full/starboard-value-transforming-darden 259/294
259
X. 100-day plan
Would intend to achieve full run-rate within 12-18 months,including several quick hits implemented within the first 100 days
1. Refine and Share Roadmap
& Launch “Quick Hits”
2. Optimize Current State,
Execute “Quick hits”, Validate
and Plan Long Term3. Execute Long Term Strategy
First, the Board must work with Darden’s management team to unify the strategic plan going forwardwhile completing the CEO search as soon as possible.
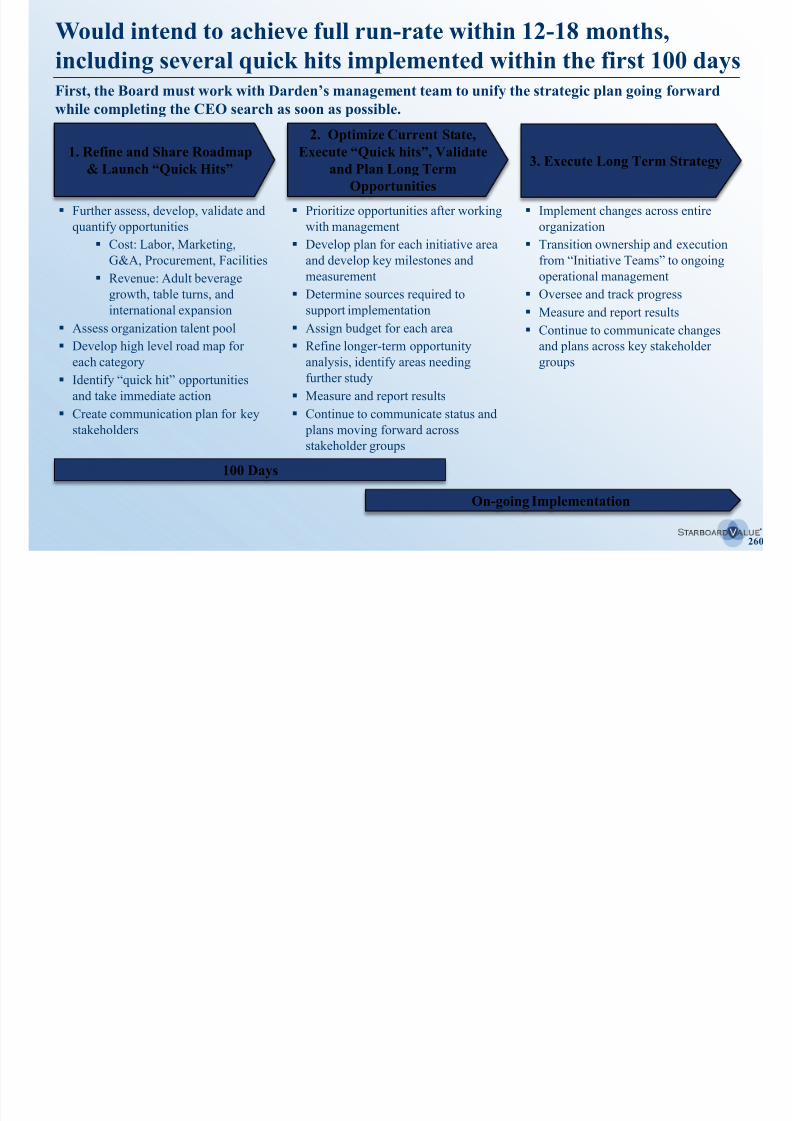
8/11/2019 Starboard Value Transforming Darden
http://slidepdf.com/reader/full/starboard-value-transforming-darden 260/294
260
& Launch Quick Hits and Plan Long TermOpportunities
100 Days
On-going Implementation
Implement changes across entire
organization
Transition ownership and execution
from “Initiative Teams” to ongoing
operational management
Oversee and track progress
Measure and report results
Continue to communicate changes
and plans across key stakeholder
groups
Prioritize opportunities after working
with management
Develop plan for each initiative area
and develop key milestones and
measurement
Determine sources required tosupport implementation
Assign budget for each area
Refine longer-term opportunity
analysis, identify areas needing
further study
Measure and report results
Continue to communicate status and
plans moving forward acrossstakeholder groups
Further assess, develop, validate and
quantify opportunities
Cost: Labor, Marketing,
G&A, Procurement, Facilities
Revenue: Adult beverage
growth, table turns, andinternational expansion
Assess organization talent pool
Develop high level road map for
each category
Identify “quick hit” opportunities
and take immediate action
Create communication plan for key
stakeholders
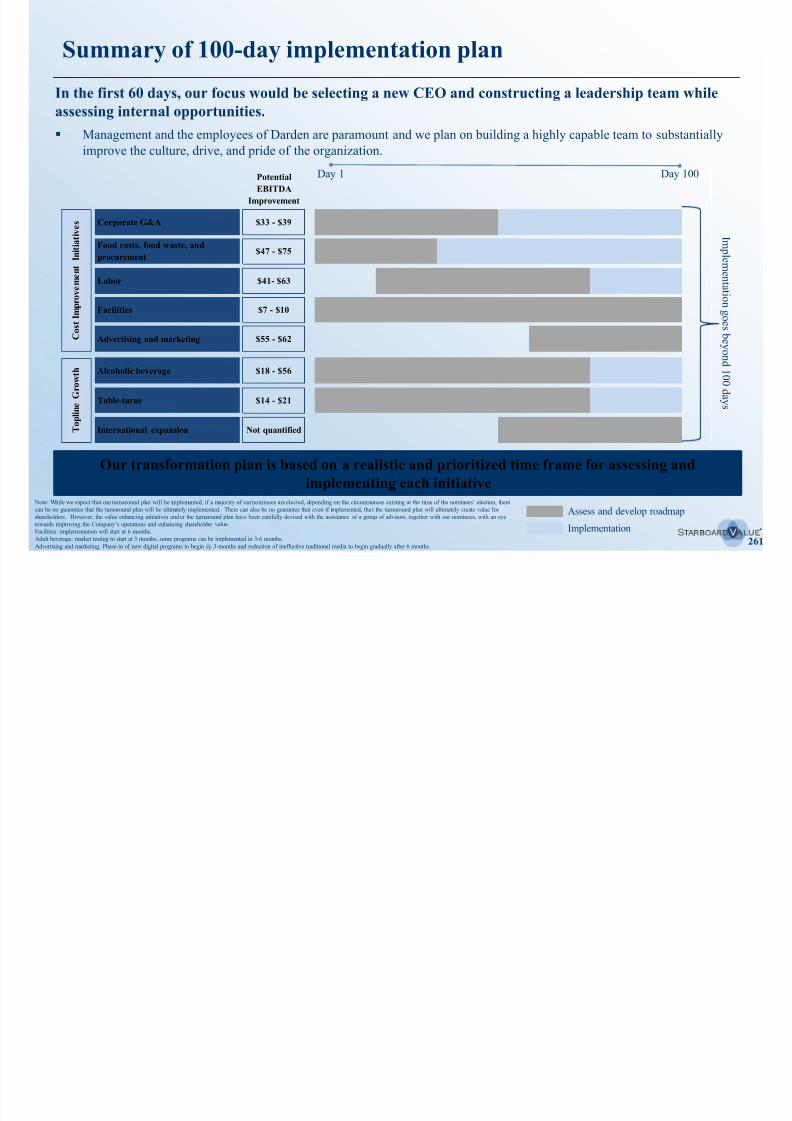
8/11/2019 Starboard Value Transforming Darden
http://slidepdf.com/reader/full/starboard-value-transforming-darden 261/294
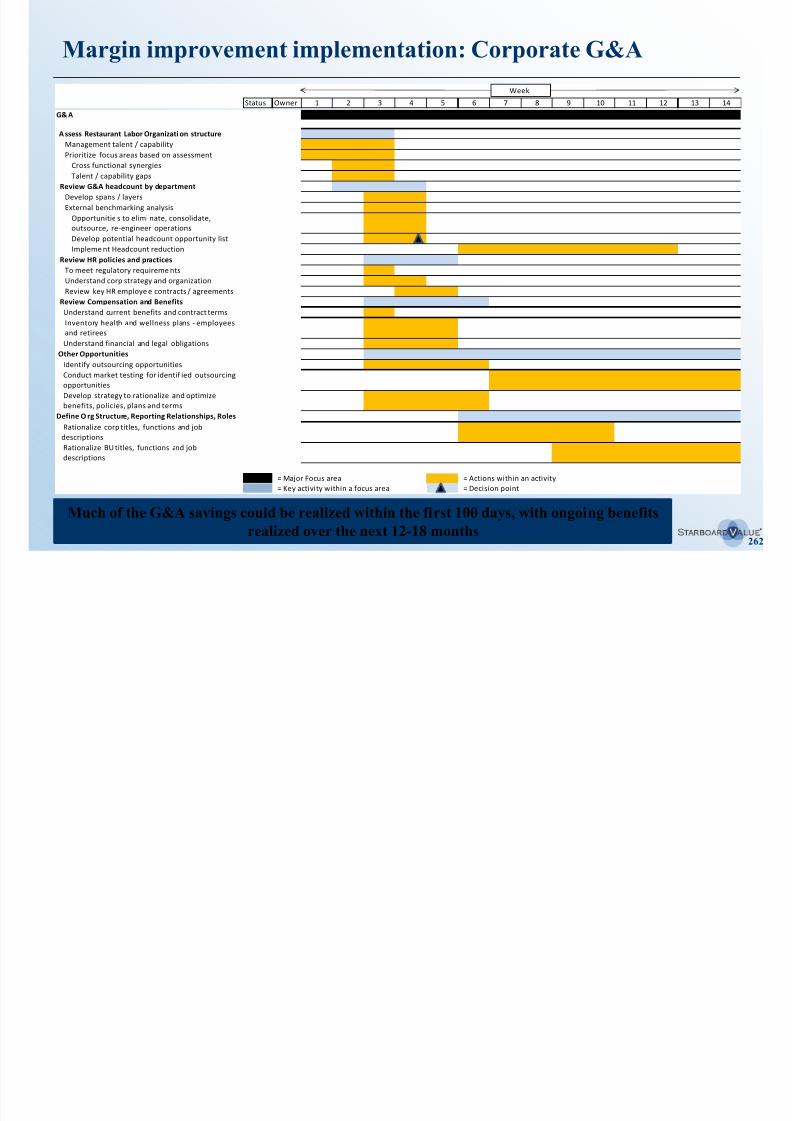
8/11/2019 Starboard Value Transforming Darden
http://slidepdf.com/reader/full/starboard-value-transforming-darden 262/294
Margin improvement implementation: Food costs, food waste,and procurement
Status Owner 1 2 3 4 5 6 7 8 9 10 11 12 13 14
Supply Chain and Procurement
Assess Spend Profile
Spend Profile Categorization - Direct & Indirect
Identify areas of biggest opportunity
Develop Strategy for each spend category
Asse ss Procurement Organization structure
Management talent / capability Prioritize focus areas based on assessment
Week
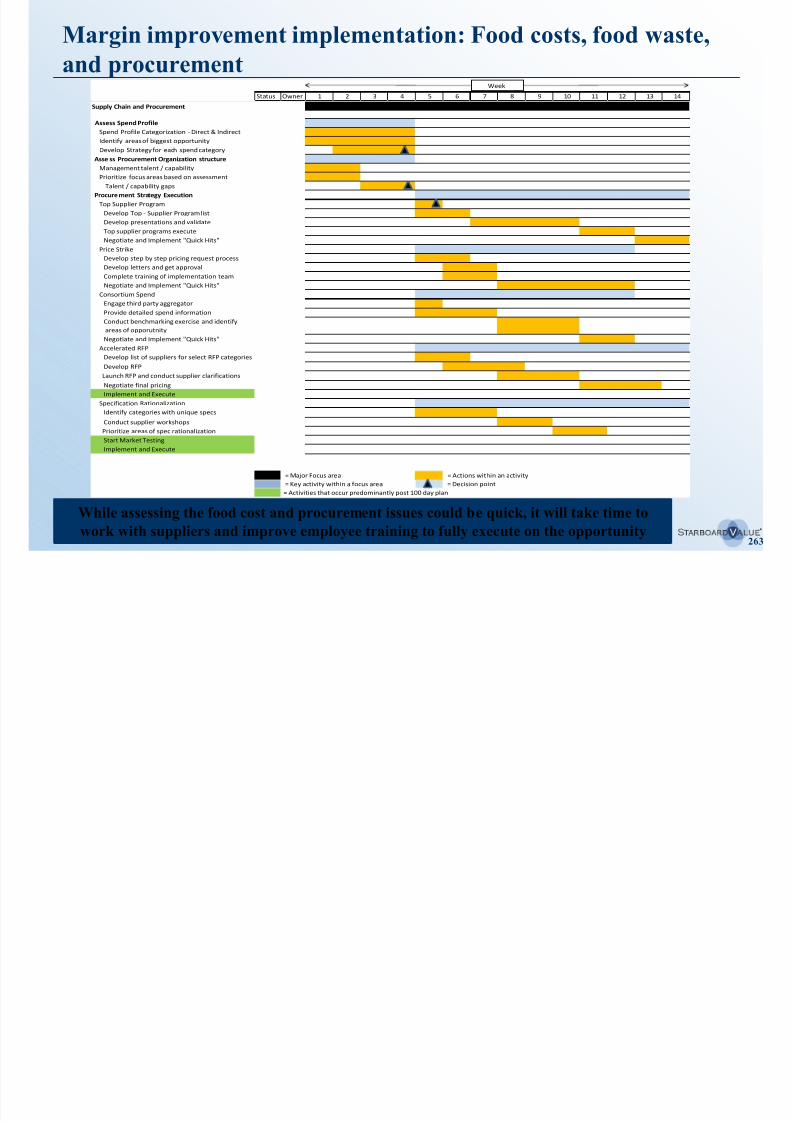
8/11/2019 Starboard Value Transforming Darden
http://slidepdf.com/reader/full/starboard-value-transforming-darden 263/294
263
While assessing the food cost and procurement issues could be quick, it will take time to
work with suppliers and improve employee training to fully execute on the opportunity
Talent / capability gaps
Procurement Strategy Execution
Top Supplier Program
Develop Top - Supplier Program list
Develop presentations and validate
Top supplier programs execute
Negotiate and Implement "Quick Hits"
Price Strike
Develop step by step pricing request process
Develop letters and get approval
Complete training of implementation team
Negotiate and Implement "Quick Hits"
Consortium Spend
Engage third party aggregator
Provide detailed spend information
Conduct benchmarking exercise and identify
areas of opporutnity
Negotiate and Implement "Quick Hits"
Accelerated RFP
Develop list of suppliers for select RFP categories
Develop RFP
Launch RFP and conduct supplier clarifications
Negotiate final pricing
Implement and Execute
Specification Rationalization
Identify categories with unique specs
Conduct supplier workshops
Prioritize areas of spec rationalization
Start Market Testing
Implement and Execute
= Major Focus area = Actions within an activity
= Key activity within a focus area = Decision point
= Activities that occur predominantly post 100 day plan
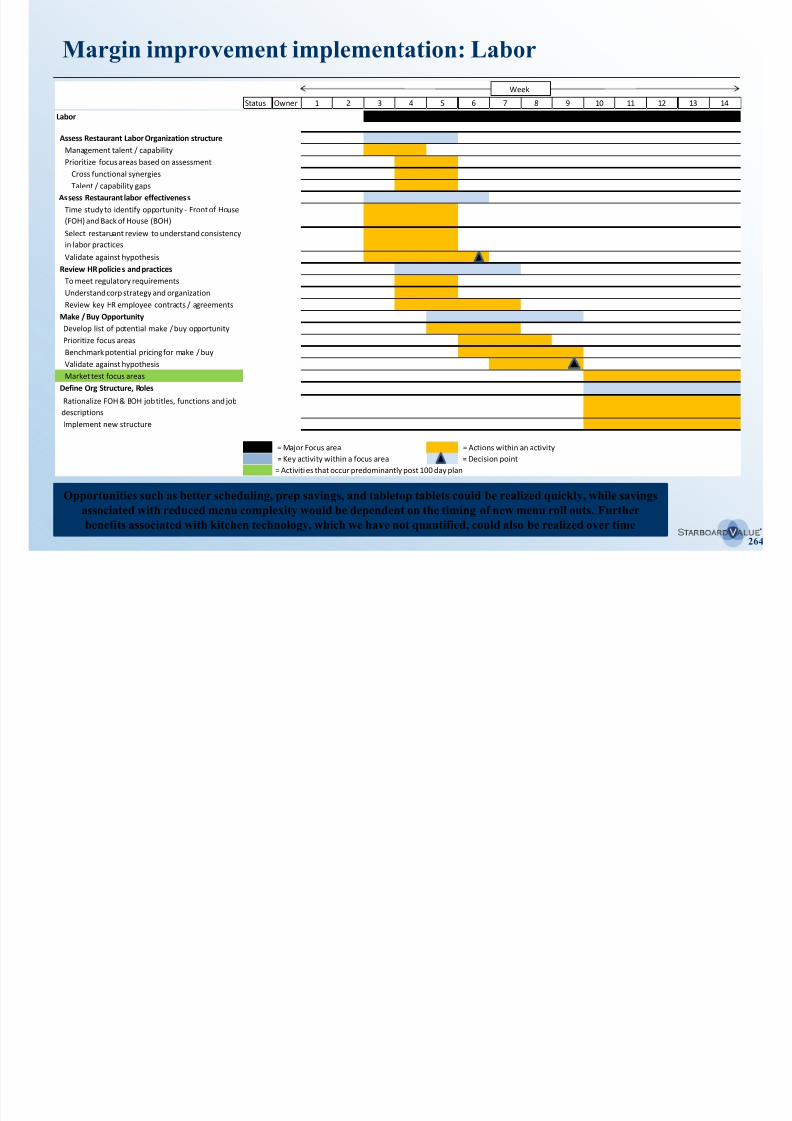
8/11/2019 Starboard Value Transforming Darden
http://slidepdf.com/reader/full/starboard-value-transforming-darden 264/294
Margin improvement implementation: Facilities
Status Owner 1 2 3 4 5 6 7 8 9 10 11 12 13 14
Facilities Management
Assess Procurement Spend
Spend Profile - direct, labor, indirect categories
Develop supplier profileInternal FM teamset-up / RFP
Week
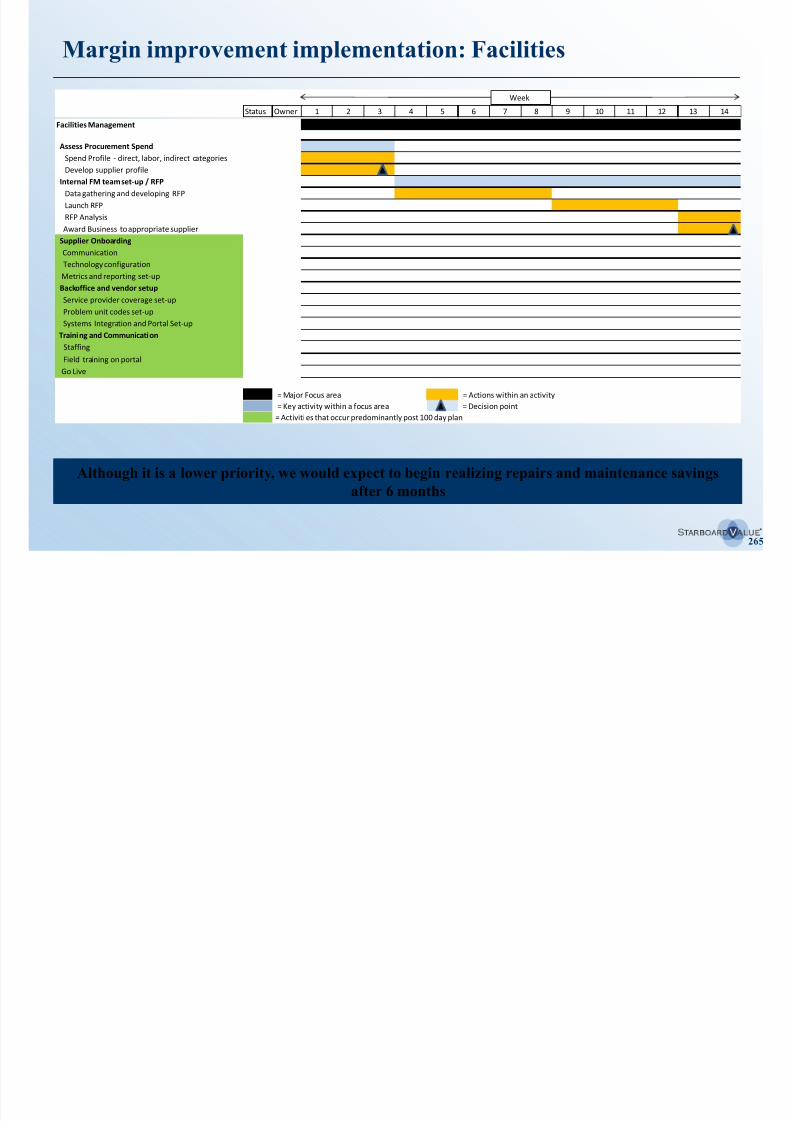
8/11/2019 Starboard Value Transforming Darden
http://slidepdf.com/reader/full/starboard-value-transforming-darden 265/294
265
Internal FM team set-up / RFP
Data gathering and developing RFP
Launch RFP
RFP Analysis
Award Business to appropriate supplier
Supplier Onboarding
Communication
Technology configuration
Metrics and reporting set-up
Backoffice and vendor setup
Service provider coverage set-up Problem unit codes set-up
Systems Integration and Portal Set-up
Training and Communication
Staffing
Field training on portal
Go Live
= Major Focus area = Actions within an activity
= Key activity within a focus area = Decision point
= Activiti es that occur predominantly post 100 day plan
Although it is a lower priority, we would expect to begin realizing repairs and maintenance savings
after 6 months
Margin improvement implementation: Advertising & marketing
Status Owner 1 2 3 4 5 6 7 8 9 10 11 12 13 14
Adult Beverage Growth
Assess Existing Alcohol Sales Strategy
Review alcohol strategy across all Darden concepts
Review existing server alcohol training programReview gaps in program
Week
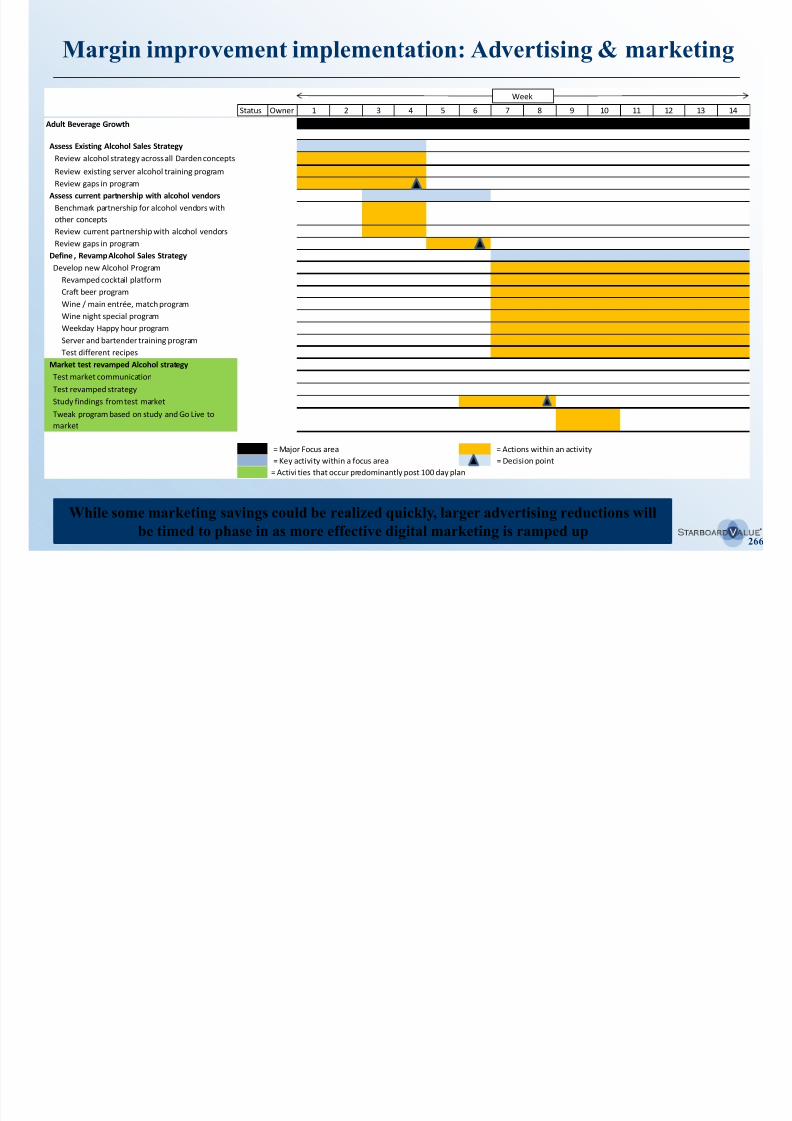
8/11/2019 Starboard Value Transforming Darden
http://slidepdf.com/reader/full/starboard-value-transforming-darden 266/294
266
While some marketing savings could be realized quickly, larger advertising reductions will
be timed to phase in as more effective digital marketing is ramped up
Review gaps in program
Assess current partnership with alcohol vendors
Benchmark partnership for alcohol vendors with
other concepts
Review current partnership with alcohol vendors
Review gaps in program
Define , Revamp Alcohol Sales Strategy
Develop new Alcohol Program
Revamped cocktail platform
Craft beer program
Wine / main entrée, match program
Wine night special program
Weekday Happy hour program
Server and bartender training program
Test different recipes
Market test revamped Alcohol strategy
Test market communication
Test revamped strategy
Study findings from test market
Tweak program based on study and Go Live to
market
= Major Focus area = Actions within an activity
= Key activity within a focus area = Decision point
= Activi ties that occur predominantly post 100 day plan
Revenue opportunity: Alcoholic beverage
Status Owner 1 2 3 4 5 6 7 8 9 10 11 12 13 14
Adult Beverage Growth
Assess Existing Alcohol Sales Strategy
Review alcohol strategy across all Darden concepts
Review existing server alcohol training program
Review gaps in program
Week
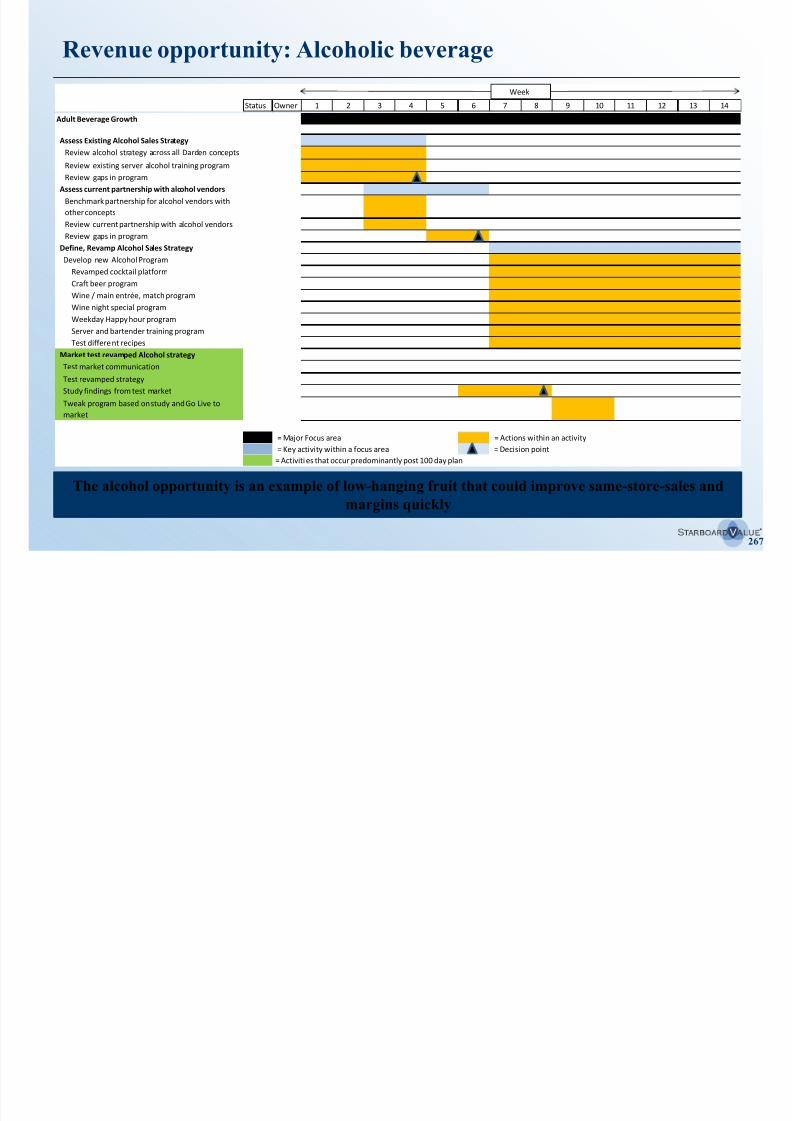
8/11/2019 Starboard Value Transforming Darden
http://slidepdf.com/reader/full/starboard-value-transforming-darden 267/294
267
Assess current partnership with alcohol vendors
Benchmark partnership for alcohol vendors with
other concepts
Review current partnership with alcohol vendors
Review gaps in program
Define, Revamp Alcohol Sales Strategy
Develop new Alcohol Program
Revamped cocktail platform
Craft beer program
Wine / main entrée, match program
Wine night special program
Weekday Happy hour program
Server and bartender training program
Test differe nt recipes
Market test revamped Alcohol strategy
Test market communication
Test revamped strategy
Study findings from test market
Tweak program based on study and Go Live to
market
= Major Focus area = Actions within an activity
= Key activity within a focus area = Decision point
= Activiti es that occur predominantly post 100 day plan
The alcohol opportunity is an example of low-hanging fruit that could improve same-store-sales and
margins quickly
Revenue opportunity: Same-store-sales growth
Status Owner 1 2 3 4 5 6 7 8 9 10 11 12 13 14
Same Store Sales Growth
Assess Existing Same Store Sales Growth
Review Current same store sales by region
Understand reason for sales decline
Figure problems with customer turns, food quality
Week
Improve the value proposition, improve service, and improve ownership mentality in restaurants and field.
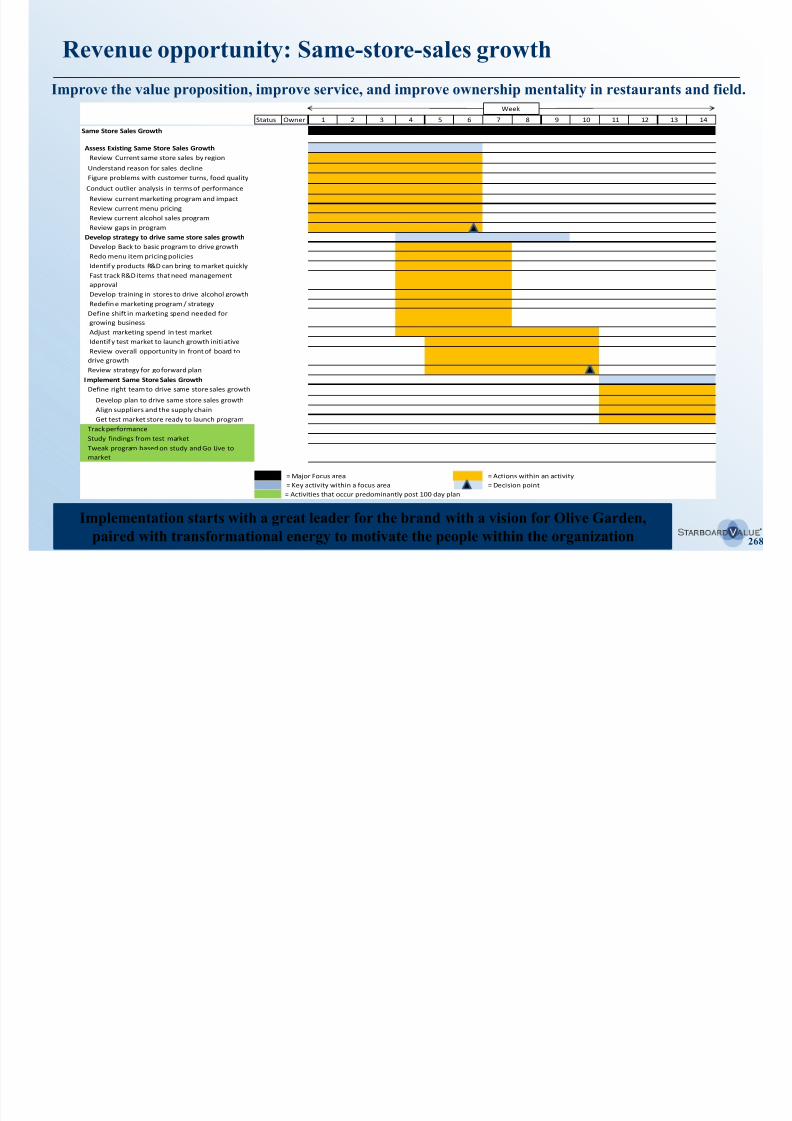
8/11/2019 Starboard Value Transforming Darden
http://slidepdf.com/reader/full/starboard-value-transforming-darden 268/294
268
Implementation starts with a great leader for the brand with a vision for Olive Garden,
paired with transformational energy to motivate the people within the organization
Conduct outlier analysis in terms of performance
Review current marketing program and impact
Review current menu pricing
Review current alcohol sales program
Review gaps in program
Develop strategy to drive same store sales growth
Develop Back to basic program to drive growth
Redo menu item pricing policies
Identif y products R&D can bring to market quickly
Fast track R&D items that need management
approval
Develop training in stores to drive alcohol growth
Redefin e marketing program / strategy
Define shift in marketing spend needed for
growing business
Adjust marketing spend in test market
Identif y test market to launch growth initi ative
Review overall opportunity in front of board to
drive growth
Review strategy for go forward plan
Implement Same Store Sales Growth
Define right team to drive same store sales growth
Develop plan to drive same store sales growth
Align suppliers and the supply chain
Get test market store ready to launch program
Track performance Study findings from test market
Tweak program based on study and Go Live to
market
= Major Focus area = Actions within an activity
= Key activity within a focus area = Decision point
= Activities that occur predominantly post 100 day plan
Revenue opportunity: International growth
Status Owner 1 2 3 4 5 6 7 8 9 10 11 12 13 14
International Growth
Review Current International Growth Plan
Review current partners for growth internationally
Review current international staffing situation
Review gaps in program
Week
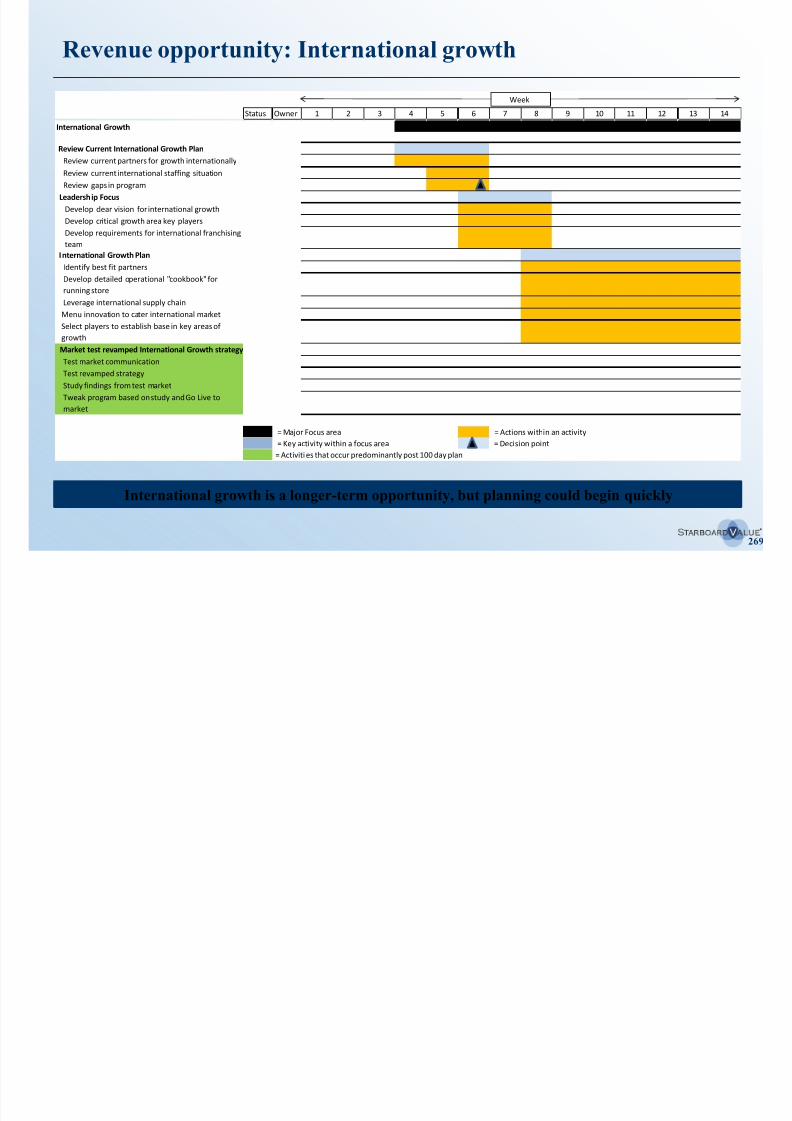
8/11/2019 Starboard Value Transforming Darden
http://slidepdf.com/reader/full/starboard-value-transforming-darden 269/294
269
Review gaps in program
Leadership Focus
Develop clear vision for international growth
Develop critical growth area key players
Develop requirements for international franchising
team
International Growth Plan
Identify best fit partners
Develop detailed operational "cookbook" for
running store
Leverage international supply chain
Menu innovation to cater international market
Select players to establish base in key areas of
growth
Market test revamped International Growth strategy
Test market communication
Test revamped strategy
Study findings from test market
Tweak program based on study and Go Live to
market
= Major Focus area = Actions within an activity
= Key activity within a focus area = Decision point
= Activiti es that occur predominantly post 100 day plan
International growth is a longer-term opportunity, but planning could begin quickly
8/11/2019 Starboard Value Transforming Darden
http://slidepdf.com/reader/full/starboard-value-transforming-darden 270/294
270
XI. Structuring considerations
Structuring overview
In conjunction with a leading investment banking advisor specializing in transaction structuring,
Starboard evaluated a number of structures with the goal of maximizing shareholder value while
maintaining and strengthening Darden’s investment grade credit rating and dividend.
Structuring scenarios included both a real estate separation and a spinoff of SRG.
– We anticipate that a real estate separation would occur within approximately 4-8 months following the AnnualM ti hil SRG i ff ld b l t d i t l 12 18 th ft th A l M ti
8/11/2019 Starboard Value Transforming Darden
http://slidepdf.com/reader/full/starboard-value-transforming-darden 271/294
271
Meeting, while an SRG spinoff would be completed approximately 12-18 months after the Annual Meeting.
– We believe both transactions can be accomplished in a tax and debt-breakage efficient manner.
We believe the Red Lobster Sale, combined with management and the Board’s poor capital allocation, excessive corporate
spending, and lack of focus on restaurant operations, has threatened the sustainability of Darden’s investment grade rating
and $2.20 dividend – a real estate separation is the first step in securing Darden’s investment grade rating anddividend.
While we believe that the substantial EBITDA improvement opportunity we have outlined in Section V will significantly
enhance both Darden’s credit rating and its dividend coverage, and that many of the cost savings can be achieved in the
near term, we have highlighted structures that will enable Darden to maintain its investment grade rating and dividend
even in the absence of any operational improvements.
– If Darden achieves even a small portion of our operational improvements, which we consider low-hanging fruit,
Darden’s credit quality and dividend coverage will improve even more dramatically, and we may be able to
complete the real estate separation and SRG spinoff on an accelerated timeline.
A real estate separation and an SRG spinoff would create substantial shareholder value while enabling
Darden to maintain its investment grade rating and dividend
Optimal structure
We believe that the optimal structure would begin with a two-step real estate separation followed by a
spinoff of SRG.
There are significant advantages to selling a portion of Darden’s properties before completing a larger real estate
separation.
– First, Darden could complete a sale-leaseback of approximately $300-$500 million worth of high tax-basis (low taxleakage) properties
8/11/2019 Starboard Value Transforming Darden
http://slidepdf.com/reader/full/starboard-value-transforming-darden 272/294
272
leakage) properties.
This would generate the maximum after-tax value for those assets while improving Darden’s credit quality.
– Next, Darden could separate its remaining real estate assets (potentially excluding some or all of the ground-leased
properties) through either a REIT spinoff or, more likely, a tax-free merger.
Following the real estate separation, Darden could spin off SRG, with expected completion approximately 12-18 months
after the Annual Meeting.
Once elected, the new Board would carefully evaluate this structure along with other potential structures, taking into
consideration the expected timing and magnitude of operational improvements, before making any final decisions.
We believe a multi-step separation would maximize value while enhancing Darden’s credit rating anddividend
8/11/2019 Starboard Value Transforming Darden
http://slidepdf.com/reader/full/starboard-value-transforming-darden 273/294
Darden post Red Lobster (cont’d)
In order to analyze Darden’s credit profile post the Red Lobster Sale, Starboard and its debt and
structuring advisors used a synthetic credit rating model based on Moody’s published criteria.
Broad Rating Broad Rating Darden Pre-RL Sale 2015E Darden Post RL Sale
Factor Factor Weight Rating Sub-Factor Weight Metric Score Weighted Rating Metric Score Weighted Rating
Total Revenues ($) 10.0% $8,676 6 0.6 A 6,705 9 0.9 Baa
No. of Restaurants (#) 5.0% 2,155 12 0.6 Ba 1,501 12 0.6 BaRevenues by Region (1) 5.0% 4 12 0.6 Ba 4 12 0.6 Ba
Scale & Diversity 25.0%
(1)
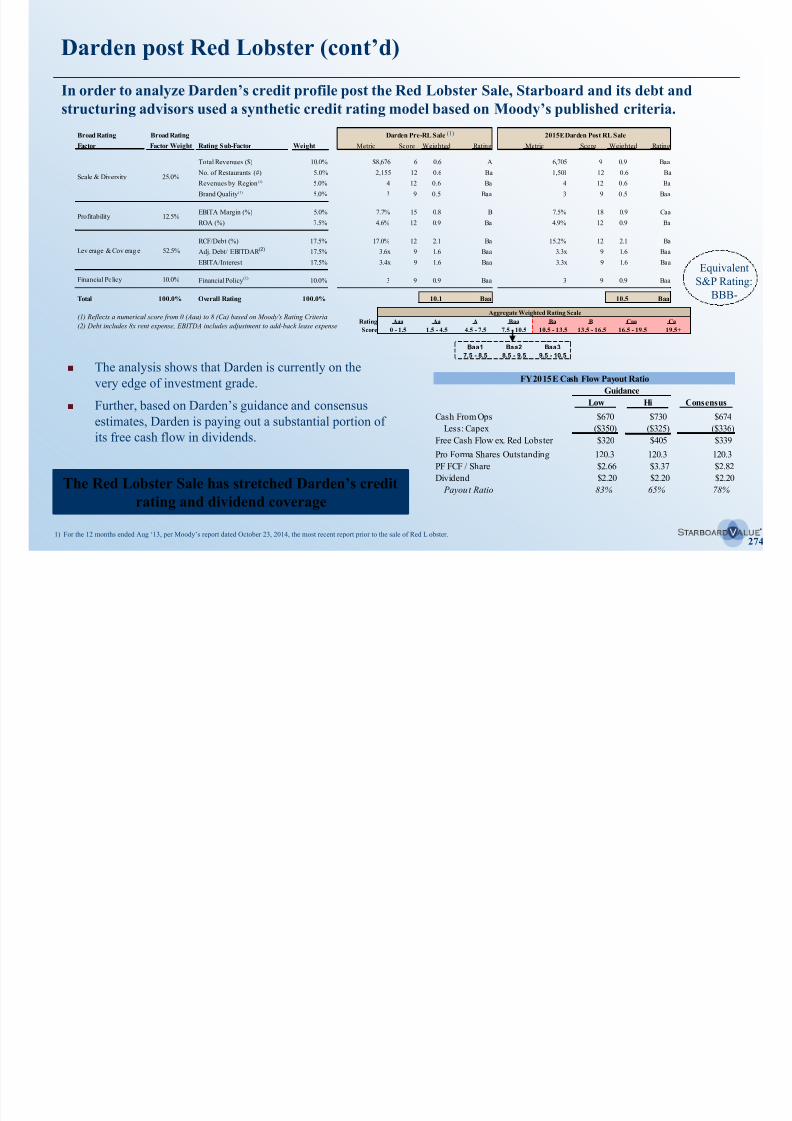
8/11/2019 Starboard Value Transforming Darden
http://slidepdf.com/reader/full/starboard-value-transforming-darden 274/294
274
The Red Lobster Sale has stretched Darden’s creditrating and dividend coverage
The analysis shows that Darden is currently on the
very edge of investment grade.
Further, based on Darden’s guidance and consensus
estimates, Darden is paying out a substantial portion of
its free cash flow in dividends.
Brand Quality (1) 5.0% 3 9 0.5 Baa 3 9 0.5 Baa
EBITA Margin (%) 5.0% 7.7% 15 0.8 B 7.5% 18 0.9 Caa
ROA (%) 7.5% 4.6% 12 0.9 Ba 4.9% 12 0.9 Ba
RCF/Debt (%) 17.5% 17.0% 12 2.1 Ba 15.2% 12 2.1 Ba
Adj. Debt/ EBITDAR (2) 17.5% 3.6x 9 1.6 Baa 3.3x 9 1.6 Baa
EBITA/Interest 17.5% 3.4x 9 1.6 Baa 3.3x 9 1.6 Baa
Financial Policy 10.0% Financial Policy(1)
10.0% 3 9 0.9 Baa 3 9 0.9 Baa
Total 100.0% Overall Rating 100.0% 10.1 Baa 10.5 Baa
(1) Reflects a numerical score from 0 (Aaa) to 8 (Ca) based on Moody's Rating Criteria
(2) Debt includes 8x rent expense, EBITDA includes adjustment to add-back lease expense
Profitability 12.5%
Lev erage & Cov erag e 52.5%
Equivalent
S&P Rating:
BBB-
Aggregate Weighted Rating Scale
Rating Aaa Aa A Baa Ba B Caa Ca
Score 0 - 1.5 1.5 - 4.5 4.5 - 7.5 7.5 - 10.5 10.5 - 13.5 13.5 - 16.5 16.5 - 19.5 19.5+
Baa1 Baa2 Baa3
7.5 - 8.5 8.5 - 9.5 9.5 - 10.5
FY 2015E Cash Flow Payout Ratio
Guidance
Low Hi Consensus
Cash From Ops $670 $730 $674
Less: Capex ($350) ($325) ($336)Free Cash Flow ex. Red Lobster $320 $405 $339
Pro Forma Shares Outstanding 120.3 120.3 120.3
PF FCF / Share $2.66 $3.37 $2.82
Dividend $2.20 $2.20 $2.20
Payout Ratio 83% 65% 78%
1) For the 12 months ended Aug ‘13, per Moody’s report dated October 23, 2014, the most recent report prior to the sale of Red L obster.
Real estate separation Step 1: Partial portfolio sale
We believe that selling approximately $300-$500 million worth of high-tax basis properties prior to
consummating a larger real estate separation would both maximize value and help to secure Darden’sinvestment grade rating.
In general, one would expect to receive lower cap rates (i.e., higher valuations) for sales of modestly-sized portfolios
rather than a bulk transaction.
8/11/2019 Starboard Value Transforming Darden
http://slidepdf.com/reader/full/starboard-value-transforming-darden 275/294
275
There are numerous reasons why starting with a partial portfolio sale makes sense
– There is a highly liquid market for sale-leasebacks of portfolios up to several hundred million.
– Certain individual properties could be sold in the 1031 “like kind” exchange market, where cap rates can be
100bp or more below those seen in portfolio sales.
– A partial portfolio sale or a series of individual sales would provide the market with another benchmark for the
value that Darden’s properties can trade at.
A portfolio sale in which the proceeds are used to repay debt would have the maximum impact towards loweringDarden’s leverage ratio.
By modestly reducing the size of the remaining real estate portfolio, a REIT spinoff or tax-free merger becomes even
more attractive and potentially easier to execute.
– Even without a merger partner, as a billion dollar plus public company, a Darden REIT would still have more
than enough critical mass.
– A smaller REIT would be easier to diversify over time, since it would be starting with a smaller base.
– A modestly smaller real estate portfolio may attract a larger universe of REIT partners interested in a tax-free
merger.
The primary rationale for pursing a REIT spin-off or a tax-free merger, rather than a sale, is tax-efficiency; however, we
believe that Darden has more than $500 million worth of high-tax-basis properties where there would be little-to-no tax
impact of a sale.
Real estate separation Step 1: Partial portfolio sale (cont’d)
In our illustrative example, we use a $350 million portfolio sale.
– Using Green Street’s estimates of development costs, we estimate that the
Company has added approximately $650 million worth of real estate since
Estimated Value of Re al Estate Added by Year
($ in millions)
$140.8$132.0$140.0
$160.0
8/11/2019 Starboard Value Transforming Darden
http://slidepdf.com/reader/full/starboard-value-transforming-darden 276/294
276
While we have not assumed any upside from this, it is likely that by selling some of these properties Darden can
generate both cash proceeds and tax losses that can be used to offset other gains, while giving up little-to-no income.
In our illustrative example, we have shown just a $350 million sale, in order to be conservative.
Although we believe, as shown in detail in our Real Estate Primer (available at http://tinyurl.com/Primer-On-Darden-Real-
Estate), that none of Darden’s debt covenants would prohibit a larger real estate transaction, a $350 million sale would
approximately coincide with the sale-leaseback bucket specified in Darden’s public bonds and the amount outstanding onDarden’s term-loan, which could be repaid with minimal debt-breakage cost.
A $350 million portfolio sale would generate little-to-no tax or debt breakage costs
2008 – the majority of these properties would trade at a value close to their
development cost.
– In addition, there will likely be numerous older properties with a higher
tax basis for a variety of reasons, including stores on land that was
purchased during the real estate peak in the mid 2000s.
– Further, we believe that Darden owns a modest number of locations that
generate minimal cash flow on a fully-leased basis and where the propertycould be sold for a higher and better use.
$99.7
$79.2
$90.9
$111.5
2008 2009 2010 2011 2012 2013$0.0
$20.0
$40.0
$60.0
$80.0
$100.0
$120.0
Note: The valuations referenced in the Real Estate Primer are estimates and, therefore, there can be no assurance that such estimates are reflective of actual realizable value. While there could be additional information regar ding Darden’s real estate assets that
could alter the valuations referenced in the Real Estate Primer, Starboard strongly believes that the assumptions used in such valuations are conservative, and that the incorporation of any such additional data would likely to lead to a higher valuation range.
Real estate separation Step 1: Partial portfolio sale (cont’d)
We believe the conservative portfolio sale example below would be a value-enhancing first step in a
real estate separation.
Based on precedent transactions, we believe that a sale of $350 million worth of recently-built properties would sell at a
cap rate of 6.75%.Portfolio Sale Assumptions
($ in millions)
Rent of Properties Included in Portfolio Sale $24Cap Rate 6.75%
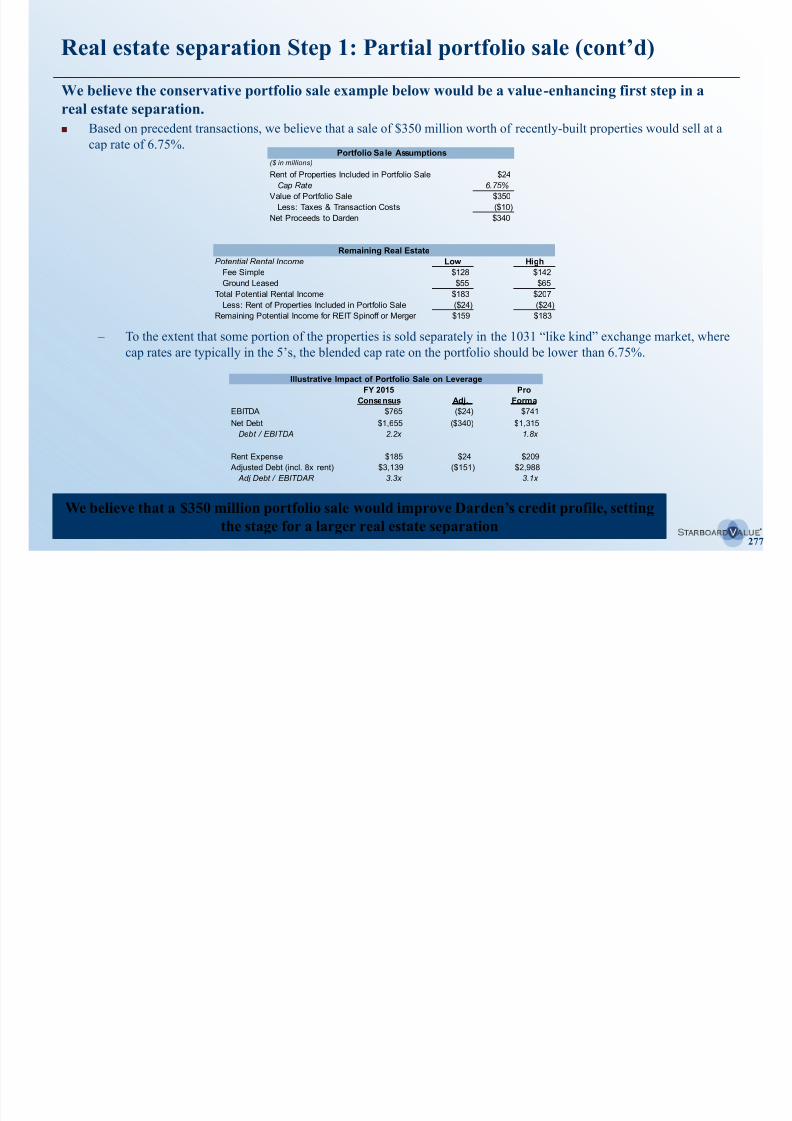
8/11/2019 Starboard Value Transforming Darden
http://slidepdf.com/reader/full/starboard-value-transforming-darden 277/294
277
We believe that a $350 million portfolio sale would improve Darden’s credit profile, settingthe stage for a larger real estate separation
– To the extent that some portion of the properties is sold separately in the 1031 “like kind” exchange market, where
cap rates are typically in the 5’s, the blended cap rate on the portfolio should be lower than 6.75%.
Value of Portfolio Sale $350
Less: Taxes & Transaction Costs ($10)
Net Proceeds to Darden $340
Remaining Real Estate
Potential Rental Income Low High
Fee Simple $128 $142
Ground Leased $55 $65
Total Potential Rental Income $183 $207
Less: Rent of Properties Included in Portfolio Sale ($24) ($24)Remaining Potential Income for REIT Spinoff or Merger $159 $183
Illustrative Impact of Portfolio Sale on Leverage
FY 2015 Pro
Consensus Adj. Forma
EBITDA $765 ($24) $741
Net Debt $1,655 ($340) $1,315
Debt / EBITDA 2.2x 1.8x
Rent Expense $185 $24 $209
Adjusted Debt (incl. 8x rent) $3,139 ($151) $2,988
Adj Debt / EBITDAR 3.3x 3.1x
Real estate separation Step 2: REIT Spinoff or tax-free merger
After the completion of the partial portfolio sale, Darden would separate all or the majority of its
remaining real estate assets through a REIT spinoff or tax-free merger.
While we believe that a tax-free merger is likely to be the most attractive option, as outlined in our Real Estate Primer
(available at http://tinyurl.com/Primer-On-Darden-Real-Estate), and that there are numerous partners interested in such a
transaction, in this illustrative example we have shown a REIT spinoff for the sake of simplicity.
– We believe that the general structure outlined in this section would be applicable to a tax-free merger as well, and
8/11/2019 Starboard Value Transforming Darden
http://slidepdf.com/reader/full/starboard-value-transforming-darden 278/294
278
This structure demonstrates that Darden can separate its real estate while enhancing its credit
rating and dividend coverage, even without any of our expected EBITDA improvements
that such a scenario would likely enhance Darden’s dividend coverage and investment grade rating even more
substantially than a REIT spinoff; however, the details of the transaction would depend in part on the specific
financial characteristics and preferences of the merger partner.
In order to be conservative, for purposes of this structuring example we have assumed that none of Darden’s ground
leases are included in the REIT spinoff.
– We believe that the REIT would likely trade at a higher multiple, and be able to support a higher leverage ratio,
with limited ground-lease exposure.
– It is likely that a substantial portion of Darden’s ground leases have long remaining lives, multiple extension
options, or options to purchase the underlying land, in which case they may be appropriate to include in a REIT
spinoff, but Darden does not disclose sufficient information to estimate the number of such properties.
– Shorter-term ground leases may not be of interest to certain merger partners; however, there are other buyers for
those assets, and Darden could monetize them over time, both creating value and further improving its credit
profile and dividend coverage beyond what we have estimated.
As detailed in the following pages, we assume that the REIT takes on ~$700 million of debt and pays a dividend of $0.52
per share, which, when combined with the OpCo dividend, is equal to Darden’s current $2.20 dividend but with a lower
(i.e., safer) payout ratio.
Note: The valuations referenced in the Real Estate Primer are estimates and, therefore, there can be no assurance that such estimates are reflective of actual realizable value. While there could be additional information regar ding Darden’s real estate assets that
could alter the valuations referenced in the Real Estate Primer, Starboard strongly believes that the assumptions used in such valuations are conservative, and that the incorporation of any such additional data would likely to lead to a higher valuation range.
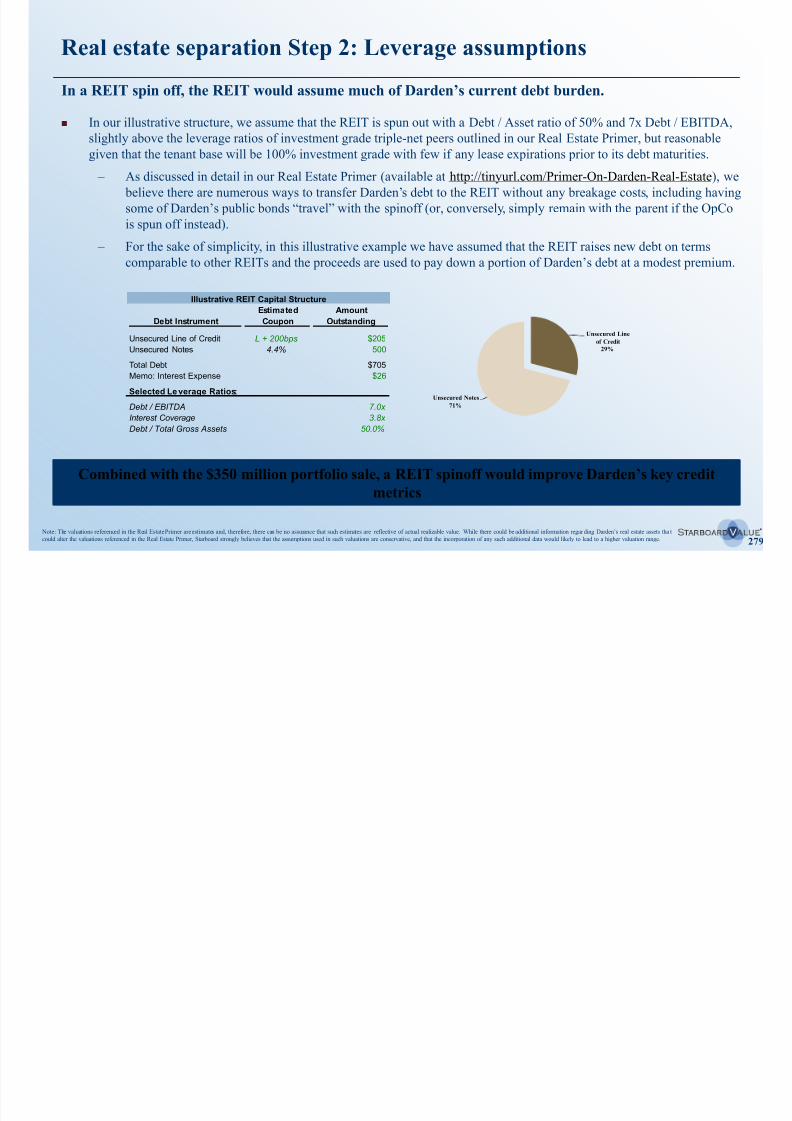
8/11/2019 Starboard Value Transforming Darden
http://slidepdf.com/reader/full/starboard-value-transforming-darden 279/294
Real estate separation Step 2: Credit rating impact
Based on Moody’s’ criteria, the real estate separation, as outlined on the previous page, would moveDarden from the brink of a downgrade to safely within the range of its current rating.
Darden’s OpCo would benefit from not only better leverage, but also improved returns on capital.
Broad Rating Broad Rating Darden OpCo Synthetic Rating
Factor Factor Weight Rating Sub-Factor Weight Metric Score Weighted Rating
Total Revenues ($) 10.0% $6,705 9 0.9 Baa
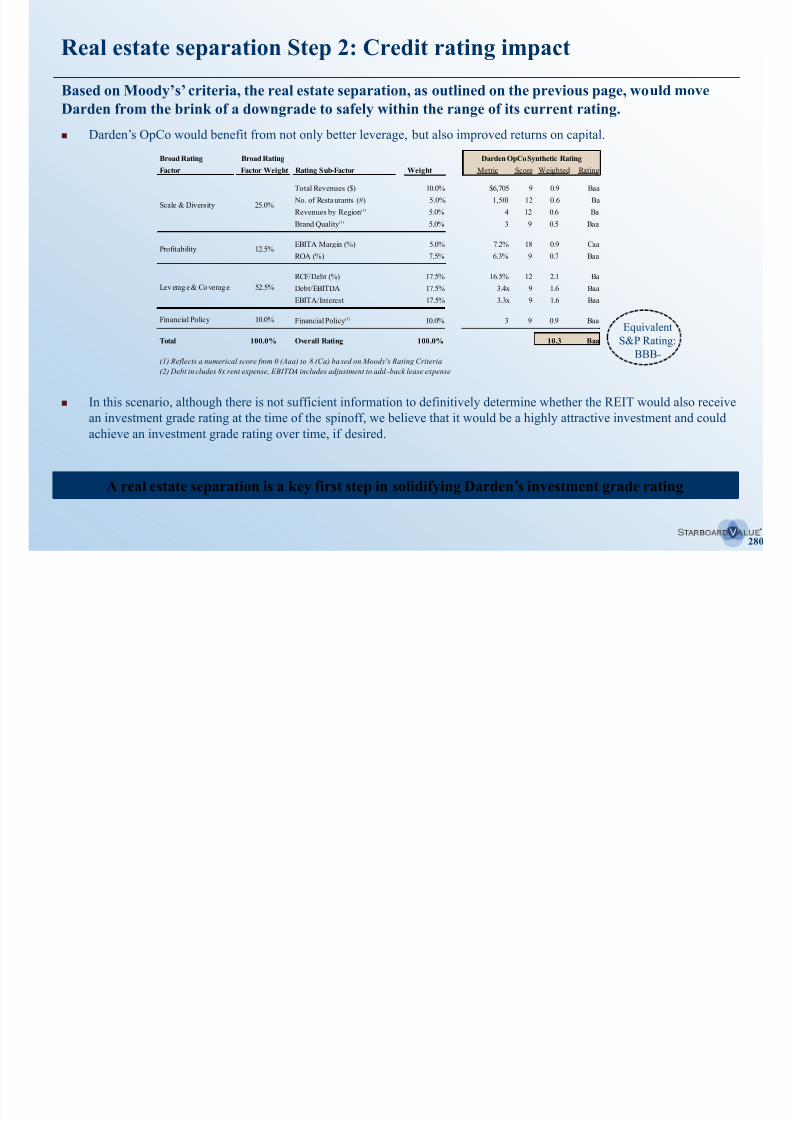
8/11/2019 Starboard Value Transforming Darden
http://slidepdf.com/reader/full/starboard-value-transforming-darden 280/294
280
A real estate separation is a key first step in solidifying Darden’s investment grade rating
In this scenario, although there is not sufficient information to definitively determine whether the REIT would also receive
an investment grade rating at the time of the spinoff, we believe that it would be a highly attractive investment and could
achieve an investment grade rating over time, if desired.
Equivalent
S&P Rating:
BBB-
No. of Restaurants (#) 5.0% 1,501 12 0.6 Ba
Revenues by Region (1) 5.0% 4 12 0.6 Ba
Brand Quality(1) 5.0% 3 9 0.5 Baa
EBITA Margin (%) 5.0% 7.2% 18 0.9 Caa
ROA (%) 7.5% 6.3% 9 0.7 Baa
RCF/Debt (%) 17.5% 16.5% 12 2.1 Ba
Debt/EBITDA 17.5% 3.4x 9 1.6 Baa
EBITA/Interest 17.5% 3.3x 9 1.6 Baa
Financial Policy 10.0% Financial Policy (1) 10.0% 3 9 0.9 Baa
Total 100.0% Overall Rating 100.0% 10.3 Baa
(1) Reflects a numerical score from 0 (Aaa) to 8 (Ca) ba sed on Moody's Rating Criteria
(2) Debt in cludes 8x rent expense, EBITDA includes adjustment to add -back lease expense
Scale & Diversity 25.0%
Profitability 12.5%
Lev erag e & Co verag e 52.5%
Because of the substantial tax savings associated with a REIT structure, on a combined basis Darden will have more cash
available to pay dividends (or to repay additional debt, if desired).
Real estate separation Step 2: Dividend impact
Since a real estate separation increases combined cash flow, it would improve Darden’s dividend coverage.
Further, since REITs traditionally pay out the majority of their cash flow,
the dividend burden on the OpCo will be reduced significantly.
Moreover, since a Darden REIT would have long term-leases with few
102%
93%
87% 86% 83%81%
79% 78% 78% 77% 77%
100%
NNN REIT Payout Ratios
Average (ex GTY) = 84%
229%
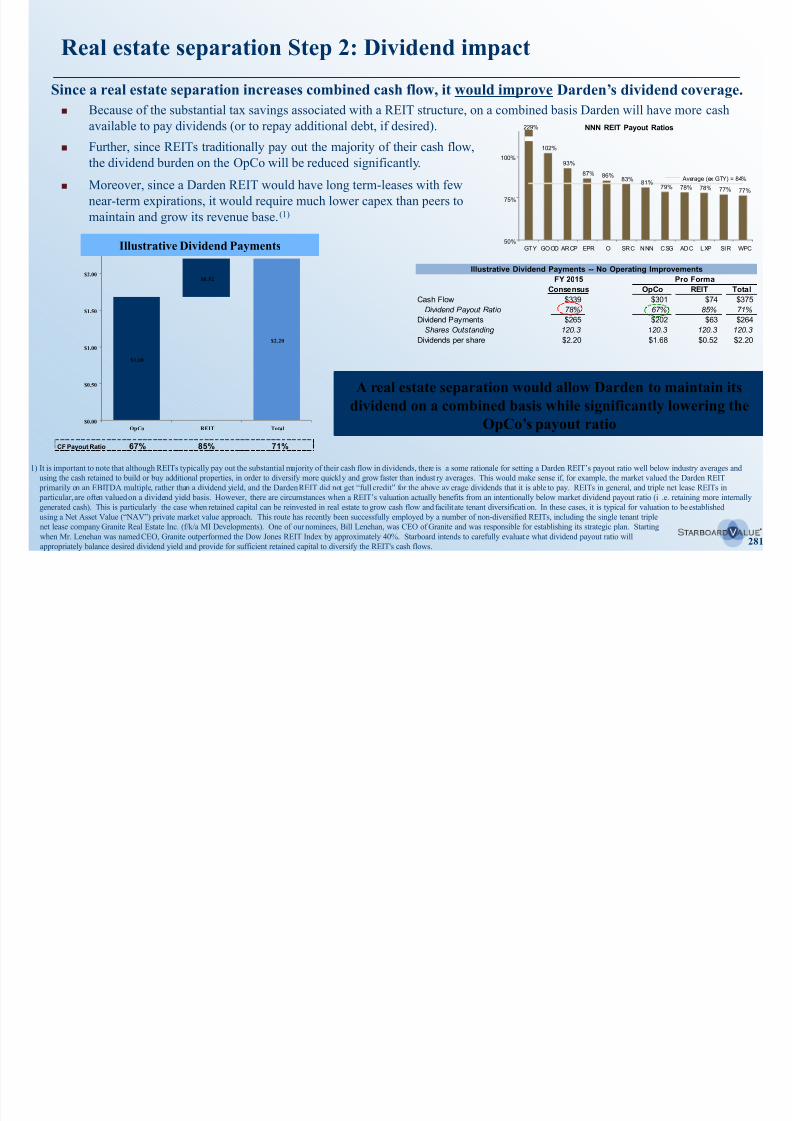
8/11/2019 Starboard Value Transforming Darden
http://slidepdf.com/reader/full/starboard-value-transforming-darden 281/294
281
Illustrative Dividend Payments -- No Operating Improvements
FY 2015 Pro Forma
Consensus OpCo REIT Total
Cash Flow $339 $301 $74 $375Dividend Payout Ratio 78% 67% 85% 71%
Dividend Payments $265 $202 $63 $264
Shares Outstanding 120.3 120.3 120.3 120.3
Dividends per share $2.20 $1.68 $0.52 $2.20
A real estate separation would allow Darden to maintain its
dividend on a combined basis while significantly lowering the
OpCo’s payout ratio
near-term expirations, it would require much lower capex than peers to
maintain and grow its revenue base.(1)
1) It is important to note that although REITs typically pay out the substantial majority of their cash flow in dividends, there is a some rationale for setting a Darden REIT’s payout ratio well below industry averages and
using the cash retained to build or buy additional properties, in order to diversify more quickly and grow faster than indust ry averages. This would make sense if, for example, the market valued the Darden REIT
primarily on an EBITDA multiple, rather than a dividend yield, and the Darden REIT did not get “full credit” for the above average dividends that it is able to pay. REITs in general, and triple net lease REITs in
particular, are often valued on a dividend yield basis. However, there are circumstances when a REIT’s valuation actually benefits from an intentionally below market dividend payout ratio (i .e. retaining more internally
generated cash). This is particularly the case when retained capital can be reinvested in real estate to grow cash flow and facilitate tenant diversification. In these cases, it is typical for valuation to be established
50%
75%
GTY GOOD ARCP EPR O SRC NNN CSG ADC LXP SIR WPC
using a Net Asset Value (“NAV”) private market value approach. This route has recently been successfully employed by a number of non-diversified REITs, including the single tenant triple
net lease company Granite Real Estate Inc. (f/k/a MI Developments). One of our nominees, Bill Lenehan, was CEO of Granite and was responsible for establishing its strategic plan. Starting
when Mr. Lenehan was named CEO, Granite outperformed the Dow Jones REIT Index by approximately 40%. Starboard intends to carefully evaluate what dividend payout ratio will
appropriately balance desired dividend yield and provide for sufficient retained capital to diversify the REIT's cash flows.
CF Payout Ratio 67% 85% 71%
$1.68
$0.52
$2.20
$0.00
$0.50
$1.00
$1.50
$2.00
$2.50
OpCo REIT Total
Illustrative Dividend Payments
SRG Spinoff
Following the completion of the real estate separation, Darden could separate SRG, ideally through a
tax-free spinoff.
In this illustrative example, we have assumed that SRG would be spun off 12 – 18 months after the Annual Meeting.
– We have assumed that SRG would be spun off net-debt-free and would not pay a dividend.
Since SRG is a growth company, we do not believe it would be rewarded by the market for paying a regular
dividend; instead, its cash flow would be better used to support unit growth and, to the extent there is excess
h fl h h
8/11/2019 Starboard Value Transforming Darden
http://slidepdf.com/reader/full/starboard-value-transforming-darden 282/294
282
We would expect to complete an SRG spinoff 12 – 18 months after the Annual Meeting,
or sooner
cash flow, share repurchases.
According to both management statements and our estimates, SRG would be self-funding, and could
therefore support modest leverage; however, in this illustrative example, we have taken a more conservative
approach by spinning SRG off with no net debt.
– Given these conditions, it is possible that an immediate spinoff of SRG may put undue stress on Darden’s
investment grade rating in the short term. If this is the case, we will carefully evaluate the proper time to
complete a spinoff, and we may wait until a modest portion of our cost savings is achieved in order to ensure thatDarden’s investment grade rating and dividend are not put at risk.
– Further, unlike a real estate separation, an SRG separation would take time to restructure the organization to
allow SRG to operate as a standalone company.
We believe that, due to Darden’s excessive corporate bureaucracy, SRG already has more infrastructure
than it would need to operate as a standalone company; however, work on preparing SRG to operate on a
standalone basis would begin immediately.
We have assumed that 100% of SRG is spun off to shareholders; however, it could make sense to begin with a partialIPO of up to 19.9% in order to establish a market for the stock and bring in additional capital at an attractive valuation.
If Darden is able to achieve even a modest amount of cost savings in the near term or bring in additional capital through
a larger real estate portfolio sale, a partial IPO of SRG, or putting net debt on SRG, the timing of an SRG spinoff could
be accelerated substantially.
SRG Spinoff – leverage impact
If Darden can realize just $65-90 million of our expected $271 million in cost reductions, we believe it
can ensure that an SRG spinoff will not put its credit rating in jeopardy.
In the event that we determine that an SRG spinoff may put Darden’s credit rating at risk, we believe this risk would be
mitigated with the realization of just $65 million in EBITDA improvements.
With approximately $90 million in savings, we believe Darden can position itself for an upgrade to Baa2 even after anSRG spinoff:
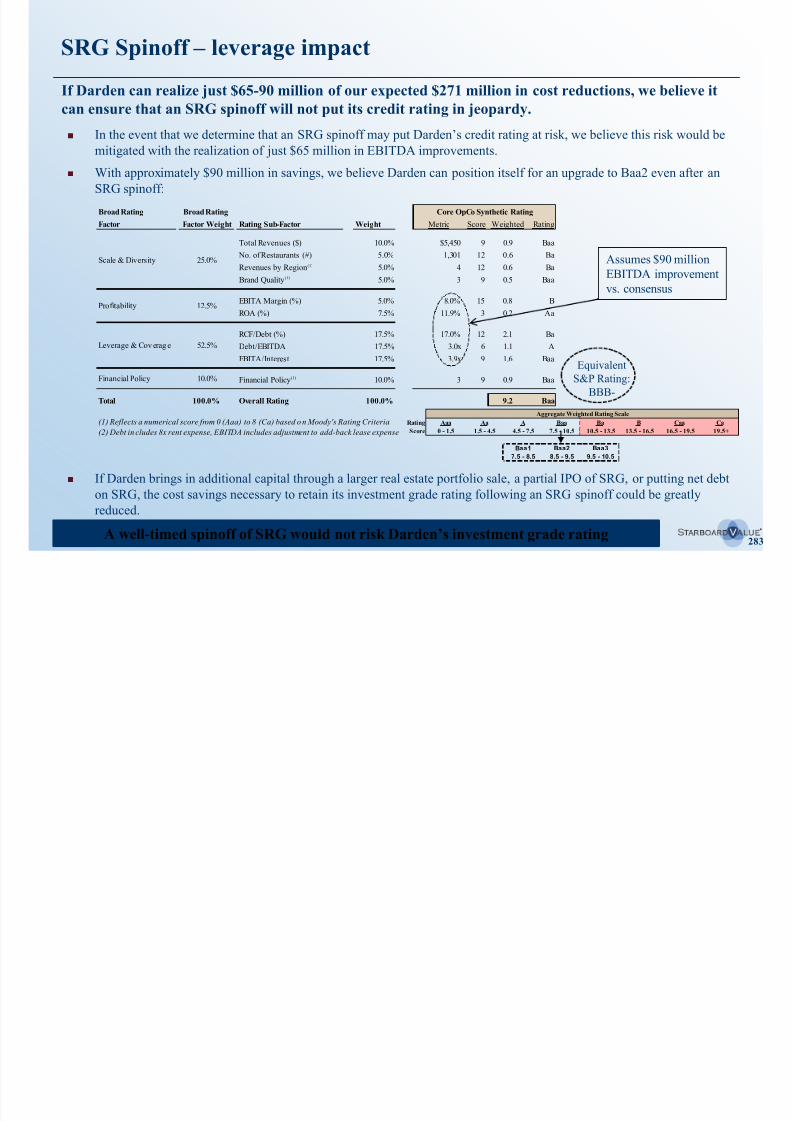
8/11/2019 Starboard Value Transforming Darden
http://slidepdf.com/reader/full/starboard-value-transforming-darden 283/294
283A well-timed spinoff of SRG would not risk Darden’s investment grade rating
p
If Darden brings in additional capital through a larger real estate portfolio sale, a partial IPO of SRG, or putting net debt
on SRG, the cost savings necessary to retain its investment grade rating following an SRG spinoff could be greatly
reduced.
Broad Rating Broad Rating Core OpCo Synthetic Rating
Factor Factor Weight Rating Sub-Factor Weight Metric Score Weighted Rating
Total Revenues ($) 10.0% $5,450 9 0.9 Baa
No. of Restaurants (#) 5.0% 1,301 12 0.6 Ba
Revenues by Region (1) 5.0% 4 12 0.6 Ba
Brand Quality (1) 5.0% 3 9 0.5 Baa
EBITA Margin (%) 5.0% 8.0% 15 0.8 BROA (%) 7.5% 11.9% 3 0.2 Aa
RCF/Debt (%) 17.5% 17.0% 12 2.1 Ba
Debt/EBITDA 17.5% 3.0x 6 1.1 A
EBITA/Interest 17.5% 3.9x 9 1.6 Baa
Financial Policy 10.0% Financial Policy (1) 10.0% 3 9 0.9 Baa
Total 100.0% Overall Rating 100.0% 9.2 Baa
(1) Reflects a numerical score from 0 (Aaa) to 8 (Ca) based o n Moody's Rating Criteria
(2) Debt in cludes 8x rent expense, EBITDA includes adjustment to add-back lease expense
Scale & Diversity 25.0%
Profitability 12.5%
Leverage & Cov erag e 52.5%
Equivalent
S&P Rating:
BBB-
Aggregate Weighted Rating Scale
Rating Aaa Aa A Baa Ba B Caa Ca
Score 0 - 1.5 1.5 - 4.5 4.5 - 7.5 7.5 - 10.5 10.5 - 13.5 13.5 - 16.5 16.5 - 19.5 19.5+
Baa1 Baa2 Baa3
7.5 - 8.5 8.5 - 9.5 9.5 - 10.5
Assumes $90 million
EBITDA improvement
vs. consensus
SRG Spinoff – dividend impact
With or without cost savings, Darden should be able to maintain its current dividend payments
following an SRG spinoff.
Although a spinoff of SRG modestly reduces the amount of cash flow available to pay dividends at the operating
company, the magnitude is not significant enough to offset the cash flow benefits of a REIT spinoff.
Illustrative Dividend Payments$2.50

8/11/2019 Starboard Value Transforming Darden
http://slidepdf.com/reader/full/starboard-value-transforming-darden 284/294
284
Our plan would protect and strengthen Darden’s dividend
If Darden can realize the $90 million in savings assumed on the previous page, the OpCo’s payout ratio would fall tounder 60%.
With full achievement of the targeted cost savings, the OpCo’s payout ratio would be well below 50%, positioning
Darden for substantial dividend increases.
$1.68
$0.52
$2.20
$0.00
$0.50
$1.00
$1.50
$2.00
OpCo REIT Total
Cash Flow Payout Ratio
OpCo REIT SRG Total
No EBITDA Improvement 72% 85% 0% 71%
$90 million EBITDA Improvement 58% 85% 0% 60%
Full $326 million Improvement 38% 85% 0% 43%
Compares to
78% today

8/11/2019 Starboard Value Transforming Darden
http://slidepdf.com/reader/full/starboard-value-transforming-darden 285/294
285
XII. Conclusion
We believe Darden is extremely undervalued.
We invested in Darden because of the substantial opportunity to
unlock value with the right plan and right leadership
Our prioritiesWhy Darden is compelling
Infusing a major upgrade in the leadership at Darden.
– Substantially improve the Board of Directors. – Appoint a transformational leader as CEO.
Great brands.
Valuable assets. Tremendous opportunity to improve operating
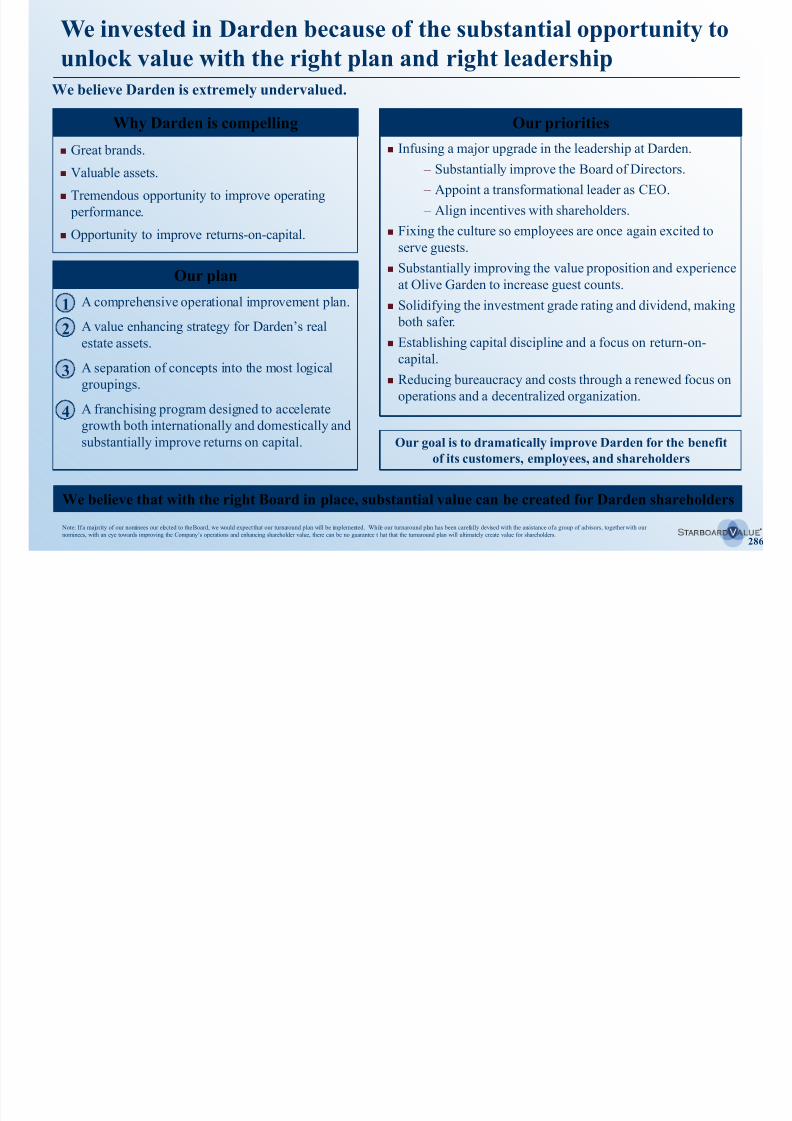
8/11/2019 Starboard Value Transforming Darden
http://slidepdf.com/reader/full/starboard-value-transforming-darden 286/294
286
We believe that with the right Board in place, substantial value can be created for Darden shareholders
Our goal is to dramatically improve Darden for the benefit
of its customers, employees, and shareholders
Our plan
– Align incentives with shareholders.
Fixing the culture so employees are once again excited to
serve guests.
Substantially improving the value proposition and experience
at Olive Garden to increase guest counts.
Solidifying the investment grade rating and dividend, making both safer.
Establishing capital discipline and a focus on return-on-
capital.
Reducing bureaucracy and costs through a renewed focus on
operations and a decentralized organization.
1. A comprehensive operational improvement plan.
2. A value enhancing strategy for Darden’s real
estate assets.
3. A separation of concepts into the most logical
groupings.
4. A franchising program designed to accelerate
growth both internationally and domestically and
substantially improve returns on capital.
Tremendous opportunity to improve operating
performance.
Opportunity to improve returns-on-capital.
1
2
3
4
Note: If a majority of our nominees our elected to the Board, we would expect that our turnaround plan will be implemented. While our turnaround plan has been carefully devised with the assistance of a group of advisors, together with our
nominees, with an eye towards improving the Company’s operations and enhancing shareholder value, there can be no guarantee t hat that the turnaround plan will ultimately create value for shareholders.
We believe our nominees have the right mix of skill sets to leadDarden to future success
Betsy Atkins
Corporate governance and consumer digital
marketing expert
Brad Blum
Former CEO and Restaurant Operator of the
Year, transformed Olive Garden into an industry
leading brand

8/11/2019 Starboard Value Transforming Darden
http://slidepdf.com/reader/full/starboard-value-transforming-darden 287/294
287
Shan Atkins
Veteran retail executive with highly successful
public company compensation and CEO search
committee experience
Jean Birch
Proven restaurant operator and franchising
expert
Peter Feld
Shareholder representative with track record of
exceptional value creation, board leadership, and
CEO search committee experience
Jim Fogarty
Consumer and retail turnaround leader, with a
focus on organizational restructuring and supply
chain optimization
Note: Does not include all affiliations.
We believe our nominees have the right mix of skill sets to leadDarden to future success (cont’d) Cindie Jamison
Experienced turnaround CFO with highly
successful compensation, audit, and CEO search
experience
Jeff Smith
Shareholder representative with track record of
exceptional value creation, board leadership, and
CEO search committee experience
8/11/2019 Starboard Value Transforming Darden
http://slidepdf.com/reader/full/starboard-value-transforming-darden 288/294
288
Bill Lenehan
Real estate expert, highly successful public REIT
CEO, board member, and investor
Lionel Nowell
Financial expert, decorated board and audit
committee leader, and experienced food and
beverage executive
Chuck Sonsteby
Casual dining transformation leader, recognized
as One of America’s Best CFOs
Alan Stillman
Visionary founder and CEO of multiple iconic
restaurant concepts
Note: Does not include all affiliations.
Protect and enhance your investment by voting on the
WHITE proxy card today
New leadership is needed to dramatically improve
Darden
Our goal is to

8/11/2019 Starboard Value Transforming Darden
http://slidepdf.com/reader/full/starboard-value-transforming-darden 289/294
289
Help Darden take the first steps in its long overdue
transformation
Your vote is critical
Vote on Starboard’s WHITE proxy card today
Our goal is to
dramatically improve
Darden for the benefit of
its customers, employees,
and shareholders
Vote for change
Vote to allow us to significantly improve Darden for the benefitof shareholders
Vote on Starboard's WHITE proxy card today

8/11/2019 Starboard Value Transforming Darden
http://slidepdf.com/reader/full/starboard-value-transforming-darden 290/294
290
Appendix: Analyst and investor sentiment
The investment community expressed serious concerns after the
announcement of the Red Lobster Separation…
“We find it odd management believes value can be created by
separating the business into two mature companies.”
- KeyBanc, December 20, 2013
“On the day Darden’s strategic plan was announced, the stock closed
down 4% to $51. This didn’t exactly strike us as a vote of confidence
“…But we continue to believe [management’s] plan doesn'taddress RL problems for investors. As we highlighted in our
initiation, a RL spin doesn't address the core issue: combined profits
and cash flows are deteriorating, and shareholders retain full
exposure. It is still unclear how a spin actually improves core guest
targeting capabilities/chances for a sales recovery or why multipleexpansion would occur. We believe the most favorable outcome for
i d h l i l f RL b h f h
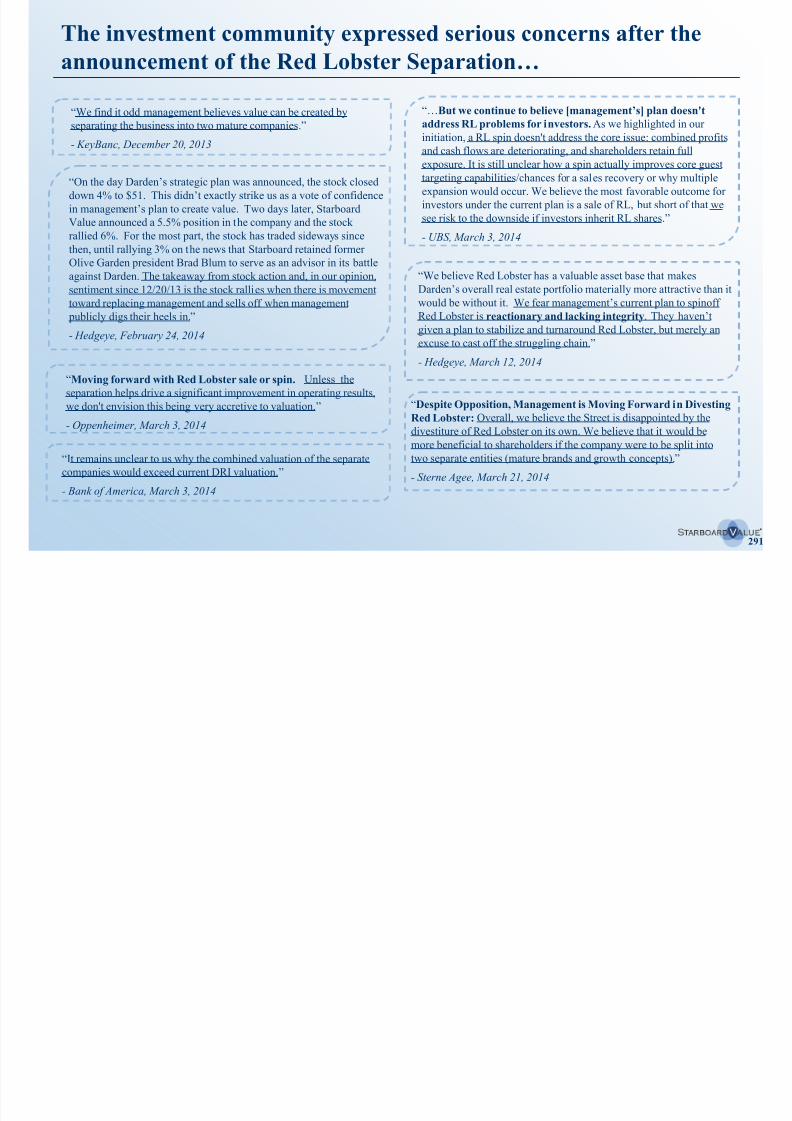
8/11/2019 Starboard Value Transforming Darden
http://slidepdf.com/reader/full/starboard-value-transforming-darden 291/294
291
“We believe Red Lobster has a valuable asset base that makes
Darden’s overall real estate portfolio materially more attractive than it
would be without it. We fear management’s current plan to spinoffRed Lobster is reactionary and lacking integrity. They haven’t
given a plan to stabilize and turnaround Red Lobster, but merely an
excuse to cast off the struggling chain.”
- Hedgeye, March 12, 2014
“Moving forward with Red Lobster sale or spin. Unless the
separation helps drive a significant improvement in operating results,
we don't envision this being very accretive to valuation.”
- Oppenheimer, March 3, 2014
y
in management’s plan to create value. Two days later, Starboard
Value announced a 5.5% position in the company and the stock
rallied 6%. For the most part, the stock has traded sideways since
then, until rallying 3% on the news that Starboard retained former
Olive Garden president Brad Blum to serve as an advisor in its battle
against Darden. The takeaway from stock action and, in our opinion,
sentiment since 12/20/13 is the stock rallies when there is movement
toward replacing management and sells off when management publicly digs their heels in.”
- Hedgeye, February 24, 2014
“It remains unclear to us why the combined valuation of the separate
companies would exceed current DRI valuation.”
- Bank of America, March 3, 2014
investors under the current plan is a sale of RL, but short of that we
see risk to the downside if investors inherit RL shares.”
- UBS, March 3, 2014
“Despite Opposition, Management is Moving Forward in Divesting
Red Lobster: Overall, we believe the Street is disappointed by the
divestiture of Red Lobster on its own. We believe that it would bemore beneficial to shareholders if the company were to be split into
two separate entities (mature brands and growth concepts).”
- Sterne Agee, March 21, 2014
…And strong negative reactions following the announcement ofthe sale to Golden Gate…
“We view nearl y all aspects of the Red Lobster transaction as not
particularly compelli ng. Seemingly in an effort to get a deal done, cash
efficiency may have suffered: 1) Tax leakage ($2.1B sales price, $1.6B net
proceeds), particularly on the real estate sale, is quite high and we were
disappointed with a lack of details for alternative, more tax-efficient options.
2) A trough multiple of what we estimate as ~5x EBITDA (companies with
the lowest EBITDA multiples within the restaurant universe are trading at 7-8x) on, hopefully, trough rent-adjusted Red Lobster EBITDA seems
despondent Further breakage costs associated with the intended debt
“Today, Darden announced that it has entered into a definitive
agreement to sell its Red Lobster business and related assets to
Golden Gate Capital for $2.1 billion in cash. Destroyi ng a businessand giving it away for f ree is a famil iar practice for CEO Clarence
“Who Knew Lobsters Had Middle Fingers?”
– Janney Capital Markets, May 16, 2014
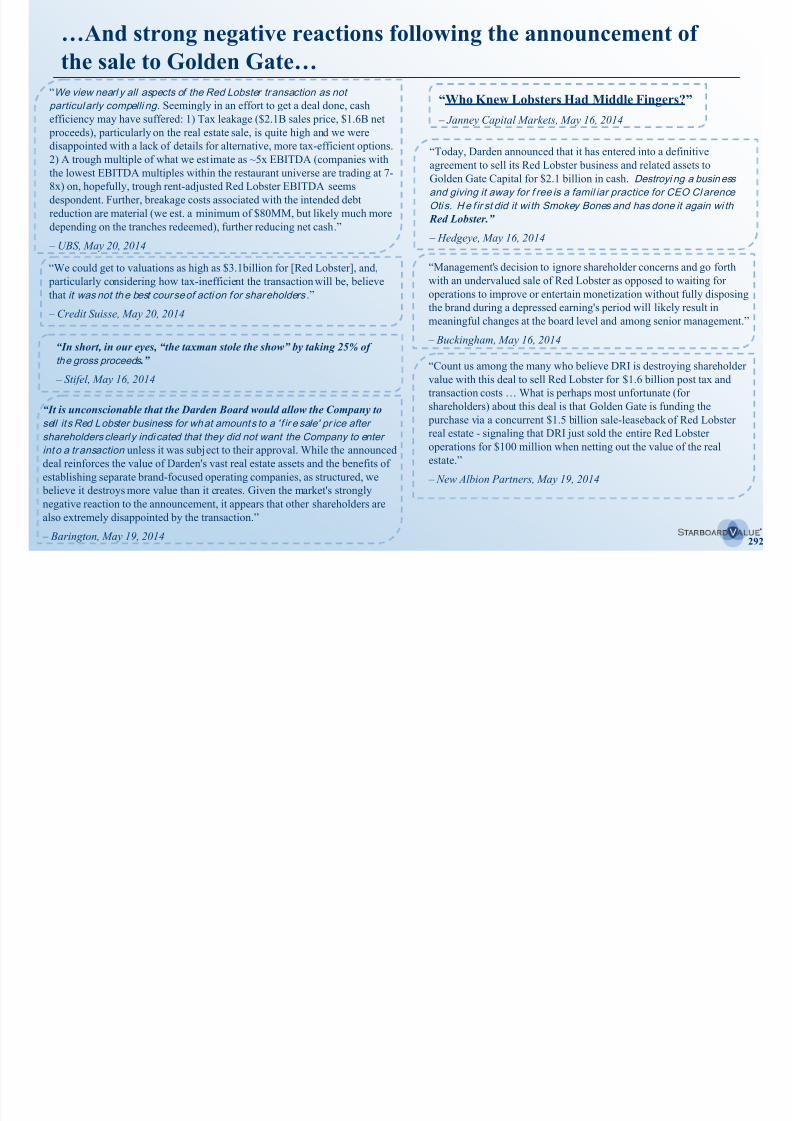
8/11/2019 Starboard Value Transforming Darden
http://slidepdf.com/reader/full/starboard-value-transforming-darden 292/294
292
despondent. Further, breakage costs associated with the intended debt
reduction are material (we est. a minimum of $80MM, but likely much more
depending on the tranches redeemed), further reducing net cash.”
– UBS, May 20, 2014
“We could get to valuations as high as $3.1billion for [Red Lobster], and,
particularly considering how tax-inefficient the transaction will be, believe
that it was not the best course of acti on for shareholders .”
– Credit Suisse, May 20, 2014
“In short, in our eyes, “the taxman stole the show” by taking 25% of
the gross proceeds .”
– Stifel, May 16, 2014
“It is unconscionable that the Darden Board would allow the Company to
sell its Red Lobster business for what amounts to a ' f ir e sale' pr ice after
shareholders clearly indi cated that they did not want the Company to enterinto a transaction unless it was subject to their approval. While the announced
deal reinforces the value of Darden's vast real estate assets and the benefits of
establishing separate brand-focused operating companies, as structured, we
believe it destroys more value than it creates. Given the market's strongly
negative reaction to the announcement, it appears that other shareholders are
also extremely disappointed by the transaction.”
– Barington, May 19, 2014
Otis. He f ir st did it wi th Smokey Bones and has done it again wi th
Red Lobster.”
– Hedgeye, May 16, 2014
“Management's decision to ignore shareholder concerns and go forth
with an undervalued sale of Red Lobster as opposed to waiting for
operations to improve or entertain monetization without fully disposing
the brand during a depressed earning's period will likely result inmeaningful changes at the board level and among senior management.”
– Buckingham, May 16, 2014
“Count us among the many who believe DRI is destroying shareholder
value with this deal to sell Red Lobster for $1.6 billion post tax and
transaction costs … What is perhaps most unfortunate (for
shareholders) about this deal is that Golden Gate is funding the
purchase via a concurrent $1.5 billion sale-leaseback of Red Lobster
real estate - signaling that DRI just sold the entire Red Lobsteroperations for $100 million when netting out the value of the real
estate.”
– New Albion Partners, May 19, 2014
…And is now highly concerned with Darden’s plan and itsproposed slate, while anticipating a new direction
“It’s come down to which group of independent directors shareholders want
to oversee the company: Darden’s or Starboard’s? We believe Starboard’s
slate is better qual if ied.
…Looking at Darden’s slate, you have long -tenured Darden directors who
voted for the sale of Red Lobster, someone who ran a thi rd- tier regionalbrand ( O’Charley’s ) into the ground the same way Oti s destr oyed Dar den
and someone running a drive thru burger joint (Checkers) who previously
“We are lowering our rating on DRI shares from Neutral to
Underperform and cutting our price objective from $55 to $40. Olive
Garden (OG) has undertaken a brand relaunch to drive sales but we
have concerns that the efforts are failing to gain significant
traction.
…Darden recently issued FY’15 quarterly EPS guidance thatmaintained its full year outlook but significantly toned down 1Q (Aug.)
EPS guidance below prior street expectations The implication of a
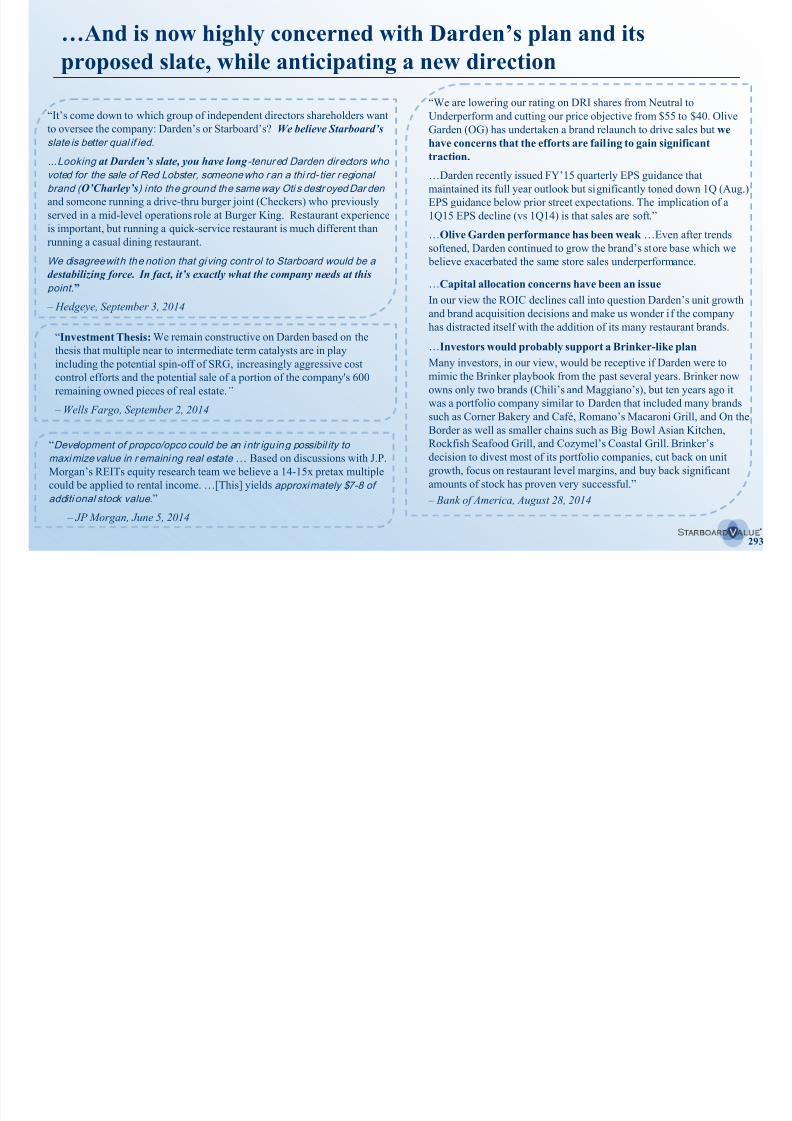
8/11/2019 Starboard Value Transforming Darden
http://slidepdf.com/reader/full/starboard-value-transforming-darden 293/294
293
and someone running a drive-thru burger joint (Checkers) who previously
served in a mid-level operations role at Burger King. Restaurant experience
is important, but running a quick-service restaurant is much different than
running a casual dining restaurant.
We disagree with the notion that giving contr ol to Starboard would be a
destabilizing force. In fact, it’s exactly what the company needs at this
point.”
– Hedgeye, September 3, 2014
“Investment Thesis: We remain constructive on Darden based on the
thesis that multiple near to intermediate term catalysts are in play
including the potential spin-off of SRG, increasingly aggressive cost
control efforts and the potential sale of a portion of the company's 600
remaining owned pieces of real estate.”
– Wells Fargo, September 2, 2014
“Development of propco/opco could be an intr igu ing possibil ity to
maximize value in r emaining real estate … Based on discussions with J.P.
Morgan’s REITs equity research team we believe a 14-15x pretax multiple
could be applied to rental income. …[This] yields approximately $7-8 of
additi onal stock value .”
– JP Morgan, June 5, 2014
EPS guidance below prior street expectations. The implication of a
1Q15 EPS decline (vs 1Q14) is that sales are soft.”
…Olive Garden performance has been weak …Even after trends
softened, Darden continued to grow the brand’s store base which we
believe exacerbated the same store sales underperformance.
…Capital allocation concerns have been an issue
In our view the ROIC declines call into question Darden’s unit growthand brand acquisition decisions and make us wonder if the company
has distracted itself with the addition of its many restaurant brands.
…Investors would probably support a Brinker-like plan
Many investors, in our view, would be receptive if Darden were to
mimic the Brinker playbook from the past several years. Brinker now
owns only two brands (Chili’s and Maggiano’s), but ten years ago it
was a portfolio company similar to Darden that included many brands
such as Corner Bakery and Café, Romano’s Macaroni Grill, and On the
Border as well as smaller chains such as Big Bowl Asian Kitchen,Rockfish Seafood Grill, and Cozymel’s Coastal Grill. Brinker’s
decision to divest most of its portfolio companies, cut back on unit
growth, focus on restaurant level margins, and buy back significant
amounts of stock has proven very successful.”
– Bank of America, August 28, 2014
THIS PRESENTATION IS FOR DISCUSSION AND GENERAL INFORMATIONAL PURPOSES ONLY. IT DOES NOT HAVE REGARD TO THE SPECIFIC
INVESTMENT OBJECTIVE, FINANCIAL SITUATION, SUITABILITY, OR THE PARTICULAR NEED OF ANY SPECIFIC PERSON WHO MAY RECEIVE THIS
PRESENTATION, AND SHOULD NOT BE TAKEN AS ADVICE ON THE MERITS OF ANY INVESTMENT DECISION. THE VIEWS EXPRESSED HEREIN
REPRESENT THE OPINIONS OF STARBOARD VALUE LP (“STARBOARD VALUE”), AND ARE BASED ON PUBLICLY AVAILABLE INFORMATION WITH
RESPECT TO DARDEN RESTAURANTS, INC. (THE “ISSUER”). CERTAIN FINANCIAL INFORMATION AND DATA USED HEREIN HAVE BEEN DERIVED
OR OBTAINED FROM PUBLIC FILINGS, INCLUDING FILINGS MADE BY THE ISSUER WITH THE SECURITIES AND EXCHANGE COMMISSION (“SEC”),
AND OTHER SOURCES.
STARBOARD VALUE HAS NOT SOUGHT OR OBTAINED CONSENT FROM ANY THIRD PARTY, OTHER THAN ITS NOMINEES AND ADVISORS, TO USEANY STATEMENTS OR INFORMATION INDICATED HEREIN AS HAVING BEEN OBTAINED OR DERIVED FROM STATEMENTS MADE OR PUBLISHED
BY THIRD PARTIES ANY SUCH STATEMENTS OR INFORMATION SHOULD NOT BE VIEWED AS INDICATING THE SUPPORT OF SUCH THIRD PARTY
8/11/2019 Starboard Value Transforming Darden
http://slidepdf.com/reader/full/starboard-value-transforming-darden 294/294
BY THIRD PARTIES. ANY SUCH STATEMENTS OR INFORMATION SHOULD NOT BE VIEWED AS INDICATING THE SUPPORT OF SUCH THIRD PARTY
FOR THE VIEWS EXPRESSED HEREIN. NO WARRANTY IS MADE THAT DATA OR INFORMATION, WHETHER DERIVED OR OBTAINED FROM FILINGS
MADE WITH THE SEC OR FROM ANY THIRD PARTY, ARE ACCURATE.
EXCEPT FOR THE HISTORICAL INFORMATION CONTAINED HEREIN, THE MATTERS ADDRESSED IN THIS PRESENTATION ARE FORWARD-LOOKING
STATEMENTS THAT INVOLVE CERTAIN RISKS AND UNCERTAINTIES. YOU SHOULD BE AWARE THAT ACTUAL RESULTS MAY DIFFER
MATERIALLY FROM THOSE CONTAINED IN THE FORWARD-LOOKING STATEMENTS.
WHILE WE EXPECT THAT OUR TURNAROUND PLAN WILL BE IMPLEMENTED, IF A MAJORITY OF OUR NOMINEES ARE ELECTED, DEPENDING ON
THE CIRCUMSTANCES EXISTING AT THE TIME OF THE NOMINEES’ ELECTION, THERE CAN BE NO GUARANTEE THAT THE TURNAROUND PLAN
WILL BE ULTIMATELY IMPLEMENTED. THERE CAN ALSO BE NO GUARANTEE THAT EVEN IF IMPLEMENTED, THAT THE TURNAROUND PLANWILL ULTIMATELY CREATE VALUE FOR SHAREHOLDERS. HOWEVER, THE VALUE ENHANCING INITIATIVES UNDER THE TURNAROUND PLAN
HAVE BEEN CAREFULLY DEVISED WITH THE ASSISTANCE OF A GROUP OF ADVISORS, TOGETHER WITH OUR NOMINEES, WITH AN EYE TOWARDS
IMPROVING THE COMPANY’S OPERATIONS AND ENHANCING SHAREHOLDER VALUE.


