ORIGINAL ARTICLE
Standardization of peeling tests for assessing the cohesionand consolidation characteristics of historic stone surfaces
Milos Drdacky • Jaroslav Lesak • Silvia Rescic •
Zuzana Slızkova • Piero Tiano • Jaroslav Valach
Received: 3 October 2010 / Accepted: 29 August 2011 / Published online: 9 September 2011
� The Author(s) 2011. This article is published with open access at Springerlink.com
Abstract A peeling test known as the ‘‘Scotch Tape
test’’ has been used for more than 40 years in
conservation practice for assessing the consolidation
efficiency of degraded stone. However, the method has
not been supported by any standard or reliably verified
recommendations for its application. Its applicability is
overestimated, and its unrestricted use without adequate
knowledge and sufficient understanding can lead to
non-comparable, non-reproducible and, in many cases,
incorrect and severely biased results and assessments.
This paper presents the results of a recent study focused
on establishing limits for application, reliable proce-
dures and a ‘‘standard’’ protocol for testing the cohesion
characteristics of brittle and quasi-brittle materials,
mainly mortars and stones. The main application
strategy exploits repeated peeling in the same place
on a surface in order to eliminate the effect of the
natural decrease in the detached material from the
subsurface layers, which might be incorrectly inter-
preted as a consolidation effect. There is a discussion of
factors influencing the performance of the peeling test
method, and examples of peeling measurements on
various natural and artificial stones are presented.
Keywords Peeling test � Historic stone � Surface
consolidation � Cohesion � Non-destructive testing
1 Introduction and objectives
In situ testing of the surface cohesion of brittle and
quasi-brittle heterogeneous materials suffers from a
lack of suitable non-destructive methods. The problem
is mainly important when assessing surface degrada-
tion characteristics and/or when evaluating the effec-
tiveness of consolidation treatment of degraded
historic materials.
M. Drdacky (&) � J. Lesak � Z. Slızkova � J. Valach
Institute of Theoretical and Applied Mechanics
of the Academy of Sciences of the Czech Republic,
Prosecka 76, 19000 Praha 9, Czech Republic
e-mail: [email protected]
URL: www.itam.cas.cz
J. Lesak
e-mail: [email protected]
URL: www.itam.cas.cz
Z. Slızkova
e-mail: [email protected]
URL: www.itam.cas.cz
J. Valach
e-mail: [email protected]
URL: www.itam.cas.cz
S. Rescic � P. Tiano
CNR, Institute for the Conservation and Valorization of
Cultural Heritage (ICVBC), Via Madonna del Piano 10,
5019 Sesto Fiorentino, Florence, Italy
e-mail: [email protected]
URL: http://www.icvbc.cnr.it
P. Tiano
e-mail: [email protected]
URL: http://www.icvbc.cnr.it
Materials and Structures (2012) 45:505–520
DOI 10.1617/s11527-011-9778-x

One of the methods recommended for this purpose
is the so-called Scotch Tape test or peeling test. The
Scotch Tape test method was originally suggested and
used for testing the adhesion of a coating or paint layer
to a substrate, and it is defined as a method for
evaluating the adhesion of a coating to a substrate.
Pressure-sensitive tape is applied to an area of the
coating which is sometimes cross-hatched with
scratched lines.1 Adhesion is considered to be ade-
quate if the coating is not pulled off by the tape when it
is removed2 [1].
The method was probably introduced into the field
of conservation for testing the cohesion qualities of
historic materials, mainly stone and renders, by Mora
and Torraca in the 1960s [2]. However, no standards or
reliably verified recommendations are available for
this type of application in conservation practice.
Unrestricted use without adequate knowledge and
sufficient understanding can lead to non-comparable
and non-reproducible as well as in many cases
incorrect and severely biased results and assessments.
A study of the basic performance characteristics
and features of application of the so-called peeling test
method on quasi brittle composites was therefore
carried out within the research programme of the
STONECORE project.3 It aimed at establishing limits
for application, reliable procedures and a ‘‘standard’’
protocol for testing the cohesion characteristics of
brittle and quasi-brittle materials, mainly mortars and
stones. This paper presents an introduction to the
peeling test procedures, and proposes recommenda-
tions for performing peeling tests on historic stone
surfaces and for evaluating the results that are
obtained.
2 State of art review
There are few systematic literature references on the
application of peeling tests in conservation. In most of
the works, only a general or superficial description of
the measurement procedure has been found, and a
detailed description of the peeling test application is
mostly missing, e.g. in [3].
In general, the cohesion of a surface layer is
roughly assessed by measuring the amount of mate-
rial stuck to a flexible adhesive tape which was
attached to the surface and then removed. Because
Scotch Tape is most frequently used, the method is
also known as the Scotch Tape test, or as the Tape
Test.4
Dei and Baglioni with their collaborators used the
method for testing the consolidation effect on a
calcareous stone called Pietra di Nanto [4]. They used
3 M transparent Scotch Tape cut into pieces not less
than 2 cm in length and with a contact surface area of
about 4 cm2. The weight of the piece of Scotch Tape
was calculated as an average of 10 pieces. During the
tests, the cut piece was pressed to the test surface, and
after 3 min it was peeled off using steel pincers.
Peeling should be done with a rapid and constant
action. Tiano et al. recommended and used strips
about 10 mm 9 30 mm in area for stone testing
(3 cm2) [5].
However, the literature results indicated that the
results are very dependent on the quality of the
adhesive layer, the roughness of the tested surface,
the flexural stiffness of the tape, and to a minor extent
on the attaching pressure and the speed of detach-
ment [6].
There are also differences in the valuation of the
amount of peeled off material. Some authors use
weighing, while others rely on optical evaluation of
the tape area covered by the released material, e.g. the
standard ASTM 4214-97 ‘‘Standard Test Methods for
Evaluating the Degree of Chalking of Exterior Paint
Films’’.
Drdacky and Slızkova observed problems of appar-
ent consolidation effects caused by initial removal of
loosened particles on plasters, which does not corre-
spond to the real material cohesion characteristics [7].
They therefore applied a better defined protocol,
which is discussed in a later paper for plasters and
mortars [8].
Improved techniques used for testing other than
bulk materials, e.g. for testing the adhesion of thin
1 Comment: Scratching is not applied in the case of bulk
materials, e.g. mortars or stones that have no coating layer.2 Definition Copyright �1989 CRC Press LLC. All rights
reserved [1].3 SME-targeted Collaborative Research Project ‘‘Stone con-
servation for refurbishment of buildings’’, supported from grant
No. 213651 under the EC 7th Framework Programme, coor-
dinated by Dr. Gerald Ziegenbalg, IBZ Freiberg, Germany.
4 Comment: It should be mentioned that ‘Tape Test’ has a
well-defined meaning in medicine.
506 Materials and Structures (2012) 45:505–520

films to their substrate, have been suggested5 by other
researchers. The method is based on the Scotch Tape
test, and improves it in such a way as to obtain a
quantitative result. For this, a test strip was proposed
which contains several regions with adhesives of
different strengths. When performing the Scotch Tape
test with this test strip, the adhesive can be identified at
which adhesion fails and can then be correlated to the
adhesive strength. This approach is hardly applicable
for problems of mortar and stone assessment, of
course, mainly because the surface roughness is much
higher and much more irregular.
Unlike in the field of conservation, in surface
coating and in the paint and steel production industries
peeling tests have been standardized. For example, in
steel production a standardized automated system is
available under the trade name CoilScooter�. This
system measures the amount of residual dirt on a metal
surface. This standardized peeling test is used to check
the quality of surfaces, e.g. for steel plates. In the first
step, a piece of Scotch� Tape is affixed to the surface,
removed and placed on a clean, white sheet of paper.
In the second step, the amount of surface residual dirt
is evaluated by measuring the reflectivity (grey tone).
The dirt pulled off by the tape is an indicator of the
quality of the metal surface.
The CoilScooter� automates the sample taking
process and measures the reflectivity (grey tone)
directly on the production line. The CoilScooter�
standardises the Scotch� Tape test by automating the
sample taking and measurement process, and it gives
reproducible and rather reliable results for the quality
of metallic surfaces on the production line, irrespec-
tive of the operator. The measurement is based on the
reflectivity of the laminated test strip. For this, a
special grey-tone sensor was developed. The grey-
tone is determined inside the instrument by a green
light source and a photodiode.
In principle, this method could be used for
inspecting sufficiently smooth cultural heritage sur-
faces (very fine stone monuments and painted
surfaces).
The measurement is based on the ASTM Standard
D 3359-08 Standard Test Methods for Measuring
Adhesion by Tape Test (or some older variants). This
standard is referred to by Daniele et al. [9], who used
the tape test for checking the consolidation effect on
two types of natural stone—Estoril and Pietra Serena.
Unfortunately, they do not describe the testing proto-
col in detail, and it is difficult to assess the mode and
correctness of the application.
The ASTM D 3359-08 method covers procedures
for assessing the adhesion of coating films to metallic
substrates by applying and removing pressure-sensi-
tive tape over cuts made in the film. Naturally, it was
developed with metal as a substrate and its application
for other substrates has not been tested and validated.
However, some hints from the test procedure are worth
mentioning here.
25 mm wide semitransparent pressure-sensitive
tape with an adhesion strength agreed upon by the
supplier and the user is needed, (e.g. Permacell 99
tape). Because of the variability in adhesion strength
from batch to batch and with time, it is essential that
tape from the same batch be used when tests are to be
run in different laboratories. If this is not possible, the
test method should be used only for ranking a series of
test coatings.
The test should be carried out on an area free of
blemishes and minor surface imperfections. For tests
in the field, ensure that the surface is clean and dry.
Extremes of temperature and relative humidity may
affect the adhesion of the tape.
On each day of testing, before starting the tests,
remove two complete laps of the pressure-sensitive
tape from the roll and discard. Remove an additional
length at a steady (that is, not jerked) rate, and cut a
piece about 75 mm in length.
Place the tape on the surface and smooth it into
place with your finger, and then rub firmly with the
eraser on the end of a pencil. The colour under the
transparent tape is a useful indication of when good
contact has been made.
Within 90 ± 30 s of application, remove the tape
by seizing the free end and pulling it off rapidly back
upon itself (without jerking) at as close to an angle of
180� as possible.
Inspect the tested area.6 Repeat the test in two other
locations.
5 http://www.priorartdatabase.com/IPCOM/000152224/.
6 For film adhesion testing, the area is prepared by cross cutting
in order to create a grid from the sub-squares of which the film
can be pulled off.
Materials and Structures (2012) 45:505–520 507
In the commentary on this standard it is stated that
there is at the present time no test that can precisely
assess the actual physical strength of an adhesive
bond. Nevertheless, it is possible to obtain an indica-
tion of relative adhesion performance.
This standard requires that the free end of the tape
be removed rapidly at as close to an angle of 1808 as
possible. If the peel angle and the rate vary, the force
required to remove the tape can change dramatically.
Nearly linear increases were observed in peel force
approaching 100% as the peel angle was changed from
135� to 180�, and similar large differences in peel
force can be expected as the peel rate varies [6]. These
effects are related, as they reflect certain rheological
properties of the backing and the adhesive that are
molecular in origin.
In the field of cultural heritage, the above-men-
tioned ASTM Standard is replaced by ASTM Standard
D 4214-07 Standard Test Methods for Evaluating the
Degree of Chalking of Exterior Paint Films, which
has been applied and its use has been modified
accordingly [10].
This standard suggests four different methods, two
of which exploit tape testing. The Transparent Tape
Method uses 13-mm-wide pressure sensitive cellulose
adhesive tape and a 20 mm eraser wrapped in
cellophane tape.
The procedure starts with the application of a
50 mm long piece of 13 mm wide tape to the surface
that is being rated. Rub ten times with moderate
pressure using the covered eraser, in order to remove
all bubbles and prevent scratching. Remove the tape
from the surface and adhere it to the sheet by rubbing
with the eraser. Label the specimens using a black
china marker. All tapes from other measurements are
then cut using a razor to a unified size ready for
evaluation. Then the tapes with the peeled off particles
are evaluated by reflectance measurements, and the
results are rated from 0 to 10.
ASTM Standard D 4214-07 refers to a TNO type
method, which uses polyethylene transparent tape
13–25 mm in width in the following procedure. Apply
a piece of tape 63–100 mm in length to the surface
using uniform gentle finger pressure, remove the tape,
and lay it with the adhesive side on a piece of dull
black velvet (or black paper). Under diffused light,
compare the tape on the black velvet with Photo-
graphic Reference Standard No. 2 and determine the
most closely matching grade.
Although none of the reported standardized meth-
ods was developed for testing mortars and stones, their
background, knowledge and experience are exploited
in a further recommendation for a peeling test for
quasi-brittle materials.
The method can be used for making a relative
assessment of consolidation effects in individual
cases, if an exact methodology and procedure are
conserved (see the next paragraph). Examples of such
an application are found in the literature, e.g. [8],
where the surface consolidation effect was apparently
measured on a material with originally very poor
cohesion quality. Similarly, useful results on stones
were achieved with the peeling test on Carrara Marble
weathered samples treated with bio-reinforcing agents
inducing new calcite precipitation [5]. A clear rein-
forcement effect is observed when material removed
from treated and untreated weathered marble surfaces
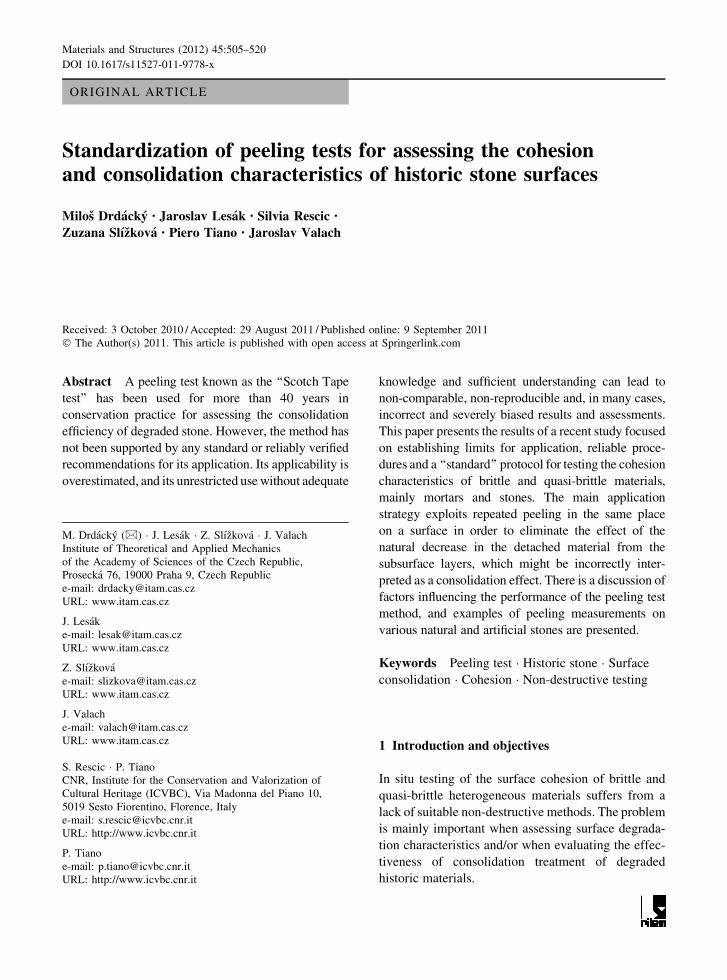
is compared (Fig. 1).
3 Factors influencing peeling test results
The quality of the adhesive layer applied to the tape
used for the peeling test is one of the most important
parameters influencing the amount of detached mate-
rial. Some theoretical considerations are widely dis-
cussed in a paper by Chiche et al. [6].
They review the fact that in peel tests the applied
force necessary for removing a homogeneous adhesive
tape from a homogeneous substrate is not constant,
0.0000
0.0050
0.0100
0.0150
0.0200
0.0250
0.0300
0.0350
0 1 2 3 4 5 6
Peel number
wei
gh
t o
f so
lid r
emo
ved
per
cm
2 o
f
sam
ple
(g
/cm
2)
non-weatheredmarble
weatheredmarble
Treatedweathered
Fig. 1 Results of peeling tests on weathered and consolidated
Carrara Marble [5]
508 Materials and Structures (2012) 45:505–520

and they support the standard approach of removing
the impact of force fluctuations in a conventional peel
test7 by statistical treatment of a quantity of measured
data. The same approach, i.e. statistical treatment of
results depending on the peeling force and also the
cohesion force fluctuations, is also useful in peeling
tests on mortars and stones. Thus it is recommended to
test the cohesion quality at several tested points over a
relatively small area.
The standard approach for the quality of the
adhesive layer conserves 90� peel angle experiments
with the removal force direction perpendicular to the
tested surface. It seems to retain this as a recom-
mended testing parameter. The angle of 1808 recom-
mended by some standards may generate higher
forces, and may therefore be more effective in
cohesion testing, but it is more difficult to keep to it
in some practical situations.
The rate effect on the peeling of adhesive tapes
from a substrate was also studied in [6]. Two tapes
with different adhesives were tested (translucent
Scotch 811 3M and transparent Scotch 600 3M).
Both exhibited an increase in the force as a function
of the peel rate within testing limits from 7 lm/s to
7 mm/s. In real cohesion tests on historic materials,
the authors used rates of about 10 mm/s, which seem
adequate for the forces that might be necessary for
detaching surface layers of degraded mortars or
stones.
However, current standard test methods no longer
identify a specific tape. Differences in the tapes that
are used can lead to different results, as small changes
in backing stiffness and adhesive rheology cause large
changes in the tension area.
The tape test is also operator sensitive. In the
standard design it was made as simple as possible to
perform, requiring a minimum of specialized equip-
ment and materials that must meet certain specifica-
tions. The accuracy and precision depend largely on
the ability of the operator to perform the test in a
consistent manner. Key steps that directly reflect the
importance of operator skill include the angle and the
rate of tape removal.
The flatness of the tested surface has a substantial
influence on the peeling force, due to variations in the
area to which a tape may adhere. This effect is
twofold. Firstly, a larger adhesion area causes a higher
probability of touching releasable particles of the
surface material. Secondly, the surface of sharp grains
protruding from the surface may be so small that the
peeling force is not sufficient to peel off individual
grains even from rather weak matrices. In some cases,
it is not possible to glue a tape to the surface at all.
Figure 6 shows such an example—a sandstone sur-
face. Then it is necessary to use tapes with a thick layer
of glue, which can better reach the ‘‘valleys’’ between
the individual grains. An application of this kind is
described in the next example.
4 Experimental studies
4.1 Meaning of peeling testing
Peeling testing is defined as a method for making a
quantified assessment of the adhesion of a surface or
near-to-surface layer to a substrate. Pressure-sensitive
tape is applied to the investigated area and the amount
of material detached from the surface after peeling the
tape off is measured.
In the conservation field it is assumed that this
amount corresponds to the cohesion characteristics of
the substrate. Therefore, the peeling test is used for
evaluating surface degradation or consolidation
effects after strengthening interventions.
4.2 Peeling performance tests on stone specimens
Various series of tests aimed at studying the basic
features of stone when peeling off the surface material
have been performed and evaluated at ITAM.
The main doubts about the Scotch Tape method lie
in the fact that the loosened particles on the tested
surface do not represent the cohesion characteristics of
the tested material. Therefore, if we repeat the peeling
in the same place we will observe a decrease in the
released material and thus we see an apparent
consolidation effect, which is, however, false. Obvi-
ously, we have the same problem when checking
consolidation treatment effects on degraded historic
materials or on deteriorated materials of any age.
Peeling performance was tested on beams 50 9
50 9 300 mm3 and on cubes 50 9 50 9 50 mm3 of
7 ASTM 1999 Standard test method for peel or stripping
strength of adhesive bonds, ASTM Standard 903-98.
Materials and Structures (2012) 45:505–520 509
different natural stones, and also on stones after
consolidation treatment.
During the tests, the peeling test is repeated several
times on the same surface area. In the case under
discussion here, it was repeated ten times.
Peeling was studied using AEROTAPE transparent
plastic tape 25 mm in width and slightly more than
50 mm in length, i.e. slightly more than the width of
the tested specimens. In the second series, an opaque
strip 50 mm in width and slightly more than 50 mm in
length was used. The tapes were stuck to the surface
and smoothed with gentle finger pressure, and were
then removed by pulling at an angle of 90�, and
weighed on a balance with sensitivity of 0.0001 g. The
peeled off material was determined as the difference
between the weight of the tape after removal from the
surface and the weight of the clean tape before
application.
Typical peeling test results for the individual stone
specimens are shown in Figs. 2 and 3. The first series
of tests was carried out on opuka stone beams, which
were in natural state (marked ‘‘o’’) or had been treated
with various consolidants: lime water (vv), ‘‘water
glass’’ K2SiO3 (vs) and ethyl silicate (i).
The results show clearly the influence of repeated
peeling on the same surface area, and indicates a source
of possible errors when the peeling test is performed
without a reasonably standardized procedure.
The second series of tests was performed on cubes
of different stones—a fresh opuka, and so-called
Maastricht stone. Whilst it was not possible to adhere
the narrow tape to the Maastricht stone, and it was
therefore not possible to test this material,8 the opuka
stone gave similar results as in the first case, Fig. 2,
here without a well pronounced asymptote character-
izing the properties of the natural material.
From the observations above, it follows that this
method is quite sensitive to the condition of the
surface. However, it does not provide easily interpret-
able data for reproducible measurements of the
material characteristics describing the state of the
material below the very near surface layer that is
decisive for effective cohesion of an investigated
substance.
Moreover, the change in the amounts of released
material from a surface that has been repeatedly
touched in any manner—by repeated peeling testing,
by applying a consolidation treatment, or by clean-
ing—can make the measurements of consolidation
effects non-objective, uncertain and not reproducible.
After repeated peeling, the amount of released
material starts to be almost constant, unfortunately for
most non-deteriorated building stones very close to the
sensitivity of the method or to the error of the
measurements (for opuka stone see Figs. 2 and 12).9
The surface quality of the stone plays an important
role in peeling testing. Typical macro-photographs of
the surface of the natural opuka stone are presented in
Fig. 4, and of opuka specimens treated with various
consolidation agents in Fig. 5.
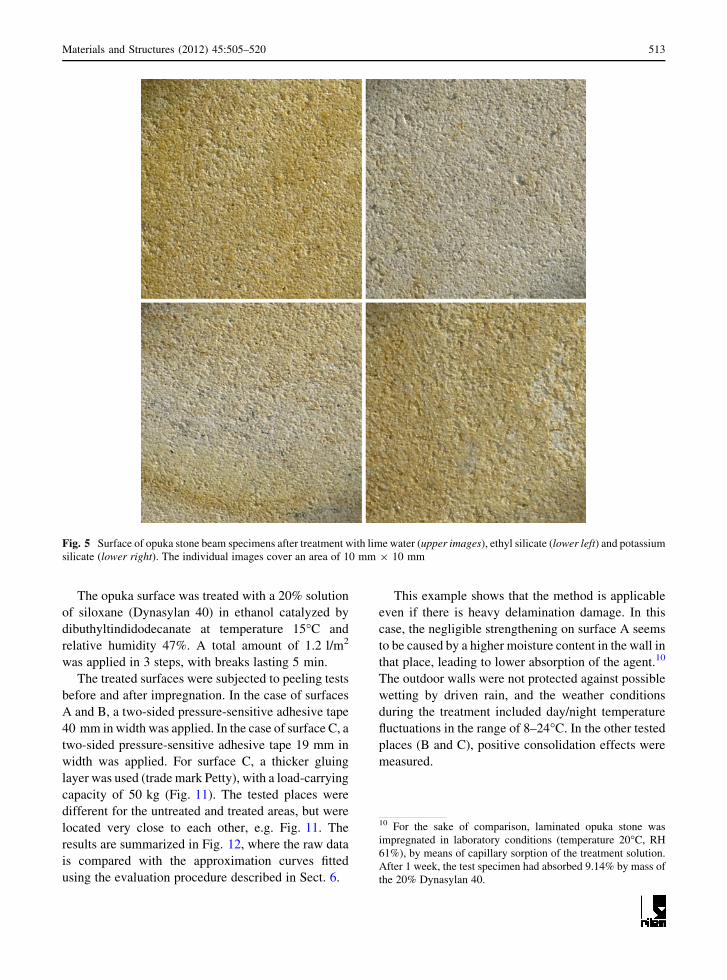
Both surfaces presented in Fig. 4 enable appropri-
ate adhesion of the testing tapes. However, the rough
surface of the beam specimen contained more coarse
grains that were not properly attached. This influ-
enced the measured released mass, (see Fig. 2) at the
same final quality of the characteristic value after ten
steps.
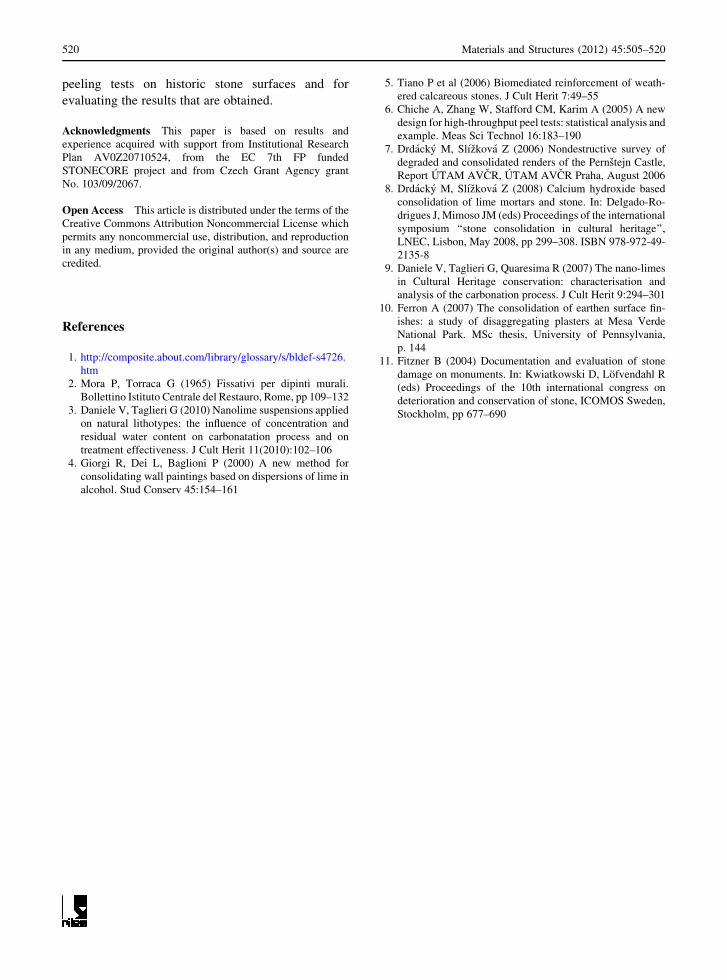
Figure 5 illustrates the physical state of consoli-
dated opuka stone surfaces relevant to the measured
released mass values reported in Fig. 2. The presented
surface variations do not significantly influence the
results of the peeling tests. However, a very uneven
surface with sharp peaks and deep valleys, e.g. see
Fig. 6, may require very flexible tape with a thick layer
of glue for successful measurements, as discussed in
Sect. 3.
4.3 Peeling performance tests on artificial stone
Another series of tests was carried out at ICVBC
(Florence) on artificial stone modeled by means of a
cementitious mortar.
Specimens imitating stone samples made of cemen-
titious mortars 5 9 5 9 3 cm3 in dimensions were
utilized. This material was cured for a long time before
the experiments, and the surface was completely
carbonated and hydrated. The main mineralogical
constituents detected through X-ray diffraction anal-
ysis were: quartz, feldspars, calcium silicates, calcium
silicate hydrates and calcium silicate aluminate
hydrates. The petro-physical characteristics, real and
bulk density and total open porosity, determined
8 The Maastricht stone had to be tested using the 50 mm wide
tape mentioned above, which gave measurable results.
9 The authors further tested limestone varieties, various sand-
stone types, marble and granite.
510 Materials and Structures (2012) 45:505–520
through helium and mercury pycnometers were
2.64 g/cm3 (±0.01), 1.82 g/cm3 (±0.03) and 31%
(±1), respectively. The inert grain size dimension was
between 0.06 and 6.40 mm.
The specimens were consolidated with nano-silica,
traded as Syton X 30 (Kremer) in an aqueous solution
(0.300 g/l of solid particles).
The product was applied with a brush in such a way
that the same amounts of solid particles in the solution
were introduced. The treatments carried out and the
amounts of product applied are reported in Table 1.
Macro-photos of the treated and non-treated sam-
ples are shown in Fig. 7. The specimen treated with
Syton X 30 shows slight darkening of the surface
with a polish effect compared with the untreated
specimen.
The peeling test was materialized using a commer-
cial bi-adhesive tape (TESA, binding capacity 1 kg/
10 cm). Strips 6 cm in length were cut and weighed on
a Gibertini balance (±0.001 g precision), and then one
strip was put on the surface of the specimen and softly
pressed. With the help of tweezers, the strip was
removed (90�) with a rapid and constant action and
again weighed. The difference in the weight of the
strips corresponds to the amount of superficial mate-
rial removed. For each specimen, two strips were
applied (Fig. 8). The procedure was repeated on the
same area of the specimen three times, using new
strips, in order to evaluate the cohesion of the surface
in the bulk.
Let us further discuss the results of the tests on the
artificial stone, as described above and in Table 2,
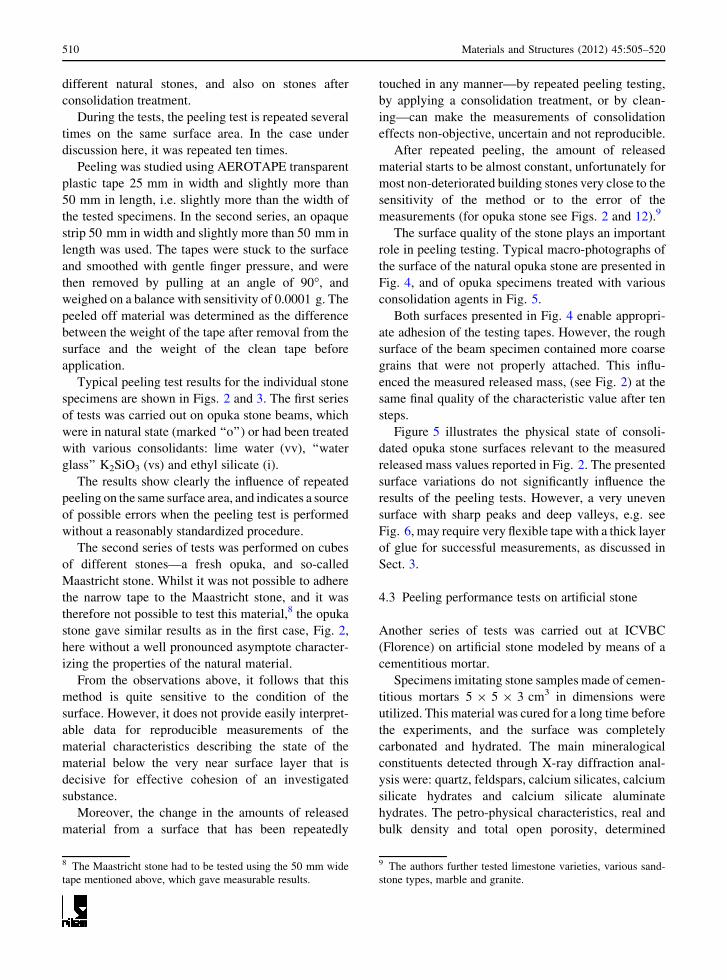
Fig. 2 Decrease in material released from the surfaces of
natural and consolidated opuka stone samples during sequences
of peeling tests carried out repeatedly on the same surface area.
There are reported data from two measurements and their
average approximation using the procedure described in Sect.
6.4 (Eq. 1)
Materials and Structures (2012) 45:505–520 511
where the data from the peeling test expressed as the
amounts of material removed for each single test
(single strip) are reported. Figure 9 displays some
samples after the peeling test with the respective
adhesive strips removed, for each surface.
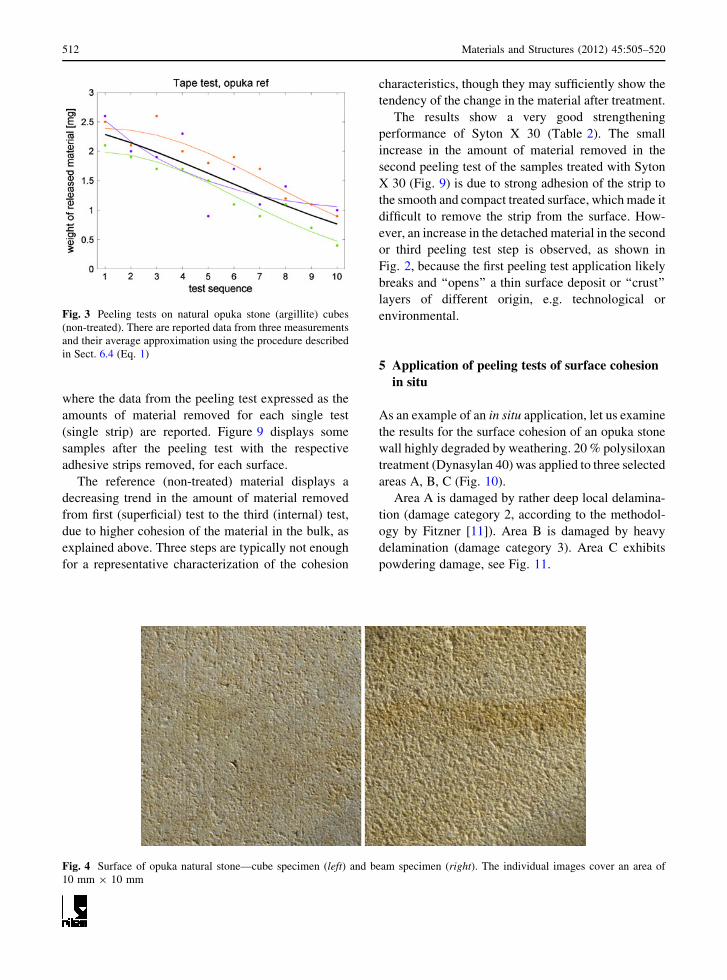
The reference (non-treated) material displays a
decreasing trend in the amount of material removed
from first (superficial) test to the third (internal) test,
due to higher cohesion of the material in the bulk, as
explained above. Three steps are typically not enough
for a representative characterization of the cohesion
characteristics, though they may sufficiently show the
tendency of the change in the material after treatment.
The results show a very good strengthening
performance of Syton X 30 (Table 2). The small
increase in the amount of material removed in the
second peeling test of the samples treated with Syton
X 30 (Fig. 9) is due to strong adhesion of the strip to
the smooth and compact treated surface, which made it
difficult to remove the strip from the surface. How-
ever, an increase in the detached material in the second
or third peeling test step is observed, as shown in
Fig. 2, because the first peeling test application likely
breaks and ‘‘opens’’ a thin surface deposit or ‘‘crust’’
layers of different origin, e.g. technological or
environmental.
5 Application of peeling tests of surface cohesion
in situ
As an example of an in situ application, let us examine
the results for the surface cohesion of an opuka stone
wall highly degraded by weathering. 20 % polysiloxan
treatment (Dynasylan 40) was applied to three selected
areas A, B, C (Fig. 10).
Area A is damaged by rather deep local delamina-
tion (damage category 2, according to the methodol-
ogy by Fitzner [11]). Area B is damaged by heavy
delamination (damage category 3). Area C exhibits
powdering damage, see Fig. 11.
Fig. 3 Peeling tests on natural opuka stone (argillite) cubes
(non-treated). There are reported data from three measurements
and their average approximation using the procedure described
in Sect. 6.4 (Eq. 1)
Fig. 4 Surface of opuka natural stone—cube specimen (left) and beam specimen (right). The individual images cover an area of
10 mm 9 10 mm
512 Materials and Structures (2012) 45:505–520
The opuka surface was treated with a 20% solution
of siloxane (Dynasylan 40) in ethanol catalyzed by
dibuthyltindidodecanate at temperature 15�C and
relative humidity 47%. A total amount of 1.2 l/m2
was applied in 3 steps, with breaks lasting 5 min.
The treated surfaces were subjected to peeling tests
before and after impregnation. In the case of surfaces
A and B, a two-sided pressure-sensitive adhesive tape
40 mm in width was applied. In the case of surface C, a
two-sided pressure-sensitive adhesive tape 19 mm in
width was applied. For surface C, a thicker gluing
layer was used (trade mark Petty), with a load-carrying
capacity of 50 kg (Fig. 11). The tested places were
different for the untreated and treated areas, but were
located very close to each other, e.g. Fig. 11. The
results are summarized in Fig. 12, where the raw data
is compared with the approximation curves fitted
using the evaluation procedure described in Sect. 6.
This example shows that the method is applicable
even if there is heavy delamination damage. In this
case, the negligible strengthening on surface A seems
to be caused by a higher moisture content in the wall in
that place, leading to lower absorption of the agent.10
The outdoor walls were not protected against possible
wetting by driven rain, and the weather conditions
during the treatment included day/night temperature
fluctuations in the range of 8–24�C. In the other tested
places (B and C), positive consolidation effects were
measured.
10 For the sake of comparison, laminated opuka stone was
impregnated in laboratory conditions (temperature 20�C, RH
61%), by means of capillary sorption of the treatment solution.
After 1 week, the test specimen had absorbed 9.14% by mass of
the 20% Dynasylan 40.
Fig. 5 Surface of opuka stone beam specimens after treatment with lime water (upper images), ethyl silicate (lower left) and potassium
silicate (lower right). The individual images cover an area of 10 mm 9 10 mm
Materials and Structures (2012) 45:505–520 513

6 A recommendation for the application
of peeling testing of the surface cohesion
of stone and mortar
6.1 Introduction
The peeling test recommendation covers procedures
for assessing the surface cohesion characteristics of
mortars and stones by applying and removing pressure
sensitive tape over the investigated surface.
Two variants of sampling data during peeling
testing are proposed. Method A is primarily intended
for use on site, while method B is more suitable for use
in the laboratory, where method A is also easily
applicable.
The method uses techniques similar to those used
for standard methods ASTM D 4214-07 and ASTM D
3359-08, which are intended for other purposes than
stone or mortar testing.
6.2 Apparatus and material
Tape. For variant A, a double-coated (double-sided)
pressure-sensitive adhesive tape 40 mm in width is
needed, while for variant B a single layer pressure-
sensitive transparent or semi-transparent tape 25 mm
in width is used.
Square ruled paper.
Plastic sampling bag, with a closing pressure zip.
Laboratory balance with sensitivity 0.1 mg.
6.3 Test procedure
Tape preparation. For in situ testing (variant A), the
tape samplers are prepared from double-coated
pressure-sensitive tape 40 mm in width, as follows:
1. a piece of double-sided pressure-sensitive tape is
cut to a length corresponding to the width or
length of a square ruled piece of paper,
2. the tape is glued to the square ruled paper,
3. samplers are cut from the tape-paper sheet in
dimensions of 10 to 20 mm by 50 mm, in such a
way that at one end plain paper 10 mm in width
is free from the pressure sensitive tape, see
Fig. 13,
4. the sampler is marked, inserted into a plastic
sampling bag, and closed,
5. the bag with the sampler is weighed on a
laboratory balance with sensitivity 0.1 mg, and
the value is recorded in a prepared protocol table,
Fig. 6 Surface of sandstone not suitable for the tape test
(10 mm 9 10 mm in area)
Table 1 Treatment applied to mortar specimens, and tests performed
Sample Treatment Amount of solid
particle in the
solution (g/ml)
Amount of
product
applied (ml)
Amount of solid
particle in the
solution applied (g)
Amount of product
applied weight increase
after 1 month (g)
Specimen 1 Syton X 30 0.300 1.5 0.450 0.576
Specimen 3 Syton X 30 0.300 1.5 0.450 0.450
Specimen 5 Syton X 30 0.300 1.5 0.450 0.536
Specimen 13 Reference No treatment
Specimen 14 Reference No treatment
Specimen 15 Reference No treatment
514 Materials and Structures (2012) 45:505–520

6. the sampler is ready to be transported to the
measurement site.
In variant B, the sampler is cut from a plastic
pressure-sensitive tape to a length adequate for the
measured surface immediately before the peeling
measurement is made. It is recommended to remove
and discard two complete laps of tape from the roll
before starting the measurements. The measuring
length should be removed at a steady rate (i.e., not
jerked), and then cut. (This recommendation is also
valid for variant A.)
Peeling testing. Select an area without gross defects
and imperfections. For tests in situ, ensure that the
surface is naturally dry (without liquid water) and that
it represents the tested material, e.g. that it is
reasonably clean. The measurements may be influ-
enced by extremes in relative humidity and temper-
ature, due to the sensitivity of the plastic tape and the
glue layer to these factors.
Place the tape on the measured surface. In variant
A, the sampler must be taken out the sampling bag, the
cover sheet of the adhesive layer must be removed and
kept for readjusting after peeling. In variant B, the
plastic strip is simply stuck to the surface.
Smooth the tape into place using a finger (alterna-
tively, a cellophane-coated soft eraser may be
used).
After approximately 90 s of application, remove
the tape by seizing the free end and pulling it off
steadily (without jerking) at a rate of about 10 mm/s
and at an angle of 90�.
For in situ variant (A), adjust the protective sheet
over the adhesive layer with the released material and
insert it back into the sampling bag for transportation,
and close the zip. The weight will be measured later, in
the laboratory.
For laboratory variant (B) with the plastic strips
without protection of the adhesive layer, weigh the
strip with the released material on a laboratory balance
of sensitivity 0.0001 g.
Repeat the test ten times at the same place.
Repeat the procedure on other places on the
investigated surface. The number of tested places
depends on the quality of the surface and on its
variability over the area. However, three places are
typically tested in usual situations.
Fig. 7 Samples of artificial stone: not treated (a), treated with Syton X 30 (b)
Fig. 8 Double-sided adhesive tape applied to an artificial stone
specimen
Materials and Structures (2012) 45:505–520 515

The sequence of each step taken when measuring an
opuka masonry wall in situ is illustrated in Fig. 14.
6.4 Data evaluation
The evaluation of the measured data depends on how
the testing is carried out. When only a single
measurement was performed in different places,
standard statistics should be used (mean value,
standard deviation).
When repeated measurements are made in the same
place, it is necessary to distinguish two situations. If
the released material decreases and approaches a zero
value with an increasing number of peelings, use
linear regression of the logarithm of the measured data
for each measurement place. The regression procedure
makes use of an approximation of the common
logarithm of the measured released material in mg
by a quadratic polynomial, i.e. the data model is
created in the form
log mn ¼ A0 þ A1nþ A2n2 þ e ð1Þ
where n is a sequence of measurements in a given
place, and e is a random parameter with zero mean
value.
For purposes of comparison, select a reasonably
representative regression smoothed value for charac-
terizing the surface quality, e.g. the value of the third
or fourth test repetition. The data from the first two
repetitions may be severely biased, due to local
mechanical surface damage or similar imperfections.
If repeated measurements are made at the same
place, and the response provides decreasing amounts
of released material with increasing number of
peelings, and the results approach a nonzero value,
use nonlinear regression of the measured data
for each place where the measurements were made.
The form
m nð Þ ¼ Aþ B � e�C�n ð2Þ
describing the sequence of weights of the removed
material m(n) has been suggested in [10].
7 Conclusions
The peeling test, also known in the literature as the
Scotch Tape test, has been used all over the world for
assessing the consolidation or strengthening efficiency
of various treatments of degraded stone surfaces. In
the past, no standard protocols or rules were estab-
lished for these applications. The method was there-
fore not reliable, and could produce false results.
This paper has explained the shortcomings of
peeling testing, and has reviewed factors which
influence the results achieved when it is applied.
We have established reliable procedures and a
standard protocol for testing the cohesion character-
istics of brittle and quasi-brittle materials, mainly
mortars and stones, by means of peeling tests. We have
further formulated recommendations for performing
Table 2 Amount of material removed by peeling from the artificial stone
Amount of material removed by peeling (g)
First strip Second strip First strip Second strip First strip Second strip
First test First test Second test Second test Third test Third test
Syton X 30 1 0.012 0.009 0.023 0.022 0.004 0.018
Syton X 30 2 0.008 0.009 0.034 0.045 0.019 0.02
Syton X 30 3 0.006 0.011 0.034 0.048 0.011 0.01
Syton X 30 strip average 0.009 ± 0.003 0.010 ± 0.001 0.030 ± 0.006 0.038 ± 0.014 0.011 ± 0.008 0.016 ± 0.005
Syton X 30 test average 0.009 ± 0.002 0.034 ± 0.011 0.014 ± 0.006
Reference 1 0.073 0.128 0.042 0.051 0.059 0.047
Reference 2 0.083 0.123 0.061 0.075 0.039 0.058
Reference 3 0.069 0.089 0.061 0.060 0.042 0.038
Reference strip average 0.075 ± 0.007 0.113 ± 0.021 0.055 ± 0.011 0.062 ± 0.012 0.047 ± 0.011 0.048 ± 0.010
Reference test average 0.094 ± 0.025 0.058 ± 0.011 0.047 ± 0.009
516 Materials and Structures (2012) 45:505–520

Fig. 9 Adhesive strips and samples after peeling test: reference (a), Syton X 30 (b)
Fig. 10 Tested opuka wall surface area C (light line framed area before treatment, dark line framed area after treatment)
Materials and Structures (2012) 45:505–520 517

Surface areas A and B after peeling tests. Surface area B during the tests.
Fig. 11 Tested opuka wall surface areas A and B
Fig. 12 Amounts of released material before and after treatment
518 Materials and Structures (2012) 45:505–520

Fig. 13 Preparation of 20 9 50 m tape samplers for in situ testing
Fig. 14 Peeling test application on an opuka wall-individual steps. The peeled strip is then again covered with the protective layer,
inserted back in the plastic bag for transport into laboratory and weighing
Materials and Structures (2012) 45:505–520 519
peeling tests on historic stone surfaces and for
evaluating the results that are obtained.
Acknowledgments This paper is based on results and
experience acquired with support from Institutional Research
Plan AV0Z20710524, from the EC 7th FP funded
STONECORE project and from Czech Grant Agency grant
No. 103/09/2067.
Open Access This article is distributed under the terms of the
Creative Commons Attribution Noncommercial License which
permits any noncommercial use, distribution, and reproduction
in any medium, provided the original author(s) and source are
credited.
References
1. http://composite.about.com/library/glossary/s/bldef-s4726.
htm
2. Mora P, Torraca G (1965) Fissativi per dipinti murali.
Bollettino Istituto Centrale del Restauro, Rome, pp 109–132
3. Daniele V, Taglieri G (2010) Nanolime suspensions applied
on natural lithotypes: the influence of concentration and
residual water content on carbonatation process and on
treatment effectiveness. J Cult Herit 11(2010):102–106
4. Giorgi R, Dei L, Baglioni P (2000) A new method for
consolidating wall paintings based on dispersions of lime in
alcohol. Stud Conserv 45:154–161
5. Tiano P et al (2006) Biomediated reinforcement of weath-
ered calcareous stones. J Cult Herit 7:49–55
6. Chiche A, Zhang W, Stafford CM, Karim A (2005) A new
design for high-throughput peel tests: statistical analysis and
example. Meas Sci Technol 16:183–190
7. Drdacky M, Slızkova Z (2006) Nondestructive survey of
degraded and consolidated renders of the Pernstejn Castle,
Report UTAM AVCR, UTAM AVCR Praha, August 2006
8. Drdacky M, Slızkova Z (2008) Calcium hydroxide based
consolidation of lime mortars and stone. In: Delgado-Ro-
drigues J, Mimoso JM (eds) Proceedings of the international
symposium ‘‘stone consolidation in cultural heritage’’,
LNEC, Lisbon, May 2008, pp 299–308. ISBN 978-972-49-
2135-8
9. Daniele V, Taglieri G, Quaresima R (2007) The nano-limes
in Cultural Heritage conservation: characterisation and
analysis of the carbonation process. J Cult Herit 9:294–301
10. Ferron A (2007) The consolidation of earthen surface fin-
ishes: a study of disaggregating plasters at Mesa Verde
National Park. MSc thesis, University of Pennsylvania,
p. 144
11. Fitzner B (2004) Documentation and evaluation of stone
damage on monuments. In: Kwiatkowski D, Lofvendahl R
(eds) Proceedings of the 10th international congress on
deterioration and conservation of stone, ICOMOS Sweden,
Stockholm, pp 677–690
520 Materials and Structures (2012) 45:505–520


