
Standard Deviation

Two classes took a recent quiz. There were 10 students in each class, and each class had an average score of 81.5

Since the averages are the same, can we assume that the students in both classes all did pretty much the same on the exam?
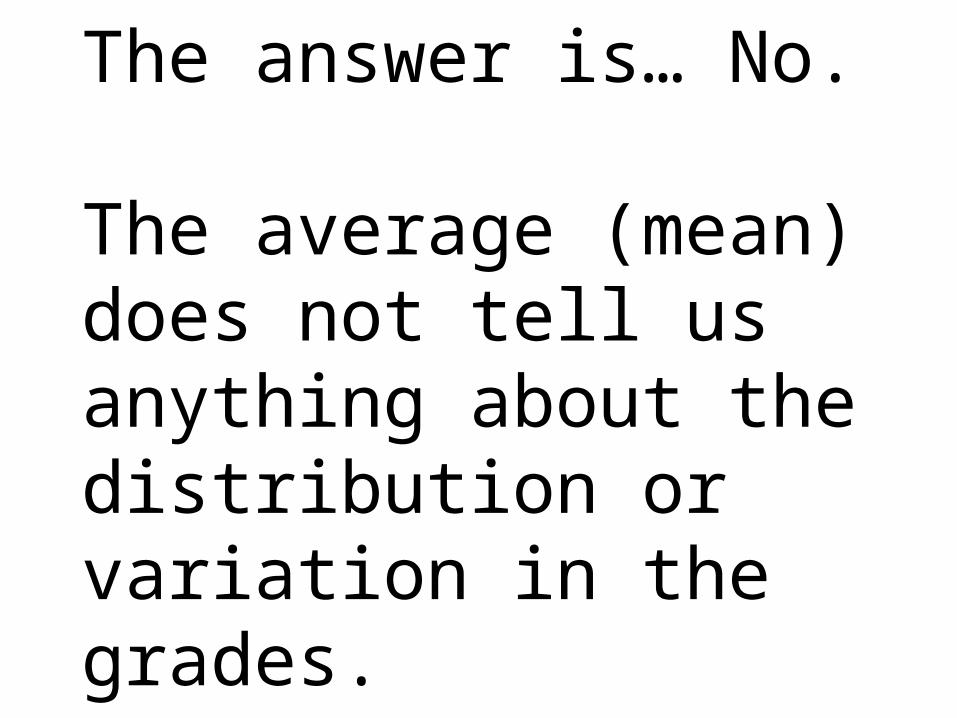
The answer is… No.
The average (mean) does not tell us anything about the distribution or variation in the grades.

Here are Dot-Plots of the grades in each class:

Mean

So, we need to come up with some way of
measuring not just the average, but also the
spread of the distribution of our data.
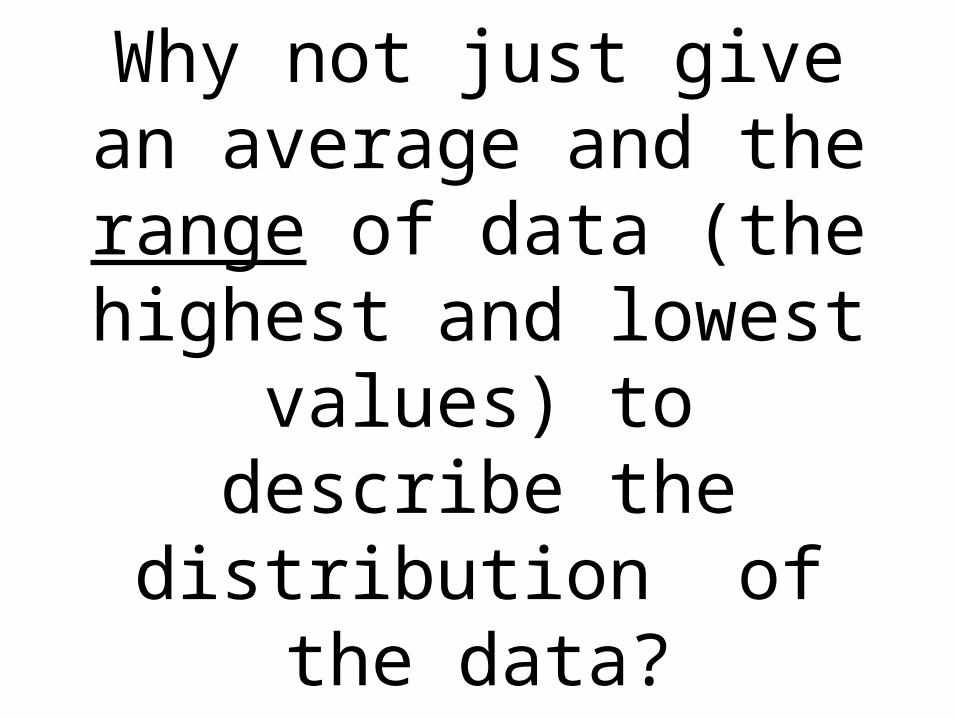
Why not just give an average and the range of data (the highest and
lowest values) to describe the distribution
of the data?

Well, for example, lets say from a set of data, the
average is 17.95 and the range is 23.
But what if the data looked like this:

Here is the average
And here is the range
But really, most of the numbers are in this area, and are not evenly distributed throughout the range.

The Standard Deviation is a number that
measures how far away each number in a set of data is from their mean.

If the Standard Deviation is large, it means the numbers
are spread out from their mean.
If the Standard Deviation is small, it means the numbers
are close to their mean.small,
large,

Here are the scores
on the math quiz for Team
A:
72
76
80
80
81
83
84
85
85
89
Average: 81.5

The Standard Deviation measures how far away each number in a set of data is from their mean.
For example, start with the lowest score, 72. How far away is 72 from the mean of 81.5?
72 - 81.5 = - 9.5
- 9.5
- 9.5
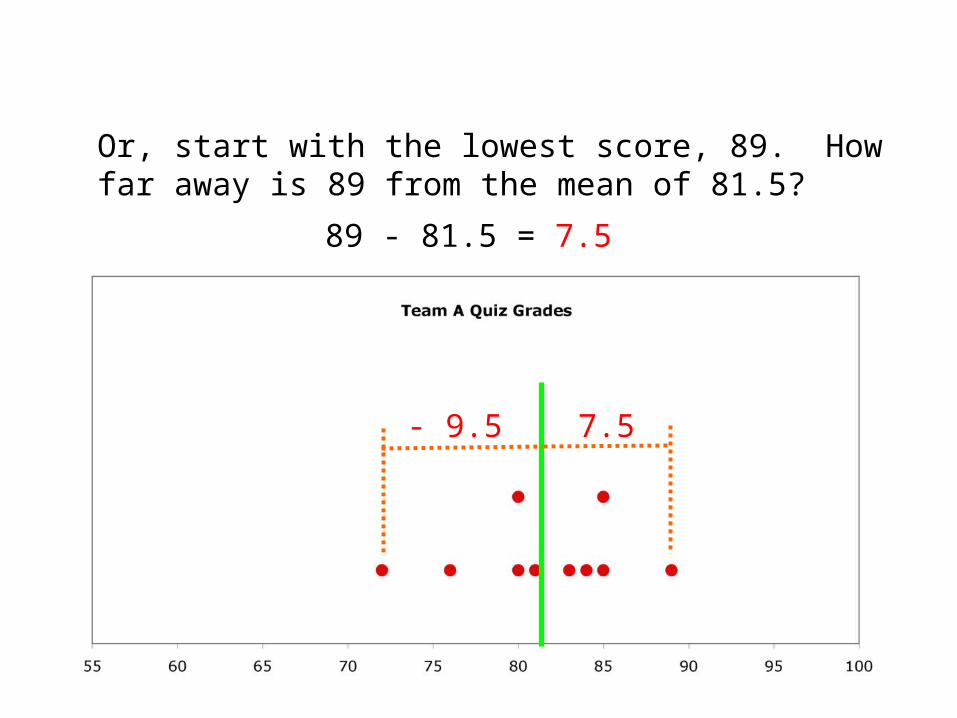
Or, start with the lowest score, 89. How far away is 89 from the mean of 81.5?
89 - 81.5 = 7.5
7.5

So, the first step to finding the Standard Deviation is to find all the
distances from the mean.
72
76
80
80
81
83
84
85
85
89
-9.5
7.5
Distance from Mean

So, the first step to finding the Standard Deviation is to find all the
distances from the mean.
72
76
80
80
81
83
84
85
85
89
- 9.5
- 5.5
- 1.5
- 1.5
- 0.5
1.5
2.5
3.5
3.5
7.5
Distance from Mean

Next, you need to square each of
the distances
to turn them all
into positive
numbers
72
76
80
80
81
83
84
85
85
89
- 9.5
- 5.5
- 1.5
- 1.5
- 0.5
1.5
2.5
3.5
3.5
7.5
Distance from Mean
90.25
30.25
Distances Squared

Next, you need to square each of
the distances
to turn them all
into positive
numbers
72
76
80
80
81
83
84
85
85
89
- 9.5
- 5.5
- 1.5
- 1.5
- 0.5
1.5
2.5
3.5
3.5
7.5
Distance from Mean
90.25
30.25
2.25
2.25
0.25
2.25
6.25
12.25
12.25
56.25
Distances Squared

Add up all of the
distances
72
76
80
80
81
83
84
85
85
89
- 9.5
- 5.5
- 1.5
- 1.5
- 0.5
1.5
2.5
3.5
3.5
7.5
Distance from Mean
90.25
30.25
2.25
2.25
0.25
2.25
6.25
12.25
12.25
56.25
Distances Squared
Sum:214.5

Divide by (n - 1) where n represents the amount of numbers you have.
72
76
80
80
81
83
84
85
85
89
- 9.5
- 5.5
- 1.5
- 1.5
- 0.5
1.5
2.5
3.5
3.5
7.5
Distance from Mean
90.25
30.25
2.25
2.25
0.25
2.25
6.25
12.25
12.25
56.25
Distances Squared
Sum:214.5
(10 - 1)
= 23.8

Finally, take the Square
Root of the average distance
72
76
80
80
81
83
84
85
85
89
- 9.5
- 5.5
- 1.5
- 1.5
- 0.5
1.5
2.5
3.5
3.5
7.5
Distance from Mean
90.25
30.25
2.25
2.25
0.25
2.25
6.25
12.25
12.25
56.25
Distances Squared
Sum:214.5
(10 - 1)
= 23.8
= 4.88

This is the Standard Deviation
72
76
80
80
81
83
84
85
85
89
- 9.5
- 5.5
- 1.5
- 1.5
- 0.5
1.5
2.5
3.5
3.5
7.5
Distance from Mean
90.25
30.25
2.25
2.25
0.25
2.25
6.25
12.25
12.25
56.25
Distances Squared
Sum:214.5
(10 - 1)
= 23.8
= 4.88

Now find the
Standard Deviation
for the other class
grades
57
65
83
94
95
96
98
93
71
63
- 24.5
- 16.5
1.5
12.5
13.5
14.5
16.5
11.5
- 10.5
-18.5
Distance from Mean
600.25
272.25
2.25
156.25
182.25
210.25
272.25
132.25
110.25
342.25
Distances Squared
Sum:2280.5
(10 - 1)
= 253.4
= 15.91
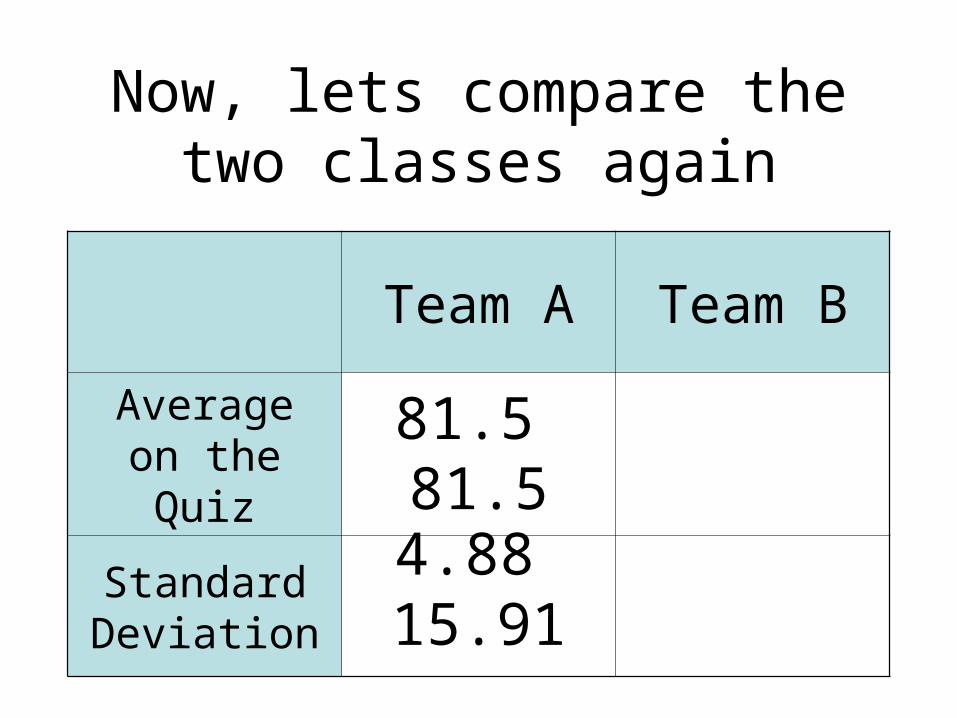
Now, lets compare the two classes again
Team A Team B
Average on the Quiz
Standard Deviation
81.5 81.5
4.88 15.91


