
SM 1
Analytical and Bionalytical Chemistry
Electronic Supplementary Material
Stacked and continuous helical self-assemblies of guanosine
monophosphates detected by vibrational circular dichroism
Iryna Goncharova, Jana Novotná and Marie Urbanová
SM 2
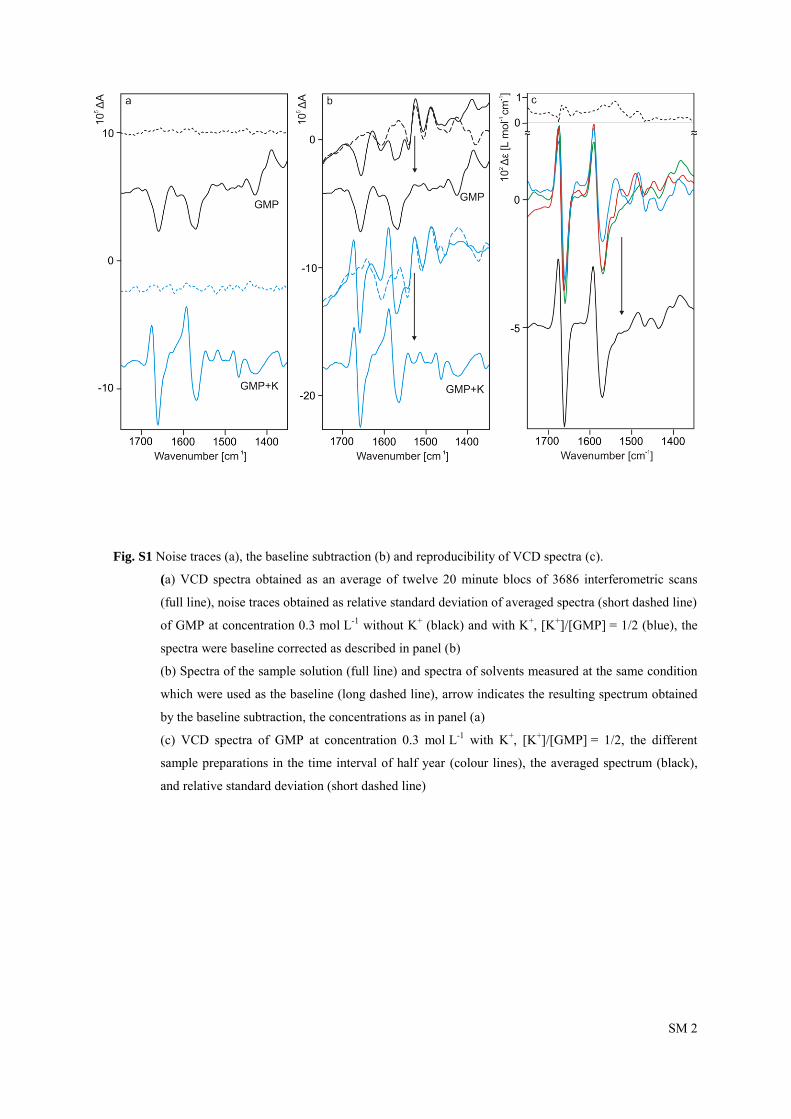
Fig. S1 Noise traces (a), the baseline subtraction (b) and reproducibility of VCD spectra (c).
(a) VCD spectra obtained as an average of twelve 20 minute blocs of 3686 interferometric scans
(full line), noise traces obtained as relative standard deviation of averaged spectra (short dashed line)
of GMP at concentration 0.3 mol L-1 without K+ (black) and with K+, [K+]/[GMP] = 1/2 (blue), the
spectra were baseline corrected as described in panel (b)
(b) Spectra of the sample solution (full line) and spectra of solvents measured at the same condition
which were used as the baseline (long dashed line), arrow indicates the resulting spectrum obtained
by the baseline subtraction, the concentrations as in panel (a)
(c) VCD spectra of GMP at concentration 0.3 mol L-1 with K+, [K+]/[GMP] = 1/2, the different
sample preparations in the time interval of half year (colour lines), the averaged spectrum (black),
and relative standard deviation (short dashed line)

SM 3
Fig. S2 ECD spectra of sodium salt of guanosine monophosphate(GMP), guanosine diphosphate (GDP), and
triphosphate (GTP) in H2O at 2.10-4 (gray), 0.3 (black), and 0.7 mol L-1 (dashed)

SM 4
Fig. S3 ECD (Δε) and UV (ε) spectra of GMP (blue), GDP (green) and GTP (red) in aqueous solution at
concentration 0.3 mol L-1 with Na+ and K+. The ratio of additional ion/guanosine derivative was 1/2

SM 5
Tab. S1 Experimental parameters of VCD and IR absorption spectra of guanosine monophosphate (GMP), guanosine diphosphate (GDP),
and triphosphate (GTP) in H2O as function of concentration and additional metal cations
IR VCD
Compound Concentration Addedions Maximum Relative intensity FWHH Maximum Relative intensity “Markerpeak” Relative intensity Maximum Maximum
mol·L-1
ν(C=O), cm-1 ν(C=O), % ν(C=O), cm-1 C=C/C=N, cm-1 C=C/C=N, % position, cm-1 “Markerpeak”, % ν(C=O), cm-1 C=C/C=N, cm-1
GMP 0.3 - 1665 100 37 1578 100 1539 24 1657(-) -
0.7 - 1672 89 33 1580 58 1536 38 1688(-), 1665(-) -
0.3 Na+ 1670 94 30 1579 60 1536 34 1695(-), 1679(+)/1663(-) -
0.7 Na+ 1672 85 28 1587 52 1537 32 1694(-), 1680(+)/1666(-) 1591(+)/1576(-)
0.3 K+ 1670 109 24 1587 38 1535 76 1675(+)/1660(-) 1592(+)/1570(-)
0.7 K+ 1672 125 24 1590 38 1534 100 1677(+)/1663(-) 1592(+)/1569(-)
GDP 0.3 - 1665 100 36 1578 100 1538 21 1655(-) -
0.7 - 1667 83 38 1579 85 1537 19 1656(-) -
0.3 Na+ 1670 98 36 1579 68 1537 24 1676(+), 1654(-) 1596(+)/1576(-)
0.7 Na+ 1672 85 34 1579 63 1537 38 1681(+)/1666(-) 1596(+)/1580(-)
0.3 K+ 1669 132 25 1583 57 1535 108 1677(+)/1660(-) 1595(+)/1576(-)
0.7 K+ 1668 138 24 1590 51 1534 120 1677(+)/1663(-) 1578(+)/1564(-)
GTP 0.3 - 1665 100 38 1578 100 1538 11 1664(-) -
0.7 - 1667 94 38 1579 81 1538 21 1655(-) -
0.3 Na+ 1667 98 37 1578 94 1538 24 1657(-) -
0.7 Na+ 1668 80 38 1579 79 1538 24 1682(+), 1655(-) -
0.3 K+ 1667 98 36 1578 75 1537 11 1657(-) -
0.7 K+ 1670 108 30 1580 55 1536 44 1677(+)/1660(-) 1594(+)/1572(-)

SM 6
Fig. S4 Temperature-dependent ECD spectra of GMP at 0.5 mol L-1 in the presence of K+, the GMP/K+ ratio was
2/1. Numbers denote the temperature
Calculations of optical parameters by degenerate couplet oscillator method
In the degenerate couplet oscillator (DCO) method, the intrinsic chirality of each oscillator is omitted, i.e.,
the magnetic dipole transition moment for each oscillator is zero and optical activity originates in chiral
arrangement of the both transition moment [1-3]. When polar coordinates (Figure S3) are used, and assuming
that the two dipoles are of the same value, μ1 = μ2 = μ, the dipole strength D, the rotation strength R, Davydov’s
splitting V12, and the split frequencies ν± are given:
1 2jKC (1) 2
2 1 21 sin cosD (2) 2
0 1 2/ 2 sin cosR c R (3)
2
12 2 1 2 1 2 1 23sin cos 3sin sin cos cosV
R
(4)
12V (5) The magnitude of μ was obtained from the experimental molar absorptivity spectrum ε(ν) of the
corresponding absorption band by calculating the dipolar strength, D:
1 2
2D , where (6)
380.92 10 /D d (7)
Fig. S5 Polar coordinates used for DCO calculations
SM 7
Structural model of guanosine assemblies used for determination of optical parameters by degenerate couplet
oscillator calculation
We calculated the optical parameters (1)−(5) for three different structures. The data that determine the
geometry and the obtained value of the calculated parameters R+ and V12 are given in the Table S2.
1 Tetramer G4 without a central coordinated metal cation
The initial geometry of the cyclic tetramer, the G-quartet, was obtained from the previous studies of G-
quartets that have been performed by Setnicka and Novy [4,5], where the tetramer geometry was optimized at
the B3LYP/6-31G** level.
The calculated optical parameters of the tetramer by DCO correspond (Table S2) well to the sign for
previously calculated by DFT [5] and experimentally obtained terms of intensities and spectral patterns. The IR
bands were distinguished and vibration modes assigned on the basis of dynamic visualization of the normal
mode displacements using the HyperChem programs set. The most intense bands at 1710−1670 cm−1 were
assigned to the C=O modes mixed with a minor contribution of guanine skeletal ν(C=C). In the region below
these bands, there were significant contributions from aromatic ring vibrations, mostly ν(C=C) and ν(C=N). The
sugar vibrations contributed only weakly to the spectral region 1800−1400 cm−1. Thus, this spectral region
mainly reflects the G-ring vibrations. Our assignment of the vibration modes is consistent with results published
previously.
2 Octamer composed of two stacked G-quartets
We used the C4 symmetry octamer structure with the “head-to-tail” (H-T) configuration of the adjacent
tetramers and their mutual twist angle of 30°. The initial geometry of two stacked helical species was obtained
by the association of planar tetramers in octamer conformation placed at an appropriate distance. Cartesian
coordinates were used from crystallographic data for the H-T-oriented octamers in the dodecamer structure
[6].We also took into account the results of several theoretical studies of stacked tetramers in quadruplex
structure that had been performed previously [6-13]. The molecular model of the octamer was then optimized for
energy minimization by the MM (AMBER99) [14].
The magnitudes of μ were obtained from the experimental molar absorptivity spectrum ε(υ) for two
vibrational transitions localities in the C=O and C=N groups. The VCD spectrum was calculated from the
obtained rotational strengths R+ and R- at ν+ and ν- (Formula (3)) using a Lorenzian band shape and a half-width
of 5 cm-1.The obtained spectrum was in a good agreement with experimental results for the associates GMP,
GDP, and GTP with K+ ions.
3 Continuous helical assemblies
Structural modeling of continuous helical assembles was performed using the MM method (AMBER99
[14]) implemented in the HyperChem 8.03 software package (Hypercube, Inc.) for Windows. Some of the
geometrical parameters (guanosine-guanosine distance, position of the cations, and relative orientation of
guanosines) were kept within the values observed in the crystal structures obtained in the quadruplex structure
and the ribbons geometry of guanosine monophosphate [6-8,10-12].
SM 8
The calculation of the rotational strength was made by the model for the exciton states in a helical
arrangement of N identical chromophores when only next-neighbor interactions are considered [15,16]. Under
these conditions, we assumed that the directions of the transition dipole moments were along the chemical bonds
C=O and C=N and form the helix of transition moments. The signs of the rotational strength were in good
agreement with the experimental results in both the C=O and C=N regions. The concept of formation of helical
associates is further confirmed by the existing liquid crystal phase observed at higher concentrations of the
guanosine derivatives and/or K+ composed of helical associates as a build unit along with quadruplexes.
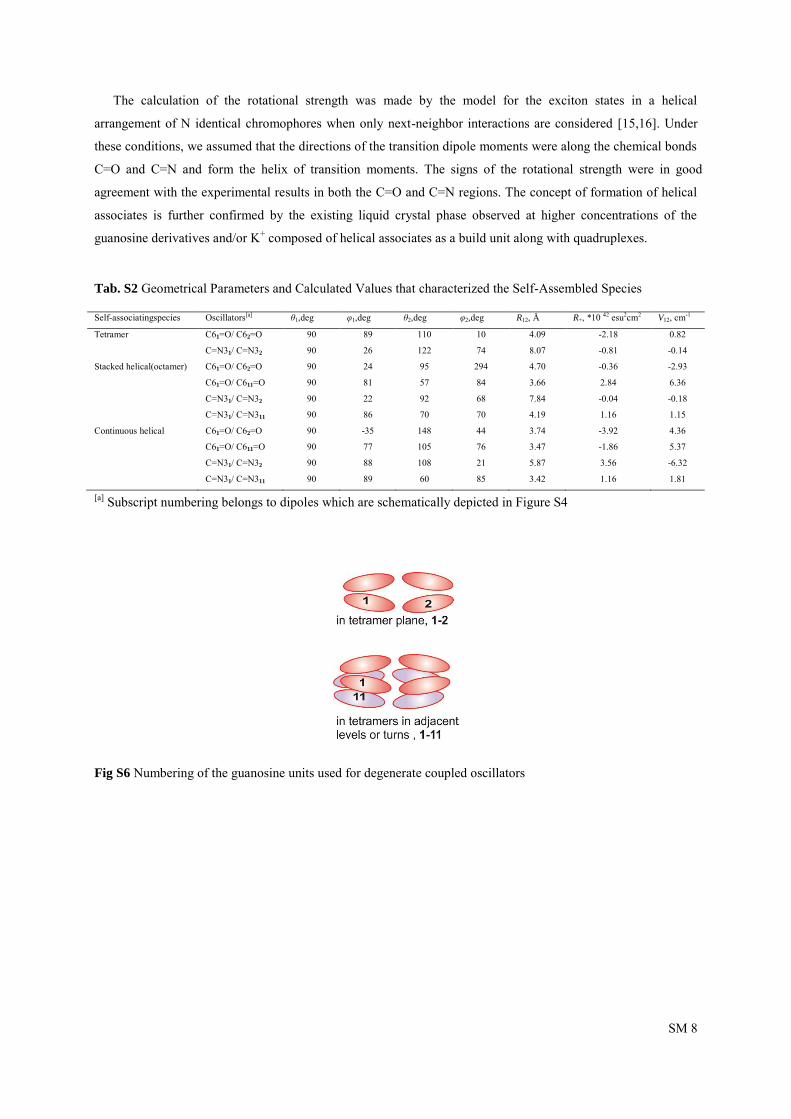
Tab. S2 Geometrical Parameters and Calculated Values that characterized the Self-Assembled Species
Self-associatingspecies Oscillators[a] θ1,deg φ1,deg θ2,deg φ2,deg R12, Å R+, *10 42 esu2cm2 V12, cm-1
Tetramer C61=O/ C62=O 90 89 110 10 4.09 -2.18 0.82
C=N31/ C=N32 90 26 122 74 8.07 -0.81 -0.14
Stacked helical(octamer) C61=O/ C62=O 90 24 95 294 4.70 -0.36 -2.93
C61=O/ C611=O 90 81 57 84 3.66 2.84 6.36
C=N31/ C=N32 90 22 92 68 7.84 -0.04 -0.18
C=N31/ C=N311 90 86 70 70 4.19 1.16 1.15
Continuous helical C61=O/ C62=O 90 -35 148 44 3.74 -3.92 4.36
C61=O/ C611=O 90 77 105 76 3.47 -1.86 5.37
C=N31/ C=N32 90 88 108 21 5.87 3.56 -6.32
C=N31/ C=N311 90 89 60 85 3.42 1.16 1.81
[a] Subscript numbering belongs to dipoles which are schematically depicted in Figure S4
Fig S6 Numbering of the guanosine units used for degenerate coupled oscillators

SM 9
References
1. Buffeteau T, Ducasse L, Brizard A, Huc I, Oda R (2004) J Phys Chem A 10: 4080-4086
2. Tinoco I (1963) Radiat Res 20:133-138
3. Harada N, Nakanishi K (1983) Circular Dichroism Spectroscopy. Exciton Coupling in Organic
Stereochemistry University Science Books, New York
4. Novy J, Bohm S, Kralova J, Kral V, Urbanova M (2008) Biopolymers 89:144-152
5. Setnicka V, Novy J, Bohm S, Sreenivasachary N, Urbanova M, Volka K (2008) Langmuir 24:7520-
7527
6. Forman SL, Fettinger JC, Pieraccini S, Gottareli G, Davis JT (2000) J Am Chem Soc 122:4060-4067
7. Davis JT (2004) Angew Chem- Int Edit 43:668-698
8. Davis JT, Spada GP (2007) Chem Soc Rev 36:296-313
9. Eimer W, Dorfmueller T (1992) J Phys Chem 96:6790-6800
10. Gray DM, Wen JD, Gray CW, Repges R, Repges C, Raabe G, Fleischhauer J (2008) Chirality 20:431-
440
11. Lena S, Cremonini MA, Federiconi F, Gottarelli G, Graziano C, Laghi L, Mariani P, Masiero S,
Pieraccini S, Spada GP (2007) Chem Eur J 13:3441-3449
12. Lena S, Brancolini G, Gottarelli G, Mariani P, Masiero S, Venturini A, Palermo V, Pandoli O,
Pieraccini S, Samori P, Spada GP (2007) Chem Eur J 13:3757-3764
13. Malinina L, Fernandez LG, Huynh-Dinh T, Subirana JA (1999) J Mol Biol 285:1679-1690
14. Cornell WD, Cieplak P, Bayly CI, Gould IR, Merz KM, Ferguson DM, Spellmeyer DC, Fox T,
Caldwell JW, Kollman PA (1995) J Am Chem Soc 117:5179-5197
15. Bradley DF, Tinoco I, Woody RW (1963) Biopolymers 1:239-267
16. Dick B (2011) ChemPhysChem 12:1578-1587


