
Food & Env ironmental
Protection
1
Stable isotope deltas: Natures own traceability system for verifying food
authenticity
Russell Frew
Food and Environmental Protection Laboratory Joint FAO/IAEA Division of
Nuclear Techniques in Food and Agriculture

Food & Env ironmental
Protection
Food Fraud - Definition
• The UK Food Standards Agency states food fraud has
occurred “..when food is deliberately placed on the
market, for financial gain, with the intention of
deceiving the consumer”.
• The Overarching EC requirements intended to ensure
consumers are not misled are the Food Labelling
Directive 2000/13, Article 2, which requires that food
labelling must not mislead the purchaser to a material
degree, particularly:
• (i) as to the characteristics of the foodstuff and, in particular, as to
its nature, identity, properties, composition, quantity, durability, origin
or provenance, method of manufacture or production.
Food & Env ironmental
Protection
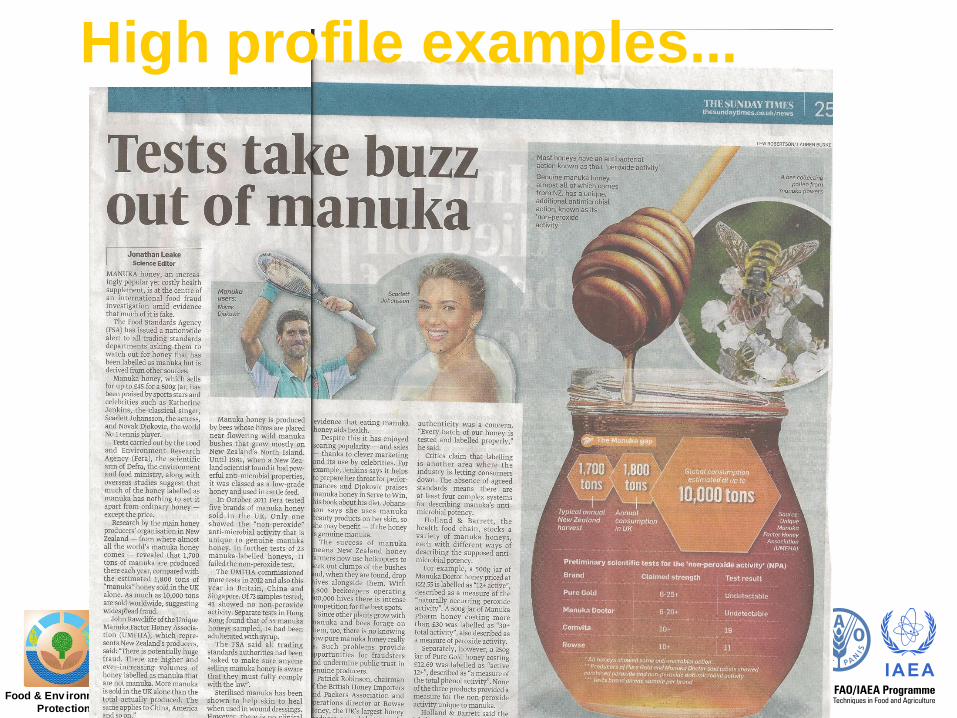
High profile examples...

Food & Env ironmental
Protection
Precise Isotope Ratios of:
Element Minor Isotope Natural Abundance [%]
• Hydrogen 2H 0.01557
• Carbon 13C 1.11140
• Nitrogen 15N 0.36630
• Oxygen 18O 0.20004
• Sulfur 34S 4.21500
Information Delivered by IRMS
This is where the information is
Food & Env ironmental
Protection
Forensic Isotope Ratio Mass
Spectrometry (FIRMS)
• Isotope fingerprinting
• Conventional chemical analysis – identification and quantification.
• IRMS - determine relationships or pathways
• Isotopic composition is unique to the origin and history of the substance

Food & Env ironmental
Protection
Batch Testing
• Collect authentic samples
• Measure number of
parameters (e.g. stable
isotopes, trace elements,
metabolites)
• Define specifications
using multivariate
analysis
Approach

Food & Env ironmental
Protection
Batch Testing
Pro’s
• Can be very robust
Con’s
• Expensive to collect the
authentic samples/data
• Need to sample variability
• Only applicable to
samples related to the
training set
• Need for seasonal
resampling
• Not predictive
• High level of analytical
expertise

Food & Env ironmental
Protection
New Zealand Dairy Milk
New Zealand is capable of drying 40 million
liters quality milk on a daily basis
A good target for fraud
Globally known for it’s quality
Used as an ingredient in sensitive products
(e.g. infant formula)
Significant amount of milk powder traded on
spot market
Food & Env ironmental
Protection
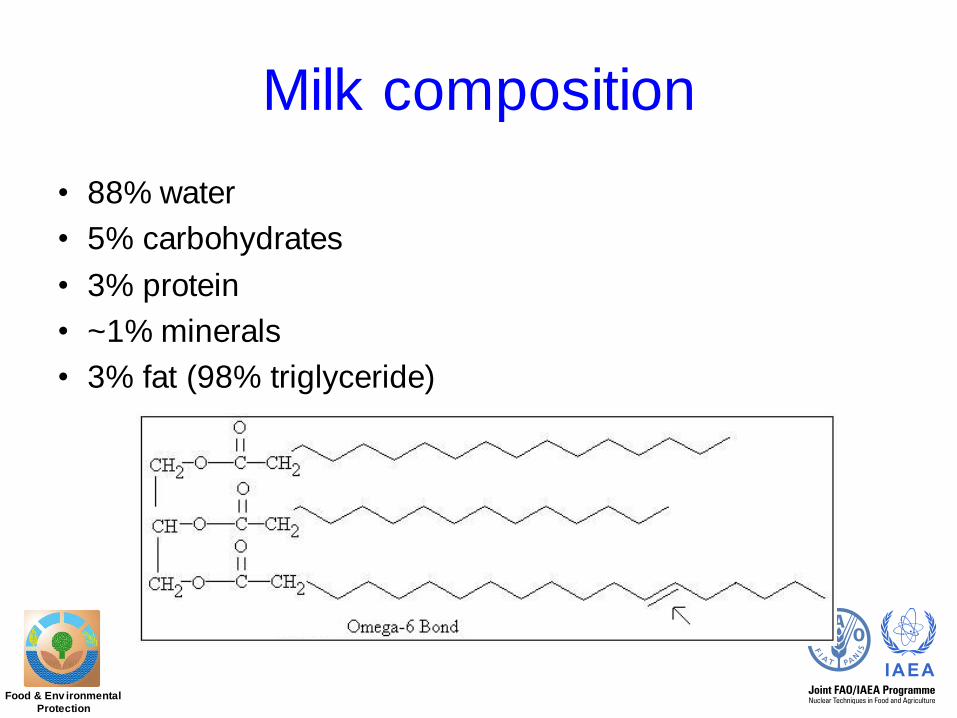
Milk composition
• 88% water
• 5% carbohydrates
• 3% protein
• ~1% minerals
• 3% fat (98% triglyceride)
Food & Env ironmental
Protection
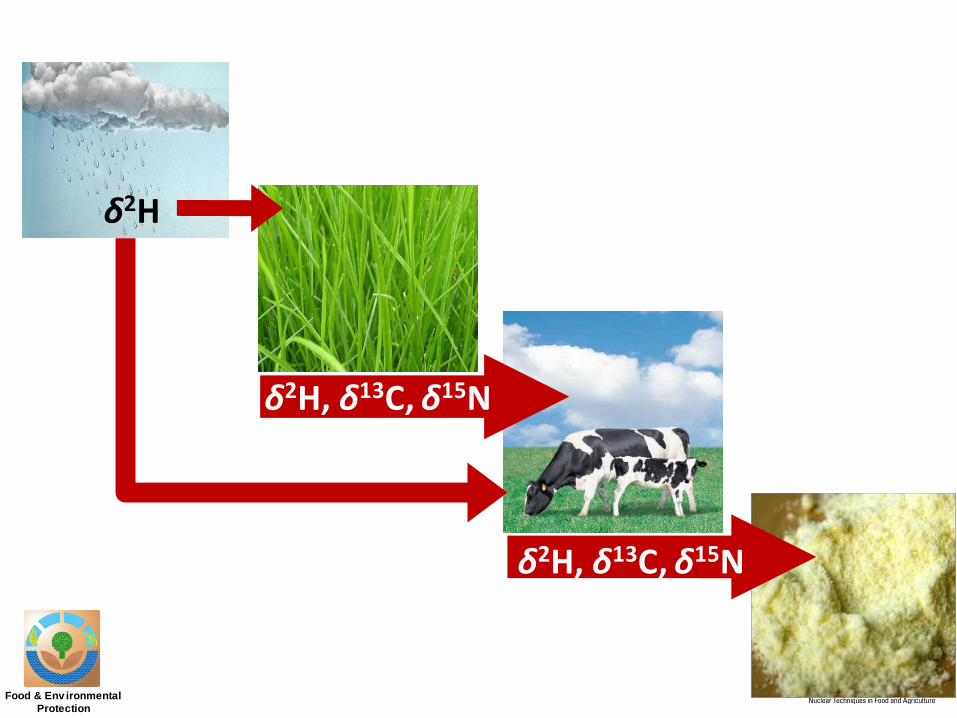
δ2H
δ2H, δ13C, δ15N
δ2H, δ13C, δ15N
Food & Env ironmental
Protection
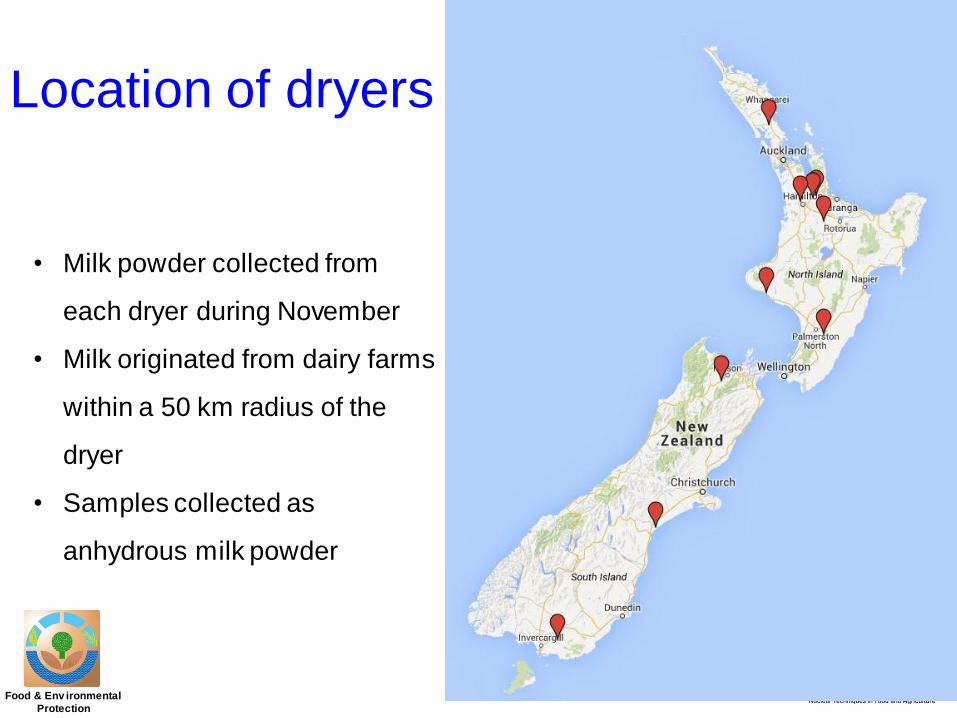
Location of dryers
• Milk powder collected from
each dryer during November
• Milk originated from dairy farms
within a 50 km radius of the
dryer
• Samples collected as
anhydrous milk powder
Food & Env ironmental
Protection
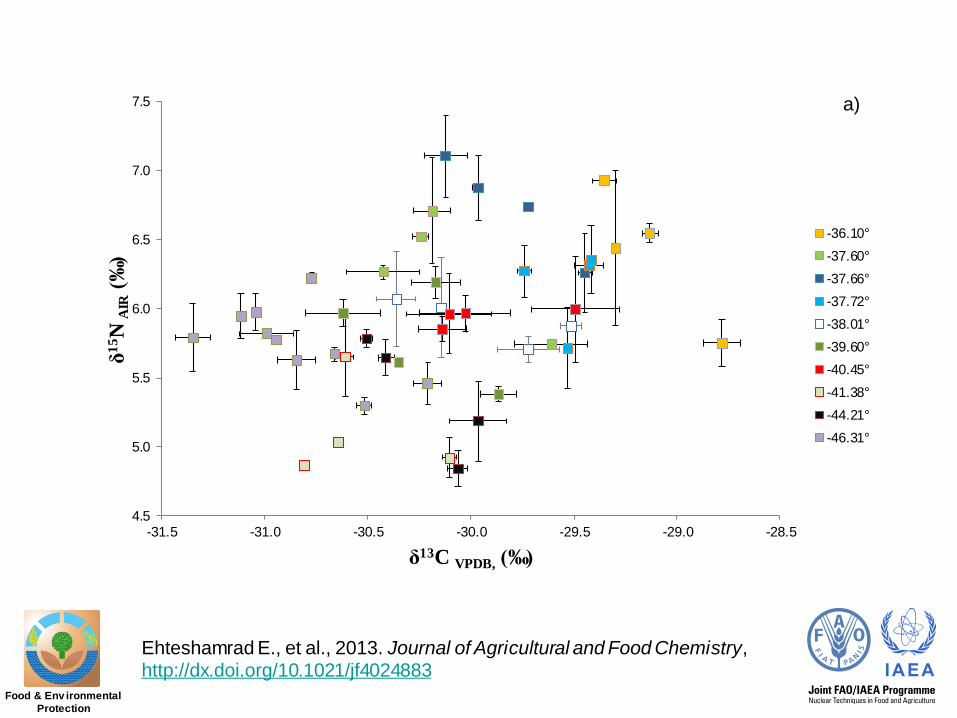
Ehteshamrad E., et al., 2013. Journal of Agricultural and Food Chemistry, http://dx.doi.org/10.1021/jf4024883
4.5
5.0
5.5
6.0
6.5
7.0
7.5
-31.5 -31.0 -30.5 -30.0 -29.5 -29.0 -28.5
δ1
5N
AIR
(‰)
δ13C VPDB, (‰)
-36.10°
-37.60°
-37.66°
-37.72°
-38.01°
-39.60°
-40.45°
-41.38°
-44.21°
-46.31°
a)
Food & Env ironmental
Protection
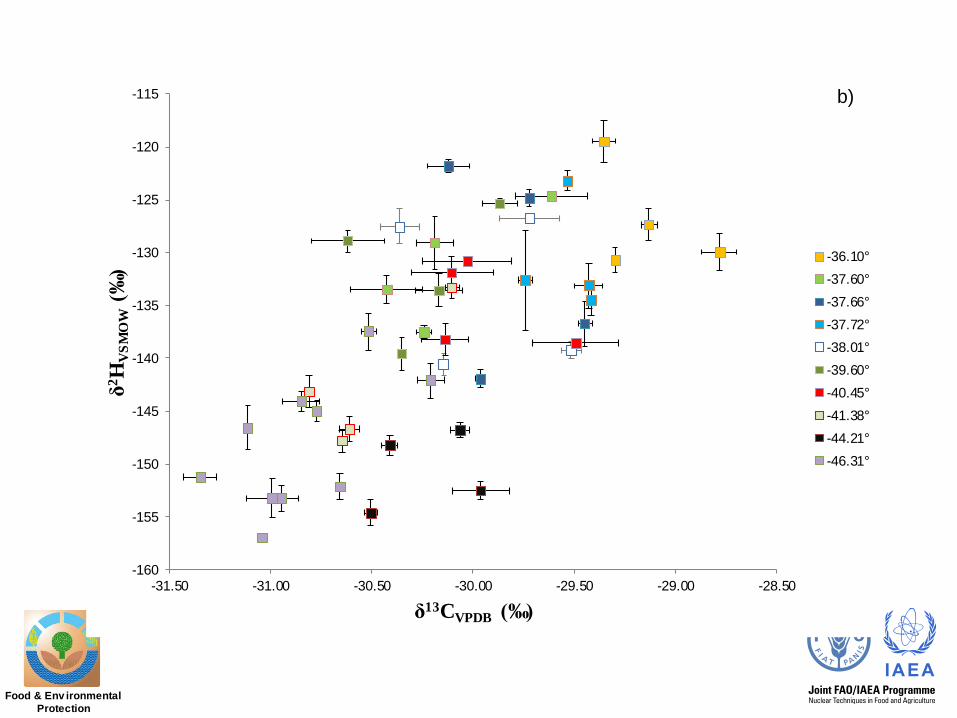
-160
-155
-150
-145
-140
-135
-130
-125
-120
-115
-31.50 -31.00 -30.50 -30.00 -29.50 -29.00 -28.50
δ2H
VS
MO
W (‰)
δ13CVPDB (‰)
-36.10°
-37.60°
-37.66°
-37.72°
-38.01°
-39.60°
-40.45°
-41.38°
-44.21°
-46.31°
b)
Food & Env ironmental
Protection
-5 0 5 10
0.0
0.2
0.4
group North
-5 0 5 10
0.0
0.2
0.4
group South
North
South
-5
-5
5
5
10
10
0
0
-4 -2 0 2
0.0
0.2
0.4
0.6
group North
-4 -2 0 2
0.0
0.2
0.4
0.6
group South
-5 0 5 10
0.0
0.2
0.4
group North
-5 0 5 10
0.0
0.2
0.4
group South
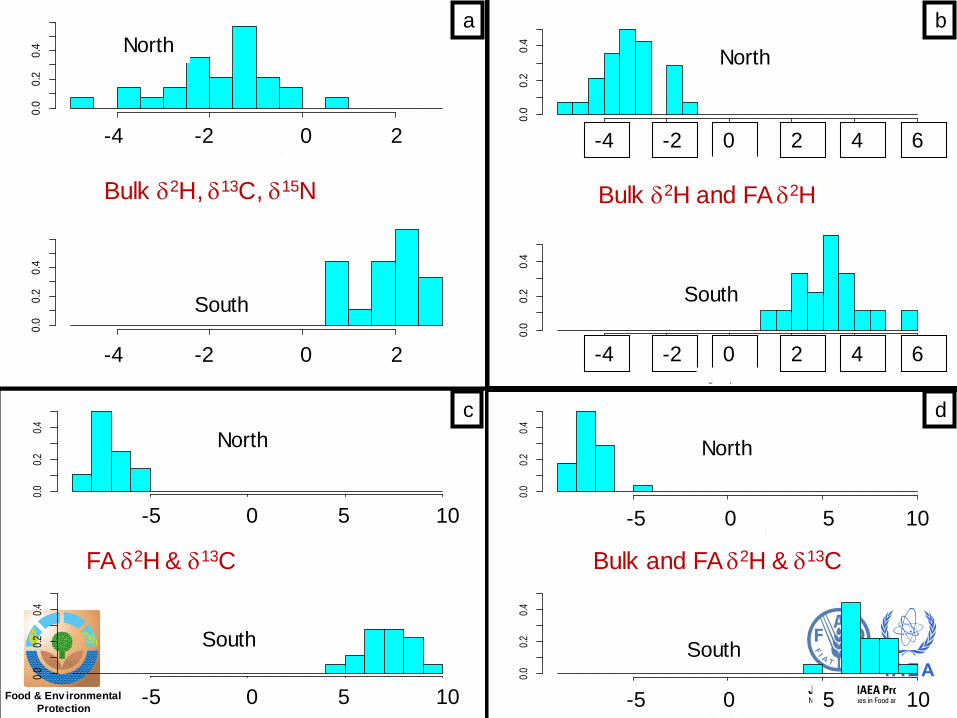
a b
c d
-4 -2 0 2
-4 -2 0 2
-5 5 10
-5 5 10
South
North
North
South
0
0
-4 -2 0 2 4 6
0.0
0.2
0.4
group North
-4 -2 0 2 4 6
0.0
0.2
0.4
group South
0
0
North
South
2
2
4
4
6
6
-2
-2
-4
-4
Bulk 2H, 13C, 15N Bulk 2H and FA 2H
FA 2H & 13C Bulk and FA 2H & 13C
Food & Env ironmental
Protection
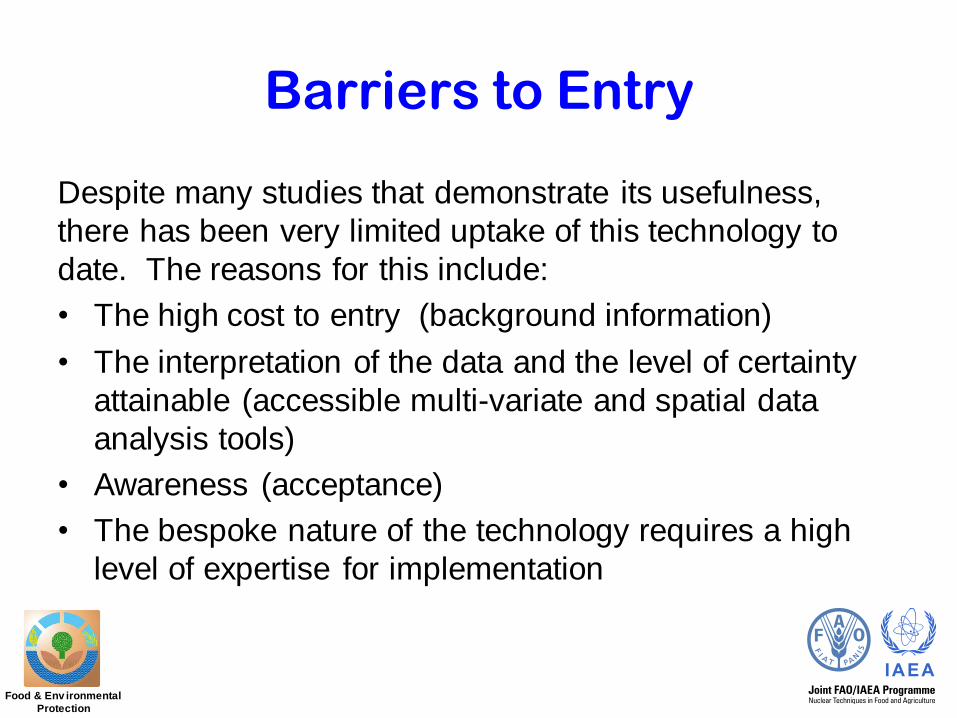
Barriers to Entry
Despite many studies that demonstrate its usefulness,
there has been very limited uptake of this technology to
date. The reasons for this include:
• The high cost to entry (background information)
• The interpretation of the data and the level of certainty
attainable (accessible multi-variate and spatial data
analysis tools)
• Awareness (acceptance)
• The bespoke nature of the technology requires a high
level of expertise for implementation
Food & Env ironmental
Protection
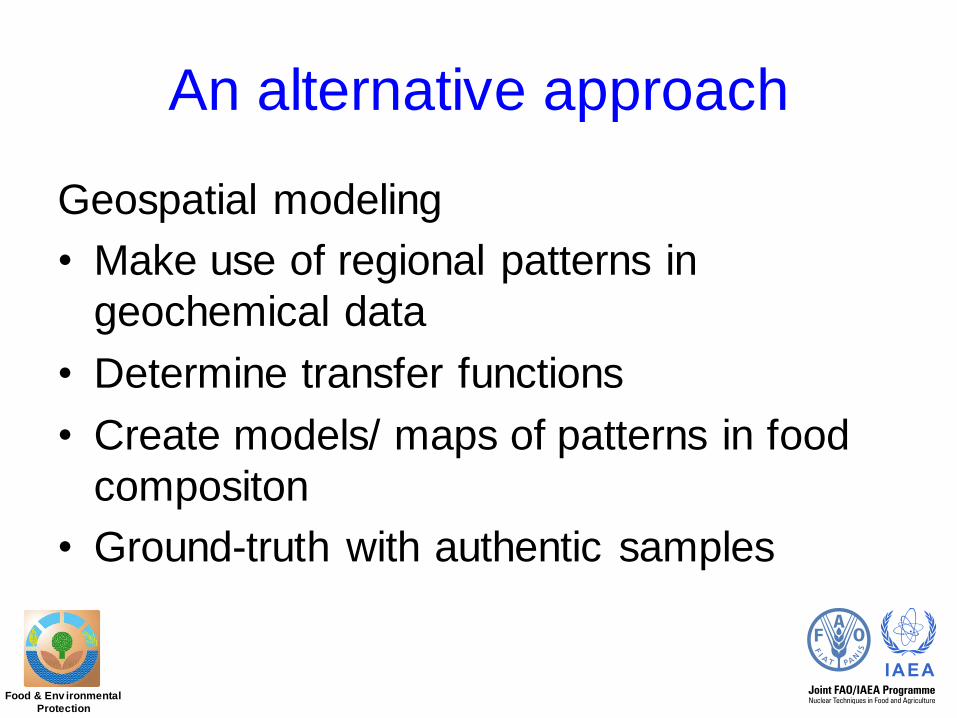
An alternative approach
Geospatial modeling
• Make use of regional patterns in
geochemical data
• Determine transfer functions
• Create models/ maps of patterns in food
compositon
• Ground-truth with authentic samples
Food & Env ironmental
Protection
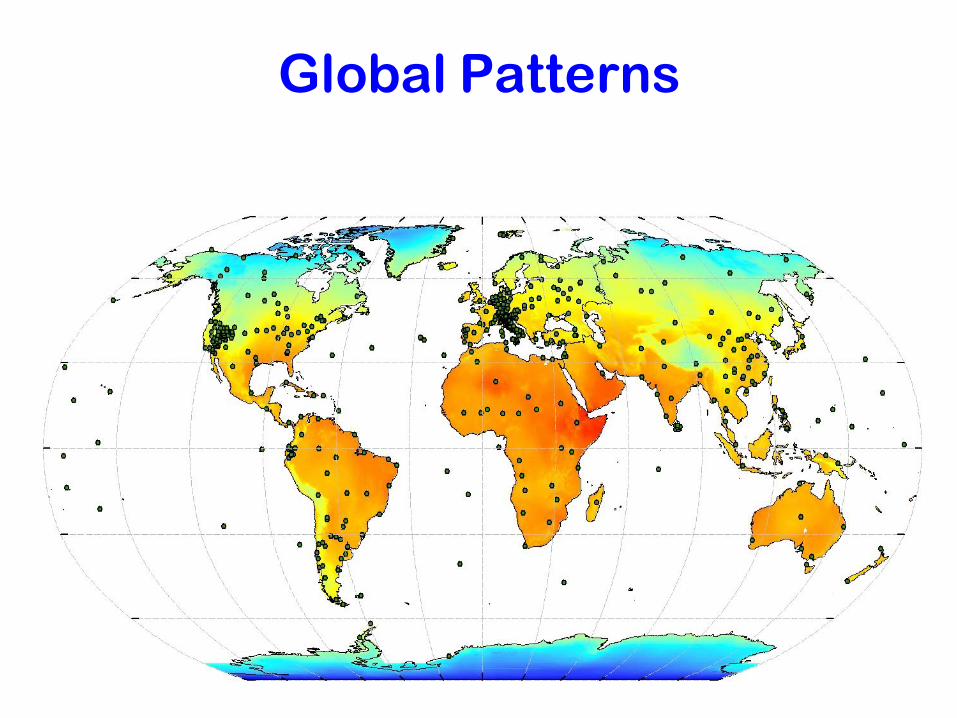
Global Patterns

Food & Env ironmental
Protection
New Zealand Rainfall δ2H

Food & Env ironmental
Protection
Milk Powder 2H
Ehteshamrad et al., Geochim. Cosmochim. Acta, 111, 105-116, 2012
Food & Env ironmental
Protection
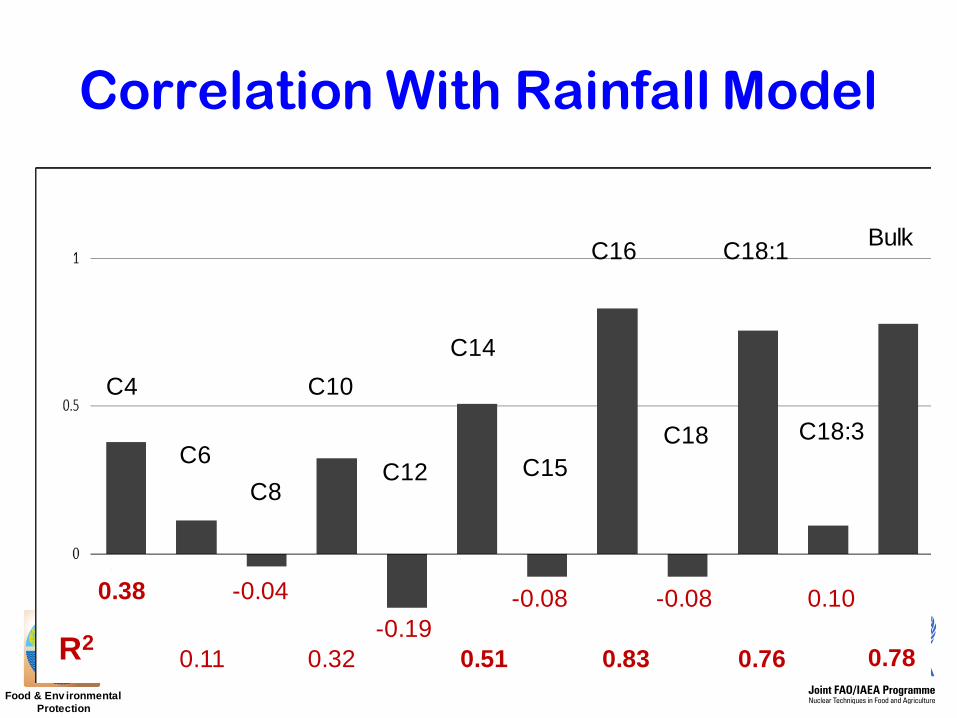
Correlation With Rainfall Model
R2
0.38
0.11
-0.04
0.32
-0.19
0.51
-0.08
0.83 0.76 0.78
-0.08 0.10
C4
C6
C8
C10
C12
C14
C16
C15
C18
C18:1
C18:3
Bulk
Food & Env ironmental
Protection
Conclusions
•Hydrogen isotope ratio analysis of milk is a potential tool to
identify origin of milk products
•The δ2H values of butyric, myristic, palmitic and oleic acid
enabled discrimination of the region of origin for >90% of
milk samples.
•These measurements convey reliable isotopic information
that can be used to verify origin, provided appropriate
authentic-region reference samples are available.

Food & Env ironmental
Protection
Considerations • Reliable discrimination between different countries and regional
production can be achieved (but not always).
• Technique is most easily applied against a Country of origin labelling
claim (COOL). The general question where is this food from is much
harder to answer.
• As with all statistical techniques the method does not permit
definitive proof – it can only confirm its possible origin at a specified
level of confidence and spatial specificity of the method.
• The reflection of the local climate and geological signal is complex.
Modelling the relationships requires a thorough understanding of the
mechanisms behind the geographical variation of the isotope
patterns in food.
• Isotope mapping as a predictive tool is in its infancy but will play an
increasing role in food forensics and other areas of science that
require the determination of provenance over coming years.


