
SS-05-PF
1
Analysis of Indonesian Labor Welfare !Case Study : Kedah, Malaysia
Totok Sarsito1
1Study of Regional Policies and Institution Sebelas Maret University, UNS
Surakarta, Indonesia [email protected]
Evi Gravitiani and Izza Mafruah2
2Development Economy Sebelas Maret University, UNS
Surakarta, Indonesia [email protected] [email protected]
Abstract�The aims of this research are to know how increase the Indonesian labor (T K I) welfare in K edah, M alaysia. The targets which are reached : (1) identifying and mapping T K I location in K edah, M alaysia, (2) socio-economy analysis and (3) identifying the T K I problems. The methods are spatial and regression method. Geography Information System (G IS) is used to map T K I location. Regression method gives the information of primary factors of T K I that will increase thei r welfare. Spatial analysis is divided by three themes of map: (1) work type, (2) education, experience, age, and family size, (3) remittance, income and migration cost. Socio-economy condition of T K I is good enough. Other important finding is T K I mostly spend thei r money for phone deposit and cigarette. Remittance is a proxy of T K I welfare. I t is significantly influenced by income, education level, family size, and living cost. M eanwhile, age, experience, and migration cost are not influence to remittance.
Keyword : TKI welfare, spatial analysis, socio-economy condition, remittance
I. INTRODUCTION
In 2012 [11], Indonesia-$� & ��"�!)�� %� �$� ��61 million
(6.32%). The labor growth is 2.91 million per year. On the other hand, vocation availability is 1.6 million only, so the gap is 1.3 million. Unemployment education is 20% completed elementary school, 22.6% junior high school, 40.07% senior high school, and 9.7% is under graduated.
The limited of vocation availability in Indonesia makes people willing to work abroad [1]. Government program (AKAN) gives the chance to Indonesian labor (TKI) with special requirement. In 2011, 510.000 TKI worked in many countries.
Malaysia and Singapore are choosen by TKI. Similarity on culture and religion is the reason for almost all TKI. Saudi Arabia becomes another choice as a religious reason. TKI wants to work in Hongkong for the distance and high income, compare to East Middle countries.
Low income per capita countries in South East Asia (ASEAN) is in great quantities of labor supply. Based on Labor Migration Report (2009) [2], labor migrant in ASEAN is 14,799,713 people. Filipina is the highest labor supply, 8,233,172 people. Indonesia is 2,700,000 and Myanmar is 1,840,000. Filip� �-$ labors have high education level and work in formal sector. Meanwhile, labors from Indonesia and
Myanmar have relative low education level, so they work in informal sector. It influences on their welfare.
TKI welfare can be reached from the location choice and life pattern of TKI, such as consumption pattern. By survey � ��� -$��!��%�! ��(���� ��%���#�"#!����$�� ���%����� ��$!�&%�! �alternatives. This research location is Kedah, Malaysia.
Aims of the study are (1) identifying and mapping TKI, (2) analyzing the social-economy condition, and (3) identifying �� -s problems,
II. LITERATURE REVIEW
A. Migration
Migration is a reflection of divergence of the economic growth and uneven-spread of the development. The high economic growth gives higher expectation for the worker. It causes high migration in several areas in Indonesia, from low to high economic growth of the region. Old concept of migration is migration among region or area in one country only [3]. In 1980s, the new concept of international migration is defined: 1. Migration is permanent people movement from one
region to another region. 2. Type of migration is the classification based on spatial
dimension and time dimension. 3. International migration is people movement from one
country to another country. 4. Internal migration is people movement from one region to
another region in one country Based on time dimension, migration is defined [4]: 1. Seasonal migration is people movement from one region
to another region but not permanent. 2. Commuter migration is people movement from urban area
to city/central business district (CBD) for study or regular work, and vice versa.

SS-05-PF
2
Push factor and pull factor influence the migration. The push factors are (1) decrease of life sources, such as carrying capacity and natural resources, (2) decrease of scope of work, (3) disturbance of human right, (4) disaster. On the other hand, the pull factors are (1) new hope for better life, (2) the change of better education, (3) better condition and public facilities, (4) CBD activities. The main factor influence migration is the economic factor [5].
Unemployment and poverty, inadequate infrastructure, a complicated regulatory environment, and regional inequality are all push factors driving international migration. The number of migrant workers deployed from Indonesia is rising and has reached 632,172 in 2009. Adding to this is the large number of irregular migrants leaving the country without going through the formal recruitment scheme. Indonesia is now recognized as having the second largest migrant worker population in South-East Asia, second only to the Philippines [6]. Indonesian migrant workers, the majority of whom are women (79%), are mostly employed in Asia (59%) and the Middle East (41%). Most migrant workers are employed in the informal sector (77%) mainly as domestic workers or laborers. B. Remittance
Remittance refers to the accounting concept of a monetary
payment transferred by a customer to a business. People can exile and send an allowance on condition that they did not return home. A remittance is a transfer of money by a foreign worker to his or her home country. It gives positive impact for #���%%� ����� -$� �%�'��#���! .
Remittances are playing an increasingly large role in the economies of the region, contributing to economic growth and to the livelihoods of less prosperous people. Now days, remittance tends to use for consumerism. It will more useful if remittance is used for productive activities.
Based on this study, remittance are used to : (1) consumption, (2) personal saving in gold and bank, (3) personal or collective investment. The third function is used by TKI as enterpreneur to produce goods and services. Good management of remittance using �� � � �#��$���� -$�(����#���It gives positif impact to both of regional and national economic growth.
C . Previous Research Moniaga study (2008) is about Indonesia Domestic
Migrant Worker [7]. This study shows most of the female migrant workers have low education level, generally only up to primary school, and they come from villages where there is a lack of employment opportunities. The official records state that the ages of the workers are between 18-40 years. However, they can also be girls as young as 14 who travel with falsified passports and other identity documents. The primary reasons, including the push and pull factors, for seeking work abroad as domestic workers can range from:
� Job opportunities overseas are more lucrative (higher wages)
� Financial necessities and desire to support their family
� Escaping rural poverty and the Asian financial crisis � Working as domestic workers requires few skills and
provides free room and board, enabling them to save more money.
� Influenced by family members or friends who have worked or are working abroad.
� Motivated by success stories of other female migrant workers
� Recruited by agents or middlemen (Calo) who convince them to migrate
� To gain skills and other qualifications to make them better candidates for other jobs
� �#��$� �� $!����� �!����%)� � �� (!�� -$� ����$�! -making power within the family.
The migration destinations of female workers have been
changing over the years. In the 1970s, major destination countries were in the Middle East, particularly Saudi Arabia. Around the 1990s, there was a shift towards finding employment closer to home. This regional migration in Southeast Asia and Asia Pacific was characterized by the opening of job opportunities by the government in the host countries, such as China, Singapore, Malaysia, and Hong Kong [2].
III. METHODOLOGY
This study area is TKI in Kedah, Malaysia. TKI is categorized as (1) palm oil plantation worker, (2) construction worker (3) restaurant worker. Geography Information System (GIS) is used to identifying and mapping the TKI location in Kedah. Regression is used to analyze TKI welfare which remittance as a proxy. A. Geography Information System
Standardd procedure of GIS is gathering data, processing
data, constructing database, spatial analysis, and serving the graphical data. Table 1 shows the procedure of GIS.
TABLE I. THE PROCEDURE OF GIS
Gathering data � Give the number in a map, coding, verification, and correction.
� Survey for primary data. Preparation
� Interpret and classify the data � List the structure of digital data for spatial
model � Transform to coordinate system.
Construct the database
� Model from the concept of the data � List of database structure � New procedure implementation � Save the data in database
SS-05-PF
3
Analyze of spatial data
� Call the data based on the location � Call the data based on the class or attribute � Find the good location based on the criteria. � Find the pattern, group, path, and
interaction � Simulation the model on the physical and
social phenomena.
Graphic performance on visualization and inter-action
� Make a map � Gather the data � Show the 3D performance � Make a report
Source: Jones (1996) in [8]
B. Regression Analysis
Social-economy condition is analyzed by quantitative
analysis and regression. Quantitative analysis describes on table and graphic. Regression is used to analyze TKI welfare which remittance as a proxy. The independent variables are income, education, experience as TKI, retirement as TKI. The function is [9]:
REM = f(INC, EDU, EXP, AGE, FAM, BEA) (1)
IV. FINDING AND RESULT
Malaysia is both an origin and a destination country of migrant workers. Despite its economic success in almost all sectors in the last 15 years, Malaysia has experienced structural shortage of labor supply in a number of sectors. As of the end of December 2008, out of a total of 2,062,596 foreign migrant workers in Malaysia, Indonesian workers constituted 52.6 per cent (1,085,658). There are also a large number of irregular Indonesian migrant workers in Malaysia [10]. Indonesian workers are mainly found in certain occupational sectors, such as domestic work (24.83%) and plantation work (25.33%), which they tend to dominate. For the past decade, the Malaysian government has made a conscious effort to reduce dependency on foreign workers from a particular source country by practicing diversification. As a result, the share of Indonesian workers has dropped over the past few years.
The reasons given for migrating to Malaysia were higher salary/better income (abroad) (27%) and difficulty in finding a job in Indonesia (21%). Majority had paid recruitment fees, with the average amount for those paying in Indonesian rupiah being IDR 5.3 million (USD 353) and for those paying in Malaysian ringgit being RM 2,838 (USD 806). To finance the initial migration costs, 70 per cent of workers borrowed money from their own family to cover the pre-departure expenses. However, service workers (58%) and domestic helpers (53%), occupations dominated by female workers, relied more on parties other than their family members to finance their migration costs.
A. Identification and Analysis of Location
The first step in identification and analysis of location is
getting the basic map of research location of Kedah, Malaysia. TKI in Kedah as a research object is located in two regions, Jitra and Changloon. There are 14.44% TKI in Changloon and 85.56% in Jitra. Primary data, which are needed for this analysis, are work type, education, experience, age, family size, remittance, income, and migration cost.
Coding and tabulating data are the next step. It also needs to define the coordinate of Changloon and Jitra in Kedah map. The map is configurated by location, class, and attribute or variable. There are three themes of map: (1) work type, (2) education, experience, age, and family size, (3) remittance, income and migration cost. These themes are based on the correlation between attribute and variable. The theme maps show visualization and interaction of variables in map.
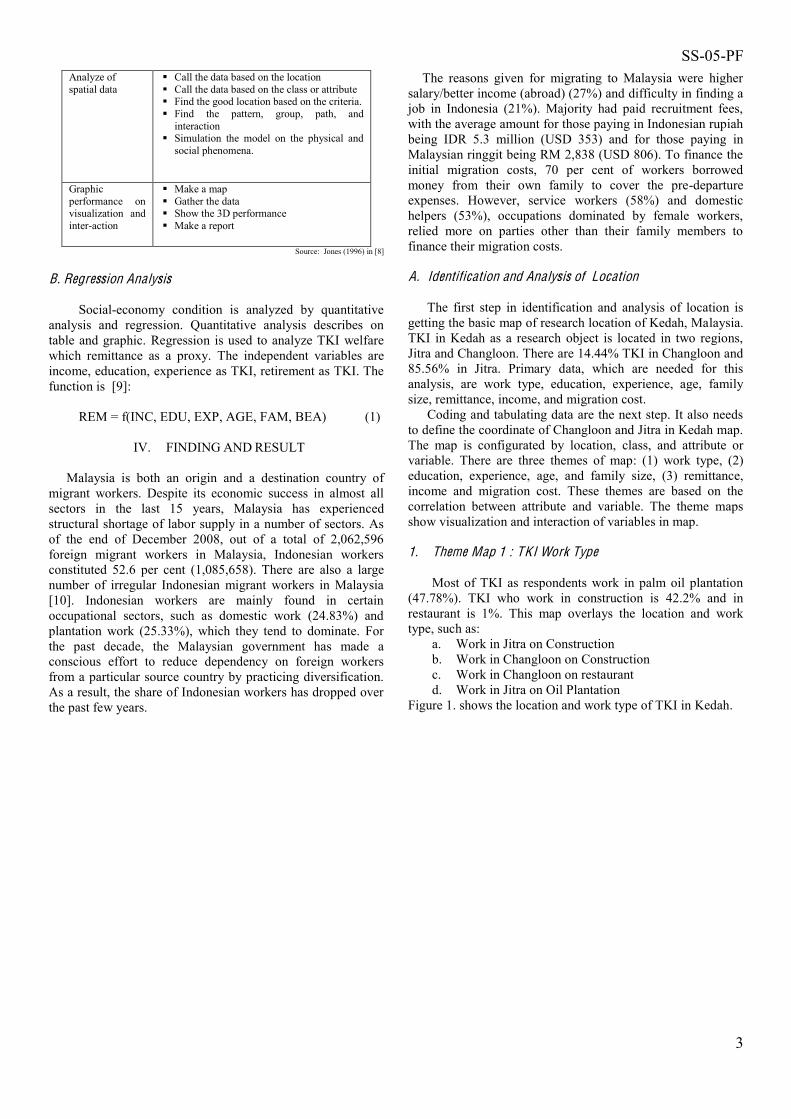
1. Theme Map 1 : TKI Work Type
Most of TKI as respondents work in palm oil plantation
(47.78%). TKI who work in construction is 42.2% and in restaurant is 1%. This map overlays the location and work type, such as:
a. Work in Jitra on Construction b. Work in Changloon on Construction c. Work in Changloon on restaurant d. Work in Jitra on Oil Plantation
Figure 1. shows the location and work type of TKI in Kedah.
SS-05-PF
4
Figure 1. Map of Location and Work type of TKI in Kedah
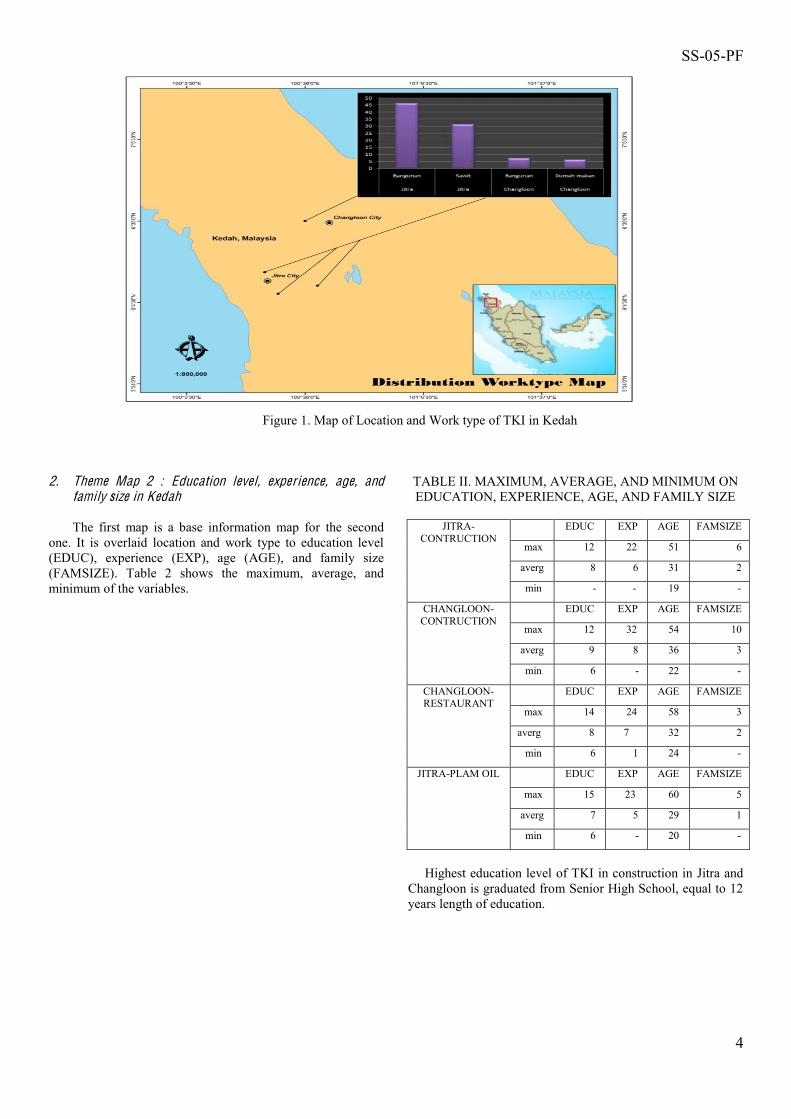
2. Theme Map 2 : Education level, experience, age, and
family size in Kedah The first map is a base information map for the second
one. It is overlaid location and work type to education level (EDUC), experience (EXP), age (AGE), and family size (FAMSIZE). Table 2 shows the maximum, average, and minimum of the variables.
TABLE II. MAXIMUM, AVERAGE, AND MINIMUM ON EDUCATION, EXPERIENCE, AGE, AND FAMILY SIZE
JITRA-
CONTRUCTION EDUC EXP AGE FAMSIZE
max 12 22 51 6
averg 8 6 31 2
min - - 19 -
CHANGLOON- CONTRUCTION
EDUC EXP AGE FAMSIZE
max 12 32 54 10
averg 9 8 36 3
min 6 - 22 -
CHANGLOON- RESTAURANT
EDUC EXP AGE FAMSIZE
max 14 24 58 3
averg 8 7 32 2
min 6 1 24 -
JITRA-PLAM OIL EDUC EXP AGE FAMSIZE
max 15 23 60 5
averg 7 5 29 1
min 6 - 20 -
Highest education level of TKI in construction in Jitra and Changloon is graduated from Senior High School, equal to 12 years length of education.

SS-05-PF
5
Meanwhile, several TKI in restaurant and palm oil plantation had become an undergraduate student. Most of TKI only have education level at elementary school, indeed illiterate. Several TKI experiences more than 20 years and still have Indonesian nationality. In average, their experience is 5-8
years. The age of TKI in Kedah is 30 years. Family size is 2-3 people and 1-3 children. Map of Education, Experience, Age, and Family Size of TK in Kedah is shown on figure 2.
S
Figure 2. Map of Education, Experience, Age, and Family Size of TKI in Kedah
3. Theme Map 3 : Remittance, Income, and Migration Cost of TKI in Kedah
The first map is a base information map for the second
one. It is overlaid location and work type to remittance (REM), income (INC), and migration cost (MIGRCOST). Table 3 shows the maximum, average, and minimum of the variables.
TABLE III. MAXIMUM, AVERAGE, AND MINIMUM ON REMMITANCE, INCOME, AND MIGRATION COST
JITRA-
CONTRUCTION REM INC MIGRCOST
max 3,000,000 7,200,000 12,000,000
aver 1,230,435 3,089,521 4,727,660
min - 1,050,000 2,500,000
CHANGLOON- CONTRUCTION
REM INC TRAV COST
max 3,000,000 4,500,000 5,000,000
aver 2,342,857 3,548,571 1,372,517
min 1,500,000 2,340,000 300,000
CHANGLOON- RESTAURANT
REM INC MIGRCOST
max 1,400,000 3,900,000 10,000,000
aver 1,246,667 1,650,000 4,550,000
min 450,000 1,800,000 300,000
JITRA-PLAM OIL
REM INC MIGRCOST
max 3,000,000 6,000,000 7,000,000
Aver 815,000 2,738,710 4,335,484
min 300,000 1,800,000 5,000,000
Maximum remittance is Rap 3.000.000, - per month. Remittance of TKI in construction is Rp 1.500.000,- - Rp 2.000.000,- per month in average. Maximum income TKI in construction in Jitra is Rp 7.000.00,- per month and Rp 2.000.000,- - Rp 3.000.000,- per month in average.

SS-05-PF
6
Migration cost from the origin to Malaysia is Rp 4.000.000,- - Rp. 5.000.000,-. It includes passport fee, permission fee, airfare ticket, and accommodation.
Figure 3 shows the map on Remittance, Income, and Migration cost TKI in Kedah.
Figure 3. Map on Remittance, Income, and Migration cost TKI in Kedah
B. Social and Economy condition 1. Social Condition
64.6% respondent of TKI is marry, 35.4% respondent is
not married yet or as widow/widower. The average amount of children is two, and almost all of them stay in Indonesia. 14.4% TKI lives with their family in Malaysia because both of husband and wife work in Malaysia.
�!$%�)� �� -$� ���� �$� 20 * 30 years old, as a productive age. 34.44% respondent said that it was the first go to Malaysia to work and 55.56% is not the first. TKI experience is 5.82 years in average, and 32 years is the long TKI experience. It shows TKI pleasant in Malaysia for work and it is supported by Indonesia and Malaysia governments.
TKI level education is 7.42 years in average. It means they only graduated elementary school. Table 4 shows TKI education level in detail.
TABLE IV. TKI EDUCATION LEVEL
Level of education Not graduated SD 6.67% SD 45.56% Not graduated SMP 8.89% SMP 17.78 % Not graduated SMA 2.22% SMA 16.67% Undergraduate 2.22%.
Main reason TKI willing to work in Malaysia is higher
income than works in Indonesia (38.8%). Some other reasons are culture similarity (23.33%), lower migration cost compares to another country (22.22%), and length of distance between
Indonesia and Malaysia, cheap airfare, and also many friends work in Malaysia. Migration cost to Malaysia is Rp 4.223.000,- in average, which is the biggest allocation is permission fee.
2. Economy Conditions
Based on the survey data, TKI income mostly is Rp
2.500.000 * Rp 5.000.000,-. Table 5 shows TKI income, living cost, and remittance.
TABLE V. TKI INCOME, LIVING COST, AND
REMMITANCE
Income (Rp) < 2.500.000 34.44% 2.500.000 * 5.000.000 57.78% 5.000.000 - 7.500.000 6.67% > 7.500.000 1.11%. Living cost (Rp) 1.347. 600 (45.44%) Remittance (Rp) 1.132.550 (38.14%) Saving 16.36%
TKI have saving about 16.36% income. It spends for going
home and back to Malaysia. Saving is also used to back up %���#�� �!���(�� �%��)��� -%�(!#���
They spend income for several needs, such as rent home, food, phone deposit, electricity bill, cigarette, and other expenses. Palm oil plantation provides facilities for TKI who work in. The house is also available for TKI in construction in Jitra, but it is not in Changlon.
SS-05-PF
7
Food is a basic need. Consequently, TKI spend almost half income on it. 31.11% TKI is a smoker. They spend 25.19% income for cigarette.
TABLE VI.TKI EXPENSES
Item Percentage Rent house 9.15% Electricity 2.36%. Food 55.70% Phone 16.66% Health 0.85% Others 6.06% Cigarette 7.84%
C . Determinant Factors
Remittance is a proxy of TKI welfare. It is influenced by
income, education level, experience, retirement, and migration cost. The model is:
Log Rem = �0 + �1 Log INC + �2EDU +�3EXP +�4AGE + �5FAM+�6 Log BEA + Log LCe1 (2)
where : Rem = Remittance INC = Income EDU = Education level EXP = Experience AGE = Retirement age FAM = Family size BEA = Migration cost LC = Living Cost
Primary data is used to analyze TKI welfare. There is 90 respondents are interviewed in field survey in Kedah, Malaysia. Eviews is a statistical program that is used to analyze data. Table 6 shows the regression.
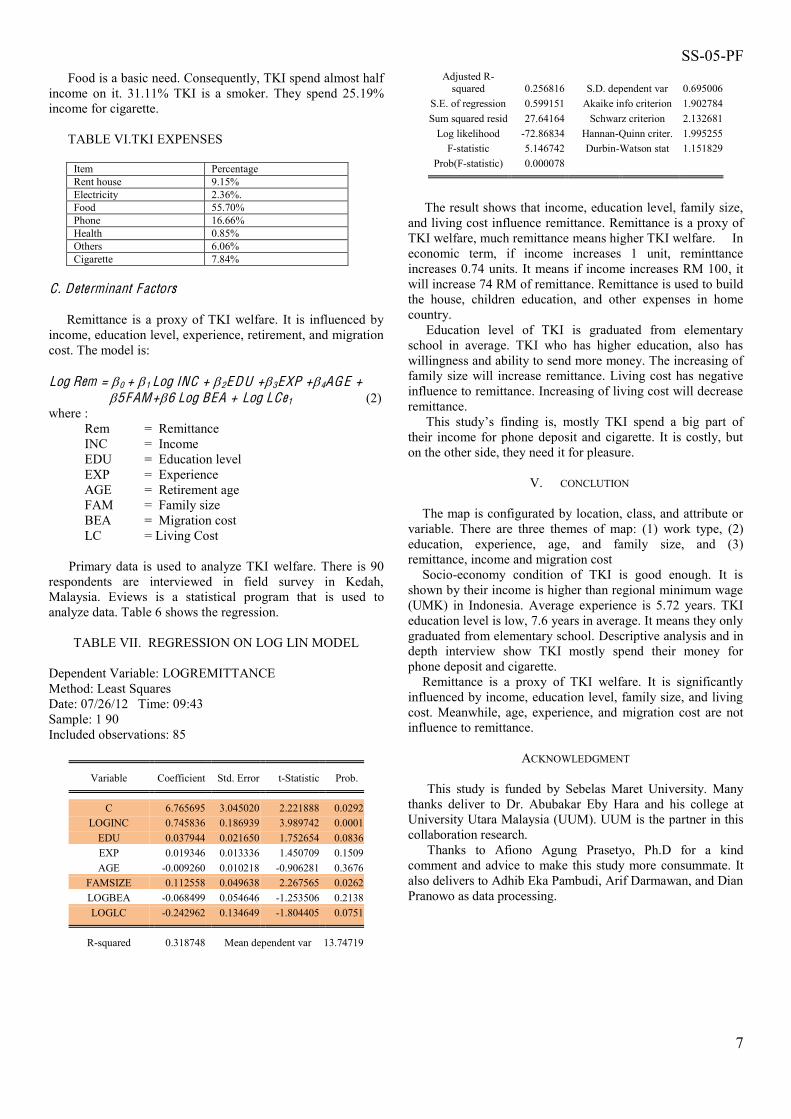
TABLE VII. REGRESSION ON LOG LIN MODEL
Dependent Variable: LOGREMITTANCE Method: Least Squares Date: 07/26/12 Time: 09:43 Sample: 1 90 Included observations: 85
Variable Coefficient Std. Error t-Statistic Prob. C 6.765695 3.045020 2.221888 0.0292
LOGINC 0.745836 0.186939 3.989742 0.0001 EDU 0.037944 0.021650 1.752654 0.0836 EXP 0.019346 0.013336 1.450709 0.1509 AGE -0.009260 0.010218 -0.906281 0.3676
FAMSIZE 0.112558 0.049638 2.267565 0.0262 LOGBEA -0.068499 0.054646 -1.253506 0.2138 LOGLC -0.242962 0.134649 -1.804405 0.0751
R-squared 0.318748 Mean dependent var 13.74719
Adjusted R-squared 0.256816 S.D. dependent var 0.695006
S.E. of regression 0.599151 Akaike info criterion 1.902784 Sum squared resid 27.64164 Schwarz criterion 2.132681
Log likelihood -72.86834 Hannan-Quinn criter. 1.995255 F-statistic 5.146742 Durbin-Watson stat 1.151829
Prob(F-statistic) 0.000078
The result shows that income, education level, family size, and living cost influence remittance. Remittance is a proxy of TKI welfare, much remittance means higher TKI welfare. In economic term, if income increases 1 unit, reminttance increases 0.74 units. It means if income increases RM 100, it will increase 74 RM of remittance. Remittance is used to build the house, children education, and other expenses in home country.
Education level of TKI is graduated from elementary school in average. TKI who has higher education, also has willingness and ability to send more money. The increasing of family size will increase remittance. Living cost has negative influence to remittance. Increasing of living cost will decrease remittance.
���$� $%&�)-$� �� �ing is, mostly TKI spend a big part of their income for phone deposit and cigarette. It is costly, but on the other side, they need it for pleasure.
V. CONCLUTION
The map is configurated by location, class, and attribute or
variable. There are three themes of map: (1) work type, (2) education, experience, age, and family size, and (3) remittance, income and migration cost
Socio-economy condition of TKI is good enough. It is shown by their income is higher than regional minimum wage (UMK) in Indonesia. Average experience is 5.72 years. TKI education level is low, 7.6 years in average. It means they only graduated from elementary school. Descriptive analysis and in depth interview show TKI mostly spend their money for phone deposit and cigarette.
Remittance is a proxy of TKI welfare. It is significantly influenced by income, education level, family size, and living cost. Meanwhile, age, experience, and migration cost are not influence to remittance.
ACKNOWLEDGMENT
This study is funded by Sebelas Maret University. Many
thanks deliver to Dr. Abubakar Eby Hara and his college at University Utara Malaysia (UUM). UUM is the partner in this collaboration research.
Thanks to Afiono Agung Prasetyo, Ph.D for a kind comment and advice to make this study more consummate. It also delivers to Adhib Eka Pambudi, Arif Darmawan, and Dian Pranowo as data processing.

SS-05-PF
8
REFERENCES
[1] W. Zelinsky, +The Hypothesis of The Mobility Transition, Geographical Review,������
[2] IOM Report, +Internastional Migration and migrant workers migration in Indonesia,, 2010, Jakarta
[3] D.S Massey, Arango, Joaquin, G. Hugo,., Ali Kouaouci, A. Pellerino,., J.E Taylor, ,���!#��$� !�� %�# �%�! ��� ���#�%�! � � ��'��(� � ��""#��$��,��Population and Development Review, 1993, 3: 431-466.
[4] E. Lee, , A Theory of Migration,, Demography, 1996, Vol 3 , 1996 [5] Mafruhah, Izza, +Analisis Faktor * Faktor yang mempengaruhi
penawaran TKW di kabupaten Karanganyar,, 2004, penelitian dosen muda Dikti
[6] Todaro, P. ��������� +Migration in Developing Countries,�� �� �'��ILO., 1986
[7] Moniaga Renita, +Indonesian Migrany Domestic works, A case study on Human Rights, Gender and migration�, 2008, Graduate Program In International Affairs (GPIA)
[8] Kuncoro, Mudrajad., +Analisis Spasial dan Regional: Studi Anglomerasi dan Kluster Industri Indonesia,, 2002, UPP AMP YKPN, Yogyakarta.
[9] Kmenta, +Introduction to Econometrics�, Singapore, Mc Grow Hill, 1990
[10] G., Hugo, +Indonesia Labour Migration to Malaysia: Trends and Policy Implication,, Kelantan; Universiti Malaya cawangan, , 1992
[11] �%�%�$%����� ��&#�&�� + �! �$�� � ���!#� ����,�� http://www.bps.go.id/, 2012


