
WSRC-RP-99-01 098
SRTC Input to DOE-H(2 R&D Database for FY99
by
L. R. Chandler Jr.
Westinghouse Savannah River Company
Savannah River SiteAiken, South Carolina 29808
S. A. Budenstein R. G. McCoppin
F. Utsch
E. C. Randall
M. O. Crofts
K. Graves
DOE Contract No. DE-AC09-96SR1 8500
This paper was prepared in connection with work done under the above contract number with the U. S.Department of Energy. By acceptance of this paper, the publisher and/or recipient acknowledges the U. S.Government’s right to retain a nonexclusive, royalty-free license in and to any copyright covering this paper, alongwith the right to reproduce and to authorize others to reproduce all or part of the copyrighted paper.

DISCLAIMER
This report was prepared as an account of work sponsored by an agency of the United StatesGovernment. Neither the United States Government nor any agency thereof, nor any of theiremployees, makes any warranty, express or implied, or assumes any legal liability or responsibilityfor the accuracy, completeness, or usefulness of any information, apparatus, product or processdisclosed, or represents that its use would uot infringe privately owned rights. Reference herein toany specific commercial product, process or service by trade name, trademark manufacturer, orotherwise does not necessarily constitute or imply its endorsement, recommendation, or favoring bythe United States Government or any agency thereof. The views and opinions of authors expressedherein do not necessarily state or reflect those of the United States Government or any agencythereof.
This report has been reproduced directly from the best available copy.
Available for sale to the public, in paper, from: U.S. Department of Commerce, National TechnicalInformation Service, 5285 Port Royal Road, Sprin@leld, VA 22161,phone: (800) 553-6847,fax: (703) 605-6900email: [email protected]. govonline ordering: http :Ilwww.ntis.govlordering.htm
Available electronically at http://www.doe.gov/bridgeAvailable for a processing fee to U.S. Department of Energy and its contractors, in paper, from:U.S. Department of Energy, Office of Scientific and Technical Information, P.O. Box 62,Oak Ridge, TN 37831-0062,phone: (865)576-8401,fax: (865)576-5728email: reports@adonis. osti.gov

DISCLAIMER
Portions of this document may be illegiblein electronic image products. Images areproduced from the best available originaldocument.

WSRC-TR-99-O0407October 25,1999
OPERATIONAL RESTORATION OF THE PEN BRANCH BOTTOML~NDHARDWOOD AND SWAMP WETLANDS-THE RESEARCH SETTING
Eric A. Nelsonl, Neil C. Duloheryz, Randall K. Kolkaq, William H. McKee Jr.A
1 Savannah River Technology Center, Westinghouse Savannah River Company, Aiken,South Carolina 29808
z Forest Research Center, Jefferson Smurfit Corporation, PO Box 626, Callahan, Florida32011
s Department of Forestry, University of Kentucky, Lexington, Kentucky 40546AUS Forest Service (retired), 501 King Rd., Dunlap, Tennessee 37327
Address correspondence to (EAN): Phone: (803) 725-5212; FAX (803) 725-7673;E-mail: [email protected]
ABSTRACT
The Savannah River Swamp is a 3020 Ha forested wetland on the floodplain of the
Savannah River and is located on the Department of Energy’s Savannah River Site (SRS)
near Aiken, SC. Historically the swamp consisted of approximately 50 % bald cypress-
water tupeIo stands, 40 % mixed bottorrdand hardwood stands, and 10% shrub, marsh,
and open water. Creek corridors were typical of S&theastern bottornland hardwood
forests. The hydrology was controlled by flooding of the Savannah River and by flow
from four creeks that drain into the swamp prior to flow into the Savannah River.
Upstream dams have caused some alteration of the water levels and timing of flooding
within the floodplain.
Major impacts to the swamp hydrology occurred with the completion of the production
reactors and one coal-fired powerhouse at the SRS in the early 1950’s. Water was

WSRC-TR-99-O0407October 25,1999
pumped from the Savannah River, through secondary heat exchangers of the reactors,
and discharged into three of the tributary streams that flow into the swamp. Flow in one
of the tributaries, Pen Branch, was typically 0.3 ms s-l (10-20) cfs prior to reactor
pumping and 11.0 ms s-l (400 cfs) during pumping. This continued from 1954 to 1988 at
various levels. The sustained increases in water volume resulted in overflow of the
original stream banks and the creation of additional floodplains. Accompanying this
was considerable erosion of the original stream corridor and deposition of a deep silt
layer on the newly formed delta. Heated water was discharged directly into Pen Branch
and water temperature in the stream often exceeded 65 degrees C. The nearly
continuous flooding of the swamp, the thermal load of the water, and the heavy silting
resulted in complete mortaIity of the original vegetation in large areas of the floodplain.
In the years since pumping was reduced, early succession has begun in some affected
areas. Most of this has been herbs, grasses, and shrubs. Areas that have seedlings are
generally willow thickets that support a lower diversity of wildIife. No volunteer
seedlings of heavy-seeded hardwoods or cypress have been found in the corridor areas.
Research was conducted to determine methods to reintroduce tree species characteristic
of more mature forested wetlands. Three restoration strategies were formulated to deal
with the differing conditions of the Upper Corridor, the Lower Corridor, and the Delta
regions of the impacted area. Site preparation and planting of each area with mixtures
of tree species were carried out to speed the restoration of the ecosystem. Species
UNCLASSIFIEDDOES NOT cOWAIN
UNCLASCLASE~~&~
A(X &
OfficM
Olta

WSRC-TR-99-O0407October 25,1999
composition and selection were altered based on the current and expected hydrological “
regimes that the reforestation areas will be experiencing.
Because of the operational design of the restoration project, a research program
naturally followed to document the success. Many of those efforts are detailed here.
KEYWORDS
Wetland restoration, Pen Branch, mitigation, bottomland hardwoods, site preparation,
planting, riparian and swamp habitats
INTRODUCTION
Pen Branch is a small, 3rd order stream whose watershed lies entirely within the
boundaries of the Savannah River Site (SRS), a U.S. Department of Energy (DOE)
nuclear materials facility (Figure 1). Pen Branch flows into the Savannah River swamp,
a mosaic of bottomland-hardwood and cypress-tupelo forests. Between 1950 and 1954,
the DOE constructed a nuclear reactor, K Reactor, adjacent to a first order tributary of
Pen Branch, Indian Grave Creek. Heat was dissipated from the reactor’s internal
closed-loop cooling system by pumping water from the Savannah River across a heat
exchanger, eventually discharging the heated water into Indian Grave Creek.

. ‘>.
WSRC-TR-99-O0407October 25,1999
K Reactor began discharging thermal effluent into the Indian Grave/ Pen Branch
system in 1954. The reactor’s contribution to strearnflow varied temporally, but was
consistently 1 to 2 orders of magnitude greater than the stream’s base flow of 0.3 ms s-l
(Figure 2). The average annual temperature of the effluent varied up to a maximum of
70°C. Thermal discharges ended in 1989. At present, non-heated water is being added
at the rate of about 0.006 mq s-l, or less than 5% of the estimated base flow rate.
In 1951, the Savannah River Swamp and Pen Branch corridor was a closed canopy
forests. During the early years of reactor operation, as temperatures and outflow rates
increased, flooding and scalding progressively deforested the corridor. By 1961, canopy
defoliation was apparent throughout 113 ha of the corridor and 4.5 ha of the delta
(Wike et al., 1994). From 1961 to 1989, the thermal effluent gradually denuded a fan-
shaped delta in the Savannah River swamp forest and a narrow “tail” of concentrated
flow to the southeast toward Steel Creek, near the swamp’s upland boundary (Figure
3). The area of severe canopy loss in the delta reached its maximum extent of about 152
ha in the mid-1980’s (Wike et al., 1994). Due to the inflow of water from Pen Branch, the
delta area had been poorly drained even before 1951, supporting a cypress-tupelo
swamp surrounded by more elevated mixed bottornland hardwood areas.
As the thermal discharges and flooding declined after 1988, early-successional plants
rapidly colonized the corridor and delta. By the early 1990’s, dense thickets of black
willow (Salix nigm), with minor elements of black alder (Ah-u serndahz), wax myrtle
4

,,~ ,*
WSRC-TR-99-O0407October 25,1999
(Myrica cer+mz), button bush (Ceplzah.dzus occidenhlis), and sumac (Rhus sp.) occupied
much of the upper corridor. A few red maple (Acer ruh.mz) were present, but there was
virtually no regeneration of other species typically present as large canopy trees in
mature bottomland forests. These species failed to regenerate because the prolonged
thermal discharges had eliminated seed sources and living root stocks from the
floodplain— and there were few hydrophytic trees in the adjacent uplands.
Natural regeneration was also scant in the delta. Even after the thermal discharges had
ceased, most of the delta remained continuously flooded and was colonized by a
mixture of cattails (Typha ldzfolia) and bulrush (Sch-pUs sp.). Continuous flooding
precluded germination of bald cypress (Taxodizm disticlum) and water-tupelo (Nyssa
aquafica) seeds, which may have disseminated into the area. Dry periods are required
for widespread seed germination in cypress/tupelo swamps. Sharitz and Lee (1985)
have attributed some forest regeneration failures in the Savannah River floodplain–
where the Pen Branch Delta is located – to the absence of historically frequent dry
periods after the installation of dams upstream on the Savannah River. Sediment
deposition during reactor operations may also have altered the delta’s hydrology.
REFORESTATION OBJECTIVES
.—
As a result of an environmental impact statement concerning, in part, continued
operation of K Reactor, the DOE (1991) decided to mitigate impacts both from potential

WSRC-TR-99-O0407October 25,1999
thermal discharges before completion of a cooling tower and from continued discharges
at ambient stream temperatures. In a record of decision published in the Federal
Register, the DOE (1991) targeted 69 ha of land in the Indian Grave / Pen Branch
Corridor and 202 ha in the Pen Branch delta for mitigation due to historical impacts.
Westinghouse Savannah River Company subsequently developed a mitigation strategy
(Nichols, 1992).
The primary mitigation objective was to accelerate the establishment of wetlands that
had adversely been impacted by the reactor operations. This would entail the return of
a bottornland-hardwood ecosystem in the Pen Branch corridor and a cypress-tupelo
ecosystem in the delta. As a result of that effort, the functionality of the wetland
ecosystem would be re-established and the biodiversity of the area would be increased
to natural levels. In developing specific mitigation objectives, two constraints were
agreed upon among the parties involved:
1) Only those areas judged not to be revegetating satisfactorily would be replanted
with indigenous bottornland tree species appropriate for the local soils and
hydrology (Nichols, 1992).
2) Some portions of the corridor and delta would remain in non-treated control
strips to a) provide reference areas to judge the effectiveness of mitigation
6

!,- ,.
WSRC-TR-99-O0407October 25,1999
measures, b) enhance scientific interest in the project, and c) leave some habitat in
an early succession state for certain wildlife species.
PROJECT-AREA BOUNDARIES
The northern boundary of the Pen Branch restoration is a powerline right-of-way
crossing Pen Branch about 200 m south of Risher Pond Road (SRS Rd. A-13.2). From
this point northward to K Reactor, the floodplain was sufficiently well drained to
permit regeneration of facultative wetland tree species present in the adjacent uplands.
The area targeted for artificial regeneration included a stream reach 2.5 km in length
with a floodplain varying in width from 100 to 300 m, and a denuded delta region into
which Pen Branch flows. About 53 ha along the fringes of this delta were regenerating
naturally with bald cypress and water tupelo (Figure 1).
The boundary between the naturally-regenerating and more deficient areas of the delta
was determined by ground reconnaissance and visual inspection. Aerial photographs
were of little use in locating natural regeneration in this area due to a lack of distinctive
patterns or shading, and the small size of the seedlings. A variety of regeneration was
present in the fringe, including seedlings, saplings and recovering snags. Densities.
varied considerably but were judged to be sufficient for the development of a closed
canopy forest. The natural regeneration boundary was usually distinct, with virtually
no volunteer seedlings in the continuously flooded central delta

WSRC-TR-99-O0407October 25,1999
Within the artificial-regeneration area, 3 treatment zones were identified (Figure 1),
based upon the differing species mixtures and silvicukural treatments required for the
conditions of each zone (Table 1). The areas differed in hydrology (Figure 4) and
species and density of current vegetation. The Upper Corridor was a mesic bottomland
vegetated with dense black willow stands, the Lower Corridor was a poorly drained
bottornland and vegetated by grasses and herbs, and the Delta was a swamp vegetated
by cattails and bulrushes with some scattered willow on ridges.
Twenty-five percent (21 ha) of the total artificial regeneration area (85 ha) was reserved
in 8 non-treated, non-planted control strips (Figure 1). These were established several
months before planting in each section by placing pin flags along the boundaries and
clearing all vegetation in 5 m wide swaths across the corridor. These areas would serve
as untreated, unplanted controls to continue the natural recovery timetable for the
ecosystem and assess the impact of active restoration.
.
The boundaries between areas were initially maintained by annual clearing and
herbicide application. However, in 1995-96, the boundaries were monumented with
high-visibility markers and cleared only where necessary for access. At both ends of
each control line (upland/floodplain boundary in the corridor), is a 13 cm diameter
white PVC pipe, 2 m in height. At the base of each pipe, is a steel bar with at least 50 cm
above ground for relocation in case of fire. End points of control lines in the delta were
8

Y. . ,.
WSRC-TR-99-O0407October 25,1999
marked with 13 cm diameter piping, 3 to 4 m in height. Adjacent to each pipe is a
grooved aluminum pipe, 1 to 2 m in height for relocation in case of fire.
SITE PREPARATION AND PLANTING
The sites were prepared and planted during the period from winter 1992-93 the winter
1994-95 (Table 2). The lower corridor was planted in February and March of 1993, the
1 upper corridor in January of 1994, and the delta in January and February of 1995. Also
in 1995, the upper and lower corridors were inter-planted to compensate for mortality,
which was revealed in the 1994 stocking survey (discussed later). For each area, site
preparation and species mixtures were varied to suit local conditions. Each year’s
activities are described below.
Winter 1992-93
Only the lower corridor was planted in the winter of 1992-93. In this area, there were
frequent grassy openings in the sparse willow cover, and intensive site preparation
would have provided little benefit. Most of the species to be planted were at least
moderately shade tolerant. The target planting density was 747 trees ha-l (303 at-l), on
a square spacing of 3.66 m (12x 12 ft). Three sections, totaling 11.6 ha, were planted in
February and March of 1993. These were separated by control strips 60 m in width.
Approximately 8,700 trees were planted in this section. The 5 species used were

., . .
WSRC-TR-99-O0407October 25,1999
cherrybark oak (Quercus pagodaejtdiu), swamp chestnut oak (Q. rnichmxii), green ash
(Fraxinus penrzsylvanica), water tupelo, and bald cypress. All seedlings were purchased
from the Central Florida Lands and Timber Nursery, Mayo, FL. Seed sources were
reportedly in southern Georgia. The seedlings were 1-O bare root, averaging about 80
cm in height. Roots were dipped with a water-retaining gel (AgrosokeTM) in the field
before planting.
Winter 1993-94
Only the upper corridor was planted in 1994, after applying a wetland-approved
herbicide to control dense willow competition and burning to clear brush and vines.
Seedlings were produced from seeds collected under contract for the Forest Service
from the South Carolina Coastal Plain.
In the upper corridor, a virtually unbroken willow thicket intertwined with blackberry
and other vines had developed by the earIy 1990’s. Little light penetrated to the forest-
floor, which appeared unsuitable for the growth of even shade-tolerant trees. In order
to moderate competition and improve access for planting crews, sections of the upper
corridor to be planted were prepared by aerial herbicide application and prescribed
burning. The herbicide RodeoTM (Monsanto Co., St. Louis, MO) was applied aerially
September 18,1993 by a helicopter equipped with a microfoil boom, which was
designed to produce negligible drift, to apply the herbicide immediately above the
10
on
..- ,.
WSRC-TR-99-00407October 25,1999
canopy. Rodeo was applied at the recommended rate of 5.8 liters ha-l (5 pts at-l).
Boundaries between control strips and planted areas were marked for easy visibility to
the pilot. The herbicide application controlled 95 to 100% of the willows, with a few
small isolated areas missed by the spraying. The herbicide was also highly effective
against button bush and wax myrtle. Most red maples were resistant to the herbicide
and survived.
In late November of 1993, the 3 sections of the upper corridor to be planted – where the
herbicide had been previously applied – were burned. Burning cleared 70 to 80% of the
understory, rendering the upper corridor easily accessible to planting crews. A
blackened, ash forest floor resulted in most areas. Fire was often stopped by streams,
trails, and wet depressions, so personnel moved throughout the area igniting the
understory with drip torches where needed. Using a bulldozer, fire lines were
extended from the control strip boundaries to the roads paralleling Pen Branch to
prevent fire spreading in the understory of adjacent hardwood stands.
Site preparation radically altered the appearance of the upper corridor, producing a
savanna-like. condition with scattered surviving maple 5-10 m in height and a lush
understory. Woody debris fell into backwater channels and sloughs. In the summers of
1994 and 1995, aquatic macrophyte densities appeared to increase dramatically in the
upper corridor and downstream, perhaps in response to both greater light availability
and nutrient fluxes from the cleared area.
11
WSRC-TR-99-O0407October 25,1999
., . . .
The target planting density in the upper corridor was 747 trees ha-l (303 at-l), on a
square spacing of 3.7 m (12 ft). Three sections, totaling 18.3 ha, were planted from Dec
27,1993 to Jan 4,1994. These sections were separated by control strips 90 to 120 m in
width. A total of about 13,700 trees was planted. The 6 major species planted were
swamp chestnut oak, cherrybark oak, water oak (Q. nigra), water hickory (Cmya
aquafica), green ash, and persimmon (Diospyros vir-~”rziana).Small quantities of swamp
tupelo (Nyssa syhatica var. biflora), water tupelo, and bald cypress were also planted.
All seedlings planted in 1993-94 originated from seed collected on the South Carolina
Coastal Plain. The majority were grown at the Georgia Forestry Commission’s Flint
River nursery. All seedlings were 1-0 bare root. They were stored at the Savannah
River Forest Station in a refrigerated cooler and transported to the field on an open
trailer covered with a tarp.
Unfortunately, clearing and burning the understory appeared to induce severe
herbivory of the seedlings by feral hogs (Mayer et al., 1999). In many areas, virtually all
of the freshly burned ground was rooted. The feral hogs also browsed along the rows
of seedlings, uprooting them, and biting off the tap roots. A survey conducted the
following spring would show that over 2/3 of the planted seedlings, and nearly all of
the oaks, were lost before the beginning of the first growing season. Severe feral hog
herbivory occurred exclusively in burned areas and has not been a significant problem
12

\
..” .-
WSRC-TR-99-O0407October 25,1999
elsewhere. Recovery of the herbaceous understory in the following growing season
provided cover for seedlings and ameliorated herbivory. Feral hog activity has not
been a significant problem since.
Winter 1994-95
The delta was planted in 1995, the upper corridor was replanted, and the lower corridor
was inter-planted to compensate for mortality. Site preparation was limited to applying
herbicide in about 12 ha of the delta where there were dense willow thickets.
By the early 1990’s, heavy willow thickets had developed on alluvial deposits and
channel levees at the mouth of Pen Branch, in the north-central and northwestern parts
of the delta. It was felt that a herbicide application here would be advantageous for the
growth of cypress and tupelo. In late September of 1994, herbicide was applied in the
delta’s central planting strip (area O, figure 1) and portions of the western-most
planting section (area Q figure 1), keeping well clear of natural regeneration near the
fringe. The spray area was marked for high visibility from the air with large plastic
flags attached to the top of bamboo poles. The contractor and aircraft were the same as
in the previous year. The tank mixture was the same as that of the previous year,
except that Rodeo was applied at the rate of 4.7 liters ha-l (4 pts at-l).
13

. . . . .
WSRC-TR-99-O0407October 25,1999
The treatment was 90 to 100% effective against willows in the central planting strip. In
the more poorly drained western planting section, however, the herbicide was less
effective. Poor drainage may have diminished the herbicide’s efficacy or the coverage
may have been uneven. In this area, the aircraft was forced to fly about 30 to 50 m
above the canopy to avoid cypress snags. Aerial photos and ground reconnaissance
showed an abrupt, clear boundary of willow mortality at the edge of the intended spray
area.
The target planting density for most of the delta was 1078 trees ha-l (436 at-l) on a
square spacing of 3 m (10 ft). In the southeastern delta, however, 4.9 ha were conceded
to the contractor as unplantable by a normal hand-planting crew. This area (part of M,
Figure 1) was later planted by Forest Service personnel at an approximate spacing of 3 x
6 m (10x 20 ft) and density of about 500 trees ha-l. It was characterized by deep,
unconsolidated muck soils and standing water. Some parts were reached using snow
shoes, and favorable microsites were chosen for planting. Because of its exceedingly
poor drainage, this area will probably support only a sparse tree canopy with some
open water. About 35,000 trees were planted on a total of 34.6 ha in the delta. The 3
species planted were water tupelo, bald cypress, and green ash. The ash were confined
to better drained willow ridges. The planting was performed from mid-January to mid-
February of 1995.
a shovel.
Seedlings were inserted directly into the muck or dibble planted with
14
. . . . .
WSRC-TR-99-O0407October 25,1999
Feral hog herbivory and other sources of mortality left only 230 of the 747 trees ha-l
originally planted in the upper corridor by the start of the first growing season. This
density, especially with future mortality, was inadequate for the development of a
closed canopy forest. Therefore, the upper corridor was inter-planted with an
additional 1078 trees ha-l on a square spacing of 3.0 m (10 ft). Assuming that the target
planting density was achieved, a total of 19,800 trees were added. The 8 species planted
were cherrybark oak, water oak, green ash, sycamore (Platanus oc&.ientalis), pignut
hickory (Carya glabra), shumard oak (Q. slumumiii), water hickory, and swamp tupelo.
Although 476 of the 747 trees ha-l originally planted in the lower corridor remained
after the first growing season, an additional 549 were added to compensate for future
mortality and bring stocking in all areas to similar levels. Assuming that the desired
density was planted, a total of 6,300 seedlings were added. The density of newly
planted seedlings on 23 inspection plots in this area averaged 627 ha-l, 14% over the
objective. The 5 species planted were bald cypress, green ash, cherrybark oak, water
tupelo, and swamp tupelo.
All seedlings planted in 1994-95 were 1-0 bare-root grown from locally collected seed
sources, except for 6,0002-0 bald cypress. The 2-O cypress were purchased from
inventory of the Flint River Nursery that had been unsold the previous year, and were
from a southern Georgia seed source. These larger seedlings were purchased to
accommodate deep water areas and the severe herbaceous competition of the delta.
15

WSRC-TR-99-O0407October 25,1999
Seedlings were transported to the work site in the bed of a pickup truck and were well
covered by a reflective tarp prior to planting.
. . . .,
REGENERATION STOCKING SURVEYS
The limited objective of this monitoring effort was to quantify the abundance and size
of desirable regeneration, artificial or natural, in the planted and control areas.
Desirable species were defined as those typically present as large canopy trees in
bottornland-hmdwood and cypress-tupelo forests. Specifically excluded were black
willow, black alder, button bush, and wax myrtle, which were present at undesirably
high densities. Others species such as sumac were excluded because they are minor or
atypical components in mature bottomland-hardwood forests. The initial survey was
conducted in 1994, with more intensive surveys conducted in 1996 and 1997.
In the 1994 survey, sixty-six circular plots, 0.04 ha (0.1 ac) in area, were established
randomly throughout the upper and lower corridor —with four plots in each control
section and variable numbers in the planted sections, depending upon their planted
acreage. No plots were established in the delta, as it had not yet been planted at the
time of the survey.
The vegetation plots were measured in the spring of 1994. On each plot, all planted
trees were marked with red pin flags. Volunteers of desirable species were marked
16

.,. -
WSRC-TR-99-00407October 25,1999
with blue and white, striped flagging tape.
not previously been planted in the section.
Volunteers were defined as species that had
The plot center was marked with an
aluminum pole. The top of each pole was painted orange, and. a metal tag with the plot
number was attached to each pole. The number of planted and volunteer trees on each
pIot was recorded by species. The current height and estimated height at the time of
planting were recorded for each species. Abundance of desirable regeneration by
treatment area, species, and origin--planted or volunteer--was calculated with the FREQ
procedure of SAS statistical software (SAS Institute, 1990).
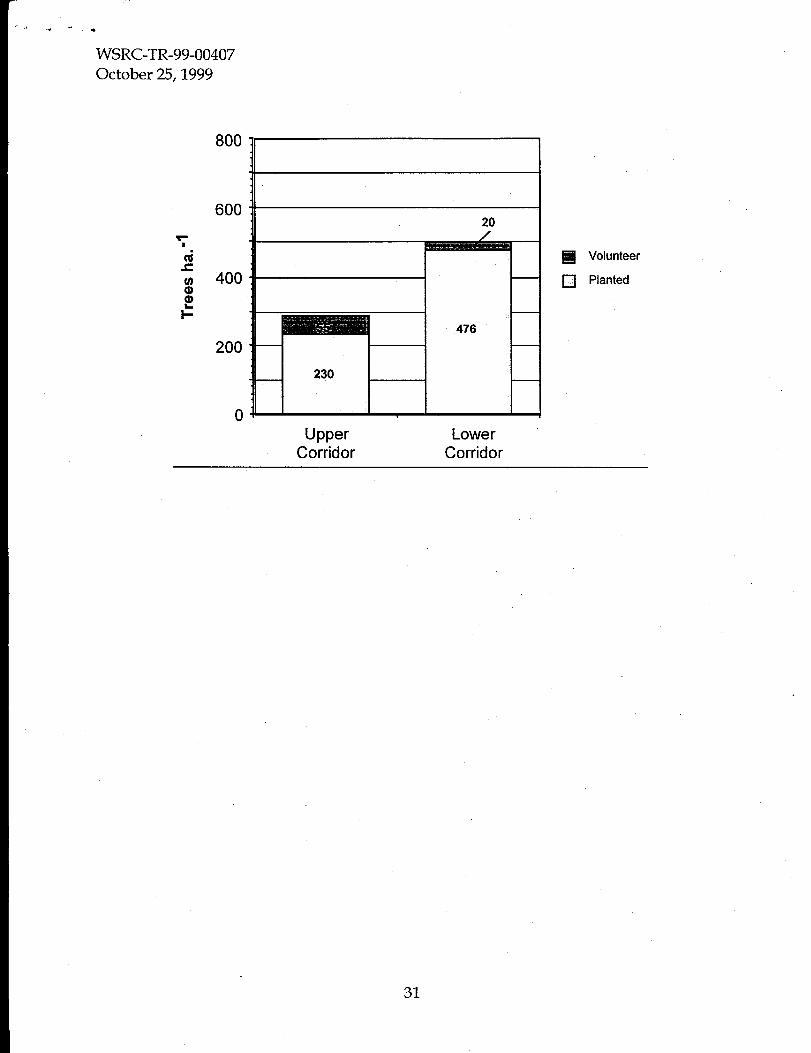
The spring 1994 survey revealed severe losses to feral hog herbivory in planted sections
of the upper corridor (Figure 5). The mean density of 285 planted and volunteer trees
per hectare was probably insufficient to support the development of a closed canopy
forest – especially when allowing for future mortality. About 17% of the upper corridor
had no remaining planted trees. These results lead to our decision to replant this area
in 1995.
This survey also showed that sparse natural regeneration of a few desirable species was
a small, but potentially important contribution to stand development. There were
approximately 37 red maple sterns ha-l in planted sections of the upper corridor, and
another 17 stems ha-l, consisting of sweetgum (Li@danzhu sfyraci@a), sycamore, red
bay (Persia borbonitz),laurel oak (Q. lauri$blia), and loblolly pine (Pinus taeda). All of these
occur to some extent in bottornland forests and will complement the suite of planted
17

WSRC-TR-99-O0407October 25,1999
species. Natural regeneration was less abundant in planted sections of the lower
corridor, which were more poorly drained. Virtually all volunteers in the lower
corridor, only 20 ha-l total, were red maples, with a few scattered pines. No other
desirable species were found in the lower corridor.
A follow-up survey that also included the delta was conducted in the spring of 1996
(Kollsa and Trettin, 1997). It was intended to assess the survival of the initial delta
planting and the replanting success of the corridor. During this survey, a total of 151
plots were measured throughout the restoration area. As in the earlier survey, all
desirable species were recorded in each plot and analyzed within each of the designated
areas. Results of-tie survey indicated good survivalship of planted seedlings with all
section means in the planted areas over the desired level of 500 trees ha-l set by the
Forest Service (Table 3). Approximately 12% of the seedlings were volunteers from
species that had not been planted. Variability among plots was examined and a larger
survey was designed to more accurately reflect the actual stocking of the restoration the
following year.
In the spring of 1997, a total of 528 circular 0.008 hectare plots were measured in the
planted and unplanted areas of the corridor and delta. An additional 63 plots were
measured in the natural regeneration areas around the delta perimeter. As in prior
surveys, stocking level of desirable species in all the planted areas was determined from
these plots. Planted areas in the upper corridor averaged 401 trees ha-*, the lower
18

. . . . .
WSRC-TR-99-O0407October 25,1999
corridor 405 trees ha-l, and the delta 522 trees ha-l. These seedling establishment rates
fall within the range of 300 to 900 stems per hectare reported for densities in
unimpacted bottomland systems for the region (Megonigal et al., 1997). In the 1996
survey, the planted and naturally regenerating delta regions were considered together.
In the 1997 survey, they were considered separately, thus accounting for the drop in the
delta stock~g. The density of the naturally regenerating area around the delta was
highly variable, but averaged 1750 seedlings per hectare. From the survey results, it
appears that bald cypress is established throughout the floodplain and delta with water
tupelo and green ash performing well in the wetter lower corridor and delta. Swamp
chestnut oak and persimmon, species more typical of somewhat less inundated
bottornland hardwood conditions, are surviving well in the drier upper corridor,
Species diversity reflects the species planted as well as the early successional volunteers
that have seeded in. It appears that the future Pen Branch forest canopy will be similar
in composition to the pre-disturbance canopy (Sharitz et al., 1974).
SUMMARY
From the results of the regeneration surveys, it appears that Pen Branch is on a course
towards becoming a mixed bottomland hardwood system in the corridor regions and a
cypress-tupelo swamp in the delta regions. Stocking levels are similar, or slightly
greater, than unirnpacted areas of similar habitat type on the SRS. The results of tree
planting can be seen soon after the restoration effort, however, because of the longevity
19

WSRC-TR-99-O0407October 25,1999
of tree species, the long-term success will require many more years to confirm.
Continued monitoring of the vegetation will be necessary to document the continued
development of the community since it is still in the early stages of restoration. The
point-in-time where the system becomes self-sustaining is the end-point of the
restoration.
There have been relatively few bottomland hardwood restoration projects of this size in
the southeast and none that have started with post-disturbance conditions as severe as
those in Pen Branch. While the early information indicates that the primary objective of
the restoration is being met, the information provided by the research on different
components of the ecosystem show that we have done more than re-establish tree
species. As shown by the breadth of research that will be reported during this
workshop on the Pen Branch corridor and delta, the focus is on the assessment of
ecosystem level processes that are occurring as restoration and succession proceed. The
physical layout of the control and restored strips, along with the ecological gradient
from the upper riparian corridor to the delta swamp, have provided an excellent
research vehicle for investigations into many disciplines. These studies are providing
data on productivity and biodiversity of many of the biotic components of the system.
In many cases, diversity and productivity are above expected reference values. Other
studies are looking at the abiotic components of the system to describe the return of
biogeochernical functions to the restored ecosystem. Most indicate that in addition to
the establishment of a wetland forest, we are also returning many of the other normal
20
.
WSRC-TR-99-O0407October 25,1999
wetland functions to the Pen Branch ecosystem. Many of these studies are included in
this volume.
Comparisons of populations and processes across successional gradients and treatments
have allowed the effect of disturbance and restoration activities to be evaluated.
Knowledge gained from these studies will enable future restoration efforts to be more
efficiently and effectively performed and evaluated. For restoration to be considered
effective, wetIand functions need to be restored or at least on a trajectory where
restoration of those functions is probable. To develop easily measurable indicators of...-
wetland functions that wilI predict future conditions, interactions between abiotic and
biotic processes need to be investigated. With the integration of the results of
monitoring and research, we are beginning to get a better picture of the biotic and
abiotic parameters that have the most promise as wetland function indicators.
ACKNOWLEDGEMENTS
This research was funded by DOE contract number DE-AC09-96SR18500. Numerous
technicians and field personnel were indispensable in getting the study area installed
and ready for the research effort that was to follow. To alI those who have
participated, a heart-felt thank you.
21

WSRC-TR-99-O0407October 25,1999
REFERENCES CITED ,
Christensen, E.J., M.E. Hodgson, J.R. Jensen, H.E. Mackey, and R.R. Sharitz. Pen Branch delta
expansion. Environmental Sciences Division, DuPont Savannah River Laboratory. DPST-
83-1087, 1984; 19p.
Department of Energy. Record of decision continued operation of K, L, and P Reactors,
Savannah River Site, Aiken, SC. Federal Register, 1991; 56(28):5584-5587.
I Kolka, R.K. and C.C. Trettin. WetIands research related to the Pen Branch restoration effort on
the Savannah River Site. 1996 Annual Report. Westinghouse Savannah River Company,
WSRC-TR-97-O0273, 1997;,24 p.
Mayer, J.J., E.A. Nelson, and L.D. Wike. Selective depredation of planted hardwood seedlings
by wild pigs in a wetland restoration area. Sci. of the Total Envir, 1999; this issue.
Menonigal, J.P., W.H. Conner, S. Kroeger, and R.R. Sharitz. Aboveground production in
Southeastern floodplain forests: A test of the subsidy-stress hypothesis. Ecolo~, 1997;
78:370-384.
Monsanto Company. Rodeo aquatic herbicide: complete directions for use in aquatic and other
sites. Monsanto Company Agricultural Products, St. Louis, Missouri, 1990.
22

‘.- .
WSRC-TR-99-O0407October 25,1999
Nichols, D.M. Program implementation plan for mitigation action plain 1992 annual update.
Westinghouse Savannah River Company, Reactor Environmental Management, Aiken, SC.
RRD-OAM-911515, 1992.
SAS Institute. SAS procedures guide, version 6, third edition. SAS Institute Incorporated, Cary,
NC., 1990.
Sharitz, R.R., J.E. Irwin, and E.J. Christy. Vegetation of swamps receiving reactor effluents.
Oikosr 1974; 25:7-13.
Sharitz, R.R. and L.C. Lee. Limits on regeneration processes in southeastern riverine wetlands.
In riparian ecosystems and their environment reconciling conflicting uses. First North
American conference, April 16-18,1985, Tucson, Arizona. General technical report RM-120,
Rocky Mountain Forest and Range Experiment Station, USDA Forest Service, Ft. Collins,
CO.,1985; pp. 139-160.
Wike, L.D, R.W. Shipley, J.A. Bowers, A.L. Bryan, C,L. Cummins, B.R. del Carmen, G.P. Friday,
J.E. Irwin, H.E. Mackey, Jr., J.J. Mayer, E.A. Nelson, M.H. Paller, V.A. Rogers, W.L. Specht,
and E.W. Wilde. SRS ecology environmental information document. Westinghouse
Savannah River Company, Aiken, SC., WSRC-TR-93-496, 1994.
23

WSRC-TR-99-O0407October 25,1999
TABLE 1. DESCRIPTION OF THE PRIMARY TREATMENT ZONES FOR THE PENBRANCH RESTORATION.*
AreaZone (ha) Descri~tion\ / ,
Upper 24.1 Mesic bottomland. Water table typically at a depth of 30 toCorridor 80 cm during the growing season. One or two weIl defined
stream channels. To be planted with mixed bottomlandhardwoods. Initially occupied by dense, virtually unbrokenwillow thickets.
Lower 15.3 Poorly drained bottomland. Water table within 20 or 30 cmCorridor of the soil surface during the growing season. Braided,
unstable stream with up to 4 or 5 water courses. To beplanted with mixed bottomland hardwoods, bald cypress,and water tupelo. Initially occupied by scattered willowthickets and frequent grassy openings where soils were toowet to supp ort wood vegetation.
Delta 46.0 Swamp. Continuously flooded, except on sandy ridges nearthe mouth of Pen Branch, where water table remains within20 cm of the soil surface. To be planted with bald cypressand water tupelo, with some green ash on better drainedridges. Initial cover: about 2/3 cattail or cattail-bulrushmixture, and about 1/3 scattered willow ridges.
* Boundaries shown in Figure 1.
24
. ..= .
WSRC-TR-99-O0407October 25,1999
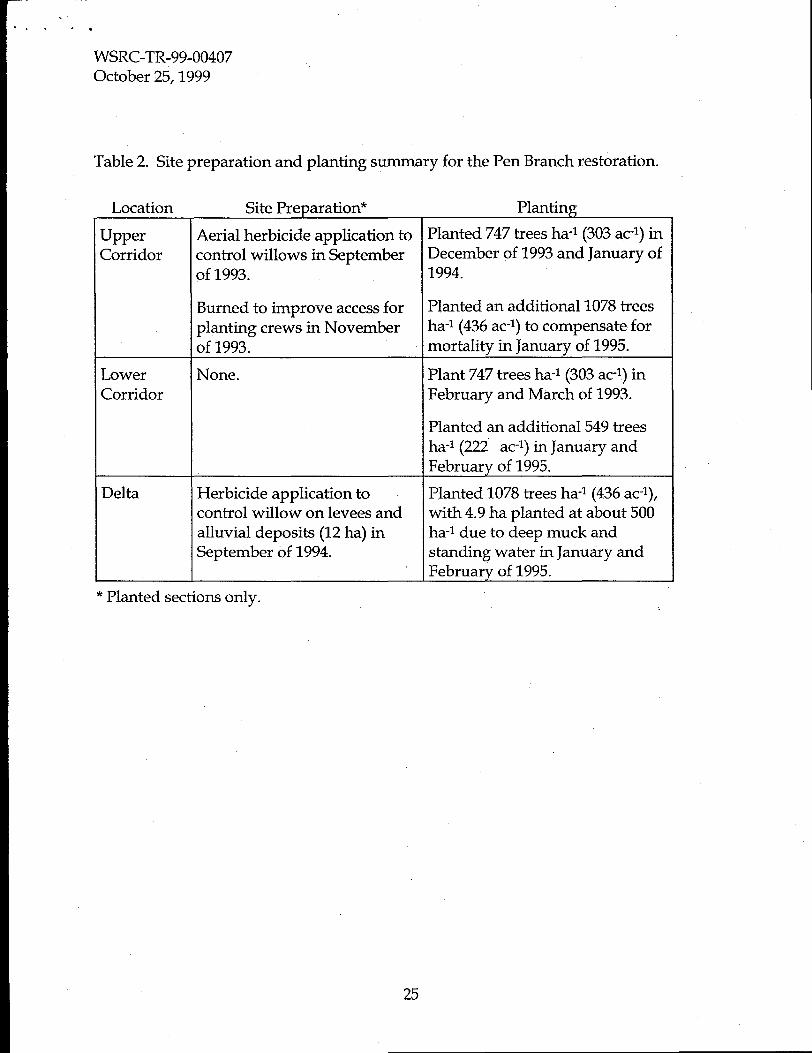
Tab1e2. Site preparation andplanting sumaryfor the Pen Branch restoration.
Location Site Pre~aration* Plantimz
Upper Aerial herbicide application to Planted 747 trees ha-l (303 at-l) in
Corridor control willows in September December of 1993 and January of
of 1993. 1994.
Burned to improve access for Planted an additional 1078 trees
planting crews in November ha-l (436 at-l) to compensate for
of 1993. mortality in January of 1995.
Lower None. Plant 747 trees ha-l (303 at-l) inCorridor February and March of 1993.
Planted an additional 549 treesha-l (222 at-l) in January andFebruary of 1995.
Delta Herbicide application to Planted 1078 trees ha-l (436 at-l),control willow on levees and with 4.9 ha planted at about 500alluvial deposits (12 ha) in ha-l due to deep muck andSeptember of 1994. standing water in January and
February of 1995.
* Planted sections only.
25

>=. . .
WSRC-TR-99-O0407October 25,1999
Table 3. Stocking levels for Pen Branch regions during different years (Trees per hectare)
LOCATION 1994 1996 1997
Upper Corridor 285 717 401
I I I
Lower Corridor 496 556 405
Planted Delta 1508 522
INatural Delta I I 1750

WSRC-TR-99-O0407October 25,1999
Figure Captions
Figure 1. Location and research design of the Pen Branch Restoration Project.
Figure 2. Average annual flow rate and temperature of K-Reactor effluent. Temperature data notavailable for 1985 to present. Adapted from Wike et al. (1994).
Figure 3. Pen Branch delta expansion of thermal darnage to vegetation. Composite image,1961-1982 (from Christensen et al., 1984).
Figure 4.
Figure 5.
Hydrological gradient in Pen Branch regions from 1993-1995 (+/- 1 SD).
Mean densities of desitable regeneration in planted areas of Pen Branch (Spring 1994).
27

>$ ..’
WSRC-TR-99-O0407October 25,1999
<
Pen Branch
28

.
WSRC-TR-99-O0407October 25,1999
70-\
Flow Rate.4
60- /
1’50-
40- /!I
30- ;
20-Approximate baseflow of Pen
lo-<
Branch: about 0.3 m-ss-l
o 1 1 I 1 1 150 55 60 65 70 75 80 85 90 95
12
10
8
6
4
2
0
Year
29

1982
Swamp Forest
Savannah River
s- e.’
WSRC-TR-99-O0407October 25,1999
. .
WSRC-TR-99-O0407October 25,1999
800
600
400
200
0
20
476
230
El•1
Volunteer
Planted
Upper LowerCorridor Corridor
31

—— —–
:. -., ‘
WSRC-TR-99-O0407October 25,1999
10
0-lo
-20
-30
-40
-50
.I
1 I I
Upper Corridor Lower Corridor Delta
32


