
Cite as Kohout et al. 2014. Icarus, 237, 75-83. DOI: 10.1016/j.icarus.2014.04.004
1/38
Space weathering simulations through controlled growth of iron nanoparticles on
olivine
T. Kohout1,2 ([email protected]), J. Čuda3, J. Filip3, D. Britt4, T. Bradley4, J. Tuček3, R. Skála1, G.
Kletetschka1,5, J. Kašlík3, O. Malina3, K. Šišková3, and R. Zbořil3
1. Institute of Geology, Academy of Sciences of the Czech Republic, Prague, Czech Republic
2. Department of Physics, University of Helsinki, Finland
3. Regional Centre of Advanced Technologies and Materials, Faculty of Science, Departments
of Experimental Physics and Physical Chemistry, Palacký University, Olomouc, Czech
Republic
4. Department of Physics, University of Central Florida, Orlando, USA
5. Faculty of Science, Charles University in Prague, Czech Republic
Abstract
Airless planetary bodies are directly exposed to space weathering. The main spectral effects of
space weathering are darkening, reduction in intensity of silicate mineral absorption bands, and an
increase in the spectral slope towards longer wavelengths (reddening). Production of nanophase
metallic iron (npFe0) during space weathering plays major role in these spectral changes. A
laboratory procedure for the controlled production of npFe0 in silicate mineral powders has been
developed. The method is based on a two-step thermal treatment of low-iron olivine, first in
ambient air and then in hydrogen atmosphere. Through this process, a series of olivine powder
samples was prepared with varying amounts of npFe0 in the 7-20 nm size range. A logarithmic
trend is observed between amount of npFe0 and darkening, reduction of 1 µm olivine absorption
band, reddening, and 1 µm band width. Olivine with a population of physically larger npFe0

Cite as Kohout et al. 2014. Icarus, 237, 75-83. DOI: 10.1016/j.icarus.2014.04.004
2/38
particles follows spectral trends similar to other samples, except for the reddening trend. This is
interpreted as the larger, ~40-50 nm sized, npFe0 particles do not contribute to the spectral slope
change as efficiently as the smaller npFe0 fraction. A linear trend is observed between the amount
of npFe0 and 1 µm band center position, most likely caused by Fe2+ disassociation from olivine
structure into npFe0 particles.
Introduction
Airless planetary bodies are directly exposed to the space environment and thus to space
weathering. Space weathering is caused by a combination of solar wind and solar radiation,
micrometeorite bombardment, and cosmic radiation that can alter the physical, chemical, and
crystallographic properties of airless regoliths. Among other effects, space weathering causes
changes in the visible, IR and UV spectra of exposed surface material making it difficult to compare
weathered asteroidal and lunar spectra to those of unweathered silicate minerals, meteorites, and
lunar samples.
Lunar type space weathering
Lunar samples delivered to Earth by the Apollo program during the 1960’s and 1970’s significantly
contributed to our understanding of space weathering. It was the first time that direct laboratory
studies were possible on a material exposed for long periods to the space environment and,
therefore, modified by space weathering. Numerous early studies (e.g. Adams and Jones, 1970,
McCord and Johnson, 1970, Adams and McCord, 1971, 1973, McCord and Adams, 1973) found
that, compared to artificially crushed fresh Apollo rock samples, spectra of lunar soils are darker,
have reduced intensity of silicate mineral absorption bands, and their spectral slope increases
towards longer wavelengths (reddening).

Cite as Kohout et al. 2014. Icarus, 237, 75-83. DOI: 10.1016/j.icarus.2014.04.004
3/38
Reviews by Hapke (2001) or Chapman (2004) provide an understanding of the mechanisms
involved in space weathering. Earlier lunar soil studies indicated that space weathering may cause
an accumulation of dark agglutinitic glass formed by surface melting of regolith by micrometeorite
impacts (Adams and McCord, 1971). Agglutinitic glass is an important optical agent influencing
reflectance spectra of lunar regolith. However, its presence could not explain all of the spectral
discrepancies in lunar soils and planetary surfaces, especially the spectral reddening (Pieters et al.,
1993). Hapke et al. (1975) suggested that optical effects of space weathering may be caused by
metallic submicroscopic iron particles (SMFe), also referred to as nanophase iron (npFe0) particles,
within vapor deposition rims on lunar soil grains. This npFe0 is believed to originate from
disassociation of Fe from Fe-bearing minerals through solar wind sputtering and micro-impact-
generated vapor (e.g. Keller and McKay, 1993; 1997, Hapke, 2001), and its concentration is highest
in the fine fraction of lunar soils (Pieters et al, 1993; Taylor et al., 2001). Support for this theory
came later from transmission electron microscopy (TEM). TEM observations showed the presence
of such npFe0 particles in lunar soil grain coatings (e.g. Keller and McKay, 1997; Hapke, 2001). The
typical size range of npFe0 particles is ~1-10 nm in vapor deposition rims and ~10-100 nm in
agglutinates (e.g. Keller and Clemett, 2001).
S-type asteroid space weathering
As in the case of lunar rocks, spectral discrepancies are also observed between meteorites and
asteroids (e.g. Hapke, 2001 and Chapman, 2004). Silicate rich S-complex asteroids are represented
by absorption bands characteristic of olivine (at wavelengths around 1 μm) and pyroxene (at
wavelengths around 1 and 2 μm). Spectra of ordinary chondrite meteorites contain similar
absorption bands, but, compared to asteroids, the bands in meteorites are usually more intense
and the overall spectral slope is flatter. Numerous laboratory simulations (involving laser

Cite as Kohout et al. 2014. Icarus, 237, 75-83. DOI: 10.1016/j.icarus.2014.04.004
4/38
irradiation and ion bombardment, e.g. Brunetto et al., 2005) of ordinary chondrites and detailed
spectral observations of asteroids and meteorites (e.g. Marchi et al., 2005; Lazzarin et al., 2006)
show that space weathering effects on chondritic materials and S-complex asteroids display
similarities to lunar soils where solar wind ion bombardment induces atom displacements and
micrometeorite bombardment forms npFe0 particles. Direct evidence of npFe0 particle formation
on the surface of S-type asteroids was recently reported by Noguchi et al. (2011) in a study of
surface coatings of regolith grains obtained from asteroid 25143 Itokawa by the Hayabusa sample
return mission. However, compared to lunar weathering, the mechanism of asteroidal space
weathering is more complex and its various effects (e.g. absorption band weakening, darkening,
and reddening) do occur in spectra, with a highly varying intensity, even on the same asteroids
(e.g. Chapman, 2004; Hiroi et al., 2006; Gaffey, 2010).
Observations of young asteroid families shows that space weathering occurs relatively rapidly,
within 106 years after the breakup of the parent body (Vernazza et al., 2009). Similar to lunar type
weathering, space weathering on asteroids affects a thin surface regolith layer only and this layer
can be disturbed by geological processes such as landslides, as observed on Eros by Clark et al.
(2001), or by tidal forces during close planetary encounters (Binzel et al., 2010).
Space weathering laboratory simulations
Laboratory production of npFe0 particles similar to those observed in space-weathered lunar soils
was achieved by direct mineral or glass reduction (Allen et al., 1993), short duration laser
irradiation (e.g. Sasaki et al., 2001; 2002; 2003; Brunetto et al., 2005; Lazzarin et al., 2006; Markley
et al., 2013), ion bombardment (e.g. Marchi et al.; 2005, Lazzarin et al.; 2006), direct mineral /
glass synthesis (Liu et al, 2007), or microwave irradiation (Tang et al., 2012) on various silicate
minerals, meteorites or lunar rocks. Since then, laser irradiation together with ion bombardment

Cite as Kohout et al. 2014. Icarus, 237, 75-83. DOI: 10.1016/j.icarus.2014.04.004
5/38
has become a common laboratory tool for space weathering simulation, capable of reproducing
most spectral changes. However, these methods do not provide sufficient control over npFe0
particle size and concentration and, thus, do not enable quantitative space weathering
simulations.
Only a handful of studies were devoted to control the size and quantity of npFe0 and to verify its
effect on spectral properties. For example, Allen et al. (1996) produced 6 nm sized npFe0 particles
on a silica gel substrate with 6 nm pores through impregnating the pores with ferric nitrate
solution and subsequent reduction of iron in a hydrogen atmosphere. Noble et al. (2007)
enhanced this technique with silica gel substrates featuring pore sizes of 2.3, 6, 25 and 50 nm
resulting in a better control of npFe0 size and concentration. The changes in optical properties of
such treated samples resembled the space weathering effects observed in lunar soils and it was
possible to evaluate the influence of npFe0 particle size on spectral red slope.
In this work we present a new method of controlled npFe0 production on surface of olivine grains.
We also evaluate the influence of npFe0 concentration and particle-size on olivine spectral
darkening and reddening, as well as intensity reduction, shape, and position of the olivine 1 µm
absorption band.
Materials and methods
Samples
Natural olivine from Åheim, Norway was used in this study. A pale green, polycrystalline olivine
sample was thin-sectioned, and analyzed using a CAMECA SX-100 electron microprobe (Table 1).
Another part of the sample was crushed and inclusion-free fragments were hand-picked using an
optical microscope. Subsequently, the olivine grains were pulverized in an agate mortar and sieved

Cite as Kohout et al. 2014. Icarus, 237, 75-83. DOI: 10.1016/j.icarus.2014.04.004
6/38
to obtain fine (10-80 µm) powder. Part of the powder was preserved for reference measurements
while the rest was thermally treated in a two-step heating method to achieve the formation of
npFe0 on the surface of olivine grains.
npFe0 production and characterization
A two-step thermal treatment method was developed to produce npFe0 on the surface of olivine
grains. Furthermore, npFe0 abundance and particle size control was achieved through variations in
temperature and duration of the treatment steps.
In the first step, the olivine powder was heated in air (under oxidizing condition) using a Linn LM
112.07 muffle furnace. Various temperatures and heating durations were tested (Table 2) in order
to induce partial oxidation of the iron ions that were liberated from the olivine structure, primarily
those close to the surface of the olivine grains. The temperatures were selected to be low enough
to preserve the olivine structure undamaged (e.g. Barcova et al., 2003; Michel et al., 2013). The
oxidation of Fe2+ ions leads to a charge imbalance in the olivine structure causing diffusion of Fe3+
atoms to the surface where they precipitate in the form of Fe3+ oxide nanoparticles and create
vacancies in the olivine crystal structure (Zboril et al., 2003; Barcova et al., 2003).
In the second step, the Fe3+ oxide nanoparticles were reduced into npFe0 in a hydrogen
atmosphere (using a steady hydrogen flow at 500°C for 1 hour with an Anton Paar XRK900
reactor). The reduction process was monitored in-situ using X-ray powder diffraction (XRD). The
freshly produced npFe0 particles were surface-passivated for 30 minutes in 30°C gas mixture flow
of N2 with 2% O2 to minimize oxidation upon contact with ambient air.
The XRD was performed using a PANalytical X’Pert PRO MPD diffractometer (iron-filtered CoKα
radiation: λ = 0.178901 nm, 40 kV and 30 mA) in the Bragg-Brentano geometry and equipped with
an X´Celerator detector, that has programmable divergence and diffracted beam anti-scatter slits.

Cite as Kohout et al. 2014. Icarus, 237, 75-83. DOI: 10.1016/j.icarus.2014.04.004
7/38
The samples were placed into a shallow cavity sample holder (made of Macor) and repeatedly-
scanned in the 2θ range of 5–120° (resolution of 0.017° 2θ) at specific temperatures. SRM640 (Si)
and SRM660 (LaB6) commercial standards from NIST (National Institute of Standards and
Technology) were used for evaluation of the line positions and instrumental line broadening,
respectively. Identification of crystalline phases was performed using the HighScore Plus
(PANalytical) software in conjunction with the PDF-4+ database.
The size and concentration of npFe0 was determined using a combination of transmission electron
microscopy (TEM), frequency dependence of magnetic susceptibility, and magnetic hysteresis
measurements, Composition of the npFe0 was verified using scanning transmission electron
microscopy equipped with energy-dispersive X-ray spectroscopy (STEM-EDX).
The TEM observations and STEM-EDX analysis was done using a Teknai F30 TEM/STEM with an
EDAX Si/Li EDX spectrometer. The TEM observations of npFe0 particles were done on sharp, thin
edges of olivine powder grains placed on a copper grid holder.
The frequency dependence of magnetic susceptibility was tested using a ZH instruments SM-
100/105 susceptibility meters at 16, 32, 64, 128 and 256 kHz frequency steps and 160 A/m RMS
field intensity.
The magnetic hysteresis measurements were accomplished using a Princeton Measurements
Micromag Model 3900 VSM (Vibrating Sample Magnetometer). All magnetizations were
normalized by sample. First, a hysteresis loop of the olivine precursor was measured. This loop
was subsequently used for background subtraction (to subtract paramagnetic/diamagnetic
contribution of olivine and sample holder) of all thermally-treated olivine sample hysteresis loops.
After background subtraction, any residual paramagnetic/diamagnetic slope was removed.
Resulting hysteresis loops correspond to npFe0 produced in our samples. The concentration of

Cite as Kohout et al. 2014. Icarus, 237, 75-83. DOI: 10.1016/j.icarus.2014.04.004
8/38
npFe0 can be estimated by comparison of the sample saturation magnetization to that of a pure
metallic iron (218 Am2/kg, Dunlop and Özdemir, 2001, p. 51).
For room-temperature 57Fe Mössbauer measurements, a Mössbauer spectrometer with a 57Co(Rh)
source of γ-rays was used. The values of the derived hyperfine Mössbauer parameters are
attributed to metallic iron (a-Fe) at room temperature. Mössbauer spectra were fitted by means
of the Lorentzian line shapes using the least squares method featured in the MossWinn analysis
program. To obtain a qualitatively resolved Mössbauer spectrum for low npFe0 concentration, a
long measurement time was applied (22 days).
The spectral measurements of fresh and modified olivine samples were done in visible – near
infrared (VIS-NIR) range of 350-2400 nm using an Analytical Spectral Devices FieldSpec Pro
spectrometer calibrated with a Labsphere SRS-99-020 Spectralon white standard. The reflectance
is determined at 550 nm. The spectral slope is calculated as the difference in normalized
reflectance at 1689 nm and 630 nm divided by 1059 nm. The normalized reflectance was
calculated as reflectance divided by reflectance at 550 nm. The 1 µm absorption band depth is
calculated as the normalized average reflectance at 630 and 1689 nm minus the band minimum.
The 1 µm absorption band minimum position was manually read from the data files. To further
study shift of the band minimum in our samples the modified Gaussian model (MGM, Sunshine et
al., 1999, MATLAB code available on RELAB web page
http://www.planetary.brown.edu/mgm/index.html) was applied to the spectral data.
Results
The combination of the two successive thermal treatment steps resulted in a formation of npFe0
(α-Fe, bcc structure) on the olivine grains with a well-controlled particle size and distribution over
the surface. The characteristics of such npFe0 particles is comparable to the npFe0 observed in

Cite as Kohout et al. 2014. Icarus, 237, 75-83. DOI: 10.1016/j.icarus.2014.04.004
9/38
space weathered extraterrestrial materials. Table 3 summarizes spectral properties of the
thermally-treated olivine samples and npFe0 concentration estimate derived from magnetic
hysteresis measurements. There is a quasi-exponential trend in the npFe0 concentration with
increasing temperature of the first heating step (Fig. 1). Longer duration of the first heating step
also increases the npFe0 concentration. Due to the quasi-exponential trend between npFe0
concentration and first step heating temperature, the samples heated to temperatures in excess
of 750°C become very rich in npFe0 and their reflectance spectra become very low. Thus, in order
to reduce the amount of npFe0 in the 850°C sample to the level of other samples, the duration of
the first heating step was reduced to 30 seconds.
The size of the npFe0 particles in all samples as seen by TEM (Fig. 2) is in ~5-20 nm range with the
majority (~90%) being in the 7-15 nm range. An exception is the sample heated to 850°C (850s30)
where an additional population of larger ~40-50 nm npFe0 particles can be observed (Fig. 3). The
larger particles most likely formed by sintering of smaller particles into clusters.
The above mentioned npFe0 particle range is supported by a frequency dependence of the
magnetic susceptibility data which occurs in particles that are in a superparamagnetic (SP) state
that requires iron particles smaller than ~8 nm (Kneller and Luborsky, 1963; Dunlop and Özdemir,
2001, p. 131). No detectable systematic frequency dependence was observed in any sample,
indicating that majority of the npFe0 particles were larger than the ~8 nm threshold.
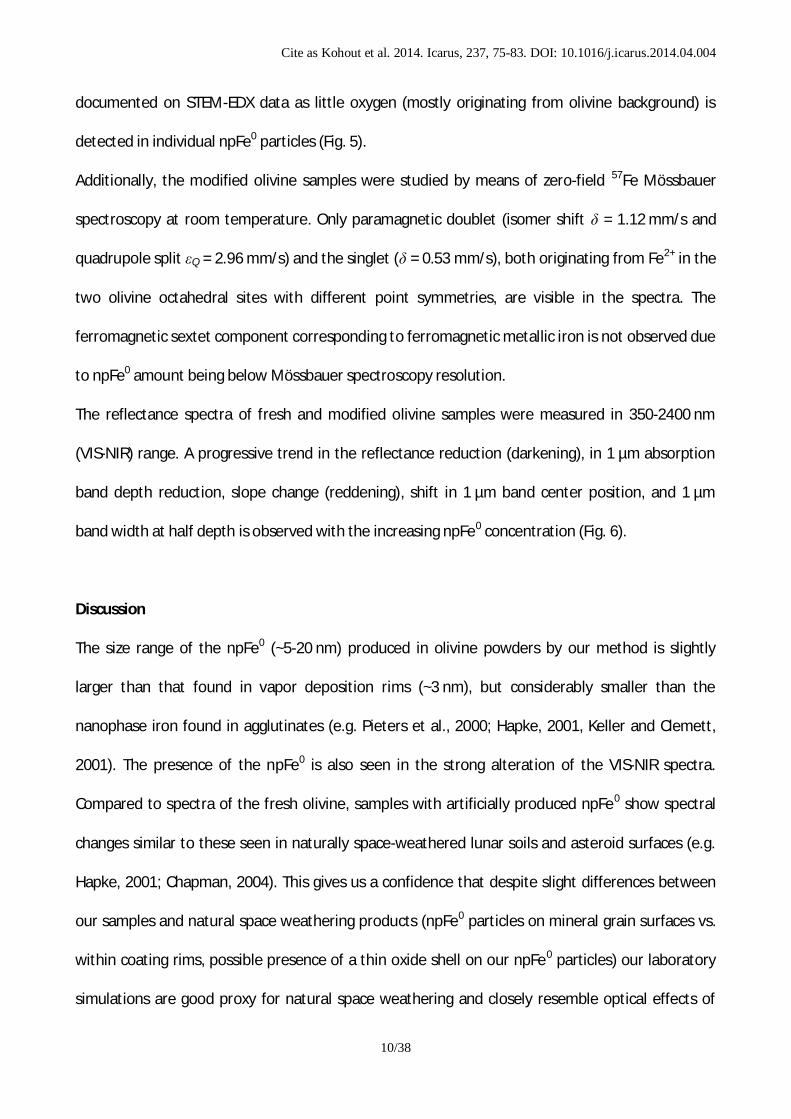
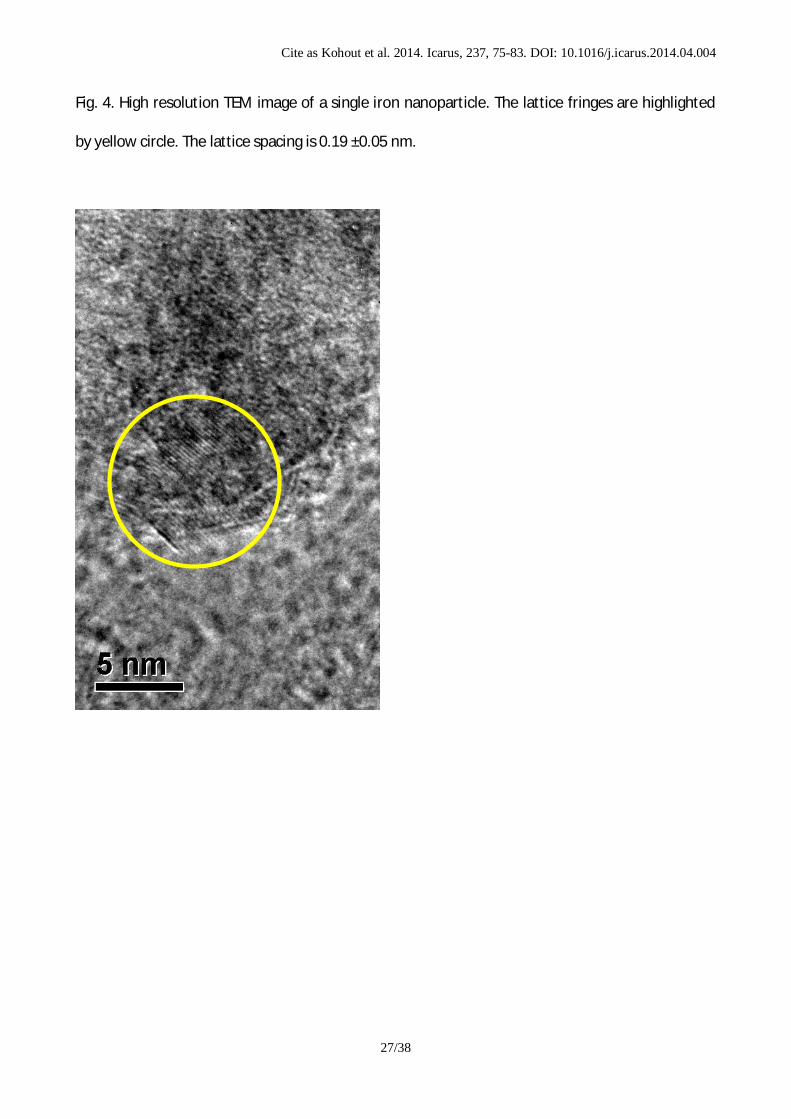
One single npFe0 particle was investigated by high-resolution TEM in order to determine the
lattice spacing on the single nanoparticle. Lattice fringes of 0.19 ±0.05 nm were observed (Fig. 4)
which is consistent with the spacing of (110) of α-Fe d110 = 0.203 nm (Noguchi et al., 2011). The
surface passivation of npFe0 on the olivine limited the formation of iron oxides to a thin shell on
the metallic nanoparticle core (cf. Filip et al., 2007 and Siskova et al., 2012). This is well
Cite as Kohout et al. 2014. Icarus, 237, 75-83. DOI: 10.1016/j.icarus.2014.04.004
10/38
documented on STEM-EDX data as little oxygen (mostly originating from olivine background) is
detected in individual npFe0 particles (Fig. 5).
Additionally, the modified olivine samples were studied by means of zero-field 57Fe Mössbauer
spectroscopy at room temperature. Only paramagnetic doublet (isomer shift δ = 1.12 mm/s and
quadrupole split εQ = 2.96 mm/s) and the singlet (δ = 0.53 mm/s), both originating from Fe2+ in the
two olivine octahedral sites with different point symmetries, are visible in the spectra. The
ferromagnetic sextet component corresponding to ferromagnetic metallic iron is not observed due
to npFe0 amount being below Mössbauer spectroscopy resolution.
The reflectance spectra of fresh and modified olivine samples were measured in 350-2400 nm
(VIS-NIR) range. A progressive trend in the reflectance reduction (darkening), in 1 µm absorption
band depth reduction, slope change (reddening), shift in 1 µm band center position, and 1 µm
band width at half depth is observed with the increasing npFe0 concentration (Fig. 6).
Discussion
The size range of the npFe0 (~5-20 nm) produced in olivine powders by our method is slightly
larger than that found in vapor deposition rims (~3 nm), but considerably smaller than the
nanophase iron found in agglutinates (e.g. Pieters et al., 2000; Hapke, 2001, Keller and Clemett,
2001). The presence of the npFe0 is also seen in the strong alteration of the VIS-NIR spectra.
Compared to spectra of the fresh olivine, samples with artificially produced npFe0 show spectral
changes similar to these seen in naturally space-weathered lunar soils and asteroid surfaces (e.g.
Hapke, 2001; Chapman, 2004). This gives us a confidence that despite slight differences between
our samples and natural space weathering products (npFe0 particles on mineral grain surfaces vs.
within coating rims, possible presence of a thin oxide shell on our npFe0 particles) our laboratory
simulations are good proxy for natural space weathering and closely resemble optical effects of

Cite as Kohout et al. 2014. Icarus, 237, 75-83. DOI: 10.1016/j.icarus.2014.04.004
11/38
the fine nanophase iron fraction including slope change (Noble et al., 2007). The changes in olivine
spectral parameters are quantified in Table 3. Because the npFe0 particle size is kept constant
(with exception of 850s30 sample), the spectral changes can be studied as a function of increasing
npFe0 concentration. The results indicate that there is a linear trend between amount of npFe0
and the 1 µm band center position (Fig. 7) and a logarithmic trend between the amount of npFe0
and the reflectance (Fig. 8), 1 µm absorption band depth (Fig. 8), spectral slope (Fig. 9) and the
1 µm band width at half depth (Fig. 10).
The linear trend between amount of npFe0 and the 1 µm band center position is in contrast with
results of previous studies (Hiroi and Sasaki, 2001; Sasaki et al., 2002; 2003; Brunetto et al,. 2005)
where no significant changes of the band position were observed during simulated space
weathering. However, compared to these studies, our samples cover a broader range of npFe0
amount and related spectral changes. It is apparent that for samples with less npFe0 (below 0.01
wt% and spectral changes of a similar magnitude as in above-mentioned studies) there is no
significant change in band position. However, with higher npFe0 the amount of the shift in 1 µm
band center became more apparent. The mechanism behind the band shift may be Fe2+
disassociation from olivine structure into npFe0 particles. This is also supported by the linear
correlation between 1 µm band center and amount of npFe0. The possible occurrence of this
process in extremely weathered natural planetary surfaces is uncertain and requires further
studies. In general, asteroidal regoliths do not get as mature as lunar regolith and olivine is minor
constituent of the lunar regolith.
The band center shift was further studied using the MGM model. As the olivine 1 µm absorption
band is a superposition of three individual bands related to the different positions of Fe2+ ions in
the olivine crystal structure (Burns, 1970), three Gaussian bands were used in the MGM model.
The results are summarized in table 4 and figure 11. MGM method gives reliable results for

Cite as Kohout et al. 2014. Icarus, 237, 75-83. DOI: 10.1016/j.icarus.2014.04.004
12/38
samples with small to moderate npFe0 amounts up to sample 650h1 with 0.023 wt% metallic Fe.
(With higher npFe0 content the lower 1 µm band intensity to noise ratio and significant red slope
causes unreliable Gaussian modeling of olivine samples.) The MGM results indicate that the shift
in 1 µm band is primarily driven by changes in the third Gaussian band centered around 1200 nm
(Fig. 11) which is caused (together with the ~840 nm band) by the Fe2+ in M(2) position (e.g. Burns,
1970). The MGM model figures are available in on-line supplementary material (Figs. S1-S7).
The observed logarithmic trend between slope change and amount of npFe0 provides further
insight into natural space weathering. A logarithmic trend between spectral slope change and the
space weathering duration has been observed by Nesvorný et al. (2005) and Vernazza et al. (2009)
for S-type asteroid families. In combination with our observation of a logarithmic trend between
amount of npFe0 and reflectance, 1 µm absorption band depth, and spectral slope, we have
demonstrated four additional characteristics of space weathering: A similar logarithmic trend is
valid between space weathering duration and (1) darkening, (2) reduction of 1 µm olivine
absorption band, and (3) 1 µm band width at half depth. However, (4) the amount of npFe0
increases linearly with the duration of the space weathering.
The 850s30 sample contains additional population of ~40-50 nm npFe0 particles which accounts
for its VIS-NIR spectral properties. The spectrum of this sample follows the trends observed for
other samples. However, sample 850s30 does not fully follow the increasing red slope trend (Fig.
9). This is most likely due to the fact that part of its npFe0 is in a form of larger particles, which
does not contribute to the red slope. This sample is analogous to lunar soils containing both small
npFe0 fraction in vapor deposition rims as well as larger npFe0 particles in agglutinates. The
relatively reduced magnitude of the slope change in this sample is in agreement with Noble et al.
(2007) and Lucey and Noble (2008) who observed insignificant slope change for npFe0 particles
larger than ~50 nm.

Cite as Kohout et al. 2014. Icarus, 237, 75-83. DOI: 10.1016/j.icarus.2014.04.004
13/38
Conclusions
The two-step thermal treatment method allows for controlled growth of iron nanoparticles on the
surfaces of olivine powder grains. This enables quantitative investigations of the role of npFe0 in
space weathering and related changes in reflectance spectra. Compared to fresh olivine, our
olivine samples with artificially introduced ~5-20 nm sized npFe0 particles exhibit the spectral
characteristics of lunar-type space weathering. From a quantitative point of view, a linear trend is
observed between the amount of npFe0 and 1 µm band center position. This trend is more
pronounced for samples with npFe0 amounts in excess of 0.015 wt%. The mechanism behind the
band shift may be Fe2+ disassociation from olivine structure into npFe0 particles.
A logarithmic trend is observed between amount of npFe0 and darkening, reduction of 1 µm
olivine absorption band, reddening, and 1 µm band width at half depth. Observations of asteroid
families show a logarithmic weathering trend between slope change and duration. Our results
reveal four additional characteristics of space weathering: The logarithmic trend with space
weathering duration is also valid for (1) darkening, (2) reduction of 1 µm olivine absorption band,
and (3) 1 µm band width at half depth, while (4) the amount of npFe0 increases linearly with
duration.
The olivine sample with an additional population of larger npFe0 particles follows similar spectral
trends as other samples, except for the reddening trend. This is interpreted as the larger, (~40-
50 nm sized), npFe0 particles do not contribute to the slope change as efficiently as the smaller
npFe0 fraction.

Cite as Kohout et al. 2014. Icarus, 237, 75-83. DOI: 10.1016/j.icarus.2014.04.004
14/38
Acknowledgements
The work was supported by Ministry of Education, Youth and Sports of the Czech Republic (grant
no. LH12079, LK21303, MSM0021620855), Academy of Finland (grant no. 257487), Czech Science
Foundation (grant no. GACR P108/11/1350) and Palacký University, Olomouc, Czech Republic
(grant no. PrF_2013_014). We also thank for the support by the Operational Program Research
and Development for Innovations – European Regional Development Fund
(CZ.1.05/2.1.00/03.0058) and Operational Program Education for Competitiveness – European
Social Fund (CZ.1.07/2.3.00/20.0017, CZ.1.07/2.3.00/20.0170, CZ.1.07/2.3.00/20.0155, and
CZ.1.07/2.3.00/20.0056) of the Ministry of Education, Youth and Sports of the Czech Republic. This
work (publication SSERVI-2014-080) was directly supported by NASA's Solar System Exploration
Research Virtual Institute cooperative agreement notice NNA14AB05A.
References
Adams, J.B., Jones, R.L., 1970. Spectral reflectivity of lunar samples. Science 167, 737-739.
Adams, J.B., McCord, T.B., 1971. Alteration of lunar optical properties: age and composition
effects. Science 171, 567-571.
Adams, J.B., McCord, T.B., 1973. Vitrification darkening in the lunar highlands and identification of
Descartes material at the Apollo 16 sites. Proceedings of the Lunar and Planetary Science
Conference 4, 163-177.
Allen, C.C., Lauer, H.V., Jr., Morris, R.V., and McKay, D.S., 1993, Microscopic iron metal on glass
and minerals – —a tool for studying regolith maturity. Icarus 104, 291-300.
Allen, C.C., Morris, R.V., McKay, D.S., 1996. An experimental analog to maturing lunar soil.
Proceedings of the Lunar and Planetary Science Conference 37, 13-14.

Cite as Kohout et al. 2014. Icarus, 237, 75-83. DOI: 10.1016/j.icarus.2014.04.004
15/38
Barcova, K., Mashlan, M., Zboril, R., Martinec, P., 2003. Mossbauer study of transformation
mechanism of Fe cations in olivine after thermal treatments in air. Journal of Radioanalytical
and Nuclear Chemistry 255, 529-533. doi: 10.1023/A:1022588500878
Binzel, R.P., Morbidelli, A., Merouane, S., DeMeo, F.E., Birlan, M., Vernazza, P., Thomas, C.A.,
Rivkin, A.S., Bus, S.J., Tokunaga, A.T., 2010. Earth encounters as the origin of fresh surfaces
on near-Earth asteroids. Nature 463, 331-334. doi:10.1038/nature08709.
Brunetto, R., Romano, F., Blanco, A., Fonti, S., Martino, M., Orofino, V., Verrienti, C., 2005. Space
weathering of silicates simulated by nanosecond pulse UV excimer laser. Icarus 180, 546-
554. doi:10.1016/j.icarus.2005.10.016.
Burns, R.G., 1970. Crystal field spectra and evidence of cation ordering in olivine minerals.
American Mineralogist 55, 1608-1632.
Chapman, C.R., 2004. Space weathering of asteroid surfaces. Annual Reviews 32, 539-567.
doi:10.1016/j.icarus.2010.05.006.
Clark, B.E., Lucey, P., Helfenstein, P, Bell Iii, J.F., Peterson, C., Veverka, J., Mcconnochie, T.,
Robinson, M.S., Bussey, B., Murchie, S.L., Izenberg, N.I., Chapman, C.R., 2001. Space
weathering on Eros: Constraints from albedo and spectral measurements of Psyche crater.
Meteoritics and Planetary Science 36, 1617-1637. doi: 10.1111/j.1945-5100.2001.tb01853.x.
Dunlop, D.J., Özdemir, Ö., 2001. Rock Magnetism: fundamentals and frontiers, Cambridge
University Press, Cambridge, 573 pages.
Filip, J., Zbořil, R., Schneeweiss, O., Zeman, J., Černík, M., Kvapil, P., Otyepka, M., 2007.
Environmental applications of chemically-pure natural ferrihydrite. Environmental Science &
Technology 41, 4367-4374.
Gaffey, M.J., 2010 Space weathering and the interpretation of asteroid reflectance spectra. Icarus
209, 564-574.

Cite as Kohout et al. 2014. Icarus, 237, 75-83. DOI: 10.1016/j.icarus.2014.04.004
16/38
Hapke, B., 2001. Space weathering from Mercury to the asteroid belt. Journal of Geophysical
Research 106, 10039-10073.
Hapke, B., Cassidy, W., Wells, E., 1975. Effects of vapour-phase deposition processes on the optical
chemical and magnetic properties of the lunar regolith, Moon 13, 339-354.
Hiroi, T., Abe, M., Kitazato, K., Abe, S., Clark, B.E., Sasaki, S., Ishiguro, M., Barnouin-Jha, O.S., 2006.
Developing space weathering on the Asteroid 25143 Itokawa. Nature 443, 56–58.
doi:10.1038/nature05073.
Hiroi, T., Sasaki, S., 2001. Importance of space weathering simulation products in compositional
modeling of asteroids: 349 Dembowska and 446 Aeternitas as examples. Meteoritics and
Planetary Science 36, 1587-1596.
Keller, L.P., Clemett, S.J., 2001. Formation of nanophase iron in the lunar regolith. Lunar and
Planetary Science Conference XXXII, abstract no. 2097.
Keller, L., McKay, D., 1997. The nature and origin of rims on lunar soil grains. Geochimica et
Cosmochimica Acta 61, 2331-2340.
Keller, L., McKay, D., 1993. Discovery of vapor deposits in the lunar regolith. Science, 261, 1305-
1307. doi: 10.2307/2882155
Kneller, E.F., Luborsky, F.E., 1963. Particle size dependence of coercivity and remanence of single-
domain particles. Journal of Applied Physics 34, 656-658.
Lazzarin, M., Marchi, S., Moroz, L.V., Brunetto, R., Magrin, S., Paolicchi, P., Strazzulla, G., 2006.
Space Weathering in the Main Asteroid Belt: The Big Picture. The Astrophysical Journal
Letters 647, L179–L182, doi: 10.1086/507448.
Liu, Y., Taylor, L.A., Thompson, J.R., Schnare, D.W., Park, J.S., 2007. Unique properties of lunar
impact glass: Nanophase metallic Fe synthesis. American Mineralogist 92, 1420-1427.
Cite as Kohout et al. 2014. Icarus, 237, 75-83. DOI: 10.1016/j.icarus.2014.04.004
17/38
Lucey, P.G., Noble, S.K., 2008. Experimental test of a radiative transfer model of the optical effects
of space weathering. Icarus 197, 348-353. doi: 10.1016/j.icarus.2008.05.008
Markley, M.M., Fuller, M.D., Kletetschka, G., 2013. Magnetic scanning of iron blebs in laser
irradiated olivine grains. Meteoritics & Planetary Science 48, A233.
Marchi, S., Brunetto, R., Magrin, S., Lazzarin, M., Gandolfi, D., 2005. Space weathering of near-
Earth and main belt silicate-rich asteroids: observations and ion irradiation experiments.
Astronomy & Astrophysics 443, 769-775. doi: 10.1051/0004-6361:20053525
McCord, T.B., Johnson, T.V., 1970. Lunar spectral reflectivity (0.30 to 2.50 microns) and
implications for remote mineralogical analysis. Science 169, 855-858.
McCord, T.B., Adams, J.B., 1973. Progress in remote optical analysis of lunar surface composition.
Moon 7, 453-474.
Michel, R., Ammar, M.R., Poirier, J., Simon, P., 2013. Phase transformation characterization of
olivine subjected to high temperature in air. Ceramics International 39, 5287-5294.
Nesvorný, D., Jedlicke, R., Whiteley, R.J., Ivezić, Ž., 2005. Evidence for asteroid space weathering
from the Sloan Digital Sky Survey. Icarus 173, 132-152.doi: 10.1016/j.icarus.2004.07.026
Noble, S.K., Pieters, C.M., Keller, L.P., 2007. An experimental approach to understanding the
optical effects of space weathering. Icarus 192, 629-642. doi:10.1016/j.icarus.2007.07.021.
Noguchi T., Nakamura T., Kimura M., et al., 2011. Incipient Space Weathering Observed on the
Surface of Itokawa Dust Particles. Science 333. 1121-1125. doi: 10.1126/science.1207794.
Pieters, C.M., Taylor, L.A., Noble, S.K., Keller, L.P., Hapke, B., Morris, R.V., Allen, C.C., McKay, D.S.,
Wentworth, S., 2000. Space weathering on airless bodies: Resolving a mystery with lunar
samples. Meteoritics and Planetary Science 35, 1101-1107.

Cite as Kohout et al. 2014. Icarus, 237, 75-83. DOI: 10.1016/j.icarus.2014.04.004
18/38
Pieters, C.M., Fischer, E.M., Rode, O., Basu, A., 1993. Optical effects of space weathering: The role
of the finest fraction. Journal of Geophysical Research: Planets 98, 20817-20824. doi:
10.1029/93JE02467
Sasaki, S., Kurahashi, E., Yamanaka, C., Nakamura, K., 2003. Laboratory simulation of space
weathering: Changes of optical properties and TEM/ESR confirmation of nanophase metallic
iron. Advances in Space Research 31, 2537-2542. doi: 10.1016/S0273-1177(03)00575-1
Sasaki, S, Hiroi, T., Nakamura, K., Hamabe, Y., Kurahashi, F., Yamada, M., 2002. Simulation of space
weathering by nanosecond pulse laser heating: dependence on mineral composition,
weathering trend of asteroids and discovery of nanophase iron particles. Advances in Space
Research 29, 783-788.
Sasaki, S., Nakamura, K., Hamabe, Y., Kurahashi, E., Hiroi, T., 2001. Production of iron
nanoparticles by laser irradiation in a simulation of lunar-like space weathering. Nature 410,
555-557. doi: 10.1038/35069013
Siskova, K., Tucek, J., Machala, L., Otyepkova, E., Filip, J., Safarova, K., Pechousek, J., Zboril, R.,
2012. Air-stable nZVI formation mediated by glutamic acid: solid-state storable material
exhibiting 2D chain morphology and high reactivity in aqueous environment. Journal of
Nanoparticle Research 14, 805 (13 pages). doi: 10.1007/s11051-012-0805-9
Sunshine, J.M., Pieters, C.M., Pratt, S.F., McNaron-Brown, K.S., 1999. Absorption Band Modeling in
Reflectance Spectra: Availability of the Modified Gaussian Model. Lunar and Planetary
Science Conference XXX, abstract no. 1306.
Tang, H., Wang, S., Li, X., 2012: Simulation of nanophase iron production in lunar space
weathering. Planetary and Space Science 60, 322-327. doi: 10.1016/j.pss.2011.10.006
Cite as Kohout et al. 2014. Icarus, 237, 75-83. DOI: 10.1016/j.icarus.2014.04.004
19/38
Taylor, L.A., Pieters, C.M., Morris, R.V., Keller, L.P., McKay, D.S., 2001. Lunar mare soils: Space
weathering and the major effects of surface-correlated nanophase Fe. Journal of
Geophysical Research: Planets 106, 27985-28000. doi: 10.1029/2000JE001402
Vernazza, P., Binzel, R.P., Rossi, A., Fulchignoni, M., Birlan, M., 2009. Solar wind as the origin of
rapid reddening of asteroid surfaces. Nature 458, 993-995. doi:10.1038/nature07956
Zboril, R., Mashlan, M., Barcova, K., Walla, J., Ferrow, E., Martinec, P., 2003. Thermal behaviour of
pyrope at 1000 and 1100°C: mechanism of Fe2+ oxidation and decomposition model. Physics
and Chemistry of Minerals 30, 620-627.

Cite as Kohout et al. 2014. Icarus, 237, 75-83. DOI: 10.1016/j.icarus.2014.04.004
20/38
Table 1. Chemical analyses of olivine used in this study.
1 2 3 4 5 6 7 8 9 10 11 12 13 14 15 16 17 18 19 20 mean s.d.
Analyses in wt%
SiO2 40.88 41.25 41.75 41.33 41.23 41.26 41.38 41.44 41.19 41.18 41.09 41.77 41.52 41.33 41.64 41.47 41.58 41.41 41.94 41.95 41.43 0.28
Al2O3 0.04 b.d.l. b.d.l. b.d.l. b.d.l. b.d.l. 0.04 b.d.l. b.d.l. b.d.l. b.d.l. b.d.l. b.d.l. b.d.l. b.d.l. b.d.l. b.d.l. b.d.l. b.d.l. b.d.l. 0.04 0.00
FeOT 6.69 6.67 6.58 6.72 6.67 6.80 6.63 6.69 6.72 6.74 6.67 6.64 6.71 6.75 6.63 6.68 6.67 6.61 6.63 6.68 6.68 0.05
NiO 0.39 0.37 0.41 0.39 0.36 0.38 0.38 0.38 0.38 0.39 0.37 0.40 0.39 0.37 0.38 0.39 0.38 0.39 0.38 0.38 0.38 0.01
MnO 0.13 0.11 b.d.l. b.d.l. 0.11 0.12 b.d.l. b.d.l. 0.12 b.d.l. 0.15 0.12 b.d.l. b.d.l. 0.10 0.13 b.d.l. b.d.l. b.d.l. b.d.l. 0.12 0.01
MgO 51.68 51.25 51.78 51.56 51.83 51.90 51.95 51.35 51.60 51.67 51.61 51.78 51.67 51.40 51.23 51.34 51.68 51.30 51.24 51.07 51.54 0.25
Total 99.80 99.64 100.52 100.00 100.21 100.44 100.38 99.85 100.00 99.97 99.90 100.71 100.28 99.86 99.97 100.01 100.30 99.71 100.20 100.07 100.09 0.28
Coeficients of empirical formulae in a.p.f.u. calculated on the basis of 4 oxygens in formula unit
Si 0.992 1.001 1.003 0.999 0.995 0.994 0.996 1.003 0.997 0.996 0.995 1.002 1.001 1.000 1.006 1.002 1.001 1.003 1.010 1.011 1.000 0.005
Al 0.001 0.001 0.001
Fe 0.136 0.135 0.132 0.136 0.135 0.137 0.133 0.135 0.136 0.136 0.135 0.133 0.135 0.137 0.134 0.135 0.134 0.134 0.134 0.135 0.135 0.001
Ni 0.008 0.007 0.008 0.008 0.007 0.007 0.007 0.007 0.007 0.008 0.007 0.008 0.008 0.007 0.007 0.008 0.007 0.008 0.007 0.007 0.007 0.000
Mn 0.003 0.002 0.002 0.002 0.002 0.003 0.002 0.002 0.003 0.002 0.000
Mg 1.869 1.854 1.854 1.858 1.865 1.865 1.865 1.852 1.861 1.864 1.864 1.852 1.856 1.855 1.845 1.850 1.856 1.852 1.839 1.836 1.856 0.009
Total 3.008 2.999 2.997 3.001 3.005 3.006 3.003 2.997 3.003 3.004 3.005 2.998 2.999 3.000 2.994 2.998 2.999 2.997 2.990 2.989 3.000 0.005
Forsterite content in mol. %
Fo 93.2 93.2 93.3 93.2 93.3 93.2 93.3 93.2 93.2 93.2 93.2 93.3 93.2 93.1 93.2 93.2 93.2 93.3 93.2 93.2 93.2 0.1
Notes: a.p.f.u. – atom per formula unit; s.d. – standard deviation; b.d.l. indicates values below detection limit; Ti, Cr, Ca, Na, and K were found tobe below detection limit in all analyses.
Measurement details: microprobe CAMECA SX-100; accelerating voltage 15kV / sample current 10nA: NaKα (standard: jadeite; detection limit 550ppm), SiKα (quartz; 480 ppm), MgKα (diopside; 950 ppm), KKα (sanidine; 240 ppm), CaKα (diopside; 260 ppm), TiKα (rutile; 320 ppm), AlKα (jadeite;330 ppm), MnKα (rhodonite; 700 ppm), CrKα (Cr2O3; 600 ppm); 20kV / 10nA: FeKα (magnetite; 450 ppm), NiKα (NiSi; 230 ppm); beam diameter 2µm.

Cite as Kohout et al. 2014. Icarus, 237, 75-83. DOI: 10.1016/j.icarus.2014.04.004
21/38
Table 2. Conditions of sample processing. T1 and t1 are the temperature and time of the first
heating step (in air). T2 and t2 are the temperature and time of the second heating step (in
hydrogen). N/A – not applicable.
Sample T1 (°C) t1 (s) T2 (°C) t2 (s)
Raw olivine N/A N/A N/A N/A400h1 400 3600 500 3600450h1 450 3600 500 3600500h1 500 3600 500 3600550h1 550 3600 500 3600600h1 600 3600 500 3600650h1 650 3600 500 3600700h1 700 3600 500 3600750h1 750 3600 500 3600850s30 850 30 500 3600

Cite as Kohout et al. 2014. Icarus, 237, 75-83. DOI: 10.1016/j.icarus.2014.04.004
22/38
Table 3. Overview of sample spectral parameters, saturation magnetization (Js) and calculatednpFe0 concentration. Iron concentration is calculated as the sample saturation magnetizationdivided by the saturation magnetization of pure iron (218 Am2/kg). * – not possible to reliablydetermine.
Sample Slope(µm-1)
1µmdepth
Albedoat 550
nm
1umband
center(nm)
1µmband
width athalf
depth(nm)
Js
(mAm2/kg)Fe
(wt%)
Olivine0.031 0.21
0.78 1053 466 0 0.0
400h10.15 0.18
0.61 1048 356 16.44 0.0075
450h10.17 0.18
0.60 1048 347 18.43 0.0085
500h10.25 0.20
0.42 1048 306 24.59 0.011
550h10.22 0.15
0.52 1046 265 27.78 0.013
600h10.36 0.16
0.34 1045 222 31.89 0.015
650h10.41 0.10
0.28 1041 165 49.71 0.023
700h10.57 0.026
0.16 1031 118 128.7 0.059
750h10.69 0.00
0.11 970 * 253.2 0.12
850s300.36 0.034
0.28 1034 139 106.3 0.049

Cite as Kohout et al. 2014. Icarus, 237, 75-83. DOI: 10.1016/j.icarus.2014.04.004
23/38
Table 4. Modified Gaussian model parameters of the olivine absorption band. C1-3 are the three
Gaussian centers. FWHM1-3 are the full widths at half maximum. S1-3 are the Gaussian strengths.
RMSD is the root mean square deviation.
C1 (nm) C2 (nm) C3 (nm)FWHM1(nm)
FWHM2(nm)
FWHM3(nm) S1 S2 S3 RMSD
Rawolivine 826 1022 1229 124 221 465 -0.0863 -0.239 -0.276 2.27E-02
400h1 837 1026 1202 170 181 436 -0.093 -0.195 -0.265 4.73E-03
450h1 834 1025 1201 166 184 450 -0.0916 -0.192 -0.27 7.28E-03
500h1 847 1032 1194 214 169 442 -0.126 -0.188 -0.303 3.77E-03
550h1 835 1028 1195 175 180 454 -0.0821 -0.161 -0.237 5.88E-03
600h1 853 1039 1187 265 160 464 -0.104 -0.134 -0.277 2.86E-03
650h1 846 1040 1171 280 154 487 -0.0697 -0.101 -0.226 2.77E-03

Cite as Kohout et al. 2014. Icarus, 237, 75-83. DOI: 10.1016/j.icarus.2014.04.004
24/38
Fig. 1. The relation between the temperature of first heating step (in air) and amount of iron
produced in form of iron nanoparticles. The heating duration was 1 hour for all displayed samples.

Cite as Kohout et al. 2014. Icarus, 237, 75-83. DOI: 10.1016/j.icarus.2014.04.004
25/38
Fig. 2. TEM image of ~5-20 nm sized nanoparticles on olivine powder grains (sample 600h1).

Cite as Kohout et al. 2014. Icarus, 237, 75-83. DOI: 10.1016/j.icarus.2014.04.004
26/38
Fig. 3. TEM image of nanoparticles on olivine powder grains of the 850s30 sample. Twopopulations can be observed (~5-20 nm and ~40-50 nm).
Cite as Kohout et al. 2014. Icarus, 237, 75-83. DOI: 10.1016/j.icarus.2014.04.004
27/38
Fig. 4. High resolution TEM image of a single iron nanoparticle. The lattice fringes are highlighted
by yellow circle. The lattice spacing is 0.19 ±0.05 nm.

Cite as Kohout et al. 2014. Icarus, 237, 75-83. DOI: 10.1016/j.icarus.2014.04.004
28/38
Fig. 5. STEM EDX spectra of an individual iron nanoparticle. These data show that iron nanoparticle
oxidation was kept to minimum since only a minor peak of oxygen is observed and that is most
likely caused by the olivine background (also indicated by a minor peak of silica and magnesium).
Peak of copper is the signal of the sample holder.

Cite as Kohout et al. 2014. Icarus, 237, 75-83. DOI: 10.1016/j.icarus.2014.04.004
29/38
Fig. 6. VIS-NIR reflectance spectra (up – absolute values, down – normalized at 550 nm) of thefresh and modified olivine samples with increasing npFe0 concentration (in wt%) as determinedfrom the saturation magnetization. All samples show the continuous trend of 1 µm olivineabsorption band reduction and increasing red slope with increasing amount of the npFe0. The850°C sample does not follow the increasing red slope trend because it contains additional largernpFe0 particles that do not contribute to the red slope.

Cite as Kohout et al. 2014. Icarus, 237, 75-83. DOI: 10.1016/j.icarus.2014.04.004
30/38
Fig. 7. The linear trend (black line) between the npFe0 amount and the position 1 µm band center.R2 is the root mean square deviation of the fit.

Cite as Kohout et al. 2014. Icarus, 237, 75-83. DOI: 10.1016/j.icarus.2014.04.004
31/38
Fig. 8. The logarithmic trend (black lines) between the npFe0 amount and the 1 µm band depth
and the reflectance at 550 nm. R2 is the root mean square deviation of the fit.

Cite as Kohout et al. 2014. Icarus, 237, 75-83. DOI: 10.1016/j.icarus.2014.04.004
32/38
Fig. 9. The logarithmic trend (black line) between the npFe0 amount and the spectral slope. The
850s30 sample (highlighted by a yellow circle) with additional population of larger npFe0 particles
does not fully follow the reddening trend. R2 is the root mean square deviation of the fit.

Cite as Kohout et al. 2014. Icarus, 237, 75-83. DOI: 10.1016/j.icarus.2014.04.004
33/38
Fig. 10. The logarithmic trend (black line) between the npFe0 amount and the 1 µm band width at
half depth. R2 is the root mean square deviation of the fit.

Cite as Kohout et al. 2014. Icarus, 237, 75-83. DOI: 10.1016/j.icarus.2014.04.004
34/38
Fig. 11. Positions of the Gaussian band centres (C1-3) as a function of increasing npFe0 content.

Cite as Kohout et al. 2014. Icarus, 237, 75-83. DOI: 10.1016/j.icarus.2014.04.004
35/38
Supplementary material
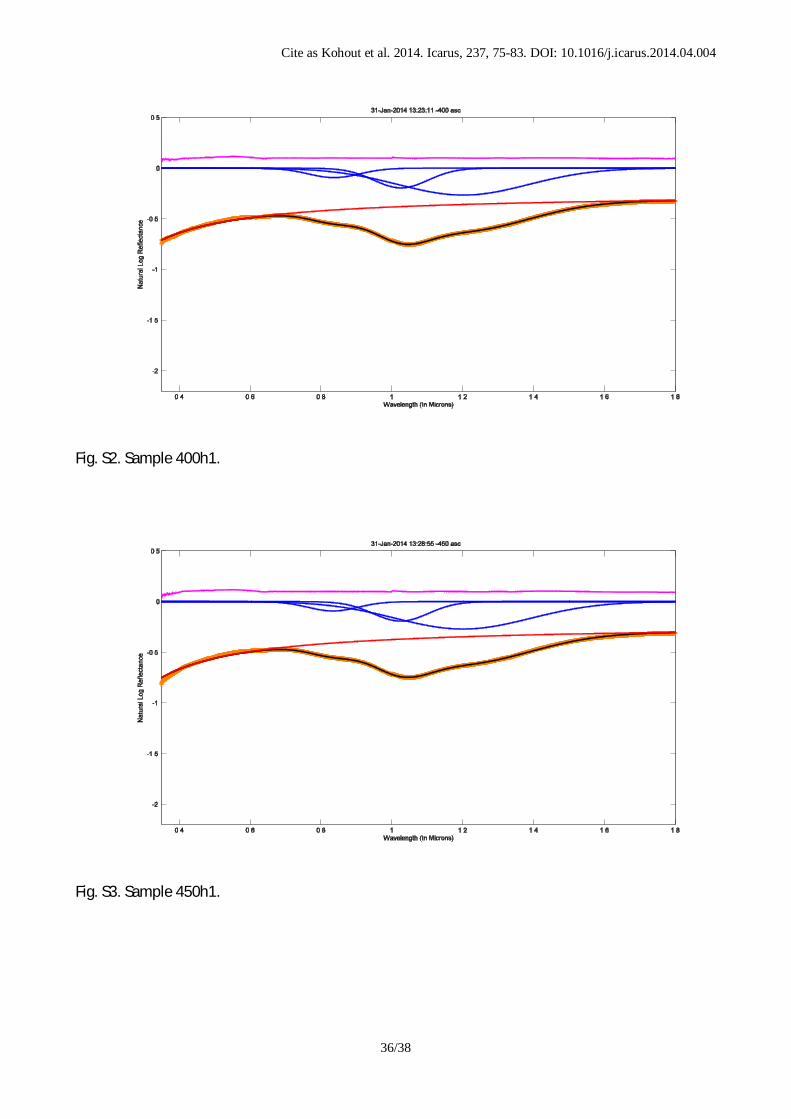
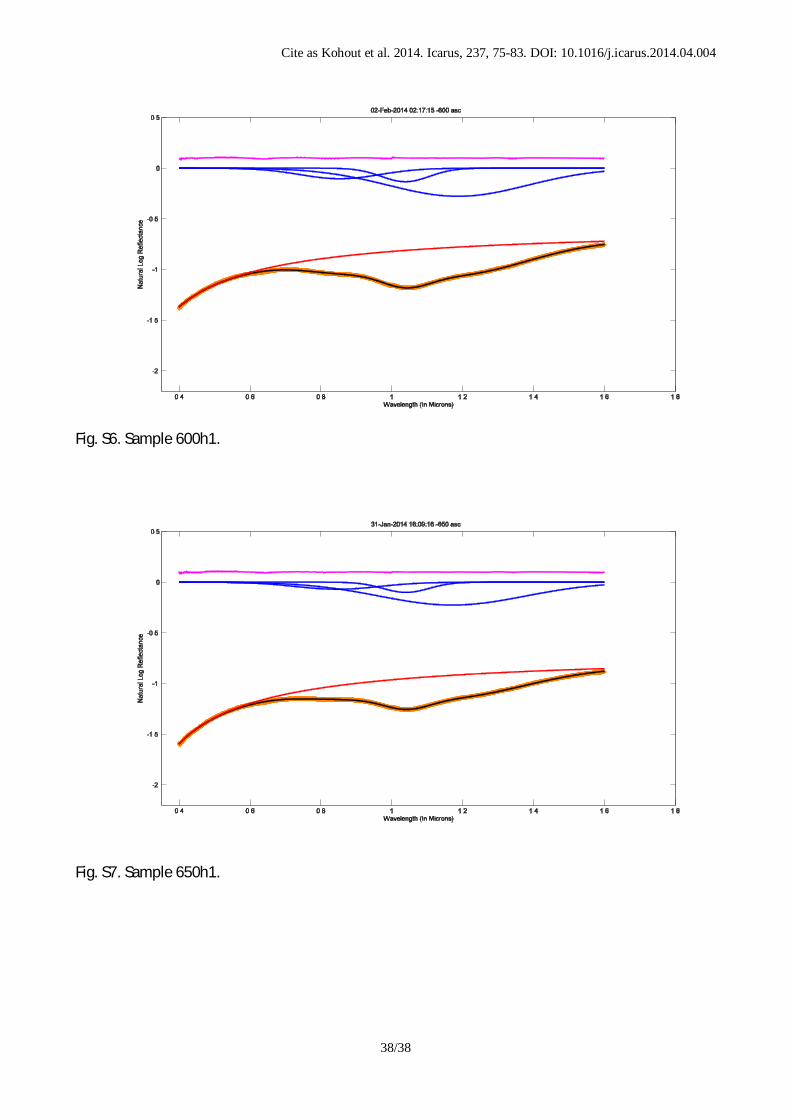
Modified Gaussian model figures for samples listed in Table 4. Orange – measured spectrum, black
– modeled spectrum, blue – gaussian bands, red – continuum, pink – residual error spectrum.
Fig. S1. Fresh olivine.
Cite as Kohout et al. 2014. Icarus, 237, 75-83. DOI: 10.1016/j.icarus.2014.04.004
36/38
Fig. S2. Sample 400h1.
Fig. S3. Sample 450h1.

Cite as Kohout et al. 2014. Icarus, 237, 75-83. DOI: 10.1016/j.icarus.2014.04.004
37/38
Fig. S4. Sample 500h1.
Fig. S5. Sample 550h1.
Cite as Kohout et al. 2014. Icarus, 237, 75-83. DOI: 10.1016/j.icarus.2014.04.004
38/38
Fig. S6. Sample 600h1.
Fig. S7. Sample 650h1.


