
TIPS Working Paper 14_2000
South Africa’s International Cost Competitiveness
Stephen S. Golub

South Africa’s International Cost Competitiveness
Stephen S. Golub
Department of Economics Swarthmore College
Swarthmore PA 19081 USA
Email: [email protected] Tel: (610) 328-8103
Report Prepared for the South African Finance Department
Under USAID/Nathan Associates SEGA Project
Revised January 2000

i
Summary
The purpose of this paper is to assess South Africa’s international price and
cost competitiveness, particularly with regard to labor costs, and to examine the
quantitative relationships between South African cost competitiveness and trade
performance.
South African export and investment performance improved markedly during
the 1990s, particularly the post-1994 period, coinciding with the demise of
Apartheid, the ending of sanctions, and the adoption of more liberal economic
policies. However, some questions remain. Although much improved, South
African overall export growth still lags behind that of the most dynamic emerging
economies. Moreover, the improved performance could be due to a one-time post-
sanctions boom rather than a manifestation of sustained long-term competitiveness.
Competitiveness is defined narrowly here as international cost and price
competitiveness, with particular attention to labor costs in manufacturing. Unit
labor costs in manufacturing (labor cost per unit of output or equivalently labor cost
divided by productivity) captures a key underlying determinant of competitiveness
in an important subset of traded goods. We evaluate South Africa’s relative and
absolute competitiveness, i.e., changes over time and levels of South Africa’s prices
and costs compared to other countries.
Relative competitiveness essentially involves calculating real effective exchange
rates (REERs). The REERs presented here differ from those of the IMF and the South
African Reserve Bank (SARB) by including a larger number of developing countries,
especially from Africa and Asia, and by considering a larger set of alternative price
indexes. The main findings are that the choice of weights matters surprisingly little;
the choice of price series, however, does have important bearing on the time path of
ii
the REER. All REER series have similar turning points, including an improvement
in South African competitiveness in the 1990s, but the magnitudes differ.
The paper then presents estimates of the absolute levels of South African wages
and productivity and compares them to a wide range of developed and developing
countries. The main findings are that South African labor appears to be
competitive vis-à-vis most industrial countries, but South African unit labor costs
are high relative to most developing countries, particularly key competitors in Asia
and Latin America.
The effect of cost competitiveness on trade flows is evaluated through
multivariate regressions. The regressions confirm a close visual correlation between
manufacturing exports and the real effective exchange rate. It is very clear that cost
competitiveness has an important effect on trade performance.
In conclusion, South Africa should stay the course on the GEAR strategy of
export-led growth. It takes time for reforms to have their full effects. But more
outward-oriented policies have already paid dividends in the form of strong growth
of manufactured exports and increased foreign direct investment. The improvement
in international competitiveness in the 1990s has been an important factor in
spurring the growth of manufactured exports. Nevertheless, South African unit
labor costs remain high compared to most developing countries. There is certainly
no room to increase real wages faster than productivity. On the contrary, wage
moderation and/or continued real rand depreciation (uncompensated by inflation)
are necessary to gain competitiveness vis-à-vis other emerging markets. It should
be recognized, however, that macroeconomic competitiveness achieved by real
depreciation of the rand by itself is insufficient to resolve the unemployment
problem. Labor market rigidities, crime and educational inadequacies must also be
tackled directly. These microeconomic reforms would complement improved

iii
international competitiveness in leading South Africa towards fulfilling the
objectives of the GEAR strategy.
1
I. Issues
Under the GEAR (Growth, Employment and Redistribution) strategy, initiated
in 1996, the South African government embarked on a bold attempt to overhaul its
economic policies in ways that mirror and complement the dramatic political
changes of post-Apartheid South Africa. In place of the inward-looking and
interventionist policies of the Apartheid era, GEAR makes the private sector the
engine of growth and seeks fuller integration into the world economy. The
government has committed itself to liberalization and privatization, while
reprioritizing public expenditure towards public goods and income distribution, all
while maintaining prudent macroeconomic policies. In particular, the South
African government has substantially liberalized international trade with the hope
of expanding employment through export-led growth and higher foreign direct
investment.
International competitiveness is thus an important pillar of the GEAR strategy.
So far, however, the growth rates of exports and of foreign direct investment, while
substantial, have been less than policymakers had hoped for. Exports of
manufactures have increased but not by enough to generate an export-led growth
boom similar to those of East Asia and a few other dynamic emerging economies.
Moreover, South African manufactured exports are relatively capital intensive and
imports of manufactured goods have increased markedly. Unemployment has
worsened from already high levels, and some estimates of the unemployment rate
are as high as 40%. Real wages have continued to rise in the face of this very high
unemployment. These developments are all suggestive of labor market rigidities,
which some studies have identified as important in South Africa (World Economic

2
Forum competitiveness rankings for example).1 Economic theory suggests that
trade liberalization can increase unemployment if real wages are rigid.2 If this is so,
one might expect to find that South African labor costs are high relative to other
countries, impairing international competitiveness and adjustment to trade
liberalization. Consequently, the purpose of this paper is to assess South Africa’s
international price and cost competitiveness, particularly with regard to labor costs,
and to examine the quantitative relationships between South African cost
competitiveness and trade flows.
Section II presents an overview of South Africa’s recent trade performance.
Section III reviews the theory of international competitiveness. Section IV presents
estimates of South Africa’s relative cost competitiveness, while section V tackles the
more difficult subject of absolute competitiveness. Section VI relates the
competitiveness indicators to trade flows. Section VII concludes with policy
implications.
II. Overview of South African Trade Performance
Figure 1 shows South African growth of exports of goods and services, in
constant $US, in comparison with other “emerging market economies” and the
world as a whole, for various periods. 3 Prior to 1995, South Africa’s trade grew
1 For more detailed discussions of South Africa’s labor markets and the controversy over labor market rigidities, see Nattrass (1998) and Fallon and Lucas (1998). 2 For example, Harry Johnson’s (1965) classic treatment of international trade in the presence of factor-market rigidities. 3 Figure 1 shows exports in constant dollars. This is not the same as trade volumes, but it removes the effect of world inflation. Trade volume data is

3
much more slowly than the rest of the world. In the 1980s and early 1990s, South
Africa’s exports in constant dollars increased by 1-2 per cent annually, while world
trade was increasing by about 5%. Some developing and newly-industrialized
countries had export volume growth rates of 10% or more during part or all of this
period. In 1995-97, however, South Africa’s annual export growth rate jumped to
nearly 9 per cent, slightly exceeding the world average. South Africa’s export
growth slowed sharply in 1998, but so did world trade, due to the Asian crisis
(internationally comparable data are not yet fully available for 1998).
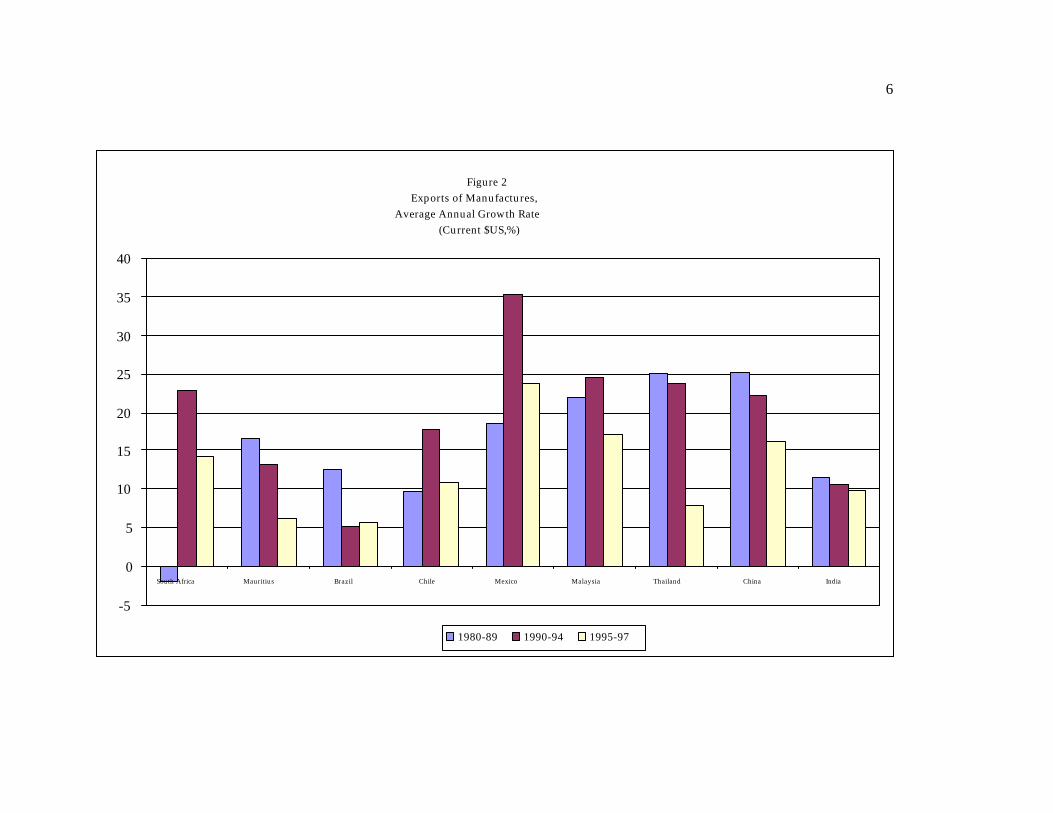
Figure 2 presents growth rates of manufactured exports, in current $U.S.
South Africa had a dismal performance in the 1980s, with manufactured exports
actually declining in nominal dollar terms, while some Asian countries had annual
growth rates in excess of 20 per cent and many others had growth rates of more than
10 per cent. In the early 1990s, South African exports of manufactures boomed
with a growth rate of above 20 per cent, which was in the vicinity of those of the
most dynamic emerging economies. Thus the slow growth of overall South African
exports in the early 1990s masked a structural shift from primary commodities
towards manufactures. In 1995-97, the growth rate of manufactured exports fell in
absolute terms but remained favorable compared to other emerging economies
shown in Figure 2 (below Mexico, Malaysia and China, but greater than Mauritius,
Brazil, Chile, Thailand, and India).
Inflows of foreign direct investment (FDI) into South Africa have increased in
recent years. In 1997, net inflows reached 1.3 per cent of GDP, the highest level
recorded over the 1975-1997 period. Figure 3 displays comparisons of foreign direct
investment net inflows, as a share of GDP. Despite the recent increases, South
less reliable and often not available for recent years for some countries. The source for all data in Figures 1-3 is World Bank World Development Indicators on CD-ROM.

4
African FDI inflows remain low compared to such countries as Chile, China,
Malaysia and Mexico. Also, FDI inflows into South Africa declined sharply in 1998,
as they apparently did for many emerging markets, because of the Asian financial
crisis and its repercussions.

5
Figure 1 Exports of Goods and Services, Average Annual Growth Rate
(Constant $US, %)
0
5
10
15
20
25
World South Africa Mauritius Brazil Chile Mexico Malaysia Korea Thailand China India
1980-89 1990-94 1995-97
6
Figure 2Exports of Manufactures,
Average Annual Growth Rate (Current $US,%)
-5
0
5
10
15
20
25
30
35
40
South Africa Mauritius Brazil Chile Mexico Malaysia Thailand China India
1980-89 1990-94 1995-97

7
Figure 3Foreign Direct Investment Inflows, 1995-97 average Percent of GDP
0
1
2
3
4
5
6
7
South Africa Mauritius Brazil Chile Mexico Malaysia Korea Thailand China India

8
In summary, South African export and investment performance has improved
markedly during the 1990s, particularly the post-1994 period, coinciding with the
demise of Apartheid, the ending of sanctions, and the adoption of more liberal
economic policies. However, some questions remain. Although much improved,
South African overall export growth and FDI inflows still lag behind those of the
most dynamic emerging economies. Moreover, the improved performance could be
due to a one-time post-sanctions boom rather than a manifestation of improved
long-term competitiveness. Another problem is that manufactured exports are
increasingly capital-intensive, and thus fail to absorb much unemployed labor
(Tsikata 1998). We approach these issues through an assessment of South African
international competitiveness, particularly relating to labor costs.
III. Review of International Competitiveness Theory
III.1. What is Competitiveness Anyway?
“International competitiveness” is a much-used phrase whose meaning is not
always clear. Krugman (1994) goes so far as to claim that competitiveness is a
dangerous obsession when applied to countries, as opposed to companies.
Krugman correctly points out that countries are not in direct competition with each
other in the way that Coca Cola and Pepsi Cola are, and international trade is not a
zero-sum game. Nevertheless, meaningful use of the term competitiveness is
possible. In the larger sense, competitiveness can be defined as a favorable business
climate, sometimes measured by a composite score of a series of indicators :
structural and macroeconomic policies, basic infrastructure, education, labor market
rigidities, etc. This is the approach of the World Economic Forum’s competitiveness
rankings. While these rankings are somewhat arbitrary they do often capture
features of the broad business climate.

9
One can define competitiveness more narrowly as international cost and price
competitiveness, which is measured by comparisons of prices or costs across
countries in a common currency, i.e. the real exchange rate. We will focus on this
narrower definition of competitiveness, particularly the real exchange rate based on
relative unit labor costs, which reflects international differences in labor costs and
labor productivity (Turner and Golub 1997). There are some connections between
this narrow conception of competitiveness and the broader notion of the overall
business climate.
III.2. Price and Cost Competitiveness4
Price competitiveness may be defined as the relative price of foreign in terms
of domestic tradable goods. In this usage, a country's competitiveness "improves" if
the relative price of its tradable goods declines. The nominal exchange rate alone is
clearly an unsatisfactory indicator of competitiveness, since movements in relative
prices also matter. Instead, competitiveness is better measured by the real exchange
rate q = ep/p*, which adjusts the nominal exchange rate e (foreign currency per unit
of domestic currency) by domestic and foreign prices (p and p* respectively).5
4This section draws on Turner and Golub (1997). For more background see also Marsh and Tokerick (1994), Turner and Van't Tack (1993), Wickam (1993), Durand and Giorno (1987) and McGuirk (1987). For discussions relating to South Africa see IMF (1998), Kahn (1998) and Walters and De Beer (1999). 5Real exchange rates often refer to the relative price of tradeable and non-tradeable goods within a country, rather than on the relative price of domestic to foreign goods. The focus here, however, is on international competitiveness across countries, so we do not further discuss the traded/non-traded goods measures of real exchange rate in this paper. For further discussion of this issue see Turner and Van't dack (1993, section V.) and Wickam (1993), and Kahn (1998) for South Africa.
10
Often, e and p* are weighted-average measures, with weights based on the domestic
country's pattern of trade, as discussed further below.
The underlying theoretical model justifying a focus on the relative price of
tradable goods across countries assumes that foreign and domestic tradable goods
are imperfect substitutes and/or that adjustment of q to its long-run equilibrium
value takes time because of market imperfections of various sorts.6 If traded goods
were perfect substitutes and adjustment instantaneous, purchasing power parity
would hold at all times, i.e., q would be constant, and competitiveness indicators
would show no variation over time if measured correctly. 7 This framework
therefore applies to international trade in differentiated manufactured goods (and
increasingly trade in services), where there are known departures from the law of
one price.8 In contrast, for most primary products, which are homogeneous and
traded in well-organized markets, the law of one price holds much more closely.
International price and cost competitiveness is an important determinant of
trade flows. If South African competitiveness improves, foreign demand for South
African products should rise, as they become less expensive in foreign markets,
while South African demand for imports would be expected to drop, as the latter
become more expensive to South African buyers. In addition, in a world of high
capital mobility, cost-competitiveness may be a determinant of foreign direct
investment flows. Footloose industries will tend to locate where unit costs of non-
tradable inputs, particularly labor, are low. Costs of tradable inputs such as raw
6See McGuirk (1987) for discussion of theoretical foundations. 7Even if the law of one price holds for all goods separately, aggregate price indexes could still diverge due to differences in weights across countries. But such changes would not reflect movements in competitiveness.
11
materials and capital are likely to be approximately equalized internationally. The
most important non-tradable input is labor. Thus, unit labor cost, i.e., labor cost per
unit of output, is an important determinant of price competitiveness. It should be
recognized, however, that many other factors influence trade and especially foreign
investment. For example, changes in world demand affect exports, and perceptions
of country risk and all the intangible factors that influence the latter are important
for determining investment flows.
III.2.1 Choice of Price/Cost Index
A major practical problem is the choice of price index to measure p and p*. In
principle, p and p* should represent a representative basket of traded goods,
possibly excluding primary products, because the latter's prices cannot diverge
much internationally even if underlying competitiveness changes. p and p*
should also be exogenous with respect to the exchange rate and represent
equilibrium values, rather than temporary movements associated with "pricing to
market" or other short-run influences. In practice such equilibrium traded-goods
price indexes are not observable. The available alternatives are consumer price
indexes (CPIs), wholesale price indexes (WPIs), GDP deflators, export and import
unit values, and unit labor costs. As is well recognized in the literature, each of
these measures has its pros and cons.
The main problem shared by CPIs, WPIs and GDP deflators is that they
include non-traded goods as well as traded goods. If traded and non-traded goods
prices diverge over time, as they often do for various reasons such as differential
sectoral productivity growth, aggregate price indexes could be very misleading
indicators of the prices of traded goods. The CPI-based measures have some
8Isard (1976) for example showed sustained departures from the law of one

12
advantages relative to WPIs and GDP deflators. CPIs are more similar across
countries than WPIs and GDP deflators, and as the most common basis for
measuring inflation, are available for more countries on a timely basis. On the other
hand, CPIs may be poor measures of equilibrium traded goods prices and are
endogenous to the exchange rate. First, CPIs may be distorted by price controls and
excise taxes, and thus diverge from the underlying domestic cost of production.
Second, CPIs may not accurately reflect the prices of intermediate goods, which
represent an increasingly important part of trade in manufactures. Third, a relative
decline in the CPI associated with "pricing to market" may not signify an
improvement in competitiveness, but rather a temporary reduction in profit
margins. Fourth, CPIs are endogenous to the exchange rate since they include
import prices, and therefore understate changes in competitiveness. For example, if
country j's currency depreciates, its import prices rise, pushing up its CPI and
reducing the extent of j's real depreciation.
Relative export and/or import unit values have the advantage of excluding
non-traded goods, but have other deficiencies. Export and import prices may be
heavily influenced by short-run pricing to market and are not exogenous to the
exchange rate. Also, they may be heavily weighted with prices of primary products.
They may fail to reflect the endogenous effects of international competitiveness on
the composition of the goods that are exported and imported, and consequently on
the observed prices of exports and imports. Also, in most cases they are average
values rather than actual prices and may be distorted by composition effects. In
addition, data are not available on a timely basis for many countries, including
South Africa.
price across countries even for very similar manufactured products.

13
Unit labor costs in manufacturing (labor cost per unit of output or
equivalently labor cost divided by output per worker) capture a key underlying
determinant of competitiveness in an important subset of traded goods. By
focusing on costs rather than prices, unit labor costs avoid some of the endogeneity
problems of the CPI and export price measures. Labor costs are less directly subject
to direct exchange-rate effects than traded-goods prices. Unit labor costs have
several limitations, however. First, data on labor productivity and labor
compensation, both of which are needed to compute unit labor costs, are not always
reliable and available on a timely basis. Second, these measures are not widely
available for services, which constitute a growing although still secondary
component of international trade. Third, labor productivity may exhibit short-run
counter-cyclical movements, as firms "hoard" labor in recessions. This problem can
be partially overcome by filtering, however. Fourth, unit labor costs ignore other
costs of production, notably intermediate goods, non-labor taxes, and capital costs.
Similarly, movements in unit labor costs may sometimes reflect factor substitution
rather than changes in efficiency. For example, an increase in the capital stock may
raise the productivity of labor and reduce unit labor costs without necessarily
improving competitiveness, since capital now represents a higher share of unit costs.
But, as noted earlier, to the extent that capital and intermediate goods are traded in
international markets whereas labor remains largely immobile internationally, labor
costs are likely to diverge much more across countries than other costs of
production, and therefore play a disproportionately important role in
competitiveness. Moreover, especially in the advanced economies and increasingly
also in emerging market countries, manufactures constitute a large part of trade.
Turner and Van't dack's (1993, p. 112) comprehensive survey of competitiveness
indicators concludes that for industrial countries, "relative unit labor costs in
manufacturing is probably the best single indicator”. Competitiveness measures
based on unit labor costs are also particularly attractive if the focus is on emerging
economies that are major exporters of manufactures, as South Africa is to some
14
extent. Also, as discussed earlier, other symptoms of labor market rigidities in
South Africa suggest the salience of labor costs in the determination of
competitiveness.
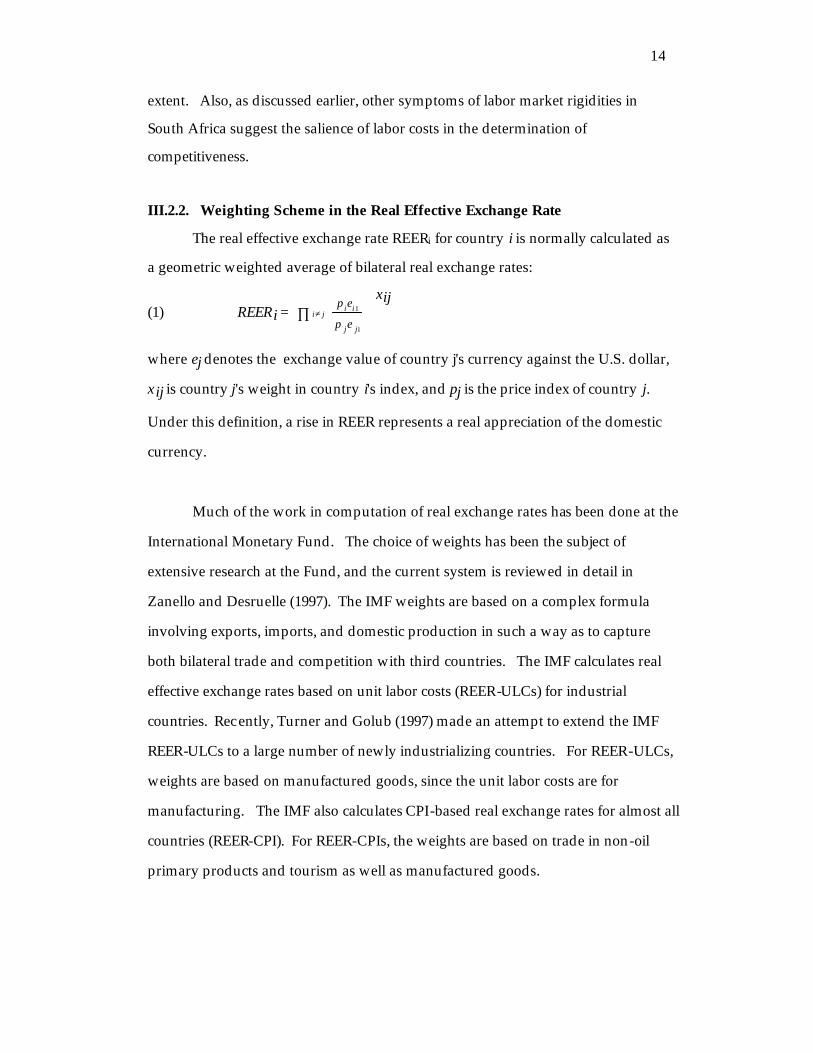
III.2.2. Weighting Scheme in the Real Effective Exchange Rate
The real effective exchange rate REERi for country i is normally calculated as
a geometric weighted average of bilateral real exchange rates:
(1) REERi = i≠ j∏p iei1
p je j1
xij
where ej denotes the exchange value of country j's currency against the U.S. dollar,
xij is country j's weight in country i's index, and pj is the price index of country j.
Under this definition, a rise in REER represents a real appreciation of the domestic
currency.
Much of the work in computation of real exchange rates has been done at the
International Monetary Fund. The choice of weights has been the subject of
extensive research at the Fund, and the current system is reviewed in detail in
Zanello and Desruelle (1997). The IMF weights are based on a complex formula
involving exports, imports, and domestic production in such a way as to capture
both bilateral trade and competition with third countries. The IMF calculates real
effective exchange rates based on unit labor costs (REER-ULCs) for industrial
countries. Recently, Turner and Golub (1997) made an attempt to extend the IMF
REER-ULCs to a large number of newly industrializing countries. For REER-ULCs,
weights are based on manufactured goods, since the unit labor costs are for
manufacturing. The IMF also calculates CPI-based real exchange rates for almost all
countries (REER-CPI). For REER-CPIs, the weights are based on trade in non-oil
primary products and tourism as well as manufactured goods.

15
The IMF weights xij are themselves an average of export and import weights.
The import weights are simply equal to import shares, i.e, the import weight given
to the United States in South Africa’s REER is the U.S. share of total South African
imports. Export weights take into consideration competition in third markets. For
example for South Africa, the IMF weight given to the United States is not equal to
the share of South African exports going to the United States, but attempts to
incorporate the effects of South African competition with the United States in Japan,
Europe, etc. As we will see below, however, the IMF procedure does not seem to
fully reflect the nature of competition that South Africa faces in world markets.
This may be related to the problem that the IMF procedure for computing export
weights is extremely laborious and consequently does not include many countries.
In any event, the weighting scheme turns out to have surprisingly little impact on
the computed REERs for South Africa, as shown below.
III.2.3 Relative versus Absolute Unit Labor Costs Comparisons
The above-discussed REER measures are indexes revealing changes over time
relative to a base year, rather than comparisons of absolute levels of costs or prices
between countries. Some attempts to compare levels of unit labor costs across
countries have been undertaken (Golub 1999). Absolute measures are more difficult
to obtain and are subject to greater measurement error, but are potentially more
informative.
Following the methodology of Golub (1999), this paper will assess the
absolute level of South African unit labor costs relative to other countries.

16
The unit labor requirement of industry i in country j is
(2) aij = Lij
Q ij
where Q is real value added and L employment. aij is the inverse of productivity
(Q/L).
Unit labor cost for sector i in country j is by definition
(3) ULCij= wij . aij
where wij is the wage rate, or more precisely labor cost inclusive of fringe benefits.
Alternatively stated, unit labor costs are equal to the ratio of wages to productivity.
Country j’s competitiveness vis-à-vis country k in sector i depends on
differences in productivity, wages across countries and the bilateral exchange rate
(ejk), which together determine the relative unit labor cost of production cijk in a
common currency
(4) cijk = a ij w ij
a ik w ik e jk
.
Relative unit labor cost can be transformed by multiplying and dividing by
the purchasing-power parity exchange rate pppjk, thus yielding equation (5).
(5) cijk = a ij w ij
a ik w ik e jk
= a ij
a ik
. w ij
w ik ppp jk
. ppp jk
e jk
.
17
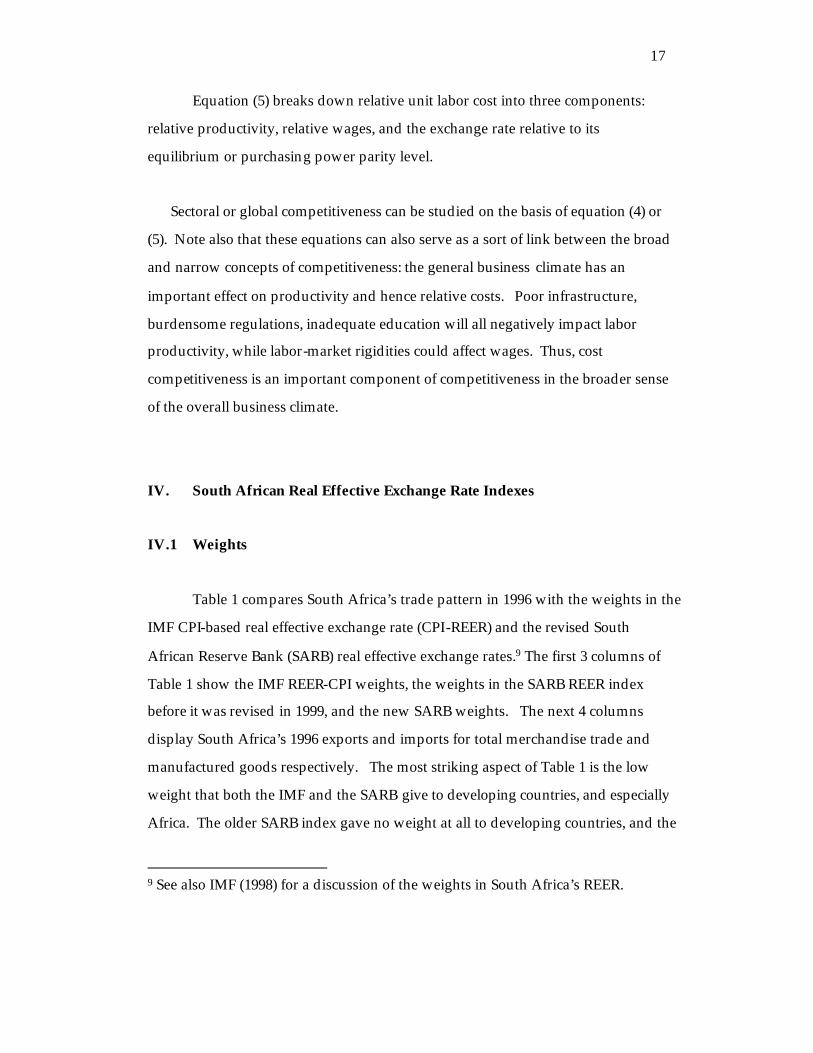
Equation (5) breaks down relative unit labor cost into three components:
relative productivity, relative wages, and the exchange rate relative to its
equilibrium or purchasing power parity level.
Sectoral or global competitiveness can be studied on the basis of equation (4) or
(5). Note also that these equations can also serve as a sort of link between the broad
and narrow concepts of competitiveness: the general business climate has an
important effect on productivity and hence relative costs. Poor infrastructure,
burdensome regulations, inadequate education will all negatively impact labor
productivity, while labor-market rigidities could affect wages. Thus, cost
competitiveness is an important component of competitiveness in the broader sense
of the overall business climate.
IV. South African Real Effective Exchange Rate Indexes
IV.1 Weights
Table 1 compares South Africa’s trade pattern in 1996 with the weights in the
IMF CPI-based real effective exchange rate (CPI-REER) and the revised South
African Reserve Bank (SARB) real effective exchange rates.9 The first 3 columns of
Table 1 show the IMF REER-CPI weights, the weights in the SARB REER index
before it was revised in 1999, and the new SARB weights. The next 4 columns
display South Africa’s 1996 exports and imports for total merchandise trade and
manufactured goods respectively. The most striking aspect of Table 1 is the low
weight that both the IMF and the SARB give to developing countries, and especially
Africa. The older SARB index gave no weight at all to developing countries, and the
9 See also IMF (1998) for a discussion of the weights in South Africa’s REER.

18
developing country weights in the IMF REER-CPI add up to less than 6 percent,
with zero to Africa. The revised SARB index increases the developing-country
weights to about 12 percent, including 2.3 percent for Zimbabwe, but this is still way
below the actual South African trade with developing countries in general and
Africa in particular. In 1996, fully 40 percent of South African exports were to
developing countries with 17 per cent going to Africa and 13 percent to Asia. For
manufactured exports, these shares are even higher: about 45 percent to all
developing countries, 21 percent to Africa and 17 percent to Asia. Between 1988
and 1996, the share of South African exports going to developing countries
expanded by about 10 percentage points. In 1997-98 this share fell back about 5
percent, as exports to Asia declined sharply in the wake of the financial crisis. For
imports, the shares of developing countries are lower, but still above those of the
SARB and the IMF.

19
Table 1 IMF and SARB Weights Compared to South Africa 1996 Trade Patterna
IMF New Old SA SA SA. SA SARB SARB Total Total Manufact Manufact Exports Imports Exports Imports Developed countries 94.3% 88.2% 100.0% 59.6% 72.0% 55.4% 79.0% ECU 46.4% 35.7% 31.6% 20.4% 30.8% 18.7% 34.4% United States 11.6% 15.2% 42.8% 9.8% 13.0% 8.2% 13.6% United Kingdom 11.6% 14.9% 16.7% 13.3% 11.7% 16.0% 13.1% Japan 14.5% 10.3% 8.9% 8.7% 8.3% 5.3% 9.4% Developing countries 5.7% 11.8% 0.0% 40.4% 28.0% 44.6% 21.0% Africa 0.0% 2.3% 17.3% 2.7% 21.3% 1.9% ESSADEC 0.0% 2.3% 13.5% 1.8% 16.6% 1.2% Zimbabwe 2.3% 5.4% 1.0% 7.2% 0.9% Asia 4.1% 8.3% 15.2% 13.5% 14.9% 16.6% China 3.1% 0.8% 2.2% 2.4% 0.4% Hong Kong 2.3% 2.6% 2.6% 1.6% 3.2% 1.8% Korea 2.6% 2.9% 2.0% 2.7% 2.3% Singapore 1.6% 1.7% 1.2% 2.3% 1.3% Taiwan 1.9% 3.2% 3.2% 3.5% 3.6% Other 1.6% 1.2% 7.9% 11.7% 6.8% 4.2% Israel 1.2% 1.2% 2.1% 1.6% 0.7% Brazil 1.6% 1.7% 3.1% 2.2% 1.1%
aThe first 3 columns show the IMF REER-CPI weights, the weights in the SARB REER index before it was revised in 1999, and the new SARB weights. The next 4 columns display South Africa’s 1996 trade pattern for all goods and manufactured goods. Sources: International Monetary Fund, South African Reserve Bank, TIPS, IDC. For more details see the data Appendix.
20
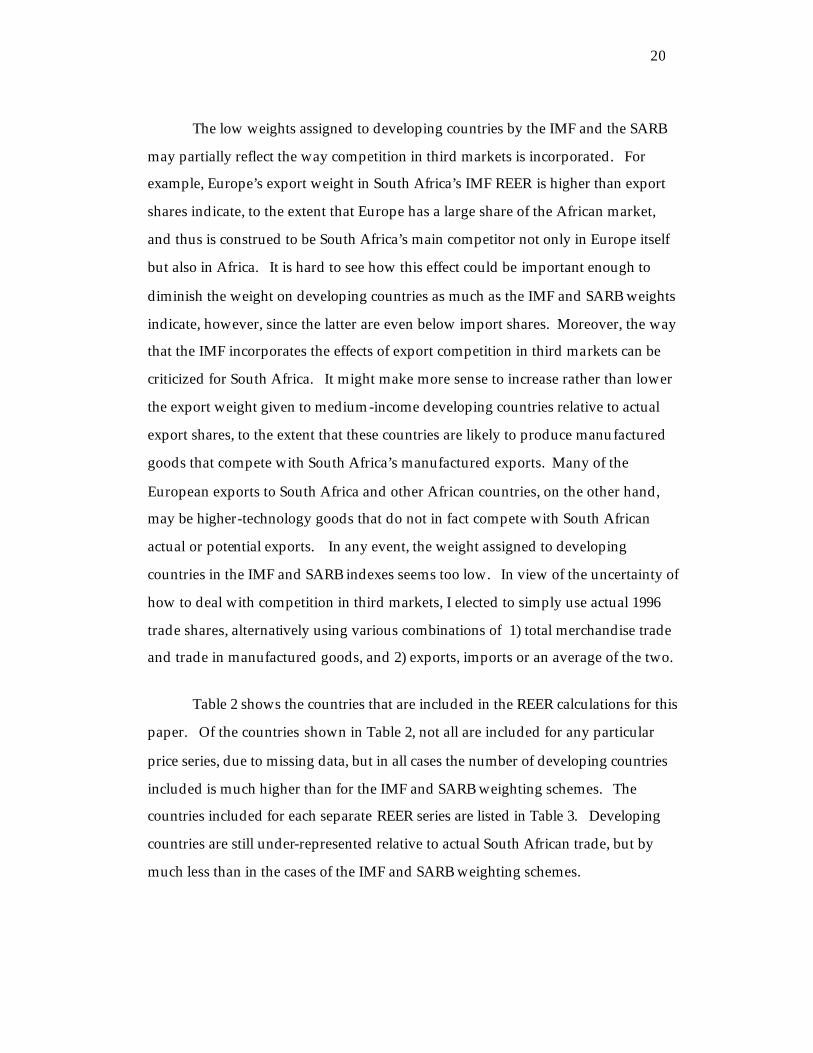
The low weights assigned to developing countries by the IMF and the SARB
may partially reflect the way competition in third markets is incorporated. For
example, Europe’s export weight in South Africa’s IMF REER is higher than export
shares indicate, to the extent that Europe has a large share of the African market,
and thus is construed to be South Africa’s main competitor not only in Europe itself
but also in Africa. It is hard to see how this effect could be important enough to
diminish the weight on developing countries as much as the IMF and SARB weights
indicate, however, since the latter are even below import shares. Moreover, the way
that the IMF incorporates the effects of export competition in third markets can be
criticized for South Africa. It might make more sense to increase rather than lower
the export weight given to medium-income developing countries relative to actual
export shares, to the extent that these countries are likely to produce manufactured
goods that compete with South Africa’s manufactured exports. Many of the
European exports to South Africa and other African countries, on the other hand,
may be higher-technology goods that do not in fact compete with South African
actual or potential exports. In any event, the weight assigned to developing
countries in the IMF and SARB indexes seems too low. In view of the uncertainty of
how to deal with competition in third markets, I elected to simply use actual 1996
trade shares, alternatively using various combinations of 1) total merchandise trade
and trade in manufactured goods, and 2) exports, imports or an average of the two.
Table 2 shows the countries that are included in the REER calculations for this
paper. Of the countries shown in Table 2, not all are included for any particular
price series, due to missing data, but in all cases the number of developing countries
included is much higher than for the IMF and SARB weighting schemes. The
countries included for each separate REER series are listed in Table 3. Developing
countries are still under-represented relative to actual South African trade, but by
much less than in the cases of the IMF and SARB weighting schemes.

21
Table 2
Countries Included in the Real Effective Exchange Rate Calculation of South Africa
Developed Developing Australia Asia Canada China Denmark Hong Kong France India Germany Indonesia Ireland Malaysia Italy Singapore Japan South Korea Netherlands Taiwan Norway Thailand Spain Switzerland Africa United Kingdom Ghana United States Kenya Madagascar Malawi Mauritius Mozambique Nigeria Tanzania Zambia Zimbabwe Americas Argentina Brazil Mexico Europe, Middle East Iran Israel Saudi Arabia Turkey
22
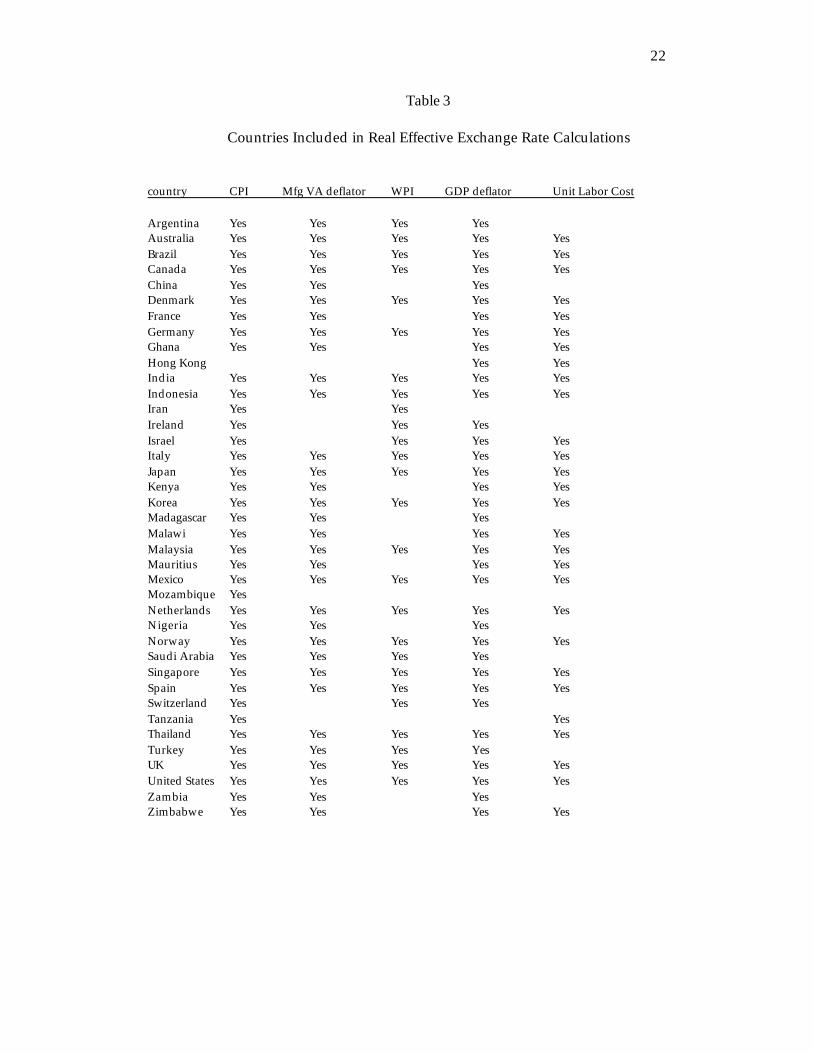
Table 3
Countries Included in Real Effective Exchange Rate Calculations
country CPI Mfg VA deflator WPI GDP deflator Unit Labor Cost Argentina Yes Yes Yes Yes Australia Yes Yes Yes Yes Yes Brazil Yes Yes Yes Yes Yes Canada Yes Yes Yes Yes Yes China Yes Yes Yes Denmark Yes Yes Yes Yes Yes France Yes Yes Yes Yes Germany Yes Yes Yes Yes Yes Ghana Yes Yes Yes Yes Hong Kong Yes Yes India Yes Yes Yes Yes Yes Indonesia Yes Yes Yes Yes Yes Iran Yes Yes Ireland Yes Yes Yes Israel Yes Yes Yes Yes Italy Yes Yes Yes Yes Yes Japan Yes Yes Yes Yes Yes Kenya Yes Yes Yes Yes Korea Yes Yes Yes Yes Yes Madagascar Yes Yes Yes Malawi Yes Yes Yes Yes Malaysia Yes Yes Yes Yes Yes Mauritius Yes Yes Yes Yes Mexico Yes Yes Yes Yes Yes Mozambique Yes Netherlands Yes Yes Yes Yes Yes Nigeria Yes Yes Yes Norway Yes Yes Yes Yes Yes Saudi Arabia Yes Yes Yes Yes Singapore Yes Yes Yes Yes Yes Spain Yes Yes Yes Yes Yes Switzerland Yes Yes Yes Tanzania Yes Yes Thailand Yes Yes Yes Yes Yes Turkey Yes Yes Yes Yes UK Yes Yes Yes Yes Yes United States Yes Yes Yes Yes Yes Zambia Yes Yes Yes Zimbabwe Yes Yes Yes Yes
23
IV.2. Price Series
I calculated REERs for South Africa using the following price indexes:
Consumer Prices (CPI), Wholesale Prices (WPI), GDP deflator, manufacturing value
added deflator (VA Deflator), and unit labor costs (ULC). The IMF REER for South
Africa is based on CPIs. The South African Reserve Bank (SARB) REER uses
wholesale price indexes. Thus we cover most of the possibilities discussed in
section III.2.1, and in addition include the manufacturing value added deflator on
the grounds that it is a reasonable proxy for traded-goods prices. Export prices
were not considered due to lack of data and the fact that for South Africa these
prices would be strongly influenced by the prices of gold and other primary
commodities, whereas the focus here is on competitiveness in manufacturing. All
sources and methods are described in the data Appendix.
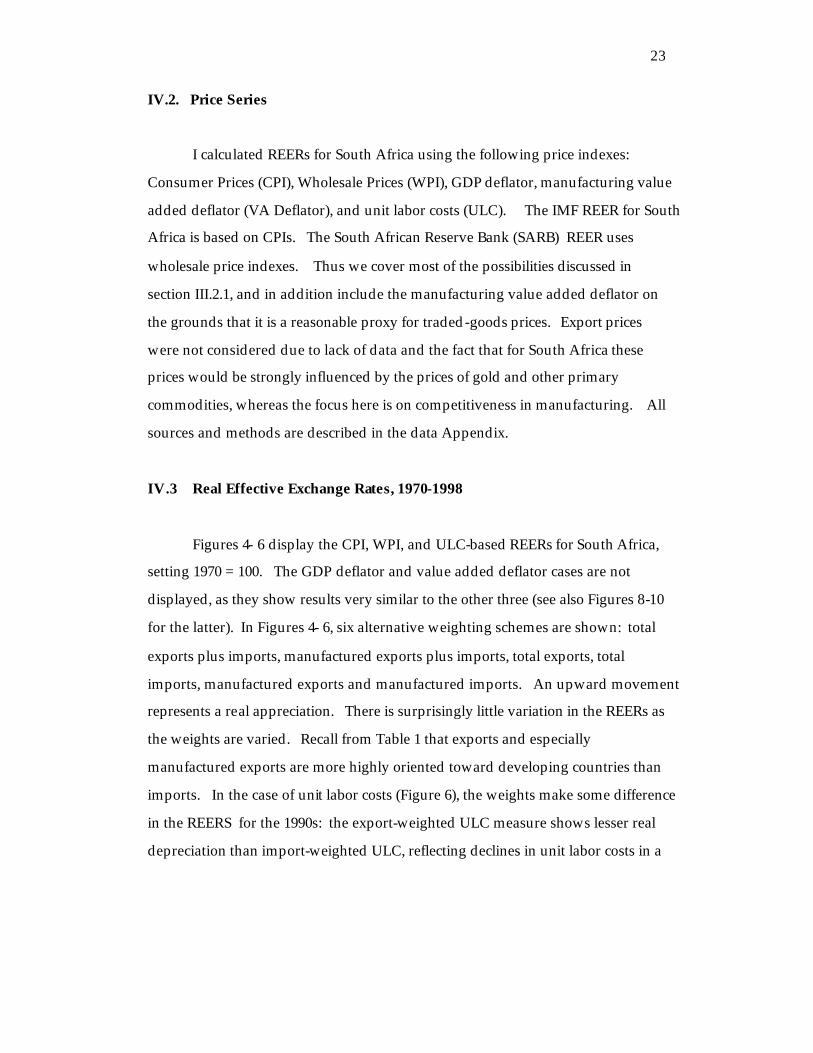
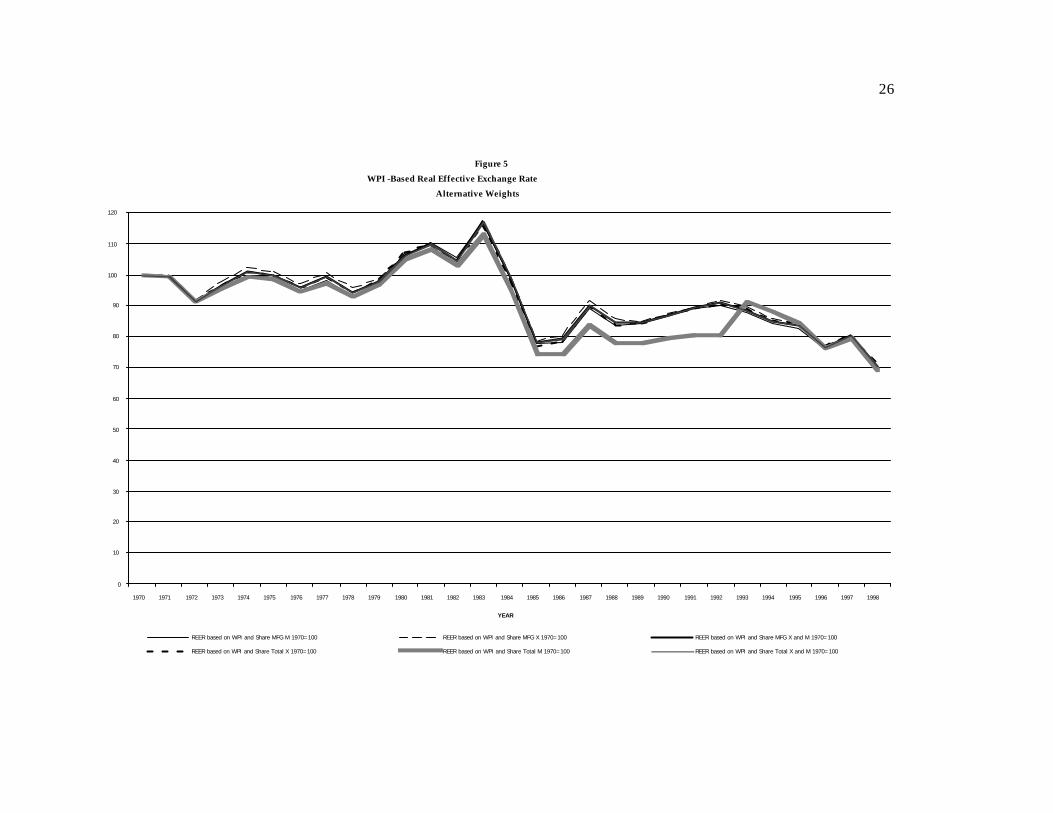
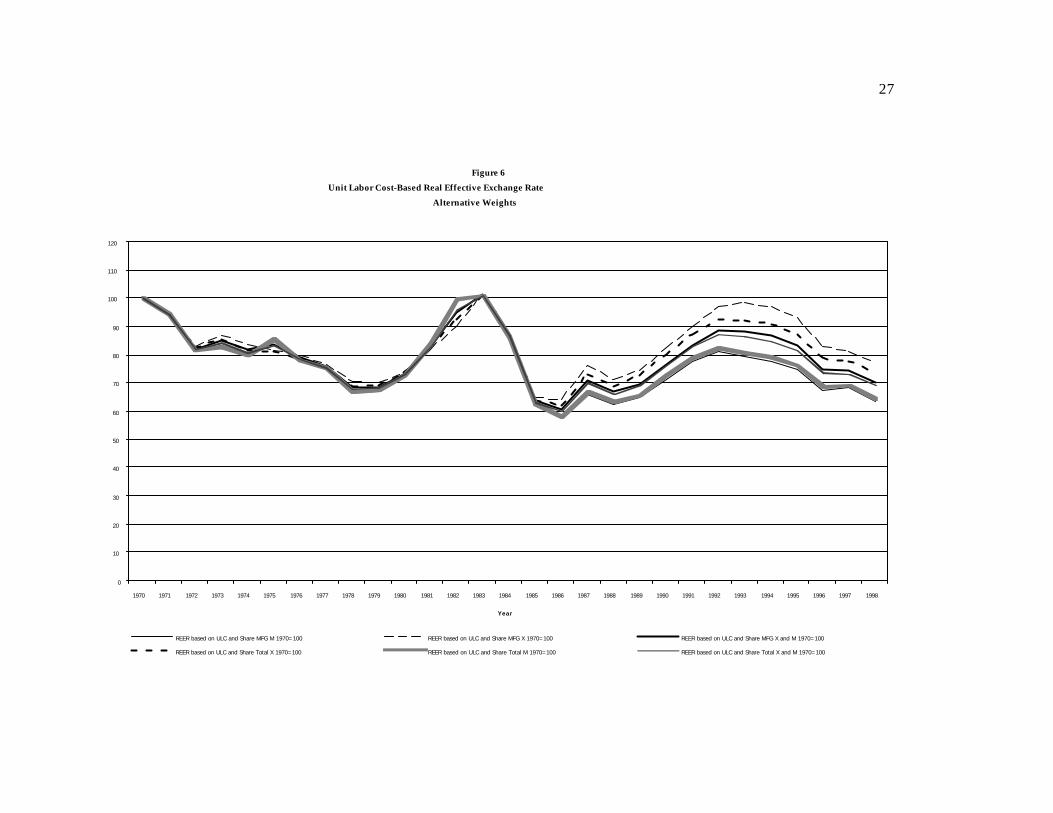
IV.3 Real Effective Exchange Rates, 1970-1998
Figures 4- 6 display the CPI, WPI, and ULC-based REERs for South Africa,
setting 1970 = 100. The GDP deflator and value added deflator cases are not
displayed, as they show results very similar to the other three (see also Figures 8-10
for the latter). In Figures 4- 6, six alternative weighting schemes are shown: total
exports plus imports, manufactured exports plus imports, total exports, total
imports, manufactured exports and manufactured imports. An upward movement
represents a real appreciation. There is surprisingly little variation in the REERs as
the weights are varied. Recall from Table 1 that exports and especially
manufactured exports are more highly oriented toward developing countries than
imports. In the case of unit labor costs (Figure 6), the weights make some difference
in the REERS for the 1990s: the export-weighted ULC measure shows lesser real
depreciation than import-weighted ULC, reflecting declines in unit labor costs in a

24
number of developing countries during this period. Still, even in the case of unit
labor costs, the movements of the different series are very similar.

25
Figure 4CPI-Based Real Effective Exchange Rate
Alternative Weights
0
10
20
30
40
50
60
70
80
90
100
110
120
1970 1971 1972 1973 1974 1975 1976 1977 1978 1979 1980 1981 1982 1983 1984 1985 1986 1987 1988 1989 1990 1991 1992 1993 1994 1995 1996 1997 1998
Year
REER based on CPI and Share MFG M 1970=100 REER based on CPI and Share MFG X 1970=100 REER based on CPI and Share MFG X and M 1970=100
REER based on CPI and Share Total X 1970=100 REER based on CPI and Share Total M 1970=100 REER based on CPI and Share Total X and M 1970=100
26
Figure 5WPI -Based Real Effective Exchange Rate
Alternative Weights
0
10
20
30
40
50
60
70
80
90
100
110
120
1970 1971 1972 1973 1974 1975 1976 1977 1978 1979 1980 1981 1982 1983 1984 1985 1986 1987 1988 1989 1990 1991 1992 1993 1994 1995 1996 1997 1998
YEAR
REER based on WPI and Share MFG M 1970=100 REER based on WPI and Share MFG X 1970=100 REER based on WPI and Share MFG X and M 1970=100
REER based on WPI and Share Total X 1970=100 REER based on WPI and Share Total M 1970=100 REER based on WPI and Share Total X and M 1970=100
27
Figure 6Unit Labor Cost-Based Real Effective Exchange Rate
Alternative Weights
0
10
20
30
40
50
60
70
80
90
100
110
120
1970 1971 1972 1973 1974 1975 1976 1977 1978 1979 1980 1981 1982 1983 1984 1985 1986 1987 1988 1989 1990 1991 1992 1993 1994 1995 1996 1997 1998
Year
REER based on ULC and Share MFG M 1970=100 REER based on ULC and Share MFG X 1970=100 REER based on ULC and Share MFG X and M 1970=100
REER based on ULC and Share Total X 1970=100 REER based on ULC and Share Total M 1970=100 REER based on ULC and Share Total X and M 1970=100
28
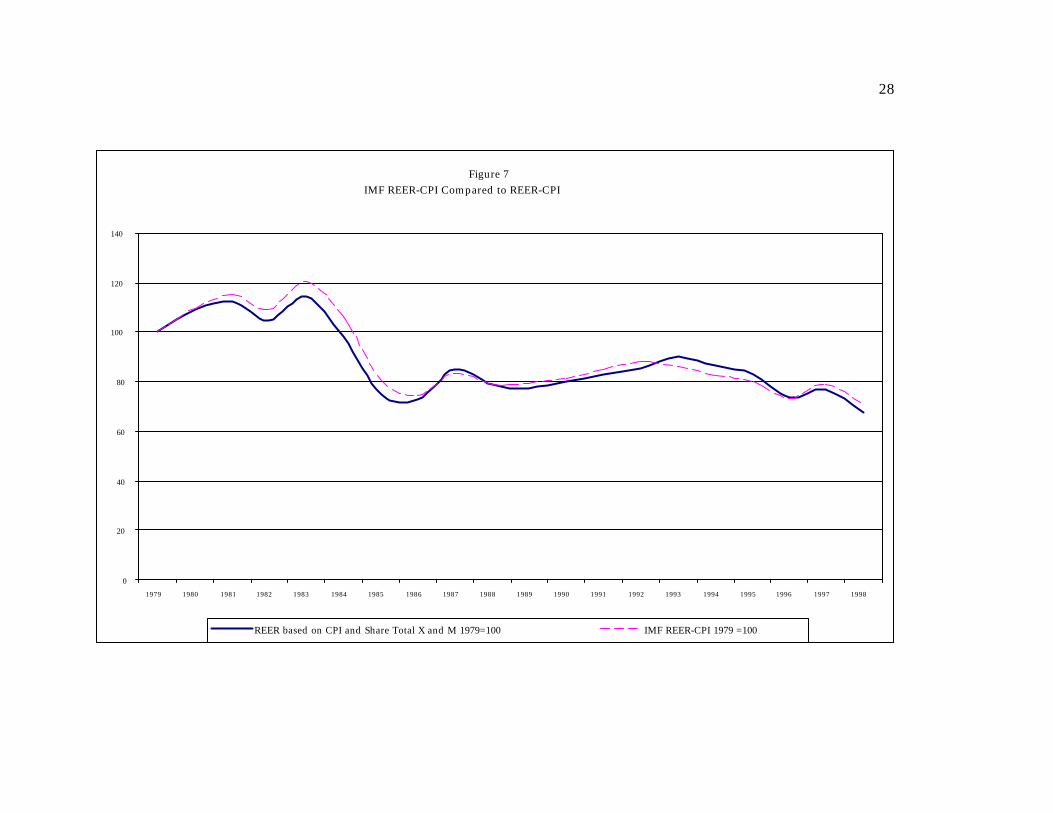
Figure 7IMF REER-CPI Compared to REER-CPI
0
20
40
60
80
100
120
140
1979 1980 1981 1982 1983 1984 1985 1986 1987 1988 1989 1990 1991 1992 1993 1994 1995 1996 1997 1998
REER based on CPI and Share Total X and M 1979=100 IMF REER-CPI 1979 =100

29
The relative unimportance of the weights is also brought out clearly in Figure
7, which compares the IMF REER-CPI with my calculated REER-CPI weighed by
manufactured exports plus imports, setting 1979 = 100, (the first year the IMF series
is available). My series includes almost all the countries in Table 2, whereas the IMF
gives very little weight to developing countries (see Table 1). Despite the large
difference in country weights, the two series in Figure 7 are very closely correlated.
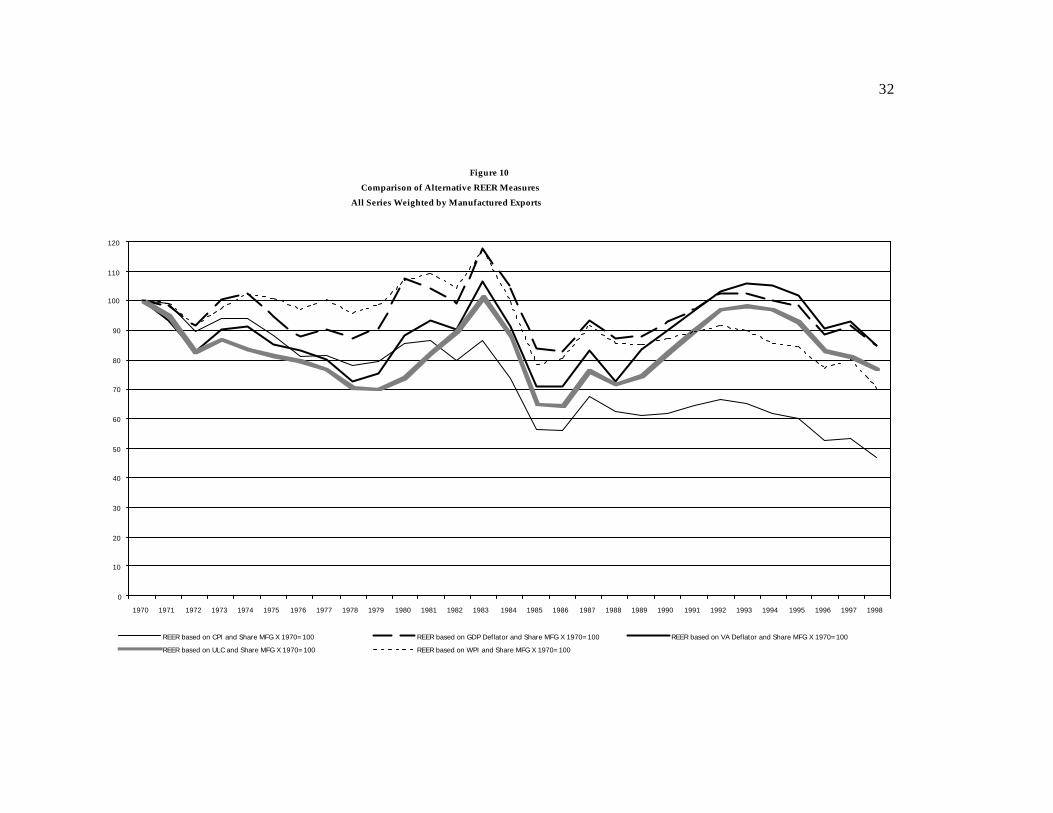
The choice of price index, on the other hand, is somewhat more important.
Figures 8-10 display the different REER measures, holding constant the weights.
Figure 8 uses total exports plus imports to weight all REERs shown, Figure 9 uses
manufactured trade weights, and Figure 10 uses manufactured exports weights.
There is considerable divergence between the various REER measures in each of
these cases. The CPI series in particular show a declining long-term trend for the
real exchange rate over the 1970-1998 period that is less apparent for the other series.
The GDP deflator and the manufacturing value-added deflator exhibit the smallest
long-run real depreciation, with the WPI and the ULC indicators in between. There
is, however, a substantial correlation in the turning points of the various REER
series, especially after the late 1970s. According to the REER series as a group,
South African competitiveness worsened in the early 1980s then improved
dramatically in the mid-1980s. There was then another period of real appreciation
through around 1992. The rest of the 1990s have witnessed a substantial real
depreciation, roughly returning real exchange rates to their late 1980s levels.

30
Figure 8Comparison of Alternative REER Measures
All Series Weighted by Total Exports Plus Imports
0
10
20
30
40
50
60
70
80
90
100
110
120
1970 1971 1972 1973 1974 1975 1976 1977 1978 1979 1980 1981 1982 1983 1984 1985 1986 1987 1988 1989 1990 1991 1992 1993 1994 1995 1996 1997 1998
REER based on CPI and Share Total X and M 1970=100 REER based on GDP Deflator and Share Total X and M 1970=100
REER based on VA Deflator and Share Total X and M 1970=100 REER based on ULC and Share Total X and M 1970=100
REER based on WPI and Share Total X and M 1970=100

31
Figure 9Comparison of Alternative REER Measures
All Series Weighted by Manufactured Exports Plus Imports
0
10
20
30
40
50
60
70
80
90
100
110
120
1970 1971 1972 1973 1974 1975 1976 1977 1978 1979 1980 1981 1982 1983 1984 1985 1986 1987 1988 1989 1990 1991 1992 1993 1994 1995 1996 1997 1998
REER based on CPI and Share MFG X and M 1970=100 REER based on GDP Deflator and Share MFG X and M 1970=100
REER based on VA Deflator and Share MFG X and M 1970=100 REER based on ULC and Share MFG X and M 1970=100
REER based on WPI and Share MFG X and M 1970=100
32
Figure 10Comparison of Alternative REER Measures
All Series Weighted by Manufactured Exports
0
10
20
30
40
50
60
70
80
90
100
110
120
1970 1971 1972 1973 1974 1975 1976 1977 1978 1979 1980 1981 1982 1983 1984 1985 1986 1987 1988 1989 1990 1991 1992 1993 1994 1995 1996 1997 1998
REER based on CPI and Share MFG X 1970=100 REER based on GDP Deflator and Share MFG X 1970=100 REER based on VA Deflator and Share MFG X 1970=100
REER based on ULC and Share MFG X 1970=100 REER based on WPI and Share MFG X 1970=100
33
V. South African Wages, Productivity, and Unit Labor Costs
Section IV presented calculations of real effective exchange rates, including
some based on unit labor costs. These indicators show changes over time rather
than levels of competitiveness. Thus, for example, while we can determine that
competitiveness improved since the early 1990s, we cannot determine whether
competitiveness is strong in absolute terms--it may simply be less bad than before.
In this section, South African levels of labor cost in aggregate manufacturing are
compared to other countries on a bilateral basis.
It should be remembered, as mentioned earlier, that calculations of the absolute
level of competitiveness are far more difficult and subject to greater error than for
rates of change. First, there are differences in the way countries measure value
added and labor costs. To the extent that these measurement differences do not
vary too much over time, they pose less of a problem for assessing changes in
competitiveness than for levels. Second, comparisons of productivity require some
estimate of the equilibrium or purchasing-power-parity exchange rate to convert
output into a common currency. It is not appropriate to use market exchange rates
to convert real output into a common currency, as short-run fluctuations in
exchange rates do not in general reflect real productivity changes. A country’s
productivity does not increase simply because its currency appreciates. Estimates
of purchasing-power-parity (PPP) exchange rates for manufacturing are not
available for South Africa.10 In the absence of a suitable PPP exchange rate, I used
10The International Comparison Project (ICP) has calculated PPP exchange rates for many countries, but these are expenditure-based and cannot readily be used for manufacturing production. In any case, no ICP study of South Africa has ever been done. The International Comparison of Output Project (ICOP) at the University of Groningen has calculated manufacturing PPPs for a limited number of countries, but not for South Africa.
34
the average real exchange rate over the 1970-1998 period as a proxy for the long-run
equilibrium real exchange rate.
As noted above, unit labor cost is equal to the ratio of wages to labor
productivity. Productivity is calculated as real value added per employee, using the
manufacturing value added deflator to deflate nominal value added, which is then
converted to rand using the mean real exchange rate. Wages are defined here as
total remuneration of labor, inclusive of non-cash fringe benefits, divided by number
of employees.11 Wages are converted to rand using the market exchange rate.
Methods and data sources are explained in the Appendix. Note then that by
construction, movements in exchange rates affect relative wages, but not relative
productivity, as is appropriate (see equation (4) and related discussion above).
Figure 11 compares South African wages and productivity to those of the major
industrial countries in 1990 and 1998. Figure 12 presents similar data for a number
of developing countries. Some clear patterns emerge.
•South African labor costs in the 1990s in manufacturing are quite competitive
vis-à-vis industrial countries. South African productivity is well below that of
industrial countries, but in most cases, relative South African wages are even lower.
That is, South African unit labor costs, the ratio of wages to productivity, are
generally below those of industrial countries both in 1990 and 1998. In the case of
the United States, for example, Figure 11 shows that South African wages and
productivity were both around 25 per cent the U.S. level in 1990, meaning that South
African unit labor costs were almost equal to those of the United States.
11 For some countries, there is no data on fringe benefits. The comparisons attempt to adjust for this. See the Appendix for details.

35
Figure 11
South African Wages and Productivity, Relative to Industrial Countries, (SA = 1.0)
1990
0
0.1
0.2
0.3
0.4
0.5
USA Japan Germany France UK Italy Canada
SA Relative Productivity SA Relative Wage
1998
0
0.1
0.2
0.3
0.4
0.5
USA Japan Germany France UK Italy Canada
SA Relative Productivity SA Relative Wage
36
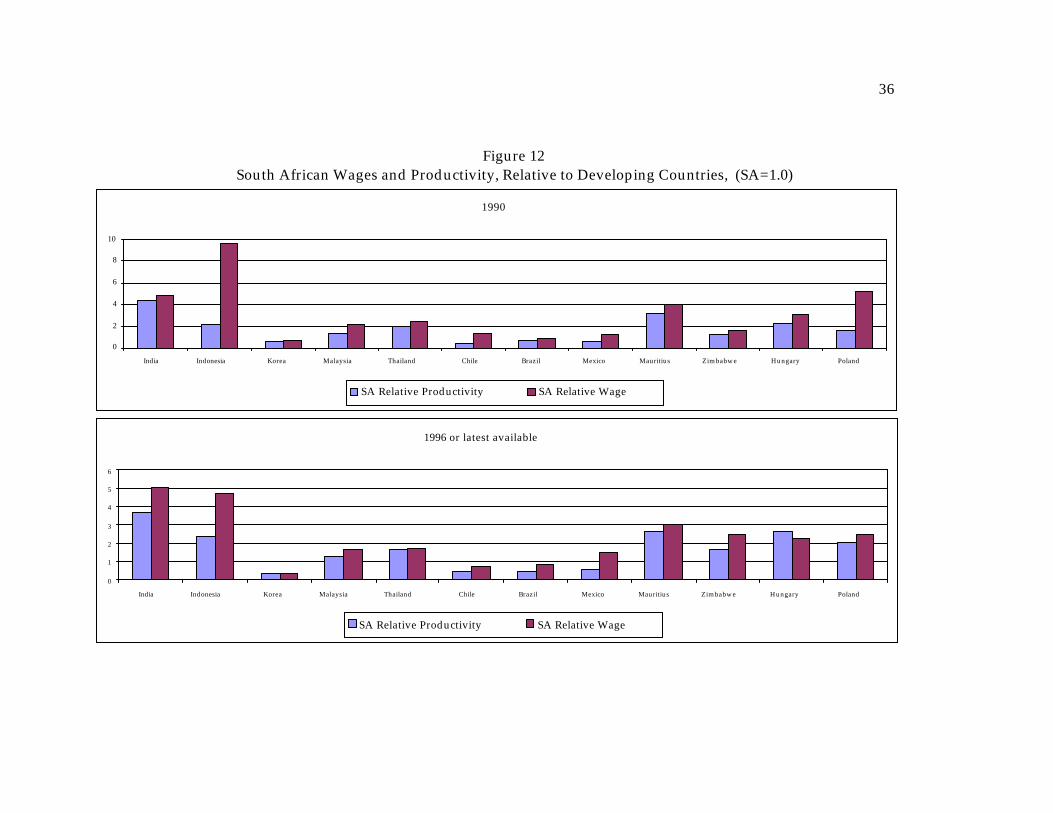
Figure 12 South African Wages and Productivity, Relative to Developing Countries, (SA=1.0)
1990
0
2
4
6
8
10
India Indonesia Korea Malaysia Thailand Chile Brazil Mexico Mauritius Zimbabwe Hungary Poland
SA Relative Productivity SA Relative Wage
1996 or latest available
0
1
2
3
4
5
6
India Indonesia Korea Malaysia Thailand Chile Brazil Mexico Mauritius Zimbabwe Hungary Poland
SA Relative Productivity SA Relative Wage

37
All 1996 except Brazil 1994, Poland 1994, Thailand 1995, Mexico 1995, India 1997, Hungary 1997, Chile 1997.
38
•Vis-à-vis almost all developing countries that are major exporters of
manufactures, however, South African unit labor costs are generally high, i.e.
relative South African wages exceed South African productivity. Note that there is
a very large variation in South Africa’s overall level of wages and productivity vis-à-
vis other developing countries in Figure 12. South African manufacturing
productivity is two to four times greater than that in India, Indonesia, and Thailand,
but is lower than Korean and Chilean productivity. Regardless of this variation in
productivity differentials, South African relative wages exceed South African
relative productivity in all cases in 1990 and all but one in 1996 (the exception is
Hungary), implying that South African unit labor costs are high relative to other
developing countries.
•South African labor’s competitiveness improved against most countries
during the 1990s as relative wages generally declined. This corresponds to the real
depreciation of the rand during the 1990s observed in Figures 4-10. There are some
exceptions among the developing countries, however (India, Mexico). Also, there
are no data for 1998 for developing countries, but the large depreciations in Asia and
Latin America in the aftermath of the 1997-98 Asian crisis undoubtedly substantially
deteriorated South Africa’s competitiveness.
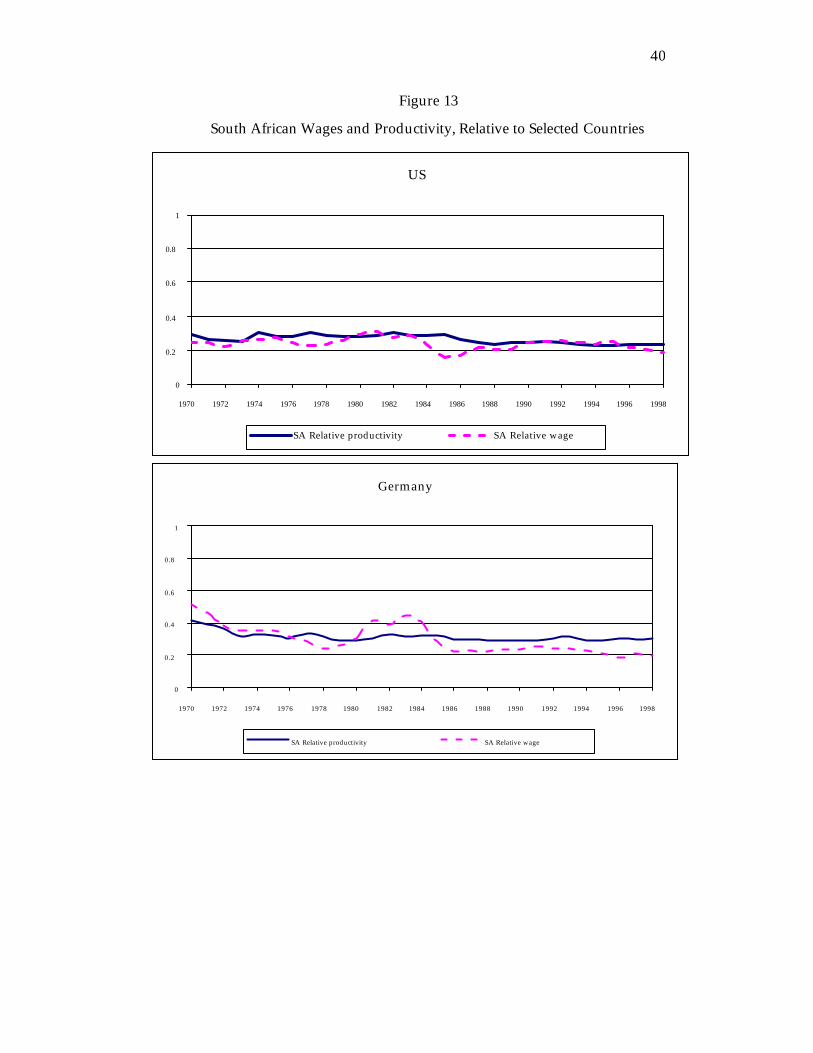
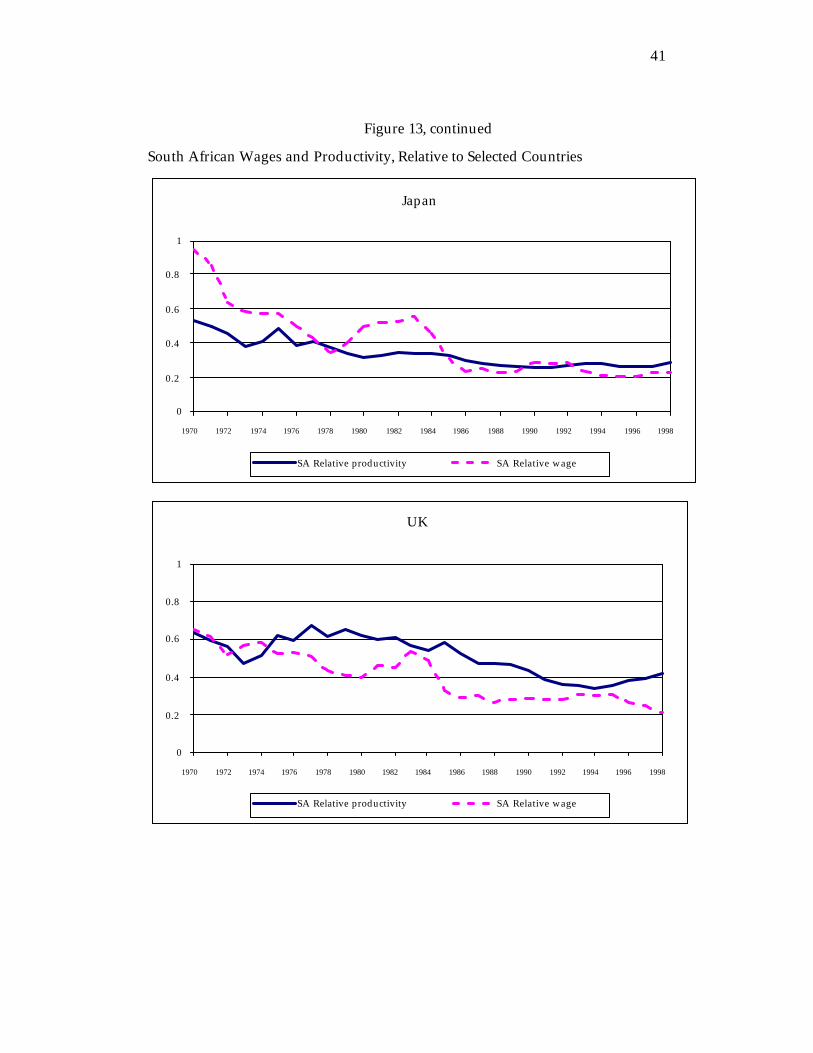
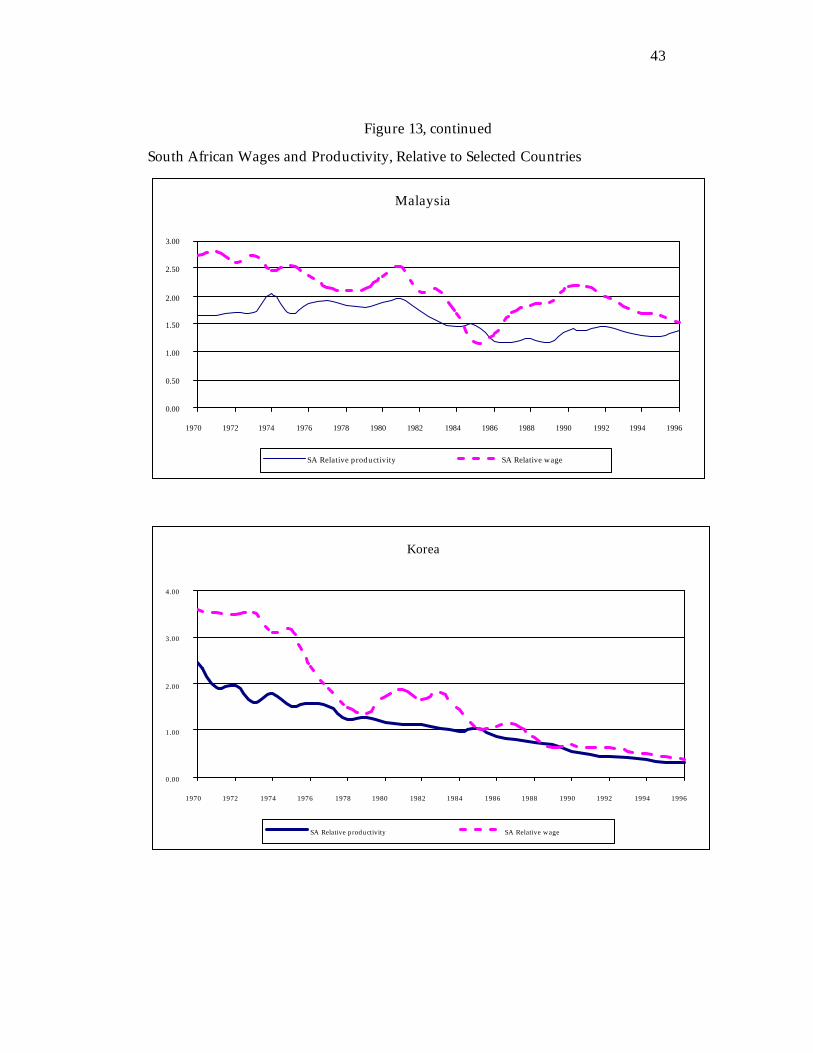
Figure 13 shows time series of South African wages and productivity relative to
a number of the countries in Figures 11 and 12 : the United States, Japan, Germany,
U.K., Korea, Malaysia, Chile, Mexico, Mauritius and Zimbabwe. This is to give a
fuller picture of the evolution over time of South African bilateral competitiveness.
Vis-a-vis the industrial countries, South African productivity and wages move
together fairly closely. Some recent improvement of South African competitiveness
is generally visible in these cases. There is more variation vis-à-vis developing
countries and these figures defy a simple summary. In the case of Mexico, for
example, South Africa suffered losses of competitiveness following the 1982 debt
crisis and again in 1994-95 following the 1994 peso collapse. Against Chile,

39
however, South African competitiveness improved substantially between 1990 and
1997. South African labor had a competitive edge against Zimbabwe until about
1989, but in the early 1990s there was a big decline in relative Zimbabwe wages, due
largely to depreciation of the Zimbabwean currency.
In summary, South African unit labor costs appear to be competitive against
developed countries but much less so against developing countries. To the extent
that South Africa competes primarily against other developing countries, there is a
serious labor cost problem. Also, the wage/productivity comparisons reported
here may understate the adverse effects of high South African labor costs on
unemployment. If labor costs are high and inflexible, productivity will rise over
time endogenously, as firms shed labor and adopt more capital-intensive production
techniques, thus raising the marginal and average product of labor. Consequently,
an ex post correlation of labor costs and productivity does not by itself prove that
labor costs are not “too high”. The productivity/wage comparisons, however, are
mainly concerned with assessing international competitiveness, rather than
determining the real wage that clears the labor market.
40
Figure 13
South African Wages and Productivity, Relative to Selected Countries
US
0
0.2
0.4
0.6
0.8
1
1970 1972 1974 1976 1978 1980 1982 1984 1986 1988 1990 1992 1994 1996 1998
SA Relative productivity SA Relative wage
Germany
0
0.2
0.4
0.6
0.8
1
1970 1972 1974 1976 1978 1980 1982 1984 1986 1988 1990 1992 1994 1996 1998
SA Relative productivity SA Relative wage
41
Figure 13, continued
South African Wages and Productivity, Relative to Selected Countries
Japan
0
0.2
0.4
0.6
0.8
1
1970 1972 1974 1976 1978 1980 1982 1984 1986 1988 1990 1992 1994 1996 1998
SA Relative productivity SA Relative wage
UK
0
0.2
0.4
0.6
0.8
1
1970 1972 1974 1976 1978 1980 1982 1984 1986 1988 1990 1992 1994 1996 1998
SA Relative productivity SA Relative wage

42
Figure 13, continued
South African Wages and Productivity, Relative to Selected Countries
Indonesia
0.00
3.00
6.00
9.00
12.00
15.00
1970 1972 1974 1976 1978 1980 1982 1984 1986 1988 1990 1992 1994 1996
SA Relative productivity SA Relative wage at PPP exchange rate
India
0.00
2.00
4.00
6.00
8.00
10.00
1970 1972 1974 1976 1978 1980 1982 1984 1986 1988 1990 1992 1994 1996
SA Relative productivity SA Relative wage
43
Figure 13, continued
South African Wages and Productivity, Relative to Selected Countries
Malaysia
0.00
0.50
1.00
1.50
2.00
2.50
3.00
1970 1972 1974 1976 1978 1980 1982 1984 1986 1988 1990 1992 1994 1996
SA Relative productivity SA Relative wage
Korea
0.00
1.00
2.00
3.00
4.00
1970 1972 1974 1976 1978 1980 1982 1984 1986 1988 1990 1992 1994 1996
SA Relative productivity SA Relative wage

44
Figure 13, continued
South African Wages and Productivity, Relative to Selected Countries
Mexico
0.00
0.50
1.00
1.50
2.00
2.50
1970 1972 1974 1976 1978 1980 1982 1984 1986 1988 1990 1992 1994
SA Relative productivity SA Relative wage
Chile
0.00
0.50
1.00
1.50
2.00
2.50
1970 1972 1974 1976 1978 1980 1982 1984 1986 1988 1990 1992 1994 1996
SA Relative productivity SA Relative wage

45
Figure 13, continued
South African Wages and Productivity, Relative to Selected Countries
Zimbabwe
0.00
0.50
1.00
1.50
2.00
2.50
3.00
3.50
1970 1972 1974 1976 1978 1980 1982 1984 1986 1988 1990 1992 1994 1996
SA Relative productivity SA Relative wage
Mauritius
0.00
1.00
2.00
3.00
4.00
5.00
6.00
1970 1972 1974 1976 1978 1980 1982 1984 1986 1988 1990 1992 1994 1996
SA Relative productivity SA Relative wage

46
VI. Competitiveness and Trade Performance
VI.1 Correlations between the REER and Trade and Investment Flows
In this section the relationship between trade flows and competitiveness
indicators is evaluated using some simple charts. We will then turn to regressions.
Figure 14 plots South African real manufactured exports12 divided by real GDP
against the real effective exchange rate based on unit labor costs, inverted for ease of
visual inspection (so that an increase in the REER index now represents a
depreciation, i.e. an improvement in competitiveness). There is a strikingly close
correlation between the two variables. The only apparent anomaly is that
manufactured exports have grown more rapidly in the 1990s than competitiveness
alone would justify. This is readily explicable in terms of a combination of the
ending of sanctions associated with Apartheid and the adoption of more outward
oriented economic policies.
Figure 15 plots real manufactured imports divided by real GDP against
competitiveness in the same way as in Figure 14. Contrary to the theoretical
presumption, there appears to be a positive correlation between manufactured
imports and competitiveness, although a much weaker one than for exports. This
could be due to a high import-intensity of manufactured exports.
12 Exports and imports are deflated by the manufacturing value added deflator. This is an imperfect choice, especially for imports.

47
Figure 14Real Manufactured Exports (as % of real GDP) v. Inverted REER-ULC
100
0.0
2.0
4.0
6.0
8.0
10.0
12.0
14.0
1970 1972 1974 1976 1978 1980 1982 1984 1986 1988 1990 1992 1994 1996 1998
0
20
40
60
80
100
120
140
160
180
(SA Total manufacturing X/South Africa's VA Deflator)/SA real GDP REER based on ULC and Share MFG X 1970=100

48
Figure 15Real Manufactured Imports (as % of real GDP) v. Inverted REER-ULC
100
0.0
5.0
10.0
15.0
20.0
25.0
1970 1972 1974 1976 1978 1980 1982 1984 1986 1988 1990 1992 1994 1996 1998
0
20
40
60
80
100
120
140
160
180
(SA Total manufacturing M/South Africa's VA Deflator)/SA real GDP REER based on ULC and Share MFG X 1970=100

49
Figure 16Gross Foreign Direct Investment (as % of GDP) v. Inverted REER-ULC
100
0
20
40
60
80
100
120
140
1976 1978 1980 1982 1984 1986 1988 1990 1992 1994 1996
0
0.2
0.4
0.6
0.8
1
1.2
1.4
1.6
REER based on ULC and Share Total X and M 1976=100 Gross foreign direct investment (% of GDP, PPP)
50
Figure 16 plots net inflows of direct foreign investment against the inverted
REER. No correlation shows up in this case. Instead, the most salient feature is the
big increase in FDI inflows in the late 1990s. As discussed in section II, however, the
South African ratio of FDI to GDP remains well below that attained by some other
developing countries and it fell sharply in 1998.
VI.2 Econometric Specification
This section examines the statistical relationship between real exchange rates
and trade flows, attempting to control for changes in domestic and world demand,
and tariff rates on imports. Conventional trade equations were specified. See
Goldstein and Khan (1986) for a review of the literature on modelling the price-
responsiveness of trade flows, and Golub (1994) for an example of this kind of
modelling. Equations (6) and (7) show the baseline specification. The same
regressions were also run with the variables first-differenced to deal with possible
non-stationarity problems. All variables were logged.
(6) EXP = β1 + β2 REER-xxx + β3 WORLDGDP
(7) IMP = β1 + β2 REER-xxx + β3 SAGDP + β4 TARIFF
Dependent Variables
EXP, IMP : real exports and imports, deflated by the GDP deflator.
EXMFG, IMMFG: real exports and imports of manufactures, deflated by the
manufacturing deflator.
51
Independent Variables
REER-xxx: Real effective exchange rate of the rand, alternatively using Consumer
Prices (REER-CPI), Wholesale Prices (REER-WPI), GDP deflator (REER-GDP),
manufacturing value added deflator (REER-VAD), and unit labor costs (REER-
ULC). Weights on the REERs are chosen to match the dependent variable. For
example, when manufactured exports are the dependent variable, REER uses
manufactured export weights.
WORLDGDP: World Real GDP in 1995 US $,
SAGDP: South African Real GDP, in 1995 Rand
TARIFF: Duties collected divided by total imports.
VI.3 Results
Table 4 shows the results of equation (6) using various alternative REER
measures. In this case the REER is not inverted so that the expected sign of the
REER is negative (i.e., a real appreciation should reduce real manufactured exports).
The strong negative effect of REER shows up in each case, with the magnitude of the
elasticity varying from about 0.8 to 1.4. (Recall that all variables are logged so
coefficients can be interpreted as elasticities). The income-elasticity on world GDP
varies from about 1.0 to 1.4 except for the REER-CPI where it is only 0.6,
undoubtedly reflecting the very different trend behavior of the REER-CPI shown in
Figures 8-10. In short, Table 4 confirms the visual correlation observed in Figure 14:
manufactured exports respond strongly to improved competitiveness.

52
Table 4
Regressions of Real Manufactured Exports Using Alternative REERs
EXPMFG = ββ 11 + ββ 22 �REER-xxx + ββ 3 3 �WORLDGDP
Constant REER-xxx WORLDGDP R-squared REER-ULC 1.98 -0.78 1.35 0.89 (1.99)* (-4.07)** (13.68)** REER-CPI 6.21 -0.94 0.62 0.87 (2.38)* (-3.03)** (2.34)* REER-GDP 5.15 -1.37 1.27 0.91 (3.78) -(5.18)** (14.18)** REER-WPI 5.05 -1.07 1.02 0.88 (2.63) (-3.56)** (7.22)** REER-VAD 1.70 -0.79 1.42 0.89 (1.70) (-3.76)** (13.86)** t-statistics in parentheses. ** denotes statistical significance at 1% level, * at 5% level.
53
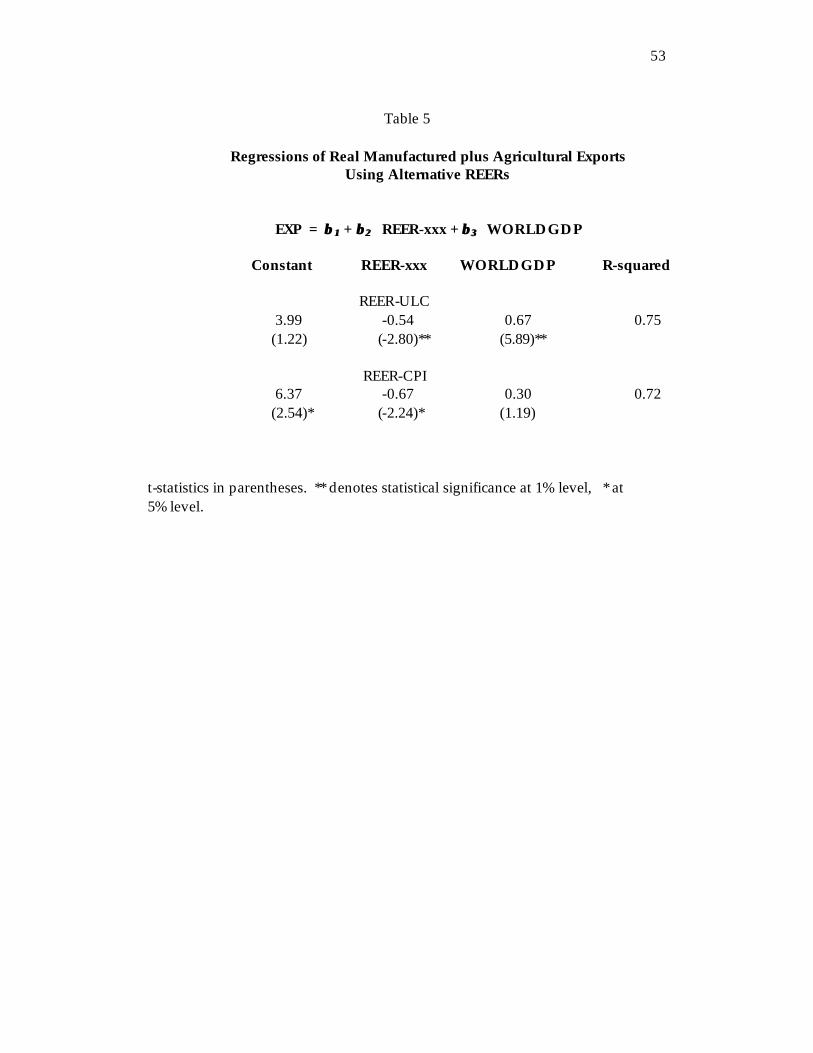
Table 5
Regressions of Real Manufactured plus Agricultural Exports
Using Alternative REERs
EXP = ββ 11 + ββ 22 REER-xxx + ββ 3 3 WORLDGDP Constant REER-xxx WORLDGDP R-squared REER-ULC 3.99 -0.54 0.67 0.75 (1.22) (-2.80)** (5.89)** REER-CPI 6.37 -0.67 0.30 0.72 (2.54)* (-2.24)* (1.19) t-statistics in parentheses. ** denotes statistical significance at 1% level, * at 5% level.

54
Table 5 reports the same equation except that the dependent variable is non-
mining exports, i.e. manufacturing plus agriculture. Agricultural exports are only
about one fourth of manufactured exports, so one would not expect much change.
The results again varied little with the REER choice, so only two are reported, for
unit labor costs and CPI. The former is chosen because unit labor costs are
preferred on the theoretical grounds discussed earlier, the latter because the CPI is
the best in terms of data availability. The elasticities on the REER variable fall a bit,
but the strong effect of this variable remains. The coefficient on world GDP drops
considerably and is estimated with less precision. When mining is included, the
REER coefficient remains negative, but the statistical significance declines. This is
not surprising because gold exports are not likely to respond much to the real
effective exchange rate.13
Table 6 turns to real imports of manufactures. Real appreciation (loss of
competitiveness) should lead to a rise in imports, so a positive coefficient is
expected. Instead, the signs on the REER variables in four out of five cases are
negative, although they are small and statistically insignificant in all but the VAD
case. For REER-WPI the sign is positive and insignificant. The elasticity on South
African GDP is near 1.0 and statistically significant in all five cases. The coefficient
on the tariff variable is also always negative and significant, consistent with
theoretical prediction.
13 Also, total exports are deflated by the GDP deflator which is obviously inappropriate if gold is included. This issue is not pursued further, however, since our focus here is on manufactured exports.

55
Table 6
Regressions of Real Manufactured Imports using Alternative REERs IMPMFG = ββ 11 + ββ 22 REER-xxx + ββ 3 3 SAGDP + ββ 4 4 TARIFF
Constant REER-xxx SAGDP TARIFF R-squared REER-VAD 2.11 -0.32 1.02 -0.37 0.83 (2.57)* (-2.31)* (9.61)** (-5.82)** REER-CPI 1.15 -0.06 0.97 -0.36 0.79 (0.67) (-0.31) (4.98)** (-5.17)** REER-GDP 1.29 -0.11 0.99 -0.36 0.79 (1.03) (-0.57) (7.69)** (-5.20)** REER-ULC 1.96 -0.20 0.93 -0.36 0.81 (1.86) (-1.46) (7.35)** (-5.37)** REER-WPI 0.31 0.05 1.04 -0.36 0.79 (0.22) (0.28) (7.45)** (-5.15)** t-statistics in parentheses. ** denotes statistical significance at 1% level, * at 5% level.

56
Table 7
Regressions of Changes in Real Manufactured Exports with Alternative REERs
�EXP = ββ 11 + ββ 22 �REER-xxx + ββ 3 3 �WORLDGDP
Constant REER-xxx WORLDGDP R-squared REER-ULC −0.01 -0.99 1.62 0.74 (−0.18) (-7.04)** (1.64) REER-CPI −0.08 -0.84 3.62 0.58 (−2.08)* (−4.60)** (3.11)**
Table 8
Regressions of Changes in Real Manufactured Imports with Alternative REERs
�IMPMFG = ββ 11 + ββ 22 �REER-xxx + ββ 3 3 �SAGDP + ββ 4 4 �TARIFF
Constant REER-xxx WORLDGDP TARIFF R-squared REER-ULC −0.04 -0.34 3.27 -0.04 0.74 (−2.67)** (-2.77)** (7.16)** (0.57) REER-CPI −0.05 -0.50 3.35 -0.07 0.77 (−3.22)** (-3.40)** (7.72)** (-1.09) t-statistics in parentheses. ** denotes statistical significance at 1% level, * at 5% level.

57
As an alternative specification, equations (6) and (7) were estimated in first-
difference form. Again only 2 cases are shown, as results were not too sensitive to
the choice of REER. Table 7 shows the results for manufactured exports. The strong
negative effect of real appreciation on exports remains. The estimated effect of
world income is now higher but less precisely estimated. For manufactured
imports (Table 8), the sign on REER is now always “wrong” and statistically
significant, although the coefficient is always smaller in absolute value than the
coefficient on exports. The coefficient on South African GDP is now much larger,
but the tariff variable loses all its explanatory power. Even accepting the results of
the first-difference regressions in Tables 7 and 8 instead of those in Tables 4 and 5, a
real depreciation will improve the manufacturing trade balance, since exports
increase more than imports in response to a depreciation of REER.
In summary, the regressions confirm a robust and powerful effect of
improvements in competitiveness on manufactured exports. The effects on imports
are more ambiguous.
VII. Conclusions and Policy Implications
Under GEAR, South Africa has embarked on a policy of export-led growth.
Several years into these reforms, there is some disappointment that South Africa has
not grown more rapidly and that unemployment continues to worsen. But this
paper suggests that South Africa should stay the course. Experience from all over
the world shows that economic reform is a painful process that takes time to bear
fruit. Positive results of South Africa’s reforms are nonetheless already in evidence
in the form of strong growth of manufactured exports and increased foreign direct
investment. It remains critical to create an environment where exports and foreign
58
investment will continue to expand. One important component of this environment
is international cost competitiveness.
A mixed picture of South Africa’s competitiveness emerges from the analysis of
this paper. There has been a sizeable real depreciation in the last few years, but by
most measures of the real effective exchange rate, the recent depreciation has only
returned the real exchange rate to the level of the mid-1980s. In absolute terms,
South African wage levels appear to be reasonably competitive against developed
countries when productivity differences are allowed for. It is probably more
appropriate to compare South Africa to other emerging economies, however. An
increasing share of South Africa’s exports go to developing countries, particularly
Africa and Asia. A case can also be made that South Africa’s main competitors in
developed country markets are other developing country exporters of manufactures.
On this basis, South Africa appears to have a serious labor cost problem. South
African unit labor costs (wages adjusted for productivity differences across
countries), are higher than almost all developing countries, ranging form low-wage
countries like India and Indonesia, to higher wage countries like Brazil and Korea.
At the very least, these results suggest that there is no room to increase real wages
faster than productivity. On the contrary, wage moderation and/or continued real
rand depreciation are necessary to gain competitiveness vis-à-vis other emerging
markets and to foster the continued growth of exports and foreign direct investment.
Indeed, manufactured exports are heavily influenced by cost competitiveness,
as Figure 14 vividly shows. Formal regression analysis confirms a strikingly strong
statistical effect of cost competitiveness on exports of manufactures that is robust to
variations in the way the real exchange rate is calculated, and to the specification of
the regression equations. The evidence is less clear on foreign direct investment.
Other factors may have swamped the effect of competitiveness on FDI into South
Africa in recent years, in particular, the sanctions under the Apartheid era, and the
59
lifting of these sanctions with the demise of Apartheid. Also, FDI inflows are likely
to be very sensitive to less quantifiable aspects of the business environment. The
high crime rate in South Africa in particular could have a large deterrent effect on
FDI.
While macroeconomic cost competitiveness is very important, by itself it is not
sufficient to resolve the unemployment problem and to create the foundations for
lasting growth. Labor market rigidities, inadequate education, and crime are often-
noted structural problems that must be tackled directly. These microeconomic and
social reforms must complement improved international competitiveness in leading
South Africa towards fulfillment of the objectives of the GEAR strategy.

60
Appendix Sources and Methods
Real Effective Exchange Rates
Nominal exchange rates, CPIs, GDP deflators, and Manufacturing Value
Added Deflators 1970-1997 are taken from the World Bank World Development
Indicators on CD-ROM. WPIs are from the International Monetary Fund
International Financial Statistics (IFS) CD-ROM. IFS is also used to update
exchange rates, CPIs, and GDP deflators to 1998. The manufacturing value added
deflator was obtained by dividing nominal value added by real value added. In
some cases, some price index data were unavailable for a few years at the beginning
or the end of the 1970-1998 period. In such cases, the data were extrapolated from
the closest available price series. For example, if Brazil is missing 1998 data for the
manufacturing value added deflator but the GDP deflator data is complete, the 1998
manufacturing deflator is assumed equal to the change in the GDP deflator.
Unit labor costs are calculated as wages divided by productivity, as described
in the text. The wage and productivity data are obtained from two sources. For
most industrial countries, productivity and labor costs are derived from
unpublished data from the United States Bureau of Labor Statistics (BLS). For
developing countries, the primary data source is the United Nations Industrial
Development Organization (UNIDO) INSTAT database. For purposes of
developing indexes of unit labor costs rather than comparing levels between
countries, the differences between the BLS and UNIDO definitions of value added
and labor compensation do not matter, at least insofar as the differences are the
same over time.
61
Productivity and Wage Levels
For level comparisons, however, several other considerations come into play.
First, differences in definitions do matter. The UNIDO and BLS data differ in
several respects. First, in the UNIDO database, value added is generally based on
the census definition rather than the national accounts compatible definition used by
the BLS. The main difference is that census value added does not deduct some
service inputs from gross output in deriving value added. Second, labor
compensation as reported by UNIDO includes some fringe benefits such as
maternity pay and payment in kind, but excludes employer contributions to social
insurance funds and is thus an incomplete measure of labor costs. The BLS
definition is more inclusive. For South Africa, the data were obtained directly from
South Africa sources, with the help of the Finance Department. The South African
data conform to the BLS approach: value added is based on a national accounts
definition and labor remuneration includes fringe benefits. Thus, South African
data were deemed to be directly comparable to industrial country data obtained
from the BLS. To compare South Africa to most developing countries, an
adjustment to the South African data was necessary. This was done by assuming
that the difference between census and national accounts variables is the same in
South Africa as in the United States.
Second, international comparisons of productivity require a purchasing-
power-parity or equilibrium exchange rate. South Africa has so far not been
included in either the ICP or ICOP efforts to develop PPP exchange rates. I
therefore resorted to proxying the PPP exchange rate by the mean real exchange rate
based on value-added deflators over the sample period. The PPP exchange rate for
each year is then obtained by extrapolation using value-added deflators. For
further discussion of comparisons of unit labor cost levels see Hooper and Larin
(1989) and Hooper and Vrankovich (1995).
62
Trade Flows
Exports and imports for South Africa were obtained from TIPS online (total
trade) and from IDC for manufacturing trade. The latter is for SACU rather than
just South Africa, but IDC reports that South Africa accounts for the overwhelming
majority of SACU trade, so this should make little difference. Customs duties as a
share of imports were provided by the SARB.
63
References
Durand, Martine and Claude Giorno , Indicators of International Competitiveness:
Conceptual Issues and Evaluation," OECD Economic Studies No. 9, Autumn 1987, pp. 147-182.
Fallon, Peter and Robert Lucas, “South African Labor Markets: Adjustment and
Inequalities,” unpublished manuscript, World Bank, January 1998. Goldstein, Morris and Mohsin Khan, “Income and Price Effects in Foreign Trade,”
Ronald Jones and perter Kenen, eds., Handbook of International Economics, Vol. 2, Amsterdam: North-Holland, 1986
Golub, Stephen S. Labor Costs and International Trade, American Entreprise
Institute, 1999. Golub, Stephen S., “Comparative Advantage, Exchange Rates and Sectoral Trade
Balances of Major Industrial Countries,” IMF Staff Papers, vol. 41, June 1994. Hooper, Peter and Elizabeth Vrankovich, "International Comparisons of the Levels
of Unit Labor Costs in Manufacturing," Federal Reserve Board International Finance Discussion Paper No. 527, October 1995.
Hooper, Peter, and Kathryn Larin, "International Comparisons of Labor Costs in
Manufacturing," Review of Income and Wealth ,Vol 35, December 1989, pp. 161-175.
International Monetary Fund, South Africa—Selected Issues, July 2 1998. Isard, Peter, "How Far Can We Push the Law of One Price," American Economic
Review, Vol 67, December 1977, pp. 942-948. Johnson, Harry G., “Optimal Trade Intervention in the Presence of Domestic
Distortions,” in Richard Caves et al, eds, Trade, Growth, and the Balance of Payments, Rand-McNally, 1965.
Kahn, Brian, “Assessing South Africa’s Competitiveness: Is the Reserve Bank’s
Measure Misleading,” LSE Centre for Research and Finance in Southern Africa Quarterly Review , number 4, 1998.
Krugman, Paul, “Competitiveness: A Dangerous Obsession,” Foreign Affairs, 1994.
64
Marsh, Ian W. and Stephen P. Tokarick, "Competitiveness Indicators: A Theoretical
and Empirical Asessment," IMF Working Paper WP/94/29, March 1994. McGuirk, Anne K., "Measuring Price Competitiveness for Industrial Country Trade
in Manufactures," IMF Working Paper WP/87/34, April 1987. Nattrass, Nicoli, “Globalisation, Employment and Labour Market Institutions in
South Africa,” South African Network for Economic Research, Working Paper 14, November 1998.
Tsikata, Yvonne, “Liberalization and Trade Performance in South Africa,”
unpublished manuscript, World Bank, 1998. Turner, Anthony G. and Stephen S. Golub, Multilateral Unit Labor Cost Based
Indicators of Competitiveness for Industrial, Developing and Transition Economies, IMF Staff Studies for the World Economic Outlook, December 1997.
Turner, Philip and Joseph Van't dack, "Measuring International Price and Cost
Competitiveness," Bank for International Settlements Economic Papers, No. 39, November 1993.
Walters, S. S. and B.C. De Beer, “An Indicator of South Africa’s External
Competitiveness,” South African Reserve Bank Quarterly Bulletin, September 1999, pp. 54-65.
Wickam, Peter, "A Cautionary Note on the Use of Exchange Rate Indicators," IMF
Paper on Policy Analysis and Assessment PPAA/93/5, March 1993. Zanello, Alessandro and Dominque Desruelle, "A Primer on the IMF's Information
Notification System," IMF Working Paper 97/71, 1997.


![[southafrica]Formalising South Africa's National Space ... · Microsoft PowerPoint - [southafrica]Formalising South Africa's National Space Programme.PPT Author: wickrama Created](https://cdn.vdocuments.us/doc/165x107/6059686d068ebf00f0327038/southafricaformalising-south-africas-national-space-microsoft-powerpoint.jpg)
