
Solid Growth and Continued Execution
Second Quarter 2010 Results Presentation
August 19, 2010

Forward-Looking StatementTo supplement the unaudited condensed consolidated financial information presented in
accordance with Accounting Principles Generally Accepted in the United States of America
(“GAAP”), the Company uses non-GAAP measures of income from operations and net
income attributable to ChinaEdu Corporation, which are adjusted from results based on
GAAP to exclude certain non-cash items of share-based compensation and amortization of
intangible assets and land use rights. The Company also uses adjusted EBITDA, which is
also a non-GAAP measure and is adjusted from GAAP results of net income to exclude
interest income, taxes, depreciation, amortization of intangible assets and land use rights,
and share-based compensation. These non-GAAP financial measures are provided to
enhance the investors’ overall understanding of the Company’s current and past financial
performance in on-going core operations as well as prospects for the future. These measures
should be considered in addition to results prepared and presented in accordance with
GAAP, but should not be considered a substitute for or superior to GAAP results.
Management considers the non-GAAP information as important measures internally and
therefore deems it important to provide all of this information to investors.
2

Convenience Translation
The reporting currency of the Company is RMB, but for the convenience of the
reader, the amounts are presented in U.S. dollars in this presentation
All translations from RMB to USD were made at the rate of RMB6.7815 to $1.00,
the noon buying rate in effect on June 30, 2010 in the H.10 statistical release of the
Federal Reserve Board
Historical financials presented in USD will differ from USD amounts presented for
illustration purpose in past earnings releases due to different exchange rates used
All percentages are calculated using the numbers presented in the financial
statements contained in the earnings release presented in RMB
We make no representation that the RMB or USD amounts referred could be
converted into USD or RMB, at any particular rate or at all
3

Second Quarter 2010 Highlights
4

Second Quarter 2010 Financial Highlights
Both revenue and earnings per diluted ADS exceed management guidance and
analysts consensus
5
In US Million 2Q09
Amount
2Q10
Amount
% 2Q09
Margin
2Q10
Margin
Net Revenue 13.0 14.7 12.7% - -
Net Income 1.3 2.0 52.8% 10.0% 13.6%
Adj. EBITDA 4.4 5.2 20.4% 33.4% 35.7%
Net Income per ADS (diluted) $0.075 $0.115 53.3% - -
Adj. Net Income per ADS (diluted) $0.103 $0.125 21.4% - -
Total net revenue $14.7mm in 2Q10 exceeds guidance of $13.3mm to
$14.2mm
Net income per diluted ADS is $0.115, exceeds analysts consensus of
$0.069

Second Quarter 2010 Operational Summary
Online degree programs:
Healthy spring semester enrollment with 157,000 revenue students compared to 147,000
for the spring semester of 2009
Continued expansion in learning center network: 65 learning centers; 27 proprietary and
38 franchised; 18 universities served
Continued R&D in our technology platform, including wap application
Online tutoring:
Beijing market continues to gain significant traction
Continued product development and increased level of services
Continued development of hybrid (online and in-class) learning model
Revamp of 101 Online School’s website
Private schools:
Continued margin improvement at both Anqing School and Pingdingshan School
Continue to record solid growth in our core business
6

Second Quarter 2010 Operational Summary
Non-degree program developments:
Online teachers training program in Fujian continues to gain traction
Question-answer interactive online community for K-12 students: revamp of
website (prcedu.com/101tutor.com), launch of wap application
Vocational training online community for working adults: revamp of website
(chinaedu.net)
English proficiency test development with McGraw-Hill near completion
New non-degree initiatives continue to make progress
7

Second Quarter Financial Results Review
8

Online Degree Programs Net Revenue
Learning centers network continues to
expand
65 LC (27 Proprietary, 38 Franchised)
Online Degree net revenue increased
12.2% to $11.8mm in 2Q10 vs. 2Q09
Revenue students increased 6.8% in
2010 Spring vs. 2009 Spring
Higher revenue growth compared to
enrollment growth due to selected
online colleges increasing tuition per
student and lower third-party learning
centers expenses
9
CAGR: 35%Growth: 6.8%
(‘000)
($ million)
Growth: 12.2%
CAGR: 23%
Revenue Students
Online Degree Net Revenue

Other Business Lines Net Revenue
101 Online tutoring total net revenue
increased 29% Y/Y :
Improved third-party distribution
channel sales
Increased sales penetration in Beijing
Continued increased product and
services support for third party
distribution agencies
Enrollment growth at Anqing School
International Curriculum’s decline in
line with expectation
10
Net Revenue 2Q10 vs. 2Q09
Growth
29%
Growth
37%
Decline
27%
($ million)

Cost of Revenue and Gross Margin
Total gross margin increased to 65%
as compared to 62% in 2Q09
Gross margins expanded in three
business segments:
Online degree programs gross margin
expanded from 68.5% to 69.6%
101 Online tutoring programs gross
margin expanded from 65.5% to
75.8%
Private schools gross margin
expanded from 9.7% to 25.8%
International curriculum programs
gross margins stayed stable at
approximately 46%
Overall gross margin expanded in 2Q10 vs. 2Q09
11
Cost of Revenue
5%
Growth
40%
51%20%
22%
18%
62% 62%
58%
64%63%
61%62%
65%
Gross Margin
($ million)

General & Admin Expenses
G&A expenses decreased
G&A expenses decreased by 6.8% in
2Q10 vs. 2Q09 mainly due to a
temporary decrease of share-based
compensation
As a result, G&A expenses as % of
total net revenue decreased to 18% in
2Q10 from 22% in 2Q09
Excluding the temporary decrease of
share-based compensation, G&A
expenses increased by 4.1%.
12
As % of Rev. 27% 35% 23% 29% 27% 23% 22% 18%
G&A Expense($ million)
Growth
64%
11%
57%
13% Decrease
5%
Decrease
7%

Selling & Marketing Expenses
S&M expenses increased y/y due to increased sales and marketing staff and
general advertising and promotional activities
S&M expenses increased 48% in
2Q10 vs. 2Q09 primarily due to:
Increased sales and marketing staff
and advertising and sales conferences
activities at selected online colleges
S&M expenses as % of total net
revenue was 8% in 2Q10, as
compared to 6% in 2Q09
13
S&M Expenses($ million)
Growth
714%
111%11%
109%
Decrease
21%
Growth
48%
As % of Rev. 1% 5% 6% 5% 9% 7% 6% 8%

Research & Development Expenses
R&D expenses continues to increase at a controlled pace y/y
R&D expenses increased 21% in
2Q10 vs. 2Q09
R&D expenses as % of total net
revenue increased to 10% in 2Q10 vs.
9% in 2Q09 primarily due to:
Increased R&D staff
Increased spending on equipment and
software
14
R&D Expenses
As % of Rev. 13% 9% 7% 8% 8% 9% 9% 10%
($ million)
Decline
8%
Growth
20%
47%
25%
16%
21%

Operating Margins
Adj. EBITDA margin improved to
36% in 2Q10 vs. 33% in 2Q09
Adj. operating margin improved to
30% in 2Q10 vs. 29% in 2Q09
GAAP operating margin improved in
2Q10 to 29% vs. 25% 2Q09
GAAP op. margin, adj. op. margin and adj. EBITDA margins all improved
slightly y/y
15
($ million) Adj. EBITDA
Margin
31%27%
31%
33%36%
Adj. Operating Income($ million)
Margin
27%23%
26%
30%29%

Net Income and EPS
Diluted EPS increased to $0.115 in
2Q10 vs. $0.075 in 2Q09.
Adj. NI and adj. net margin increased
in 2Q10 vs. 2Q09 primarily due to
increased net revenue.
EPS increased and exceeded analyst consensus
16
2Q09 2Q10
NI ($ ’000) $1,306 $1,996
Net Margin 10.0% 13.6%
Diluted EPS $0.075 $0.115
Adj. Dil. EPS $0.103 $0.125
Adj. Net Income($ million)
Margin
13%
13%13%
14%15%
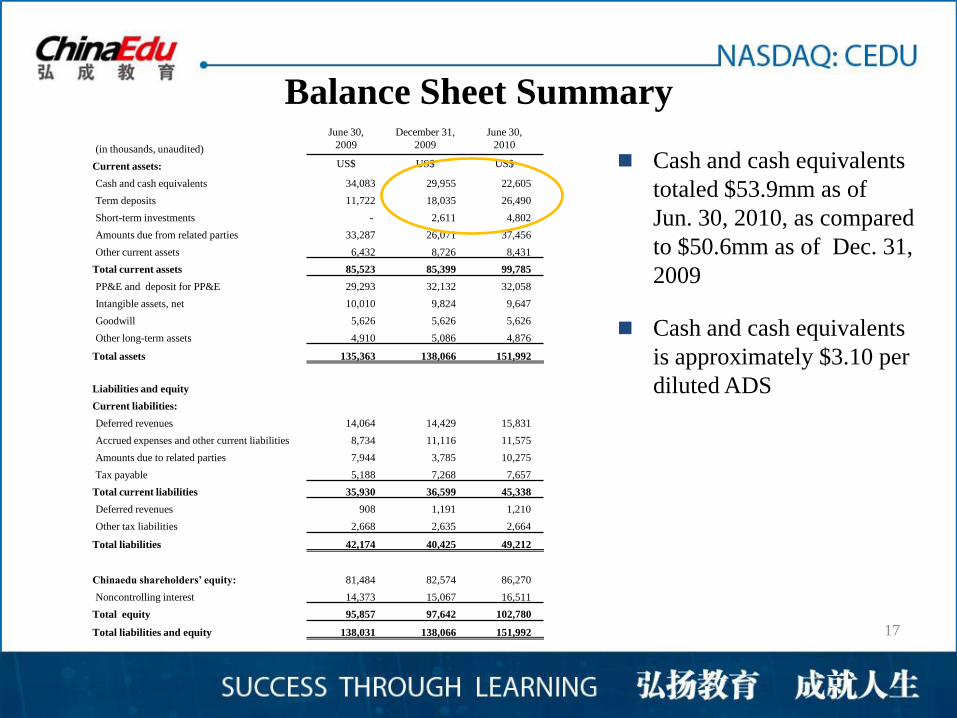
Balance Sheet Summary
17
Cash and cash equivalents
totaled $53.9mm as of
Jun. 30, 2010, as compared
to $50.6mm as of Dec. 31,
2009
Cash and cash equivalents
is approximately $3.10 per
diluted ADS
(in thousands, unaudited)
June 30,
2009
December 31,
2009
June 30,
2010
Current assets: US$ US$ US$
Cash and cash equivalents 34,083 29,955 22,605
Term deposits 11,722 18,035 26,490
Short-term investments - 2,611 4,802
Amounts due from related parties 33,287 26,071 37,456
Other current assets 6,432 8,726 8,431
Total current assets 85,523 85,399 99,785
PP&E and deposit for PP&E 29,293 32,132 32,058
Intangible assets, net 10,010 9,824 9,647
Goodwill 5,626 5,626 5,626
Other long-term assets 4,910 5,086 4,876
Total assets 135,363 138,066 151,992
Liabilities and equity
Current liabilities:
Deferred revenues 14,064 14,429 15,831
Accrued expenses and other current liabilities 8,734 11,116 11,575
Amounts due to related parties 7,944 3,785 10,275
Tax payable 5,188 7,268 7,657
Total current liabilities 35,930 36,599 45,338
Deferred revenues 908 1,191 1,210
Other tax liabilities 2,668 2,635 2,664
Total liabilities 42,174 40,425 49,212
Chinaedu shareholders’ equity: 81,484 82,574 86,270
Noncontrolling interest 14,373 15,067 16,511
Total equity 95,857 97,642 102,780
Total liabilities and equity 138,031 138,066 151,992

Revenue Guidance for Third Quarter 2010
18

Revenue Guidance for 3Q2010
2010 third quarter revenue guidance is between $14.2mm and $14.6mm (¥96mm
and ¥99mm)
19

Non-GAAP Financial Measures
To supplement the unaudited condensed consolidated financial information presented
in accordance with Accounting Principles Generally Accepted in the United States of
America (“GAAP”), the Company uses non-GAAP measures of income from
operations and net income, which are adjusted from results based on GAAP to exclude
certain non-cash items of share-based compensation, and amortization of intangible
assets and land-use rights. The Company also uses adjusted EBITDA, which is also a
non-GAAP measure and is adjusted from GAAP results of net income to exclude
minority interest, interest, taxes, depreciation, amortization, and share-based
compensation. These non-GAAP financial measures are provided to enhance the
investors’ overall understanding of the Company’s current and past financial
performance in on-going core operations as well as prospects for the future. These
measures should be considered in addition to results prepared and presented in
accordance with GAAP, but should not be considered a substitute for or superior to
GAAP results. Management considers the non-GAAP information as important
measures internally and therefore deems it important to provide all of this information
to investors.
20

Thank You!
21


