
Solar and Wind Aided Cross Flow Natural Evaporator for RO Reject
Management
Ligy Philip (CE)
B.S. Murty (CE)
A. Kannan (ChE)
K. Srinivasa Reddy (ME)
IIT Madras, Chennai
BACKGROUND
• Severe environmental problems are being faced by the Tiruppur, Erode and Karur districts of Tamil Nadu due to pollution caused mainly by effluents from the textile and dye industries.
• In order to control this pollution, (TNPCB) has mandated that the effluents from these industrial units should be completely treated and there should be zero discharge of waste from any unit.
• Many CETPs are set-up based on physico-chemical and biological processes, followed by tertiary treatments and finally Reverse Osmosis (RO) process
Background (Contd..)
• The reject from RO plant cannot be simply let out because it has a high concentration of Total Dissolved Solids (TDS)
• Usually, the reject from the RO plant is sent through evaporators to increase the concentration levels of dissolved salts to such an extent that they can be recovered through chilling process
• Solar evaporators are found to give inadequate performance due to various seasons, it has been recommended / directed by the TNPCB that the CETPs should use “mechanical evaporators” for the purpose of evaporating water from the RO plant reject

Background (Contd..)
• The general experience of CETPs with the use of mechanical evaporators has so far been not very positive.
• CETPs have been complaining that it is very costly to run the mechanical evaporators (10 lakh tons of wood is utilized every year to evaporate RO rejects from textile industry to recover salt in mechanical evaporators)
• The cost of operation is approximately Rs. 1.0 to 3.0 per one litre of water evaporated.
• As a result, industries are facing difficulty in operating the mechanical evaporators effectively, which is leading to frequent closure of the industrial units due to non-compliance with discharge standards.
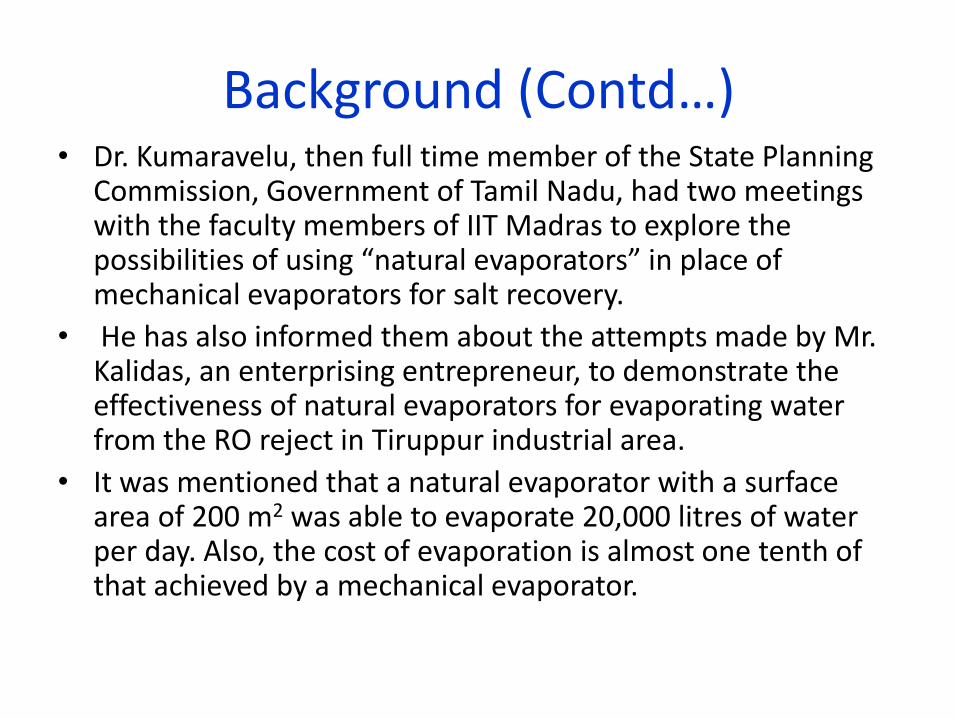
Background (Contd…) • Dr. Kumaravelu, then full time member of the State Planning
Commission, Government of Tamil Nadu, had two meetings with the faculty members of IIT Madras to explore the possibilities of using “natural evaporators” in place of mechanical evaporators for salt recovery.
• He has also informed them about the attempts made by Mr. Kalidas, an enterprising entrepreneur, to demonstrate the effectiveness of natural evaporators for evaporating water from the RO reject in Tiruppur industrial area.
• It was mentioned that a natural evaporator with a surface area of 200 m2 was able to evaporate 20,000 litres of water per day. Also, the cost of evaporation is almost one tenth of that achieved by a mechanical evaporator.
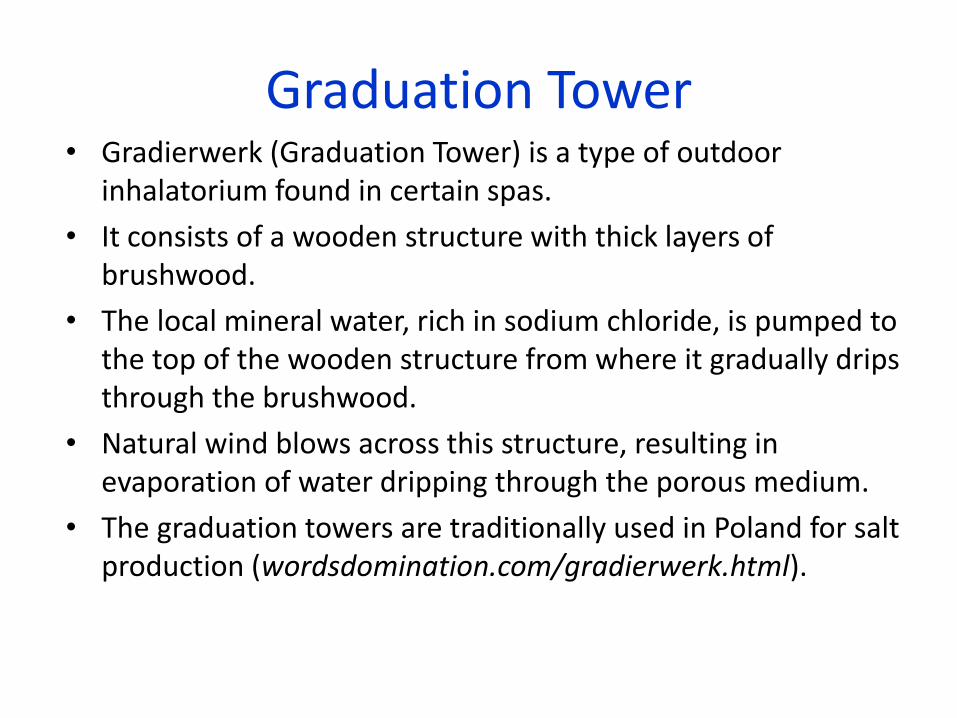
Graduation Tower • Gradierwerk (Graduation Tower) is a type of outdoor
inhalatorium found in certain spas.
• It consists of a wooden structure with thick layers of brushwood.
• The local mineral water, rich in sodium chloride, is pumped to the top of the wooden structure from where it gradually drips through the brushwood.
• Natural wind blows across this structure, resulting in evaporation of water dripping through the porous medium.
• The graduation towers are traditionally used in Poland for salt production (wordsdomination.com/gradierwerk.html).
Graduation Tower (Contd..)
• It may be noted that the water reaching the bottom of graduation tower will have a higher salt concentration than the inflow water at the top.
• Thus this type of a structure can be used for increasing the salt concentration in the RO reject by repeatedly cycling the water through the tower several times.

Present Effluent Treatment Methodology
• Decolouration
• Maintain BOD and COD
• Reverse Osmosis
• Mechanical Evaporation
• Crystallization of salt.
“ The system works perfect till RO Stage – where 85-92 % water is recovered – the problem is in the last stage of treatment of the RO Reject”
NIFT-TEA - GTM

Alternative – Natural Evaporator
NIFT-TEA - GTM
Gradier werk in Germany
Advantages of Natural Evaporator
1. Enriches soil moisture – helps agriculture 2. Savings in Firewood and power – helps arrest deforestation 3. Carbon Emission Free - eligible for carbon credit 4. Environmental friendly 5. Operational Friendly 6. Affordable 7. Quick installation and commissioning
NIFT-TEA - GTM

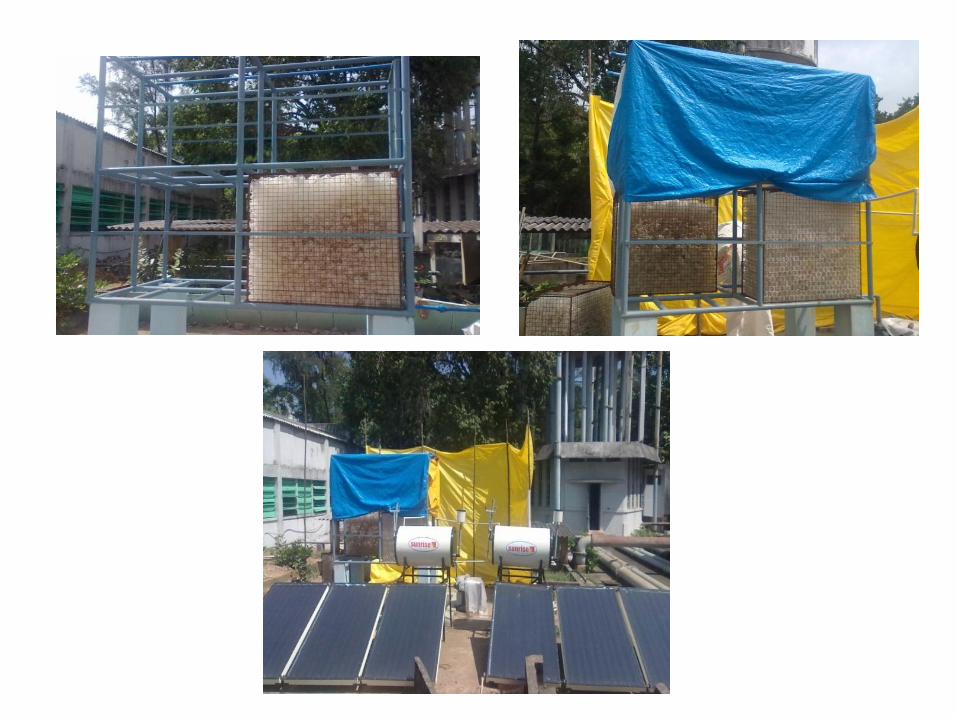
Pilot Plant • Installed a pilot plant of Dimension 2.3m x 1m x 2 m Height
• Results were very encouraging
NIFT-TEA - GTM
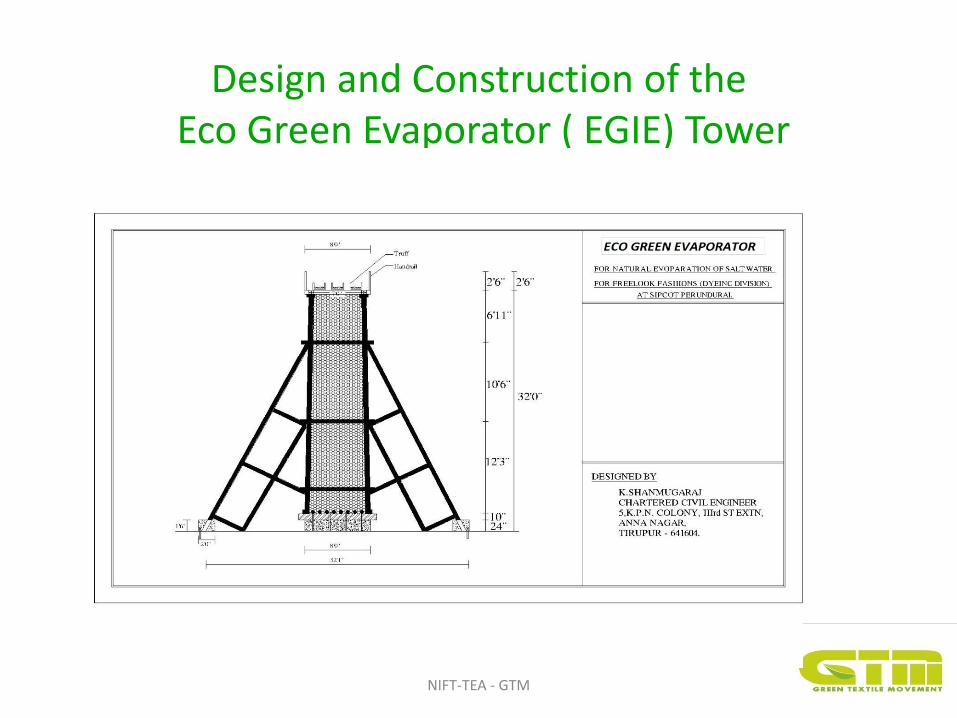
Design and Construction of the Eco Green Evaporator ( EGIE) Tower
NIFT-TEA - GTM
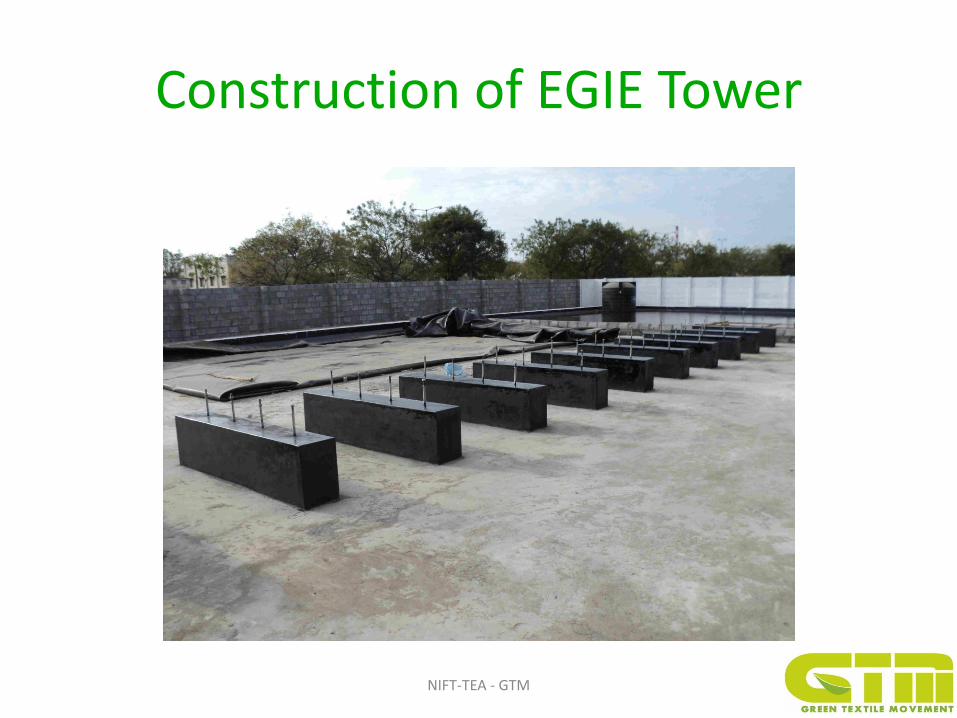
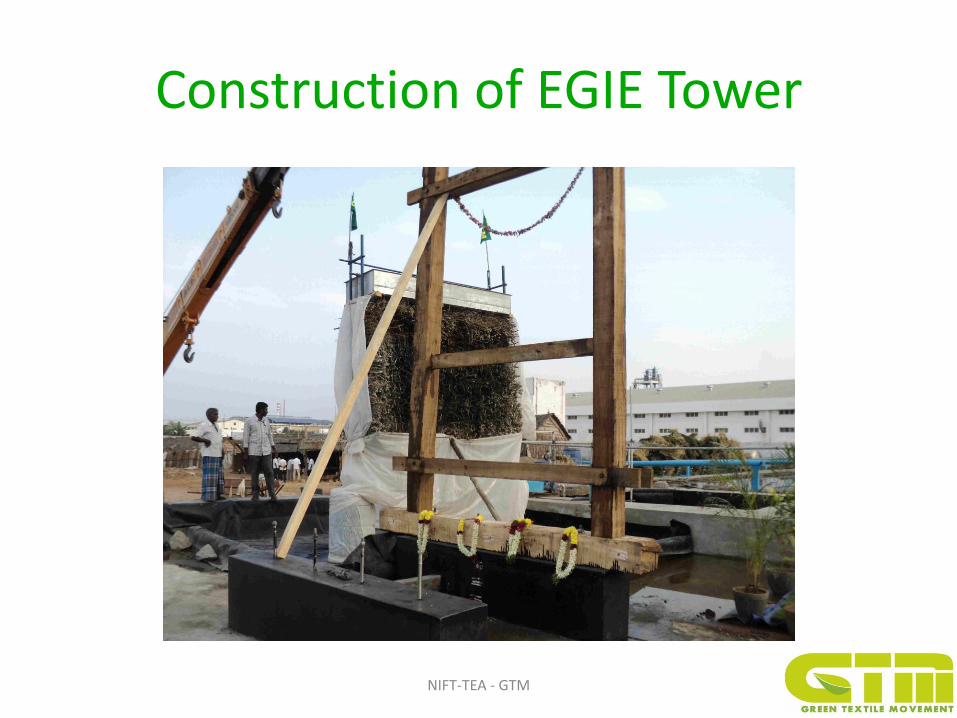
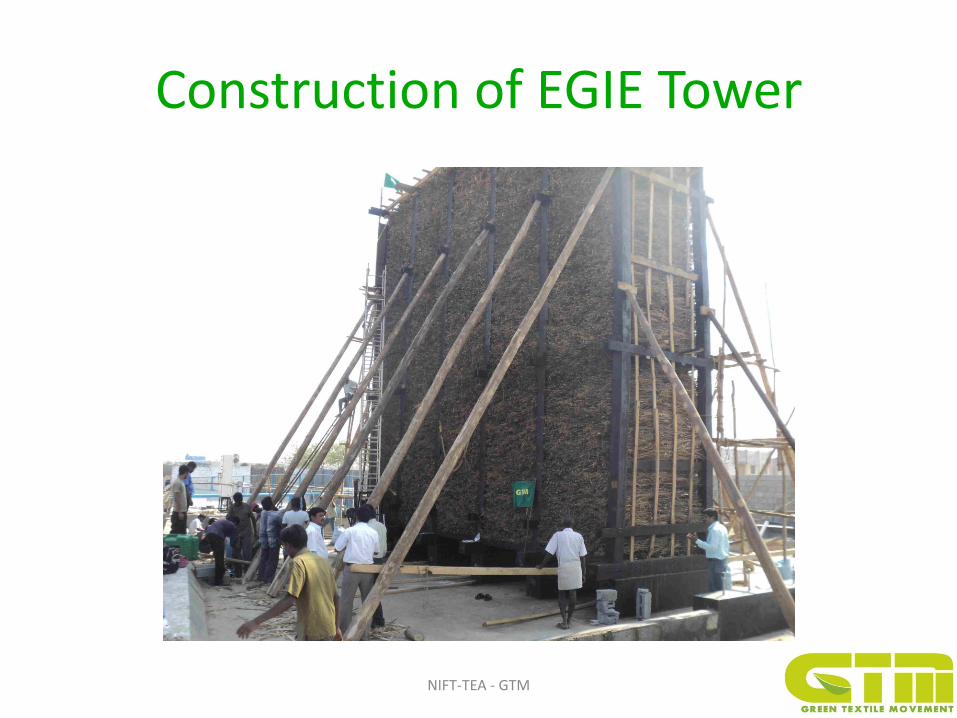
Construction of EGIE Tower
NIFT-TEA - GTM

NIFT-TEA - GTM
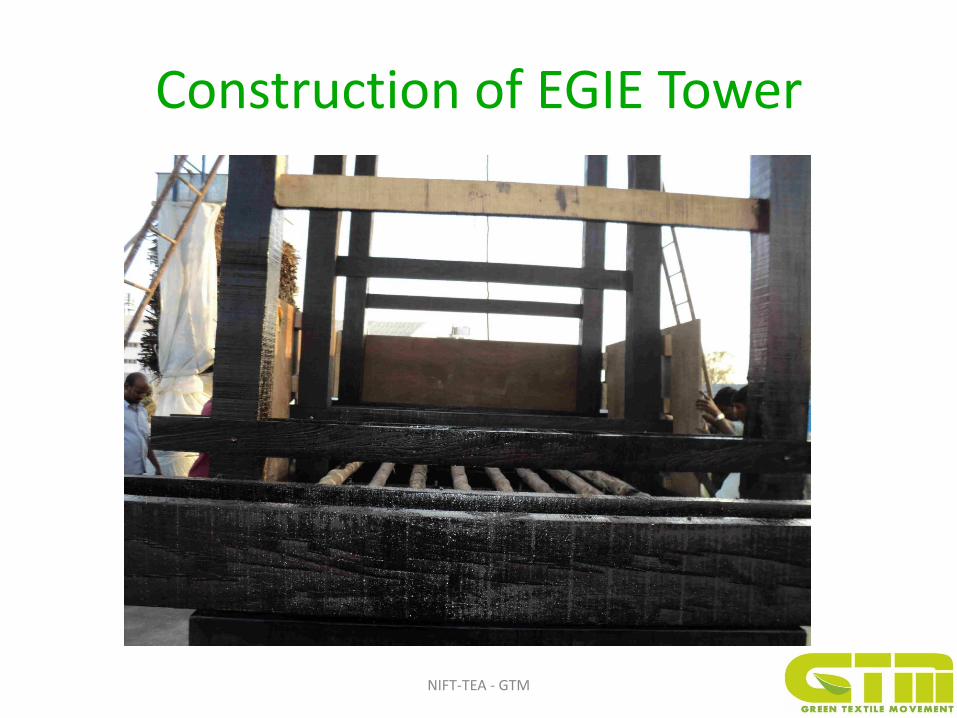
Construction of EGIE Tower

NIFT-TEA - GTM
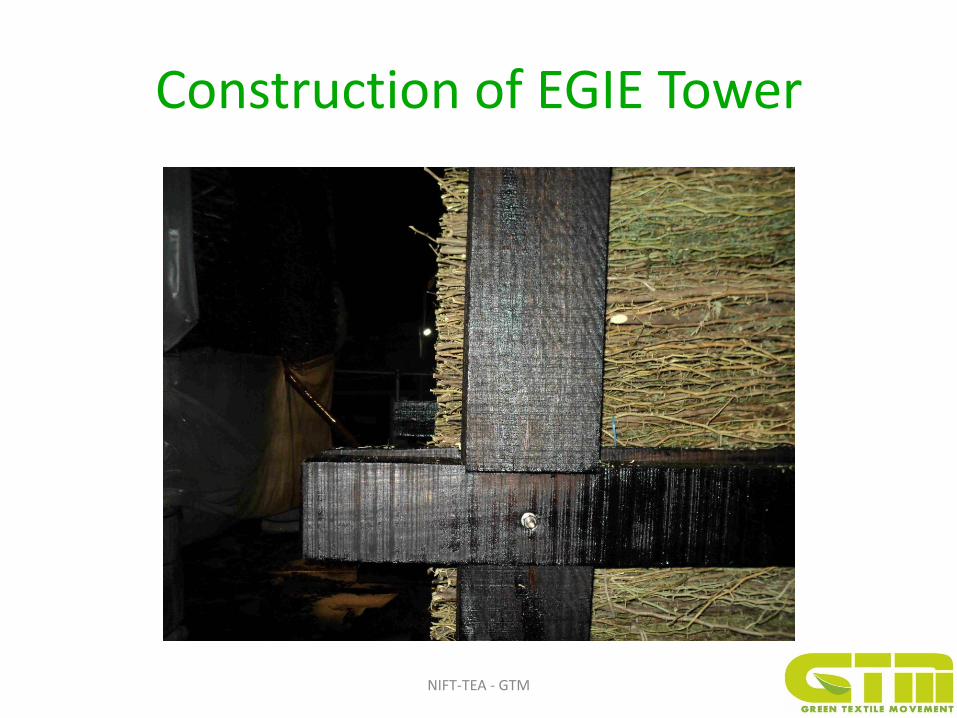
Construction of EGIE Tower
NIFT-TEA - GTM
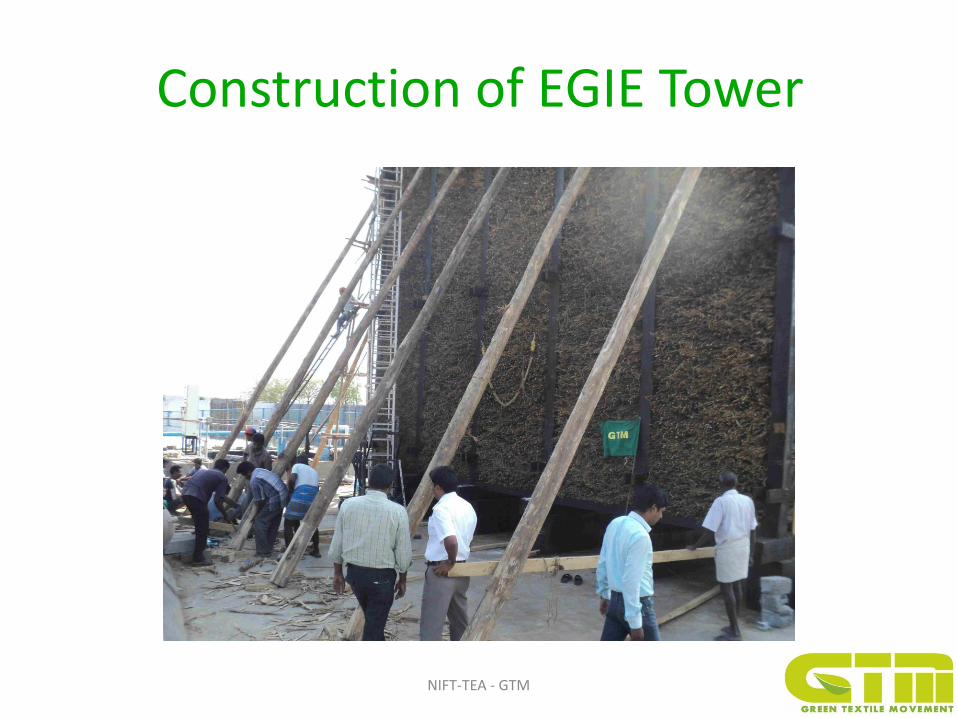
Construction of EGIE Tower

NIFT-TEA - GTM
Construction of EGIE Tower

NIFT-TEA - GTM
Construction of EGIE Tower

NIFT-TEA - GTM
Construction of EGIE Tower
NIFT-TEA - GTM
Construction of EGIE Tower

NIFT-TEA - GTM
Construction of EGIE Tower

NIFT-TEA - GTM
Construction of EGIE Tower

NIFT-TEA - GTM
Construction of EGIE Tower

NIFT-TEA - GTM
Construction of EGIE Tower
NIFT-TEA - GTM
Construction of EGIE Tower
NIFT-TEA - GTM
Construction of EGIE Tower
NIFT-TEA - GTM
Construction of EGIE Tower

Video Of EGIE Installed at Freelook Fashions- Perundurai
NIFT-TEA - GTM

Selection of Tower Packing material (FILL)
• Fill: The fill used in the EGIE tower is twigs of babul tree,
• Botanical name - Prosopis Juliflora
It tolerates extremes of temperature and moisture. It is suited for planting
on marginal lands and can survive both drought and flooded conditions.
• Availability in Tamil Nadu, the species grows widely in the districts of Salem, Erode, Dharmapuri and
Coimbatore. plantations under social forestry programmes, (. (source : Internet)
NIFT-TEA - GTM
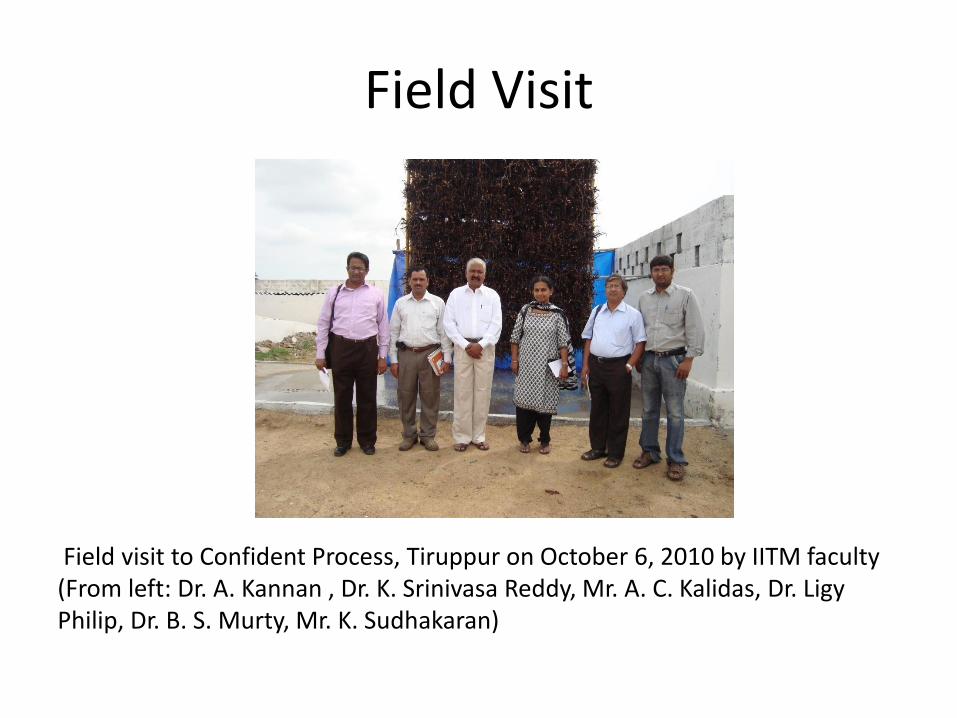
Field Visit
Field visit to Confident Process, Tiruppur on October 6, 2010 by IITM faculty (From left: Dr. A. Kannan , Dr. K. Srinivasa Reddy, Mr. A. C. Kalidas, Dr. Ligy Philip, Dr. B. S. Murty, Mr. K. Sudhakaran)
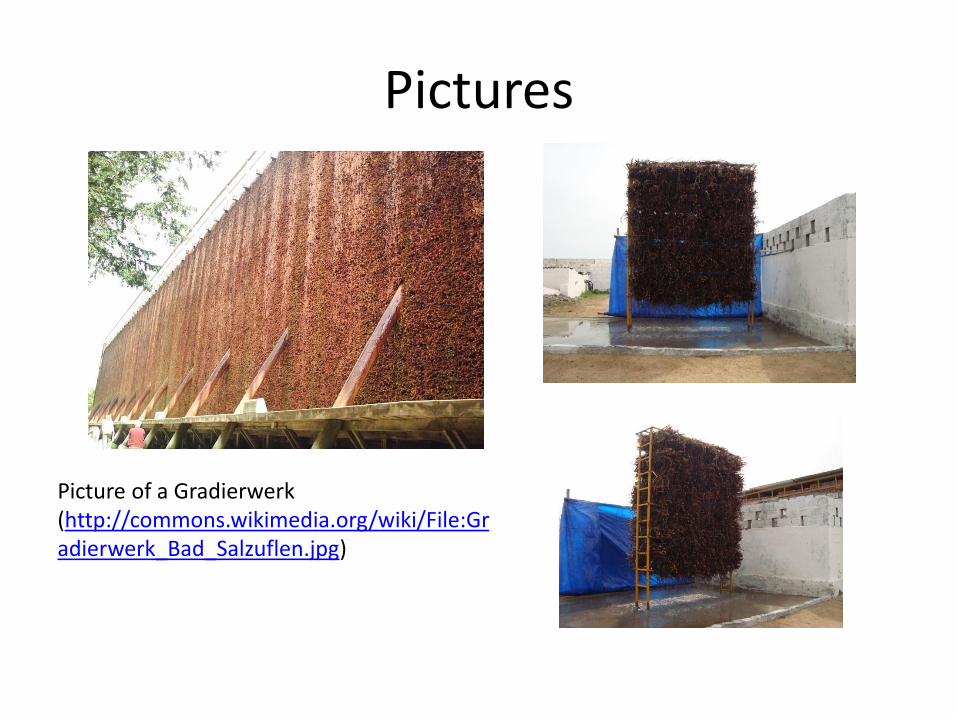
Pictures
Picture of a Gradierwerk (http://commons.wikimedia.org/wiki/File:Gradierwerk_Bad_Salzuflen.jpg)
Evaluation of the system on request of TNPCB
Observations and Suggestions: • Our studies on the performance of the natural evaporator system installed in the
premises of “Free Look Fashions”, Plot No. R7, SIPCOT, Perundurai, Erode (Dist), Tamil Nadu” suggests that the natural evaporator system can be a viable alternative to the mechanical evaporators for treating the RO reject from the textile industry.
• The cost of recovering the salt from the R.O rejects is much less in Natural Evaporators compared to the presently used Mechanical Evaporators. Hence, the acceptance, adoption and chances of properly operating a natural evaporator is much higher than that of a mechanical evaporator.
• The huge quantities of fuel, especially used at present in the form of wood fuel in the Mechanical Evaporator can be totally eliminated through the use of Natural Evaporators, thus not only contributing to economy, but also to the Environment by contributing to the mitigation of carbon emission and thereby to the “Global Warming”
• Drift control measures taken by the industry is working satisfactorily.
Observations and Suggestions (Contd..)
• There is a concern about the reject management during rainy / cloudy days using natural evaporator. The industry should provide details of alternative arrangements for the treatment of RO reject during the rainy days, and when the humidity is high. Enforcing agency should ensure that alternative arrangements are in place.
• Detailed monitoring of air quality around the natural evaporator was carried out by IIT Madras during 1st July 2011 to 3rd July 2011. PM10 , PM2.5 and VOC concentrations around the natural evaporators were well within the ambient air quality norms.
• As and when the natural evaporators are allowed to be operated by the industry, enforcing agency (TNPCB) should closely monitor the working of natural evaporator, and make sure that there is a mass balance of salt in the system. Industry should maintain a proper log book, indicating the total salt used in the industry as raw material, and the salt recovered.
• The salt recovered should be either reused or stored properly.
• As and when the natural evaporators are adopted by the industry, random monitoring of air quality (PM10 , PM2.5 , VOC and cation and anion concentrations) should be carried out to ensure adherence to the stipulated standards.
• The stipulated ZERO DISCHARGE of effluents conditions can be effectively achieved by using this type of NATURAL EVAPORATOR SYSTEM studied by us
OBJECTIVE
Objective of this study is to optimize the design of a natural evaporator in order to make it a viable alternative to conventional evaporators for further concentrating RO rejects from the dyeing and textile industry.

Scope
• Experimental studies on model evaporators to optimize the design for the following; – Thickness (Depth) of the evaporators (in the wind direction);
– Type of packing media (brushwood / synthetic material);
– Packing density;
– Flow rate of effluent ;
– Distribution system at the top of the evaporator
• Modeling of evaporation process in a natural evaporator to help scaling of the results from model to field scale natural evaporators;
• Design a solar heat exchanger for preheating the RO reject to increase the effectiveness of natural evaporator
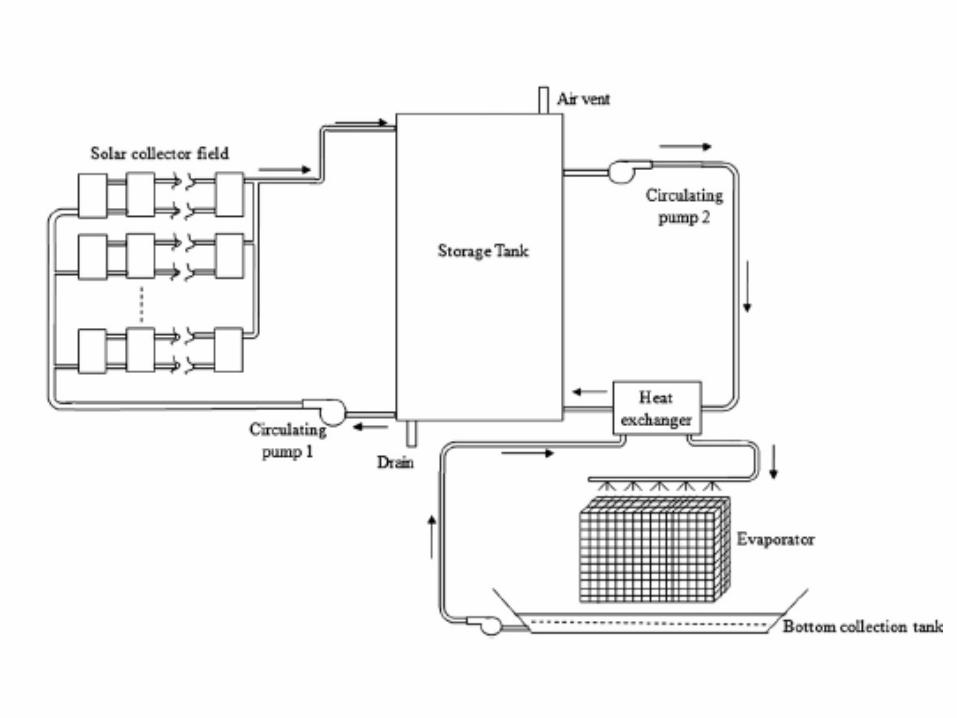

METHODOLOGY Experimental Setup:
The natural evaporator has the following components:
1. A structure made of steel pipes give the structural stability to hold the packing media.
2. The water distribution system at the top is made up of two PVC pipelines with evenly distributed 24 holes of 3mm to drip the water on to the structure uniformly.
3. A collection tank at the bottom for collecting water dripping from the evaporator.
4. A recirculation tank for collecting concentrated water from the evaporator, preheat and pump the water to the distribution system.
5. A solar collector field for utilizing solar energy for pre heating the water.
6. 2HP Pumps, appropriate controls and measuring instruments like rotameter, control valve.


Effect of Various Parameters on Evaporation
1. Wind velocity
2. Relative humidity in the ambient air
3. Temperature of water in the recirculation tank for different design parameters.
Different wind velocities are obtained in the model by adjusting the blower speed. Evaporation loss was measured in terms of increased TDS/volume reduction in the collection tank.

Wind Velocity/ Relative Humidity
The wind velocity was maintained constant by using an industrial
fan, but the constant wind was affected by ambient air flow.
This was prevented by using a wind shield made of tarpaulin with
bamboo stick supports. Wind velocity was measured by using an
anemometer.
Relative humidity in the ambient air was measured using a
humidity meter and the values are cross checked with dry
bulb and wet bulb thermometers.

Experiment with a cage loaded with dense spiral ring synthetic packing media
Technical data for spiral ring packing media
S.no Size Surface
area
Void ratio Packing
Factor
Weight Material
1. 26mm 500
Sq.m/cu.m
87% 210 sft/cft 140gm/l PVC
2. 55mm 350
sq.m/cu.m
92% 83sft/cft 110gm/l PVC
3. Permissible temperature – 75 ˚C
This synthetic packing media due to
its high packing density and highly
irregular shape, didn’t allow air to
pass through the media.
It acted as a barrier against wind.
The rate of evaporation was very low.
Hence, this packing media was not
selected
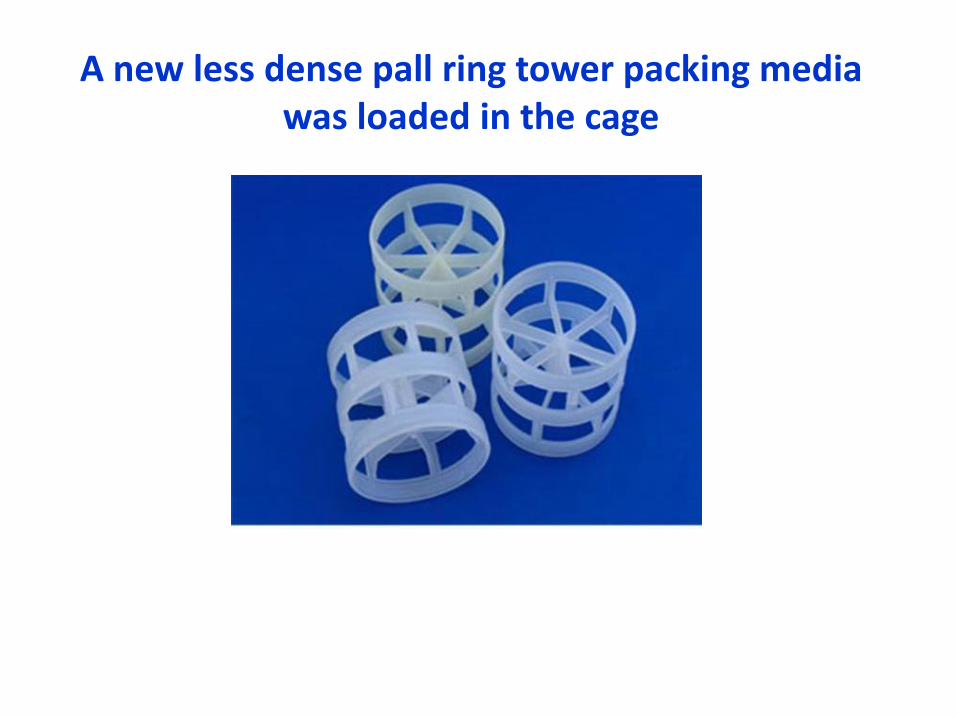
A new less dense pall ring tower packing media was loaded in the cage

Physical & chemical properties of plastic tower packing
Performance /
Material PE PP RPP PVC CPVC PVDF
Density (g/cm3) 0.94-0.96 0.89-0.91 0.93-0.94 1.32-1.44 1.50-1.54 1.75-1.78
Operating Temp.
(°C) 90 >100 >120 >60 >90 >150
Chemical
corrosion
resistance
Good Good Good Good Good Good
Compression
Strength (Mpa) >6.0 >6.5 >7.0 >6.0 >8.0 >10.0
Sizes
mm
Surface
m2/m3
Free Vol.
%
Number
per m3
Weight
kg/ m3
16*16*1 260 91 230000 141
25*25*1.2 210 90 53500 82
38*38*1.4 140 89 13500 54
50*50*1.5 100 90 6500 51
76*76*2.6 73 92 1930 58

Experiments
• Type of packing media (pall ring / thorny sticks). • Type of packing (random / structured). • Number of panels (one / two) • Arrangement of panels (side by side / back to back) • Thickness of panel (50 cm / 25 cm) • Water flow rate (200 LPH / 400 LPH / 600 LPH / 800
LPH). • Variation occurred only in terms of air (ambient)
temperature, water temperature, and relative humidity.
• Wind velocity is mostly kept constant at 15 km/h, except in few cases
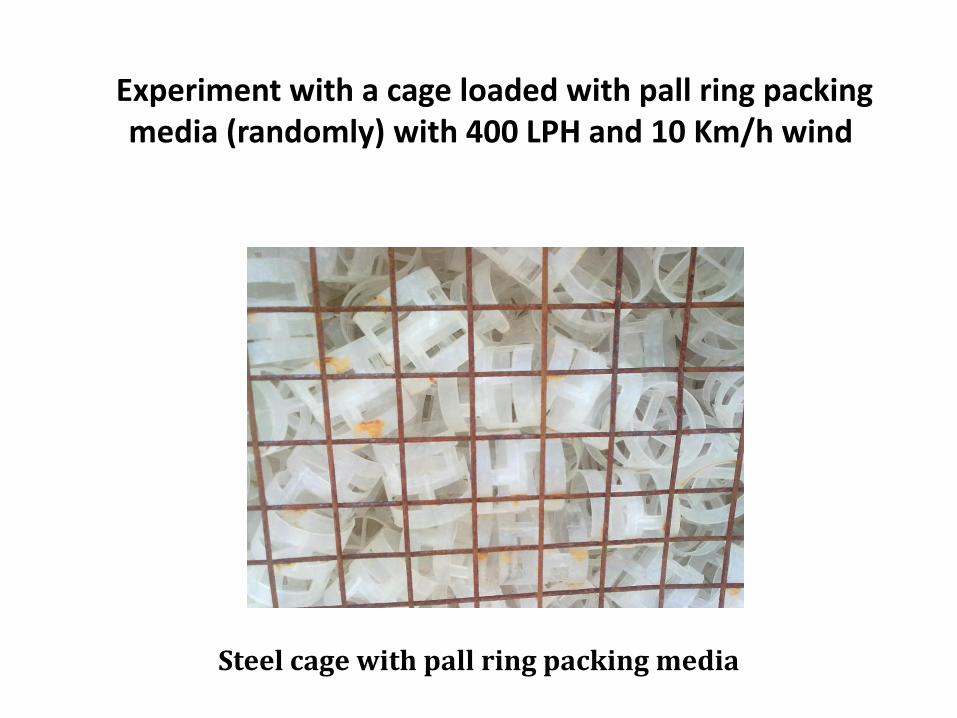
Experiment with a cage loaded with pall ring packing media (randomly) with 400 LPH and 10 Km/h wind
Steel cage with pall ring packing media
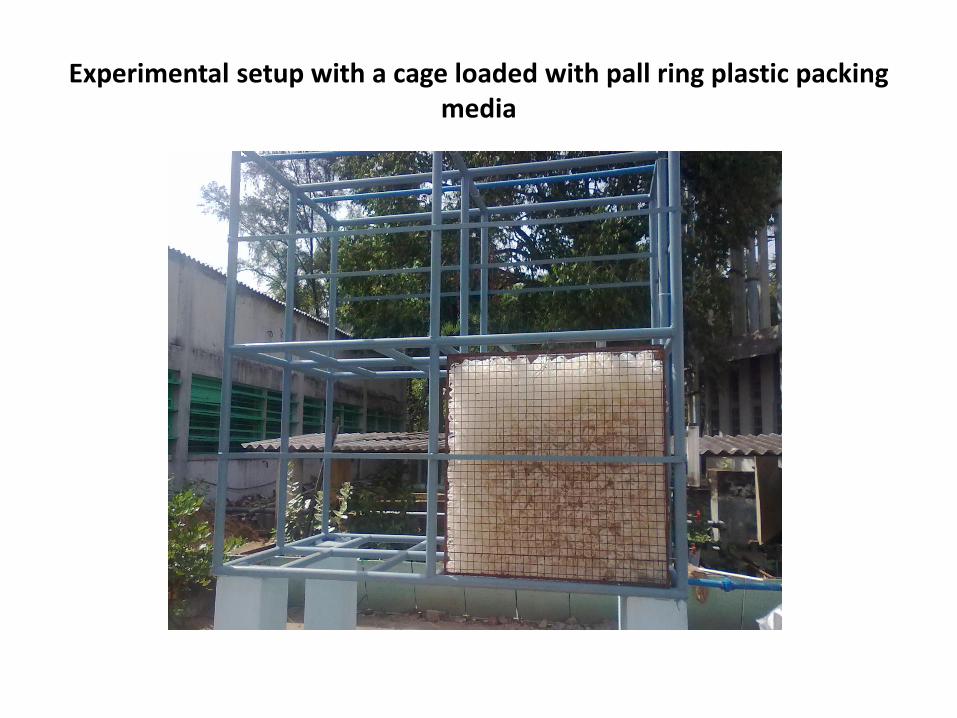
Experimental setup with a cage loaded with pall ring plastic packing media

Various Configurations


Results and Inferences • Experimental data obtained from the pilot scale natural evaporator was analyzed
for the trends through empirical correlation development. • evaporation rate strongly depends on the difference between the vapor pressure
of water at the water temperature (esw) and the partial pressure of water vapor in the air above the water surface (ea).
• the evaporation rate will be minimal on those days when the relative humidity is very high, and there is not much difference between the temperatures of water and air.
• It is emphasized that Chennai, being a coastal city is inherently prone to high humid conditions and hence when water is also at near ambient conditions, the vapor pressure was not high.
• One way to increase the evaporation rate is to increase the value of (esw - ea) by increasing the water temperature.
• This can be accomplished by preheating the water using solar power, as demonstrated in the present pilot scale experiments.
• evaporation rate, E strongly depends upon the wind velocity, V. • High evaporation rate can be achieved in regions with high wind velocity.

Trend Analyses • Evaporation rate, E linearly depends upon the wind velocity, V. • Evaporation from water surfaces that the evaporation rate strongly
depends on the difference between the vapor pressure of water at the water temperature (Esw) and the partial pressure of water vapor in the air above the water surface (Ea).
• Therefore, variable E/V is plotted as a function of (Esw – Ea) and the equation for a best fit curve is obtained.
• It is hypothesized that (E/V) varies with (Esw – Ea) as per a power function.
• In some of the experiments, the water temperature and the ambient temperature (those experiments where the water is not pre-heated using the solar power) were same.
• For those experiments, (E/V) is plotted as a function of T*(1-Rh), where T is the temperature in 0C and Rh is the relative humidity in fraction.
• In the trend analysis, V is taken in Km/h, E is taken in mm/h, Esw and Ea are taken in N/m2 abs.
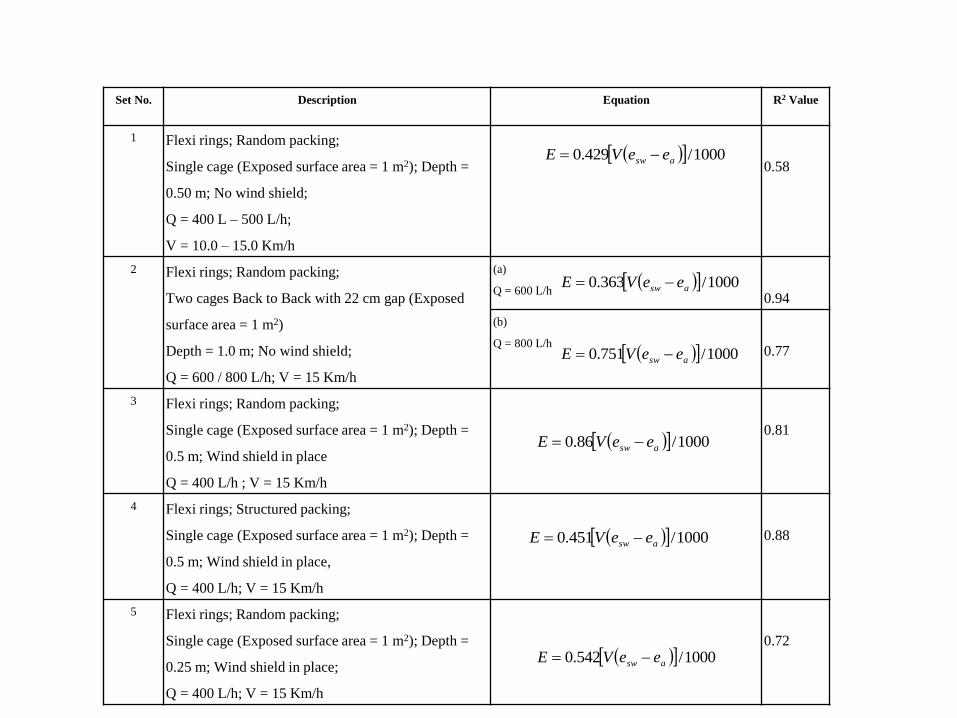
Set No. Description Equation R2 Value
1 Flexi rings; Random packing;
Single cage (Exposed surface area = 1 m2); Depth =
0.50 m; No wind shield;
Q = 400 L – 500 L/h;
V = 10.0 – 15.0 Km/h
0.58
2 Flexi rings; Random packing;
Two cages Back to Back with 22 cm gap (Exposed
surface area = 1 m2)
Depth = 1.0 m; No wind shield;
Q = 600 / 800 L/h; V = 15 Km/h
(a)
Q = 600 L/h
0.94
(b)
Q = 800 L/h
0.77
3 Flexi rings; Random packing;
Single cage (Exposed surface area = 1 m2); Depth =
0.5 m; Wind shield in place
Q = 400 L/h ; V = 15 Km/h
0.81
4 Flexi rings; Structured packing;
Single cage (Exposed surface area = 1 m2); Depth =
0.5 m; Wind shield in place,
Q = 400 L/h; V = 15 Km/h
0.88
5 Flexi rings; Random packing;
Single cage (Exposed surface area = 1 m2); Depth =
0.25 m; Wind shield in place;
Q = 400 L/h; V = 15 Km/h
0.72
1000/429.0 asw eeVE
1000/363.0 asw eeVE
1000/751.0 asw eeVE
1000/86.0 asw eeVE
1000/451.0 asw eeVE
1000/542.0 asw eeVE
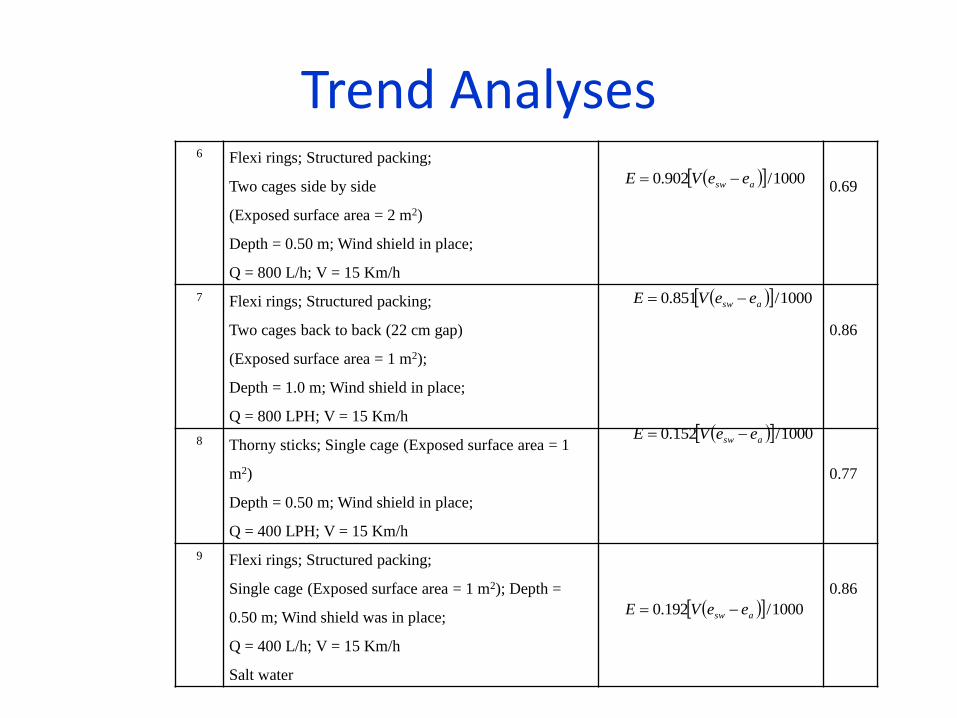
Trend Analyses 6 Flexi rings; Structured packing;
Two cages side by side
(Exposed surface area = 2 m2)
Depth = 0.50 m; Wind shield in place;
Q = 800 L/h; V = 15 Km/h
0.69
7 Flexi rings; Structured packing;
Two cages back to back (22 cm gap)
(Exposed surface area = 1 m2);
Depth = 1.0 m; Wind shield in place;
Q = 800 LPH; V = 15 Km/h
0.86
8 Thorny sticks; Single cage (Exposed surface area = 1
m2)
Depth = 0.50 m; Wind shield in place;
Q = 400 LPH; V = 15 Km/h
0.77
9 Flexi rings; Structured packing;
Single cage (Exposed surface area = 1 m2); Depth =
0.50 m; Wind shield was in place;
Q = 400 L/h; V = 15 Km/h
Salt water
0.86
1000/902.0 asw eeVE
1000/851.0 asw eeVE
1000/152.0 asw eeVE
1000/192.0 asw eeVE
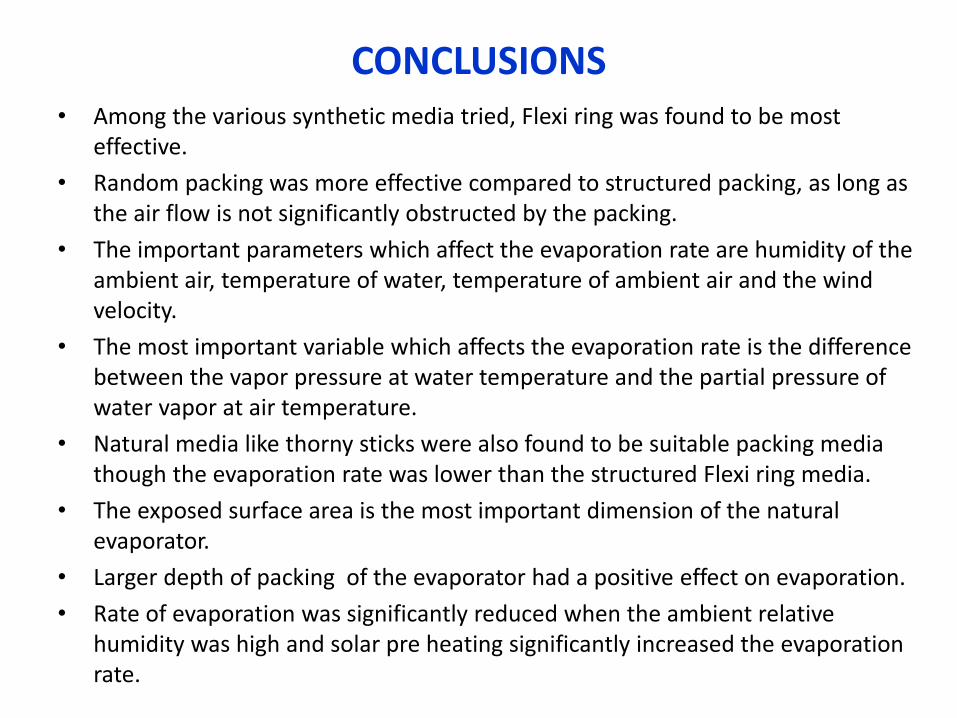
CONCLUSIONS • Among the various synthetic media tried, Flexi ring was found to be most
effective.
• Random packing was more effective compared to structured packing, as long as the air flow is not significantly obstructed by the packing.
• The important parameters which affect the evaporation rate are humidity of the ambient air, temperature of water, temperature of ambient air and the wind velocity.
• The most important variable which affects the evaporation rate is the difference between the vapor pressure at water temperature and the partial pressure of water vapor at air temperature.
• Natural media like thorny sticks were also found to be suitable packing media though the evaporation rate was lower than the structured Flexi ring media.
• The exposed surface area is the most important dimension of the natural evaporator.
• Larger depth of packing of the evaporator had a positive effect on evaporation.
• Rate of evaporation was significantly reduced when the ambient relative humidity was high and solar pre heating significantly increased the evaporation rate.
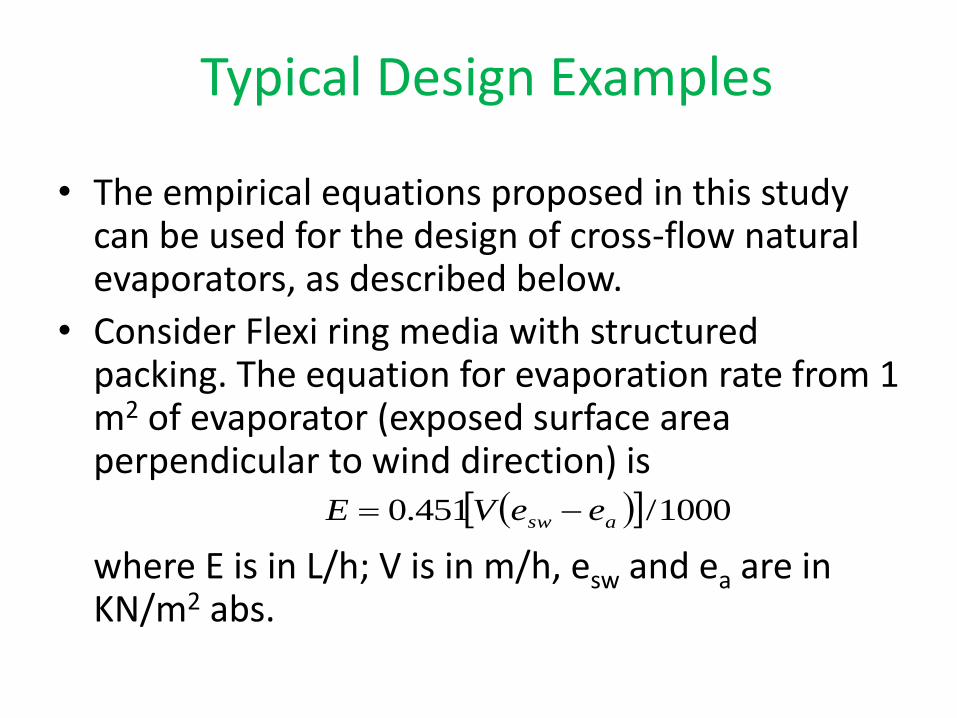
Typical Design Examples
• The empirical equations proposed in this study can be used for the design of cross-flow natural evaporators, as described below.
• Consider Flexi ring media with structured packing. The equation for evaporation rate from 1 m2 of evaporator (exposed surface area perpendicular to wind direction) is
where E is in L/h; V is in m/h, esw and ea are in KN/m2 abs.
1000/451.0 asw eeVE

Case(i): Provision of Solar Heating
• It is assumed that the water temperature due to solar heating is 600 C (corresponding esw value is 20 KN/m2)
• Ambient air temperature is 300 C (corresponding vapor pressure = 4.25 KN/m2)
• Prevailing wind velocity is 15 Km/h and the Relative humidity, Rh is 50% (corresponding ea at air temperature of 300 C is 2.125 KN/m2).
• It is required to evaporate 100 KL of water per day. • Evaporation rate, E is 120.9 L/h or 2902 LPD. • Hence the area required for evaporating 100 KLD =
105/2902 = 34.5 m2
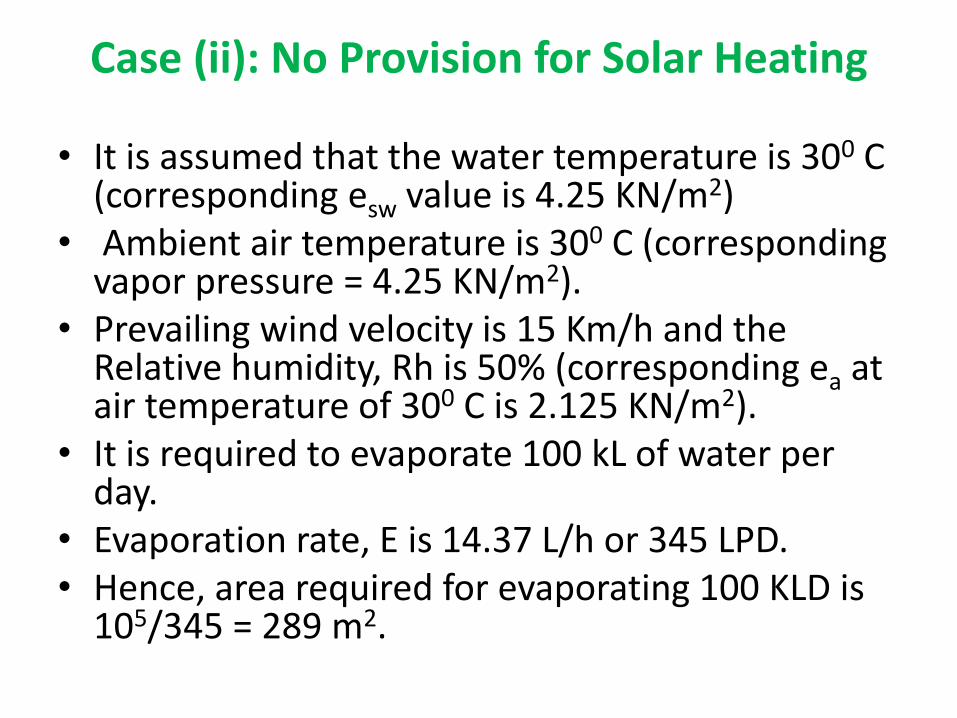
Case (ii): No Provision for Solar Heating
• It is assumed that the water temperature is 300 C
(corresponding esw value is 4.25 KN/m2) • Ambient air temperature is 300 C (corresponding
vapor pressure = 4.25 KN/m2). • Prevailing wind velocity is 15 Km/h and the
Relative humidity, Rh is 50% (corresponding ea at air temperature of 300 C is 2.125 KN/m2).
• It is required to evaporate 100 kL of water per day.
• Evaporation rate, E is 14.37 L/h or 345 LPD. • Hence, area required for evaporating 100 KLD is
105/345 = 289 m2.
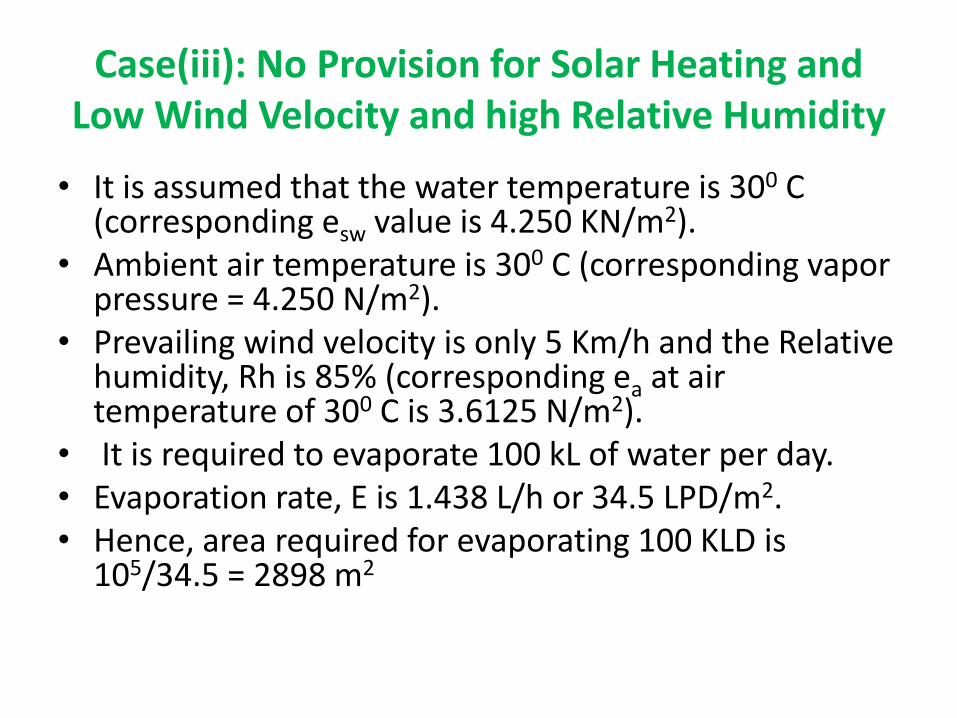
Case(iii): No Provision for Solar Heating and Low Wind Velocity and high Relative Humidity
• It is assumed that the water temperature is 300 C (corresponding esw value is 4.250 KN/m2).
• Ambient air temperature is 300 C (corresponding vapor pressure = 4.250 N/m2).
• Prevailing wind velocity is only 5 Km/h and the Relative humidity, Rh is 85% (corresponding ea at air temperature of 300 C is 3.6125 N/m2).
• It is required to evaporate 100 kL of water per day. • Evaporation rate, E is 1.438 L/h or 34.5 LPD/m2. • Hence, area required for evaporating 100 KLD is
105/34.5 = 2898 m2
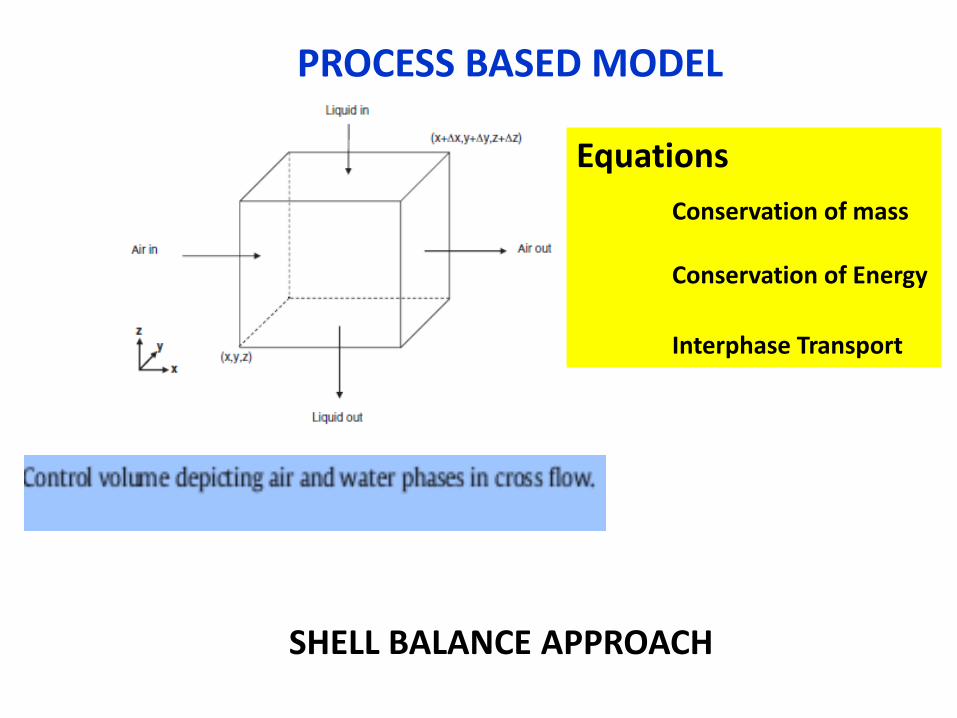
Equations
Conservation of mass Conservation of Energy
Interphase Transport
SHELL BALANCE APPROACH
PROCESS BASED MODEL

Ga= Mass Flux of air Gw= Mass Flux of water W = Humidity in mass ratio basis B = Width in the air flow direction
Material Balance
Interfacial Flux Expression
Wi= saturation humidity at inteface, based on liquid T wG= humidity of bulk air stream Kw= Mass transfer coefficient
Rate of loss of water due to evaporation = Rate of gain in moisture by air

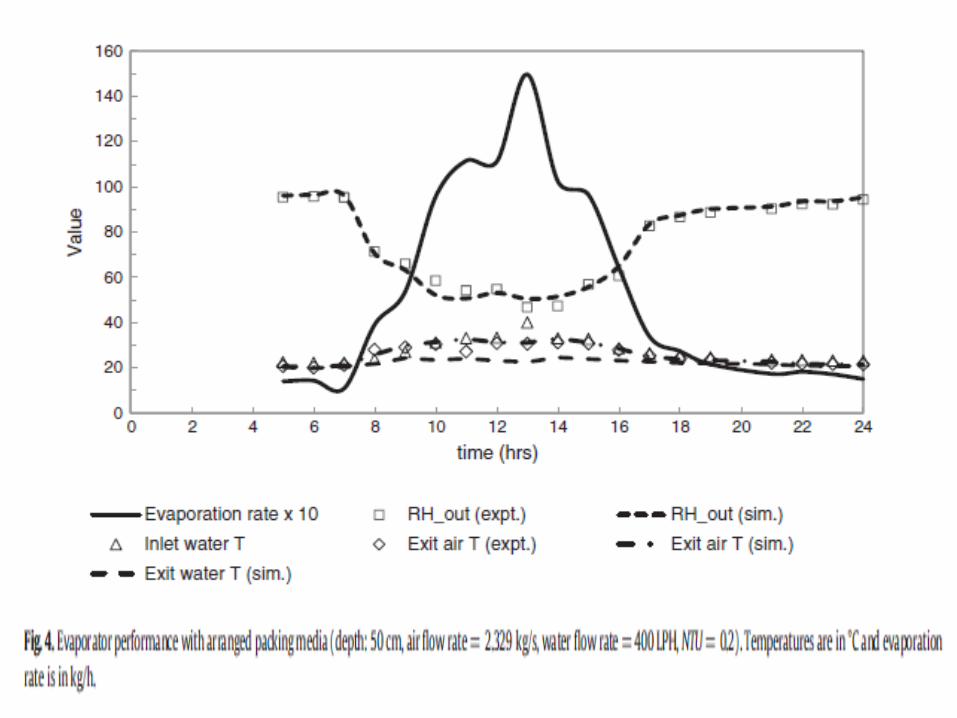
NTU: Important performance Indicator High value indicates more evaporation So better cooling
OVERALL ENERGY BALANCE
tw = water temperature Cpw = Specific heat capacity Ha = Air enthalpy
Decrease in water enthalpy = Increase in air enthalpy
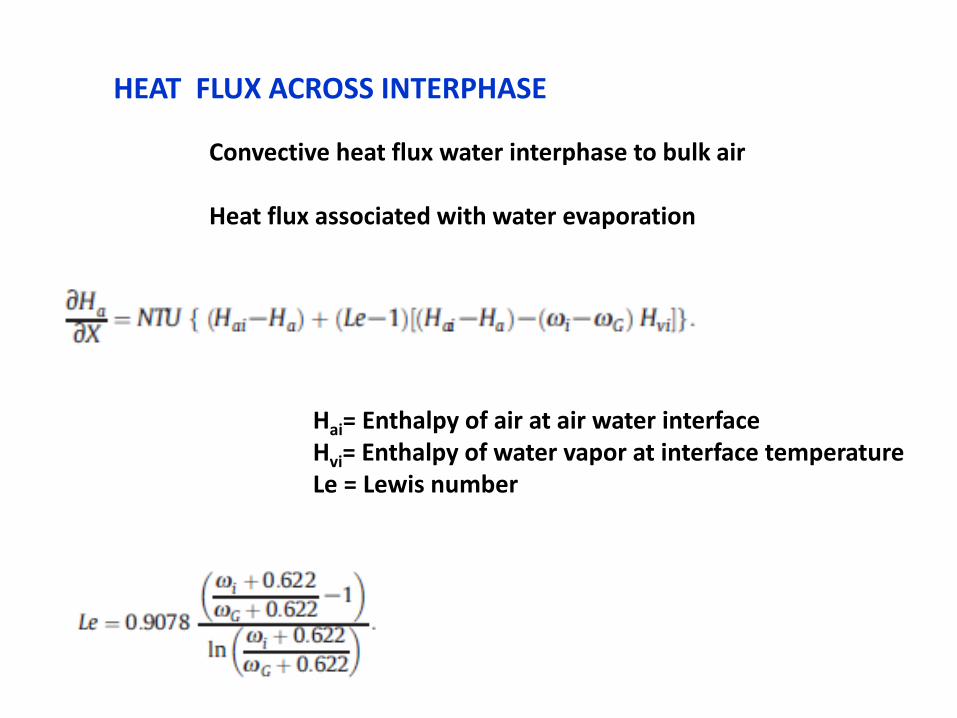
HEAT FLUX ACROSS INTERPHASE
Convective heat flux water interphase to bulk air Heat flux associated with water evaporation
Hai= Enthalpy of air at air water interface Hvi= Enthalpy of water vapor at interface temperature Le = Lewis number

Equation for Water Temperature
Equations are solved for Water flow rate Air humidity Air enthalpy Water Temperature At any location in the tower x: Direction of air flow z: Direction of water flow


Water Evaporation rate in each element

THANK YOU

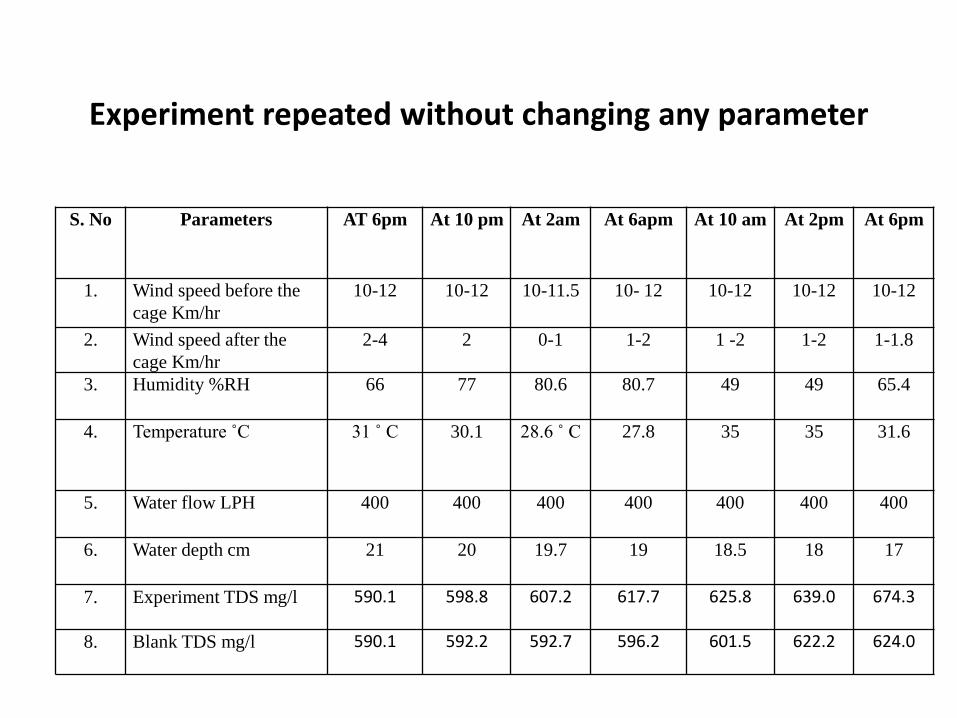
S. No Parameters AT 10 am At 2 pm
At 6 pm At 10 pm At 2 am At 6am At 10am
1. Wind speed before the
cage Km/hr
10.5
11
10
10-11.3 10-12
10-11
10-12
2. Wind speed after the
cage Km/hr
1
1
2
2
1
0.8-1.2
1
3. Humidity %RH 45.5
34.6
61.7
79
79.5
76.4
40
4. Temperature ˚C 38
41
33
29.7
29.3
29.1
39.5
5. Water flow LPH 400
400
400
400 400
400
400
6. Water depth cm 17.5
16.5
15
14.2
14
13
12
7. Experiment TDS mg/l
553.4 580.6 611.2 626 644.3 660.4 692.7
8. Blank TDS mg/l 553.4
562.5 574.4 585.3 589.8 594.1 602.3
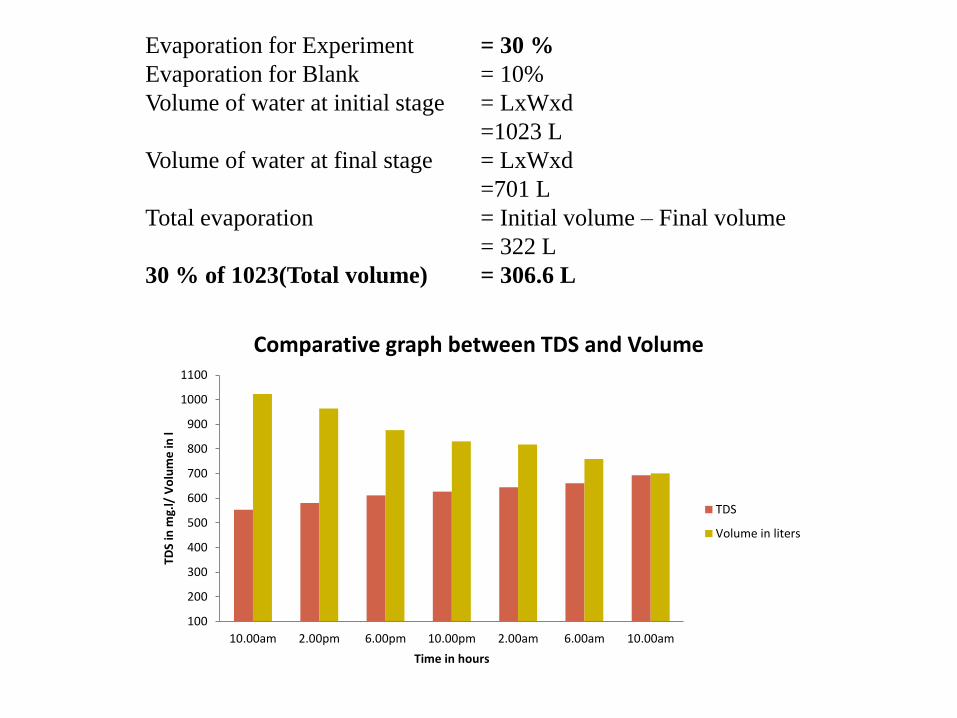
Evaporation for Experiment = 30 %
Evaporation for Blank = 10%
Volume of water at initial stage = LxWxd
=1023 L
Volume of water at final stage = LxWxd
=701 L
Total evaporation = Initial volume – Final volume
= 322 L
30 % of 1023(Total volume) = 306.6 L
100
200
300
400
500
600
700
800
900
1000
1100
10.00am 2.00pm 6.00pm 10.00pm 2.00am 6.00am 10.00am
TDS
in m
g.l/
Vo
lum
e in
l
Time in hours
Comparative graph between TDS and Volume
TDS
Volume in liters
S. No Parameters AT 6pm At 10 pm
At 2am At 6apm At 10 am At 2pm At 6pm
1. Wind speed before the
cage Km/hr
10-12
10-12
10-11.5
10- 12
10-12
10-12
10-12
2. Wind speed after the
cage Km/hr
2-4
2
0-1
1-2 1 -2
1-2
1-1.8
3. Humidity %RH 66
77
80.6
80.7
49
49
65.4
4. Temperature ˚C 31 ˚ C
30.1
28.6 ˚ C
27.8
35
35
31.6
5. Water flow LPH 400
400 400
400
400 400 400
6. Water depth cm 21
20
19.7
19
18.5 18
17
7. Experiment TDS mg/l
590.1 598.8 607.2 617.7 625.8 639.0 674.3
8. Blank TDS mg/l
590.1 592.2 592.7 596.2 601.5 622.2 624.0
Experiment repeated without changing any parameter
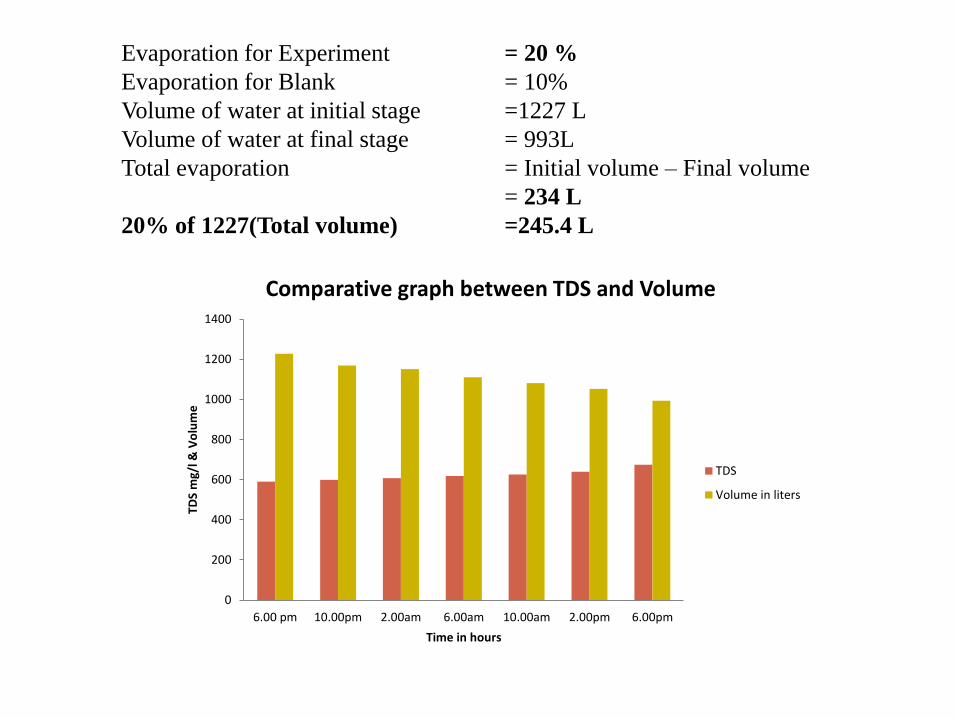
Evaporation for Experiment = 20 %
Evaporation for Blank = 10%
Volume of water at initial stage =1227 L
Volume of water at final stage = 993L
Total evaporation = Initial volume – Final volume
= 234 L
20% of 1227(Total volume) =245.4 L
0
200
400
600
800
1000
1200
1400
6.00 pm 10.00pm 2.00am 6.00am 10.00am 2.00pm 6.00pm
TDS
mg/
l & V
olu
me
Time in hours
Comparative graph between TDS and Volume
TDS
Volume in liters
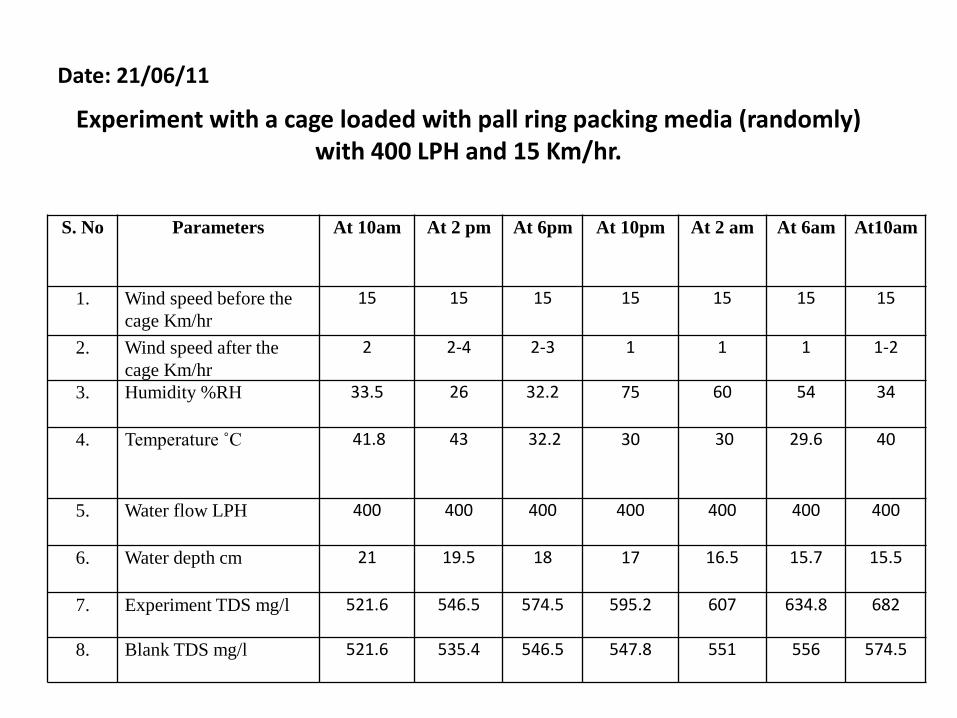
Date: 21/06/11
Experiment with a cage loaded with pall ring packing media (randomly) with 400 LPH and 15 Km/hr.
S. No Parameters At 10am At 2 pm
At 6pm At 10pm At 2 am At 6am At10am
1. Wind speed before the
cage Km/hr
15
15 15
15
15
15
15
2. Wind speed after the
cage Km/hr
2
2-4
2-3
1
1
1
1-2
3. Humidity %RH 33.5
26 32.2 75 60 54
34
4. Temperature ˚C 41.8
43
32.2
30 30
29.6
40
5. Water flow LPH 400 400 400
400
400 400 400
6. Water depth cm 21 19.5 18
17 16.5
15.7
15.5
7. Experiment TDS mg/l
521.6 546.5 574.5 595.2 607 634.8 682
8. Blank TDS mg/l
521.6 535.4 546.5 547.8 551 556 574.5
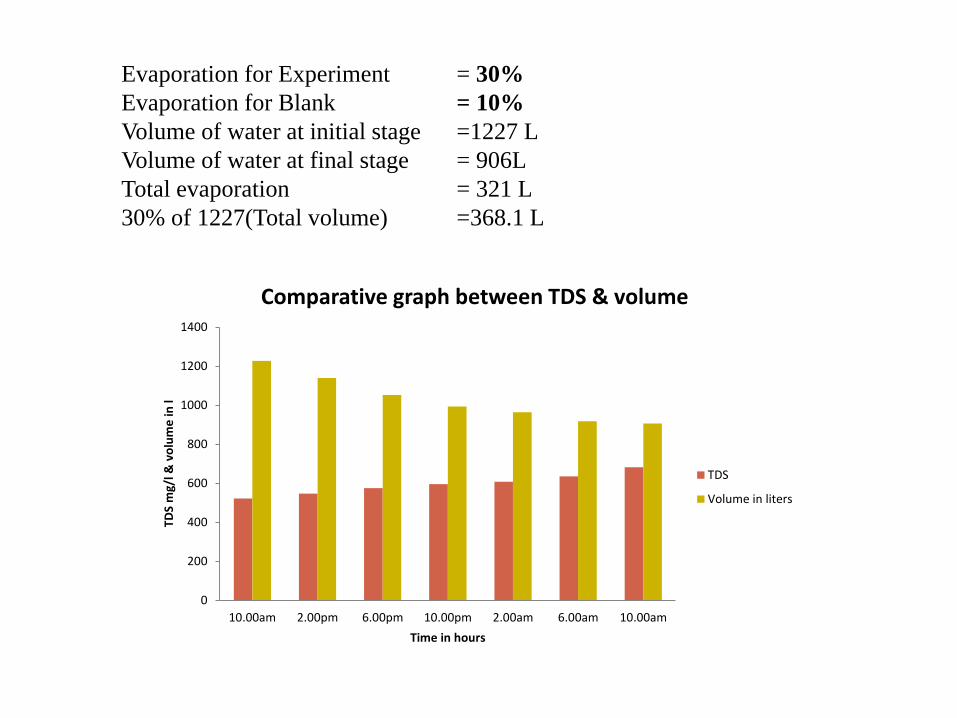
Evaporation for Experiment = 30%
Evaporation for Blank = 10%
Volume of water at initial stage =1227 L
Volume of water at final stage = 906L
Total evaporation = 321 L
30% of 1227(Total volume) =368.1 L
0
200
400
600
800
1000
1200
1400
10.00am 2.00pm 6.00pm 10.00pm 2.00am 6.00am 10.00am
TDS
mg/
l & v
olu
me
in l
Time in hours
Comparative graph between TDS & volume
TDS
Volume in liters
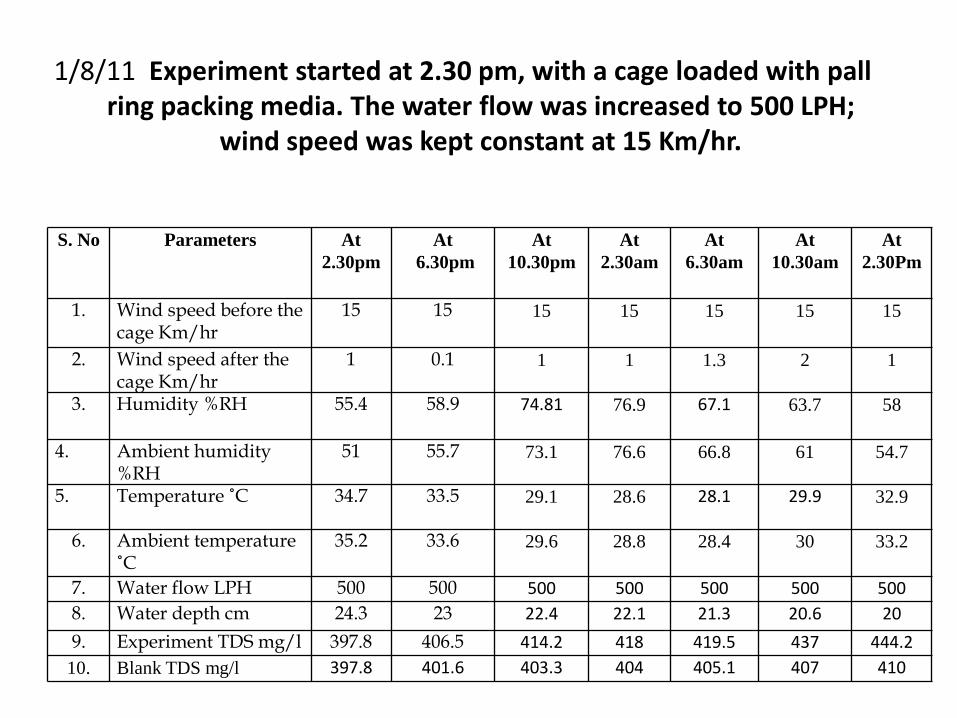
1/8/11 Experiment started at 2.30 pm, with a cage loaded with pall ring packing media. The water flow was increased to 500 LPH;
wind speed was kept constant at 15 Km/hr.
S. No Parameters At
2.30pm
At
6.30pm
At
10.30pm
At
2.30am
At
6.30am
At
10.30am
At
2.30Pm
1. Wind speed before the cage Km/hr
15 15 15 15 15 15 15
2. Wind speed after the cage Km/hr
1 0.1 1 1 1.3 2 1
3. Humidity %RH 55.4 58.9 74.81 76.9 67.1 63.7 58
4. Ambient humidity %RH
51 55.7 73.1 76.6 66.8 61 54.7
5. Temperature ˚C
34.7 33.5 29.1 28.6 28.1 29.9 32.9
6. Ambient temperature ˚C
35.2 33.6 29.6 28.8 28.4 30 33.2
7. Water flow LPH 500 500 500 500 500 500 500
8. Water depth cm 24.3 23 22.4 22.1 21.3 20.6 20
9. Experiment TDS mg/l 397.8 406.5 414.2 418 419.5 437 444.2
10. Blank TDS mg/l 397.8 401.6 403.3 404 405.1 407 410

Evaporation for Experiment = 20%
Evaporation for Blank = 10%
Volume of water at initial stage =1420 L
Volume of water at final stage = 1169L
Total evaporation = 251 L
20% of 1420 (Total volume) = 284 L
0
200
400
600
800
1000
1200
1400
1600
2.30pm 6.30 pm 10.30 pm 2.30am 6.30am 10.30 am 2.30pm
TDS/
vo
lum
e
Time in hours
Comparative graph between TDS and Volume
TDS
Volume in liters

03/08/11 Experiment started at 2.00 pm with two cages, in back to back position with 6cm gap in between the cage. The flow rate was
kept at 600 LPH. Wind speed was kept at 15km/hr.
S. No Parameters At 2pm At 6pm
At 10pm At 2am At 6am At 10am At 2pm
1. Wind speed before the cage Km/hr
15 15 15 15 15 15 15
2. Wind speed after the cage Km/hr
2.5 2.5 1.5 1 0.2 2.5 1.2
3. Ambient Humidity %RH
37.4 50.2 77.3 59.7 59.5 47.4 41.7
4. Ambient temperature ˚C
39.6 33.3 30 29.8 30.2 34.7 37.7
5. Humidity %RH 43.6 52.9 77.1 61.1 60.4 46.7 43.5
6. Temperature ˚c 36.4 32.6 29.7 29.7 30.4 35.9 38.5
7. Water flow LPH 600 600 600 600 600 600 600
8. Water depth cm 27.5 26.2 25.6 25.2 24 23 21.8
9. Experiment TDS mg/l 400 409 416 424 434 438 446.5
10. Blank TDS mg/l 400 404.9 406 408 410.4 412.4 417.9
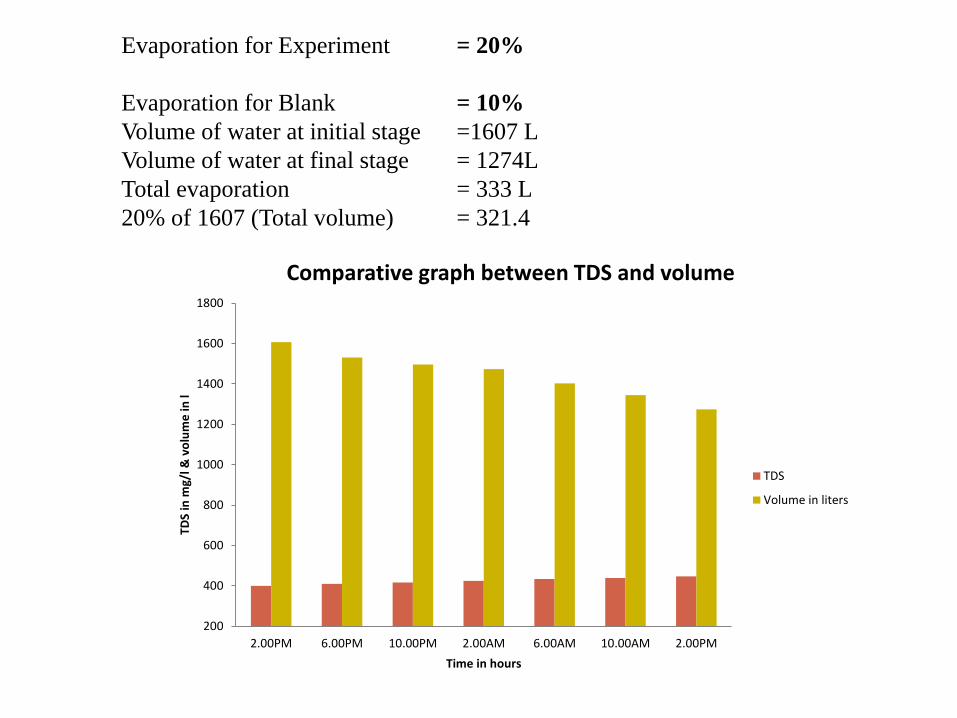
Evaporation for Experiment = 20%
Evaporation for Blank = 10%
Volume of water at initial stage =1607 L
Volume of water at final stage = 1274L
Total evaporation = 333 L
20% of 1607 (Total volume) = 321.4
200
400
600
800
1000
1200
1400
1600
1800
2.00PM 6.00PM 10.00PM 2.00AM 6.00AM 10.00AM 2.00PM
TDS
in m
g/l &
vo
lum
e in
l
Time in hours
Comparative graph between TDS and volume
TDS
Volume in liters

11/8/11 Experiment started at 2 pm with 2 cage in back to back position with 6cm gap and the flow rate was increase to 800 LPH,
wind speed was maintained at 15 km/hr.
S. No Parameters At 2pm At 6pm
At 10pm At 2am At 6am At 10am At 2pm
1. Wind speed before the cage Km/hr
15 15 15 15 15 15 15
2. Wind speed after the cage Km/hr
1.8 0 1.5 3.5 0 1.5 2.1
3. Ambient Humidity %RH
44 74 77.3 76.1 82.7 55.1 49.7
4. Ambient temperature ˚C
40 30.8 30.3 27.4 26.6 35.7 37
5. Humidity %RH 45.3 75.4 79.5 77.5 83.1 55.9 51.2
6. Temperature ˚c 39.6 30.4 29.7 27.2 26.6 35.5 37
7. Water flow LPH 800 800 800 800 800 800 800
8. Water depth cm 27 25.4 24.6 23.8 23 22 21
9. Experiment TDS mg/l 492.6 501.9 512.4 520.5 530.2 533 540
10. Blank TDS mg/l 492.6 497.4 497.4 498.8 500 501.6 506.9
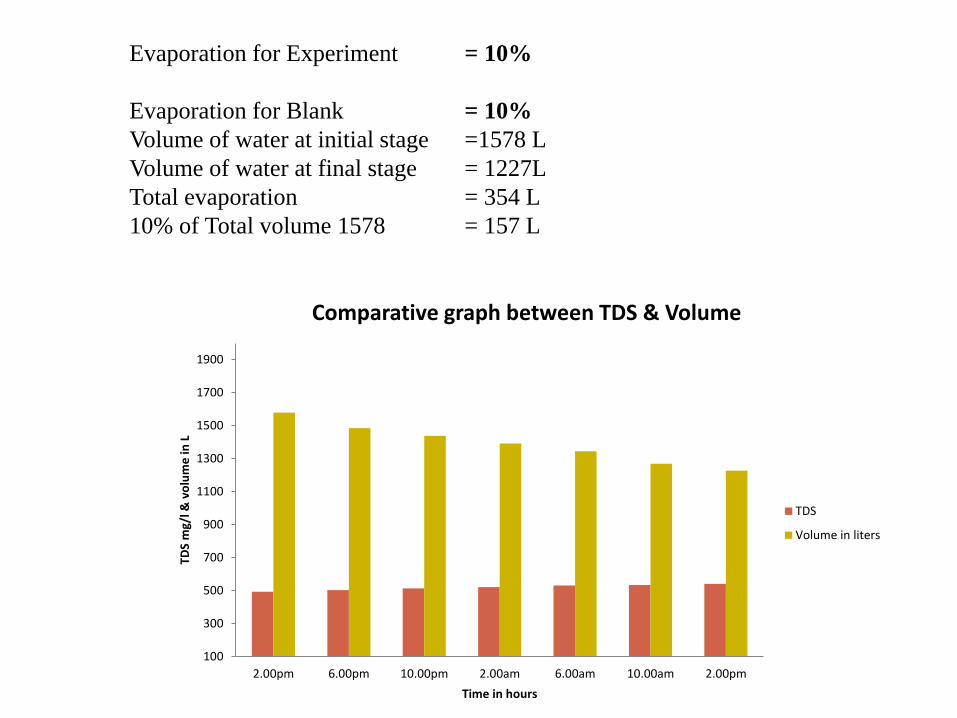
Evaporation for Experiment = 10%
Evaporation for Blank = 10%
Volume of water at initial stage =1578 L
Volume of water at final stage = 1227L
Total evaporation = 354 L
10% of Total volume 1578 = 157 L
100
300
500
700
900
1100
1300
1500
1700
1900
2.00pm 6.00pm 10.00pm 2.00am 6.00am 10.00am 2.00pm
TDS
mg/
l & v
olu
me
in L
Time in hours
Comparative graph between TDS & Volume
TDS
Volume in liters
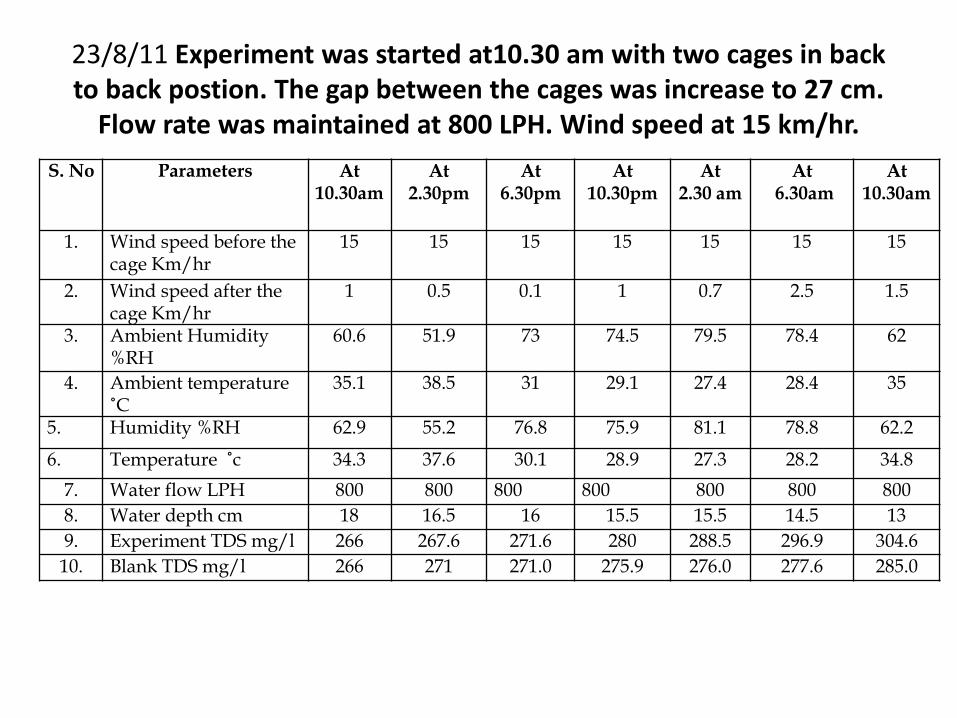
23/8/11 Experiment was started at10.30 am with two cages in back to back postion. The gap between the cages was increase to 27 cm.
Flow rate was maintained at 800 LPH. Wind speed at 15 km/hr.
S. No Parameters At 10.30am
At 2.30pm
At 6.30pm
At 10.30pm
At 2.30 am
At 6.30am
At 10.30am
1. Wind speed before the cage Km/hr
15 15 15 15 15 15 15
2. Wind speed after the cage Km/hr
1 0.5 0.1 1 0.7 2.5 1.5
3. Ambient Humidity %RH
60.6 51.9 73 74.5 79.5 78.4 62
4. Ambient temperature ˚C
35.1 38.5 31 29.1 27.4 28.4 35
5. Humidity %RH 62.9 55.2 76.8 75.9 81.1 78.8 62.2
6. Temperature ˚c 34.3 37.6 30.1 28.9 27.3 28.2 34.8
7. Water flow LPH 800 800 800 800 800 800 800
8. Water depth cm 18 16.5 16 15.5 15.5 14.5 13
9. Experiment TDS mg/l 266 267.6 271.6 280 288.5 296.9 304.6
10. Blank TDS mg/l 266 271 271.0 275.9 276.0 277.6 285.0

Evaporation for Experiment = 20%
Evaporation for Blank = 10%
Volume of water at initial stage =1052 L
Volume of water at final stage = 759
Total evaporation = 293L
20% of total volume 1052 = 210 L
0
200
400
600
800
1000
1200
10.30am 2.30pm 6.30pm 10.30pm 2.30am 6.30am 10.30am
TDS
mg/
l & V
olu
me
in L
Time in hour
Comparative graph between TDS & Volume
TDS
Volume in liters

29/8/11 Experiment started at 10.30 am without packing media, wire cage, wind shield. Water flow was maintained at 800 LPH, Wind speed at
15Km/hr.
S. No Parameters At 10.30am
At 2.30pm
At 6.30pm
At 10.30pm
At 2.30 am
At 6.30am
At 10.30am
1. Wind speed before the cage Km/hr
15 15 15 15 15 15 15
2. Wind speed after the cage Km/hr
10-11 8-9 8 7 8-9 7 8-10
3. Ambient Humidity %RH
61.6 60 64.8 66.4 67.4 70.7 53.7
4. Ambient temperature ˚C
32 32.1 30.1 29.5 28.6 28 33.1
5. Humidity %RH 62.1 63.3 68.2 67.5 71.3 75.1 54.2
6. Temperature ˚c 31.6 31.5 29.6 29 27.7 27.1 33
7. Water flow LPH 800 800 800 800 800 800 800
8. Water depth cm 21.5 19.5 18 17 15.5 14 13
9. Experiment TDS mg/l 192 195 199 209 217 225 230
10. Blank TDS mg/l 192 193 194 197 197.9 198.5 201
11. Temperature of water ˚c 29 30 29 28 28 26 31

Evaporation for Experiment = 20%
Evaporation for Blank = 10%
Volume of water at initial stage =1256 L
Volume of water at final stage = 759
Total evaporation = 497L
20 % of total volume 1256 = 251.2
0
200
400
600
800
1000
1200
1400
10.30 am 2.30pm 6.30pm 10.30 pm 2.30am 6.30 am 10.30am
TDS
in m
g/l &
vo
lum
e in
l
Time in hours
Comparative graph between TDS & volume
TDS
Volume in liters

30/8/11 Experiment with single cage and the setup was covered with a wind shield made up of tarpaulin. The Flow rate was maintained at
400 LPH, wind speed at 15 Km/hr
S. No Parameters At2.00 pm
At 6.00pm
At 10.00pm
At 2.00am
At 6.00am
At 10.00am
At 2.00pm
1. Wind speed before the cage Km/hr
15 15 15 15 15 15 15
2. Wind speed after the cage Km/hr
2.2 0.2 0.5 1 0.5 1 1.5
3. Ambient Humidity %RH
55.7 70.2 82.4 78.1 75.1 60 52.8
4. Ambient temperature ˚C
33.3 31.1 29.3 27.9 28 31.2 34.9
5. Humidity %RH 57.1 70.8 82.9 78.3 75.4 61.7 53.0
6. Temperature ˚c 33.6 30.9 29.2 27.8 28.2 31 34.9
7. Water flow LPH 400 400 400 400 400 400 400
8. Water depth cm 25.5 24 23 22 22 21 19
9. Experiment TDS mg/l 264.8 270.7 275.8 277.1 284.4 - 291.1
10. Blank TDS mg/l 264.8 268.7 271.4 270.1 271.7 - 276.1
11. Temperature of water ˚c 34 24 30 29 28 30 33

Evaporation for Experiment = 10%
Evaporation for Blank = 10%
Volume of water at initial stage =1490 L
Volume of water at final stage = 1110
Total evaporation = 380L
10% of total volume1490 = 149 L
0
200
400
600
800
1000
1200
1400
1600
2.00pm 6.00pm 10.00pm 2.00am 6.00am 10.00am 2.00pm
TDS
in m
vo
lum
e in
l
Time in hours
Compartaive Graph between TDS & volume
TDS
Volume in liters

07/09/11Experiment with a cage loaded pall ring packing media. The media are pasted in horizontal position to make a pipe like structure. This
arrangement in packing media allowed air to pass through the media, more efficiently than the randomly packing method.
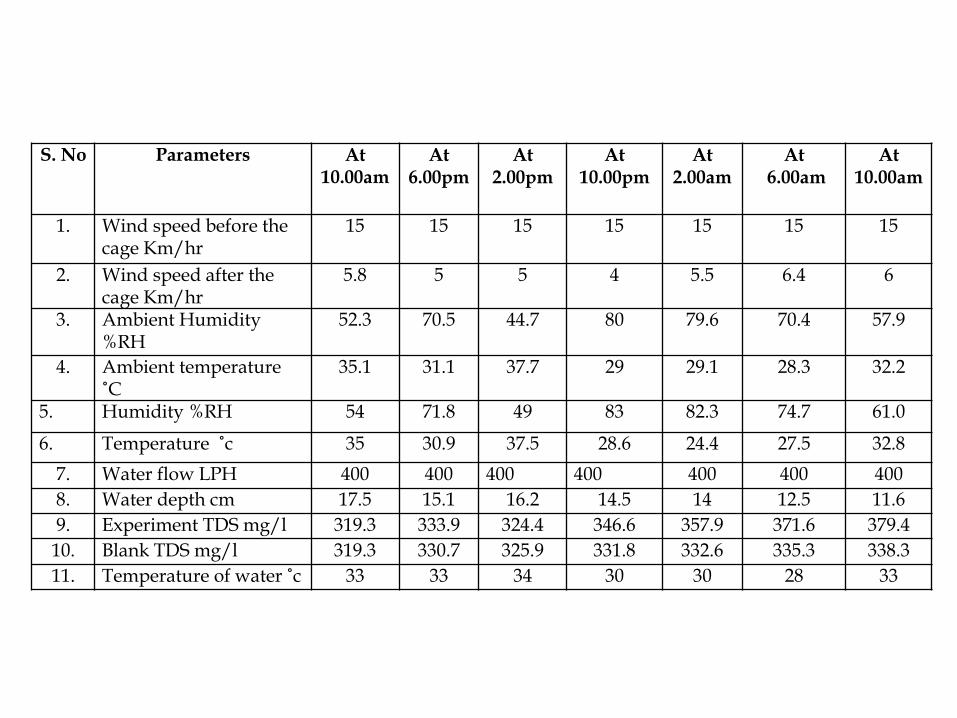
S. No Parameters At 10.00am
At 6.00pm
At 2.00pm
At 10.00pm
At 2.00am
At 6.00am
At 10.00am
1. Wind speed before the cage Km/hr
15 15 15 15 15 15 15
2. Wind speed after the cage Km/hr
5.8 5 5 4 5.5 6.4 6
3. Ambient Humidity %RH
52.3 70.5 44.7 80 79.6 70.4 57.9
4. Ambient temperature ˚C
35.1 31.1 37.7 29 29.1 28.3 32.2
5. Humidity %RH 54 71.8 49 83 82.3 74.7 61.0
6. Temperature ˚c 35 30.9 37.5 28.6 24.4 27.5 32.8
7. Water flow LPH 400 400 400 400 400 400 400
8. Water depth cm 17.5 15.1 16.2 14.5 14 12.5 11.6
9. Experiment TDS mg/l 319.3 333.9 324.4 346.6 357.9 371.6 379.4
10. Blank TDS mg/l 319.3 330.7 325.9 331.8 332.6 335.3 338.3
11. Temperature of water ˚c 33 33 34 30 30 28 33
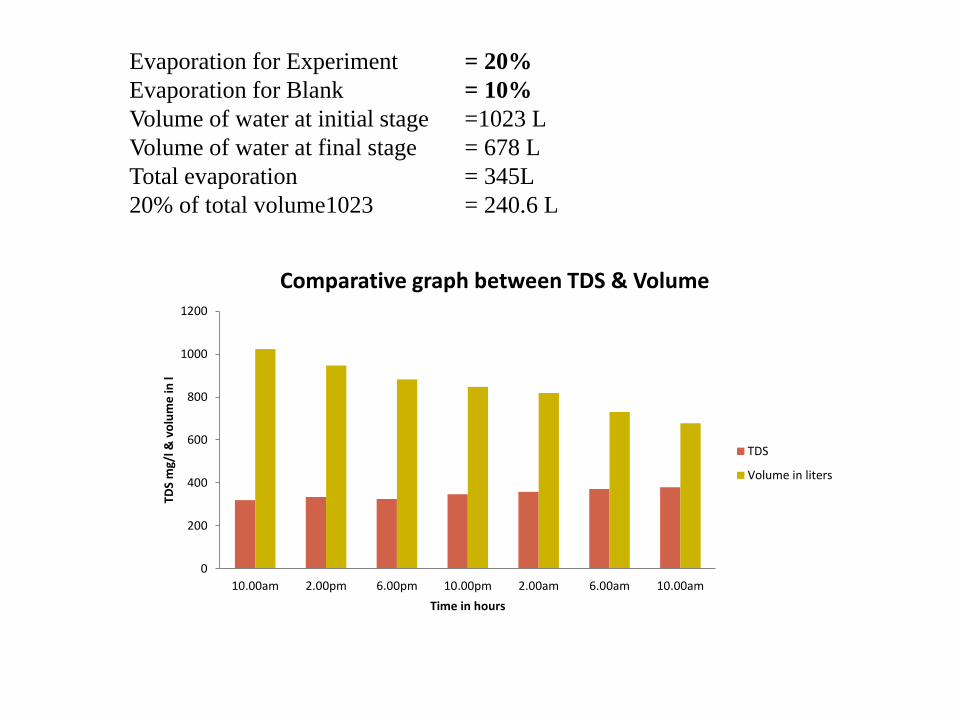
Evaporation for Experiment = 20%
Evaporation for Blank = 10%
Volume of water at initial stage =1023 L
Volume of water at final stage = 678 L
Total evaporation = 345L
20% of total volume1023 = 240.6 L
0
200
400
600
800
1000
1200
10.00am 2.00pm 6.00pm 10.00pm 2.00am 6.00am 10.00am
TDS
mg/
l & v
olu
me
in l
Time in hours
Comparative graph between TDS & Volume
TDS
Volume in liters
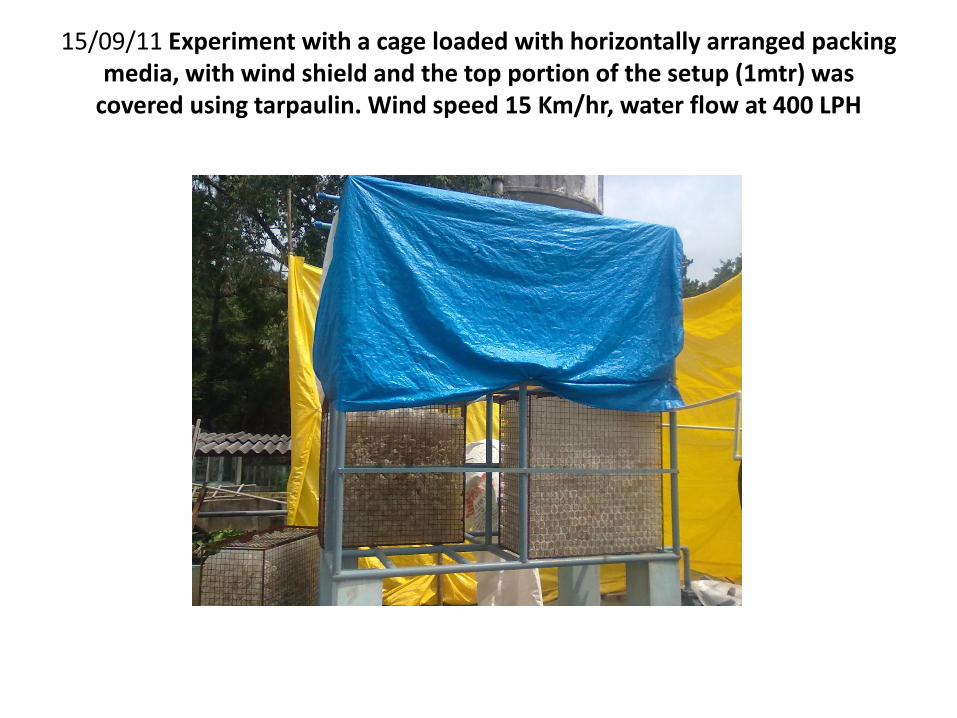
15/09/11 Experiment with a cage loaded with horizontally arranged packing media, with wind shield and the top portion of the setup (1mtr) was
covered using tarpaulin. Wind speed 15 Km/hr, water flow at 400 LPH

S. No Parameters At 2.00pm
At 6.00pm
At 10.00pm
At 2.00am
At 6.00am
At 10.00am
At 2.00pm
1. Wind speed before the cage Km/hr
15 15 15 15 15 15 15
2. Wind speed after the cage Km/hr
4.5 6 5 5 4 5 5
3. Ambient Humidity %RH
45 72 79.2 82.4 78.4 55 44
4. Ambient temperature ˚C
39 31 29.3 26.7 27.6 33.6 40.5
5. Humidity %RH 47 75 80.9 85 80 56.6 46.5
6. Temperature ˚c 38 29.5 28.8 26 27.5 33.4 39
7. Water flow LPH 400 400 400 400 400 400 400
8. Water depth cm 18.4 17.1 16.4 16 15.5 15 14.5
9. Experiment TDS mg/l 286.1 290.4 299.1 307.5 315.6 316.7 319.8
10. Blank TDS mg/l 286.1 289.5 292.6 292.7 293.9 296 305.5
11. Temperature of water ˚c
32 31 30 29 28 32 37
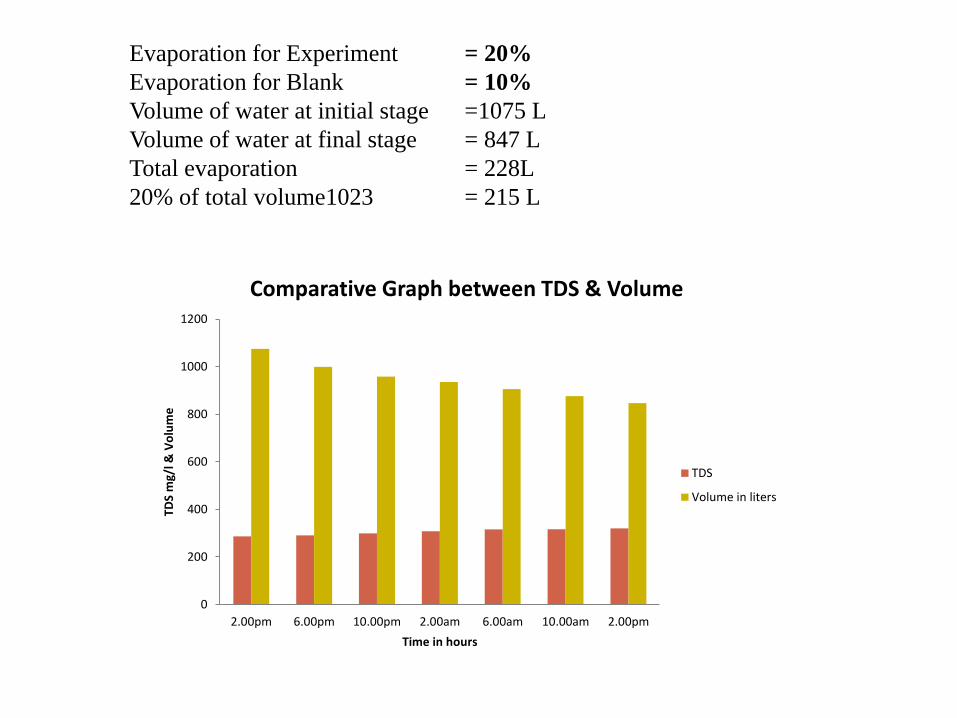
Evaporation for Experiment = 20%
Evaporation for Blank = 10%
Volume of water at initial stage =1075 L
Volume of water at final stage = 847 L
Total evaporation = 228L
20% of total volume1023 = 215 L
0
200
400
600
800
1000
1200
2.00pm 6.00pm 10.00pm 2.00am 6.00am 10.00am 2.00pm
TDS
mg/
l & V
olu
me
Time in hours
Comparative Graph between TDS & Volume
TDS
Volume in liters

21/09/11 Experiment with arranged packing media, with wind shield. Two solar heaters with 600 liters capacity are connected to the water inlet line to
the evaporator. The solar heater gives water at an average of 45-50 ˚C, in
midday sunlight.

S. No Parameters At 6.00pm
At 10.00pm
At 2.00am
At 6.00am
At 10.00am
At 2.00pm
At 6.00 pm
1. Wind speed before the cage Km/hr
15 15 15 15 15 15 15
2. Wind speed after the cage Km/hr
5.5 5.5 5 6.5 6.4 6.4 6.3
3. Ambient Humidity %RH
64.7 79.5 85.9 82.8 43 45 25
4. Ambient temperature ˚C
32.3 28.6 27.3 26.5 36 38 34
5. Humidity %RH 71.7 78.8 84.7 84.2 50 61 25.5
6. Temperature ˚c 31.3 27.9 27.5 26.3 33 33 32
7. Water flow LPH 400 400 400 400 400 400 400
8. Water depth cm 22.7 21.5 21 20.5 20 18.5 17.5
9. Experiment TDS mg/l 311 320 322 325.9 329.4 339.7 350
10. Blank TDS mg/l 311 316 316.7 317.7 317.5 329.3 336
11. Temperature of water ˚c 31 30 29 28.5 31 35 31
12. Temperature of blank ˚c 31 30 29 27 33 39 35
13. Temp of water before reaching the cage ˚c
38 30 29 28.5 40 46 35


