Socio-Economic Impacts of U.S. Ethanol
Bruce A. Babcock
Center for Agricultural and Rural DevelopmentIowa State University
Overview
• Broad overview of U.S. and world biofuels
• Economics of the U.S. ethanol industry
• Impacts on grain prices and feed costs in the long term and short term
• What is accomplished by corn ethanol?
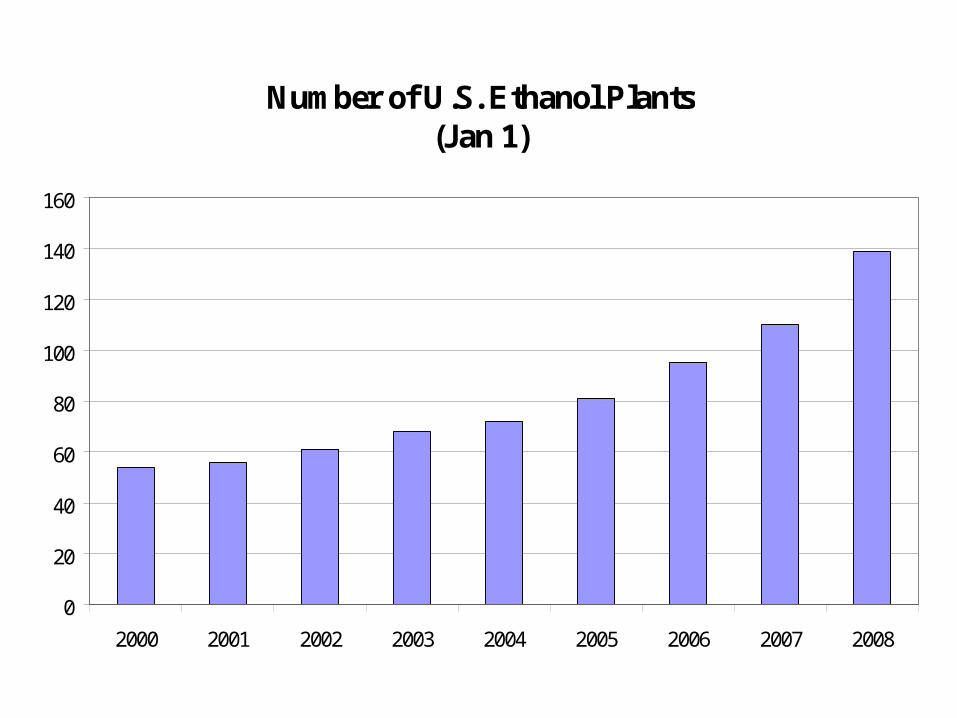
Number of U.S. Ethanol Plants(Jan 1)
0
20
40
60
80
100
120
140
160
2000 2001 2002 2003 2004 2005 2006 2007 2008
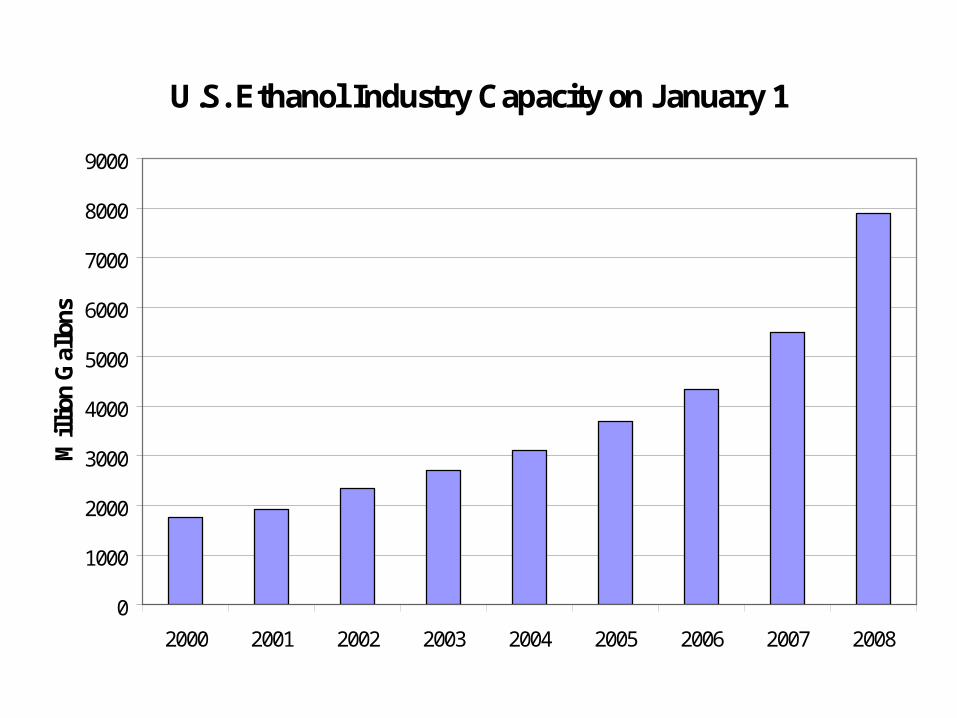
U.S. Ethanol Industry Capacity on January 1
0
1000
2000
3000
4000
5000
6000
7000
8000
9000
2000 2001 2002 2003 2004 2005 2006 2007 2008
Mil
lion
Gal
lons

U.S. Ethanol Production (% of U.S. Gasoline Consumption)
0.0%
1.0%
2.0%
3.0%
4.0%
5.0%
6.0%
7.0%
2000 2001 2002 2003 2004 2005 2006 2007 2008
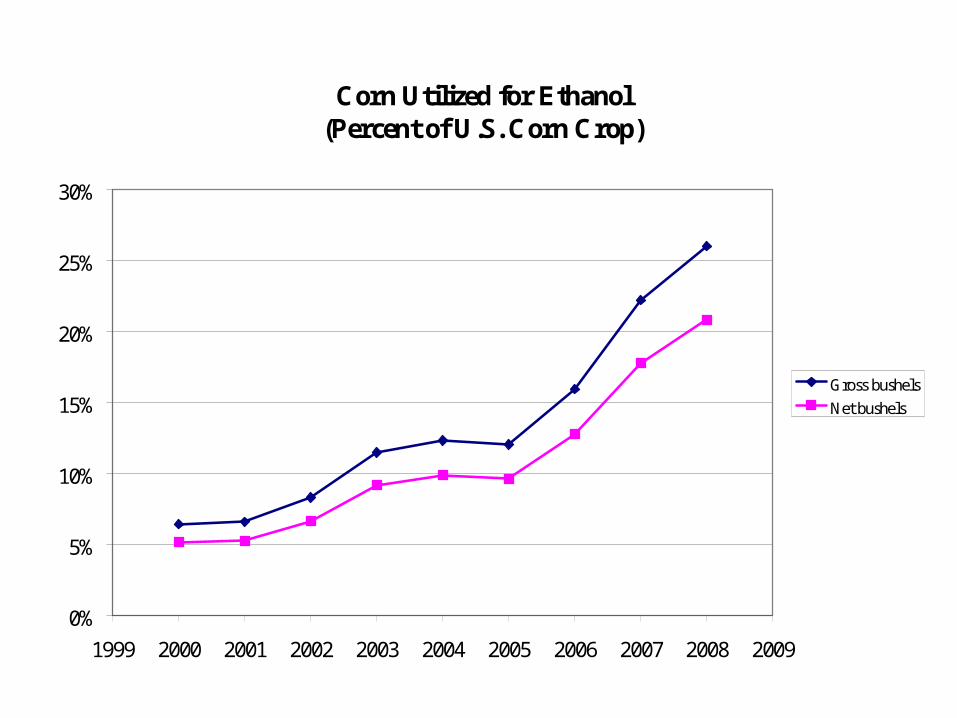
Corn Utilized for Ethanol (Percent of U.S. Corn Crop)
0%
5%
10%
15%
20%
25%
30%
1999 2000 2001 2002 2003 2004 2005 2006 2007 2008 2009
Gross bushels
Net bushels
Subsidies and Protection
• $0.51 per gallon tax credit to blenders increase the WTP for corn by $1.47 per bushel
• $0.54 per gallon import tariff on most Brazilian ethanol
• Various tax credits for construction
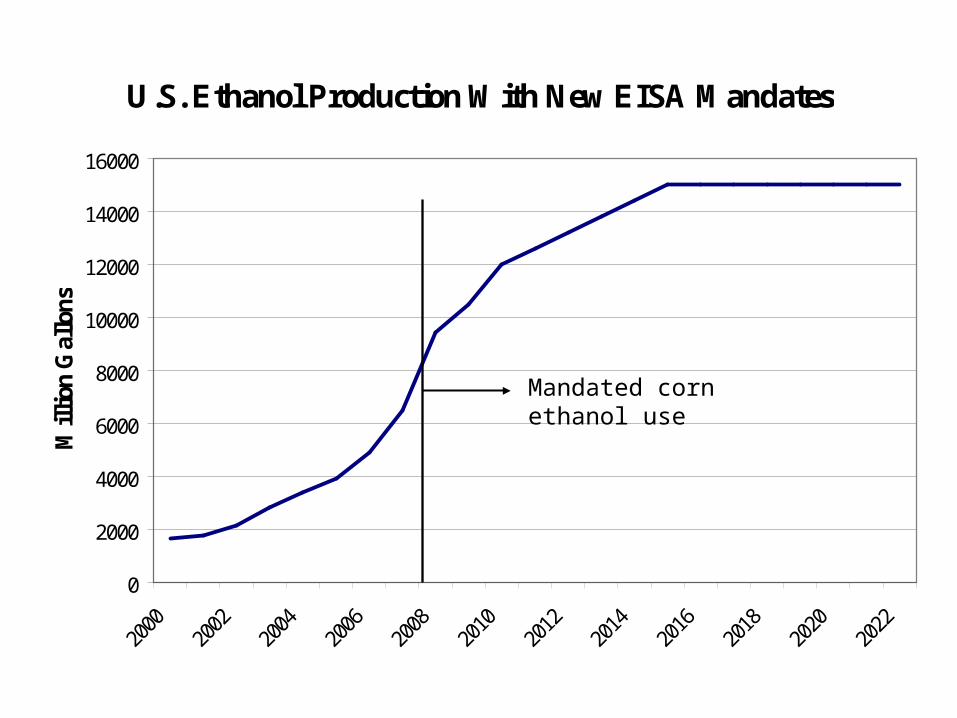
U.S. Ethanol Production With New EISA Mandates
0
2000
4000
6000
8000
10000
12000
14000
16000
Mil
lion
Gal
lons
Mandated corn ethanol use
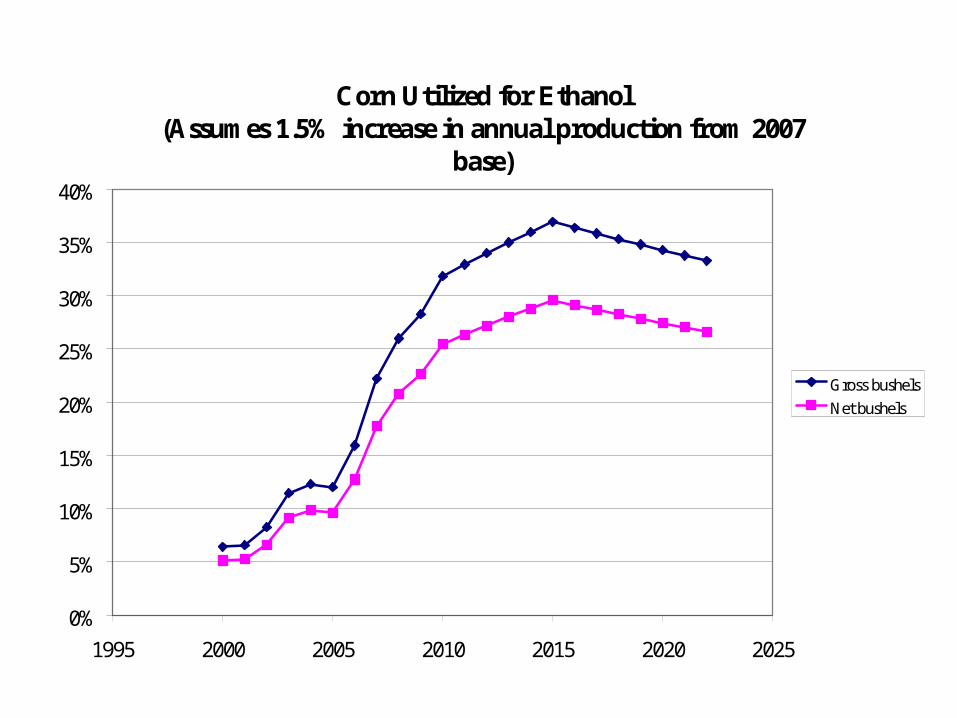
Corn Utilized for Ethanol (Assumes 1.5% increase in annual production from 2007
base)
0%
5%
10%
15%
20%
25%
30%
35%
40%
1995 2000 2005 2010 2015 2020 2025
Gross bushels
Net bushels
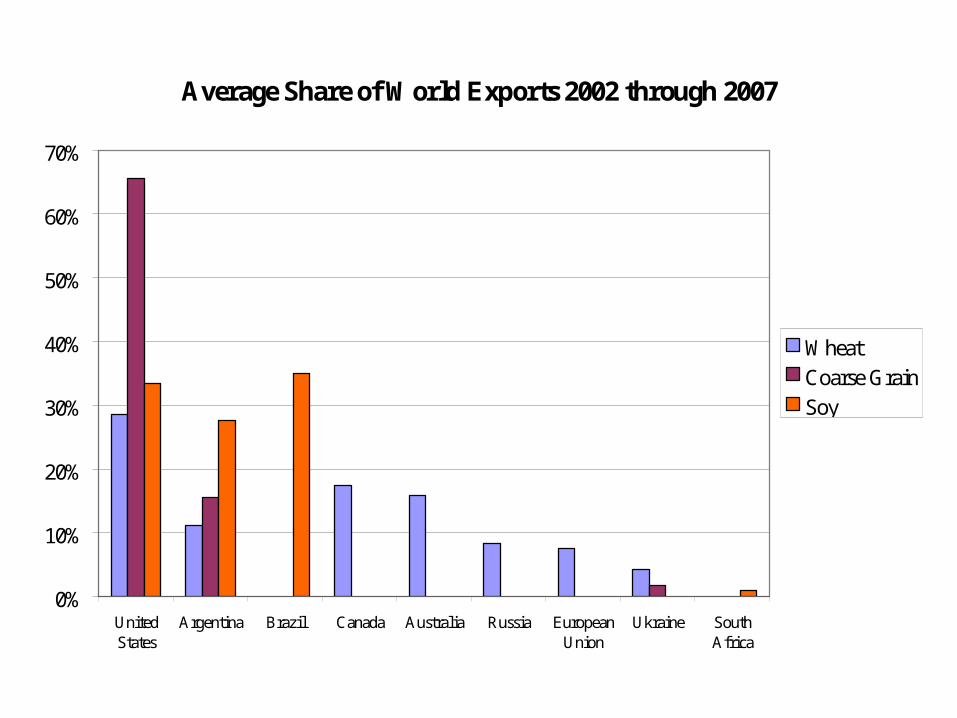
Average Share of World Exports 2002 through 2007
0%
10%
20%
30%
40%
50%
60%
70%
UnitedStates
Argentina Brazil Canada Australia Russia EuropeanUnion
Ukraine SouthAfrica
Wheat
Coarse Grain
Soy
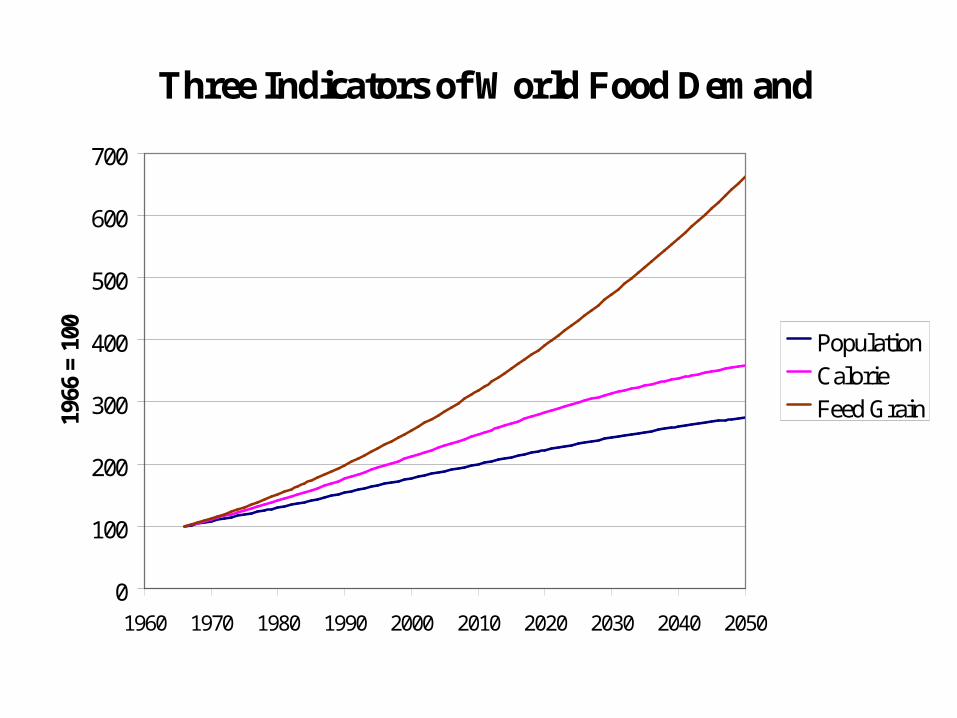
Three Indicators of World Food Demand
0
100
200
300
400
500
600
700
1960 1970 1980 1990 2000 2010 2020 2030 2040 2050
1966
= 1
00 PopulationCalorieFeed Grain
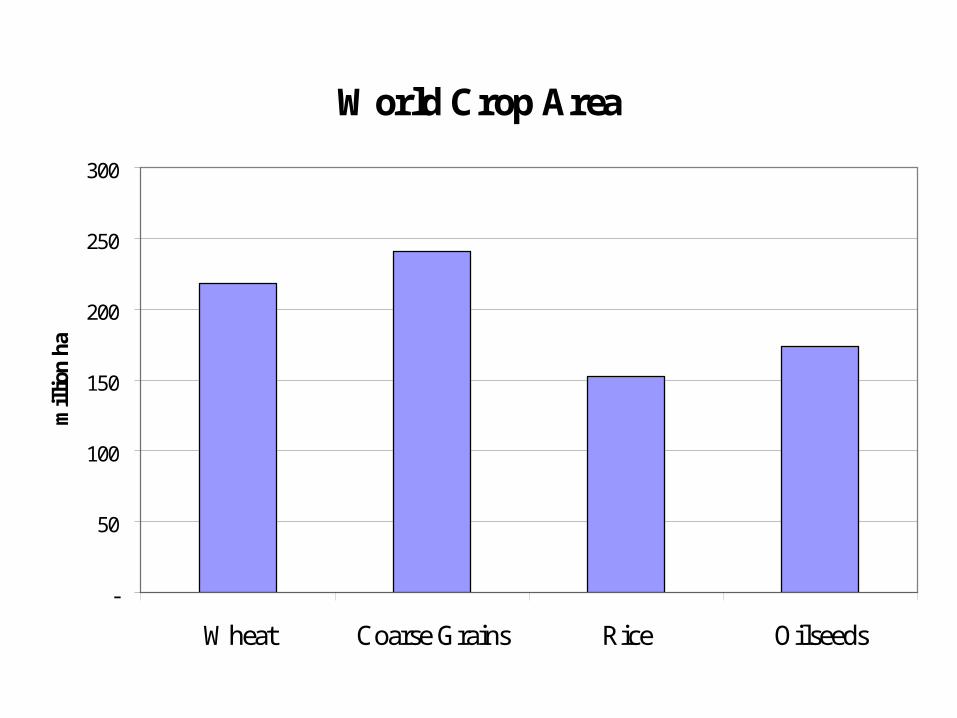
World Crop Area
-
50
100
150
200
250
300
Wheat Coarse Grains Rice Oilseeds
mil
lion
ha
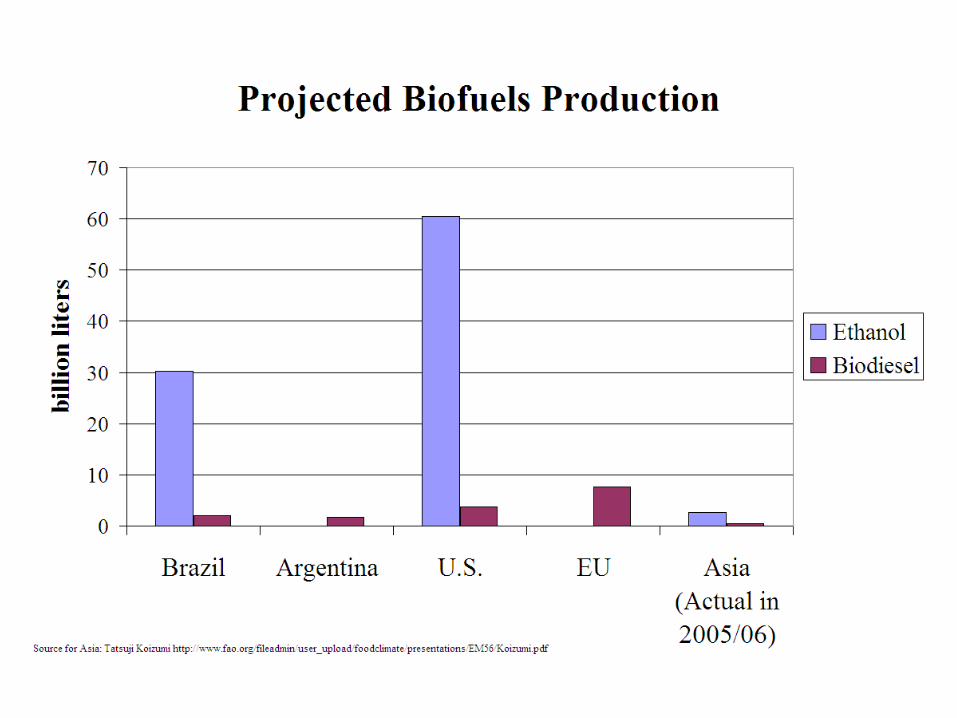
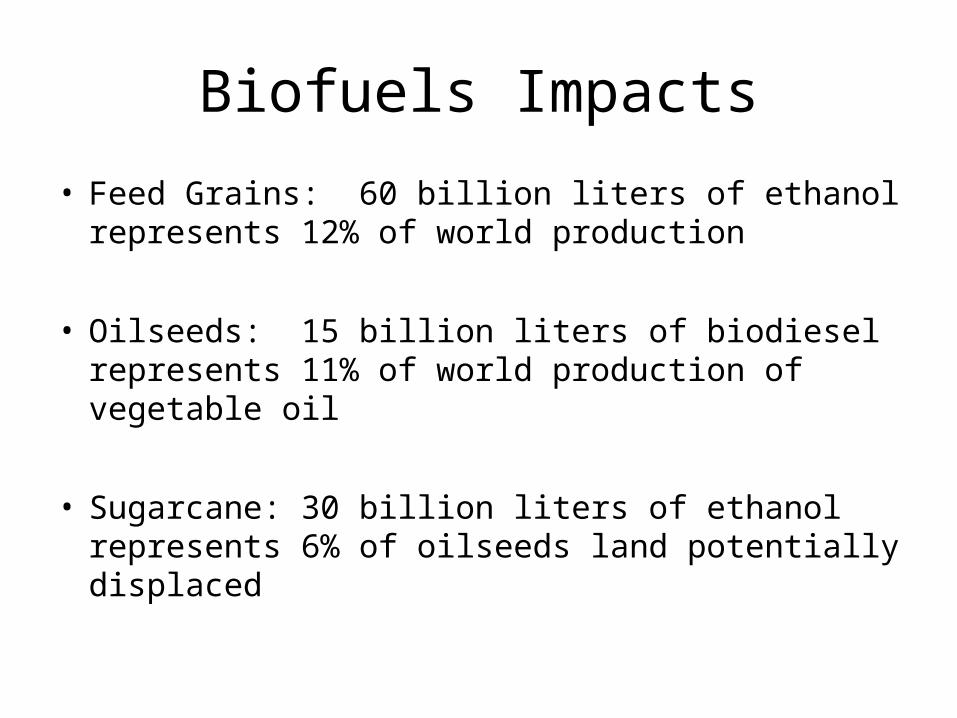
Biofuels Impacts
• Feed Grains: 60 billion liters of ethanol represents 12% of world production
• Oilseeds: 15 billion liters of biodiesel represents 11% of world production of vegetable oil
• Sugarcane: 30 billion liters of ethanol represents 6% of oilseeds land potentially displaced

Market Price Impacts
• Assuming no change in aggregate production– 17% reduction in available vegetable oil would
increase price by 84%
– 12% reduction in feed grain supplies would increase price by 60%
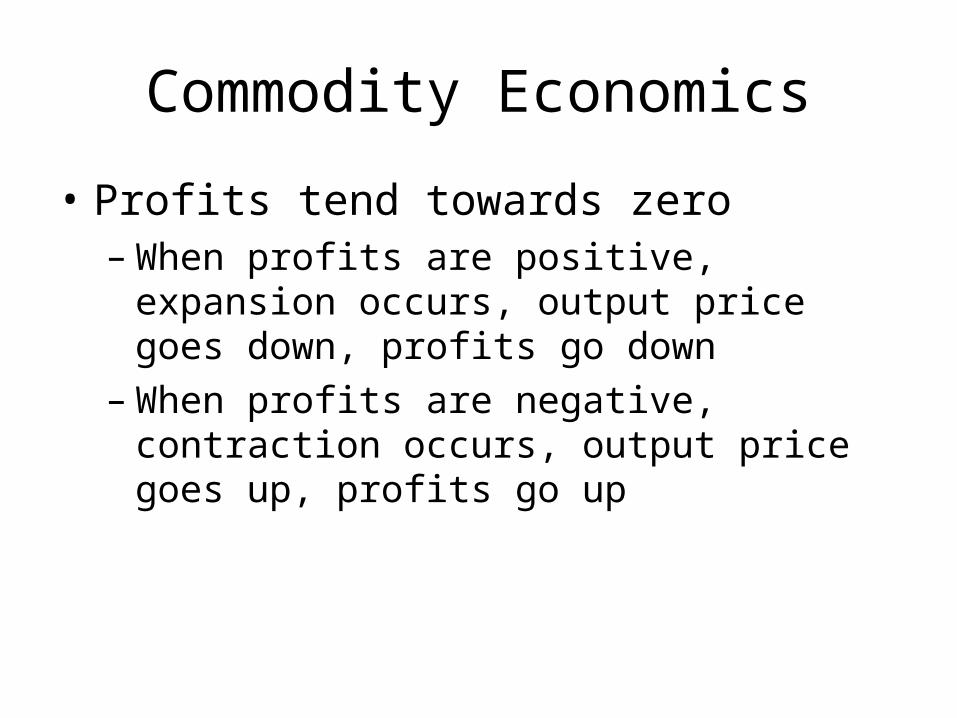
Commodity Economics
• Profits tend towards zero– When profits are positive, expansion occurs,
output price goes down, profits go down– When profits are negative, contraction occurs,
output price goes up, profits go up
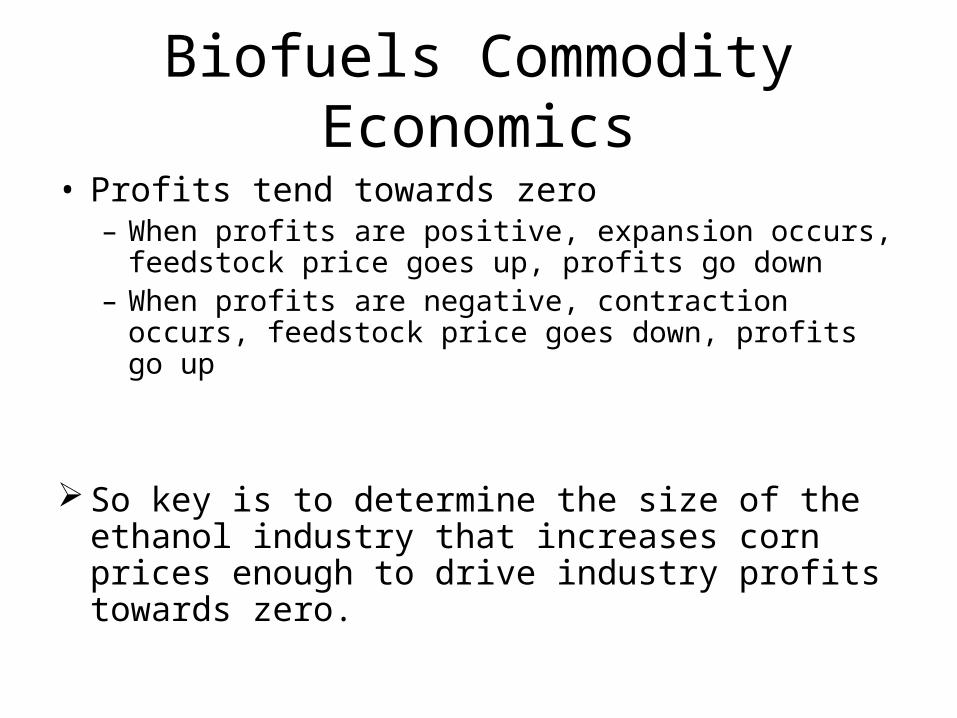
Biofuels Commodity Economics
• Profits tend towards zero– When profits are positive, expansion occurs,
feedstock price goes up, profits go down– When profits are negative, contraction occurs,
feedstock price goes down, profits go up
So key is to determine the size of the ethanol industry that increases corn prices enough to drive industry profits towards zero.

U.S. Corn Supply Curve
0.00
1.00
2.00
3.00
4.00
5.00
6.00
7.00
8.00
10,000 11,000 12,000 13,000 14,000 15,000 16,000
U.S. Corn Production million bushels)
$/b
u
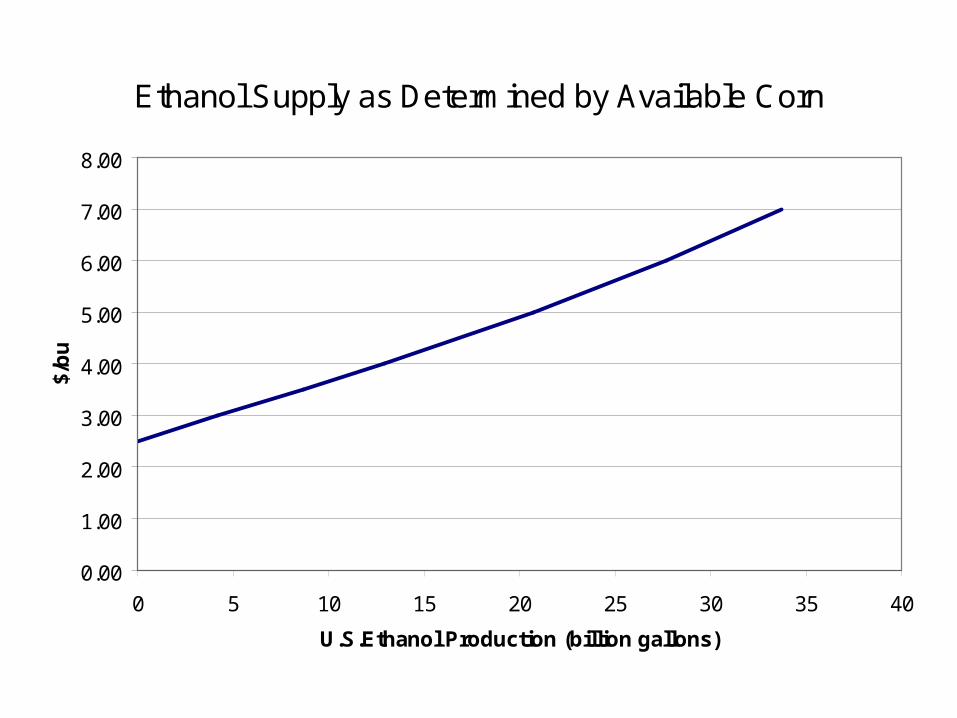
Ethanol Supply as Determined by Available Corn
0.00
1.00
2.00
3.00
4.00
5.00
6.00
7.00
8.00
0 5 10 15 20 25 30 35 40
U.S.Ethanol Production (billion gallons)
$/b
u
Demand for Ethanol
• Substitute for gasoline
• Octane enhancer
• Component in Clean Air Act fuels
• Fuel to meet state and federal RFS
• Fuel to meet low carbon fuel requirements
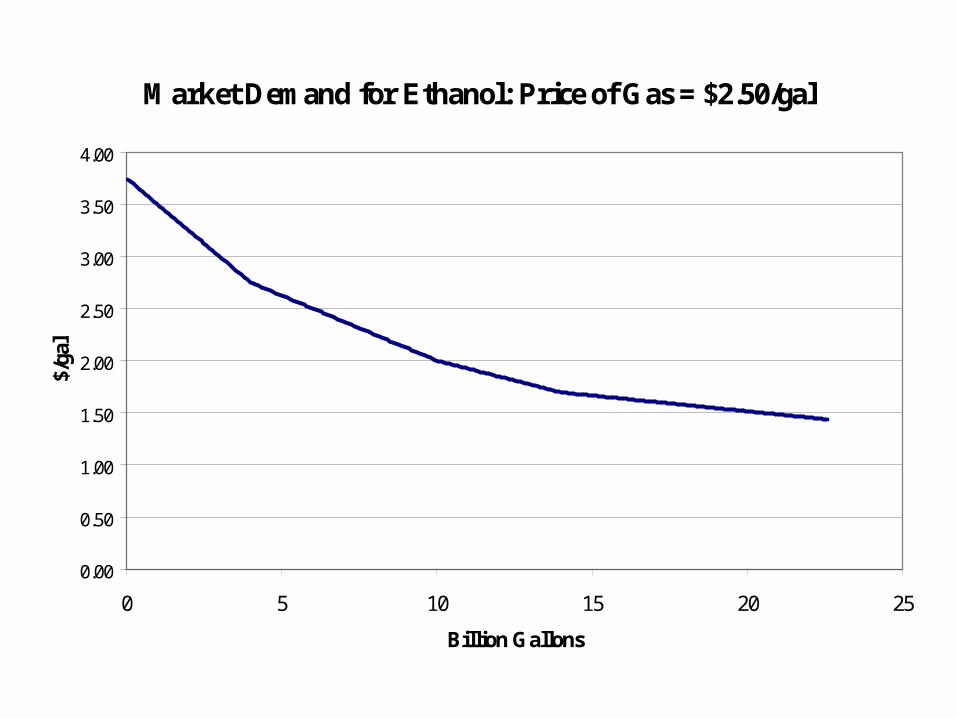
Market Demand for Ethanol: Price of Gas = $2.50/gal
0.00
0.50
1.00
1.50
2.00
2.50
3.00
3.50
4.00
0 5 10 15 20 25
Billion Gallons
$/ga
l
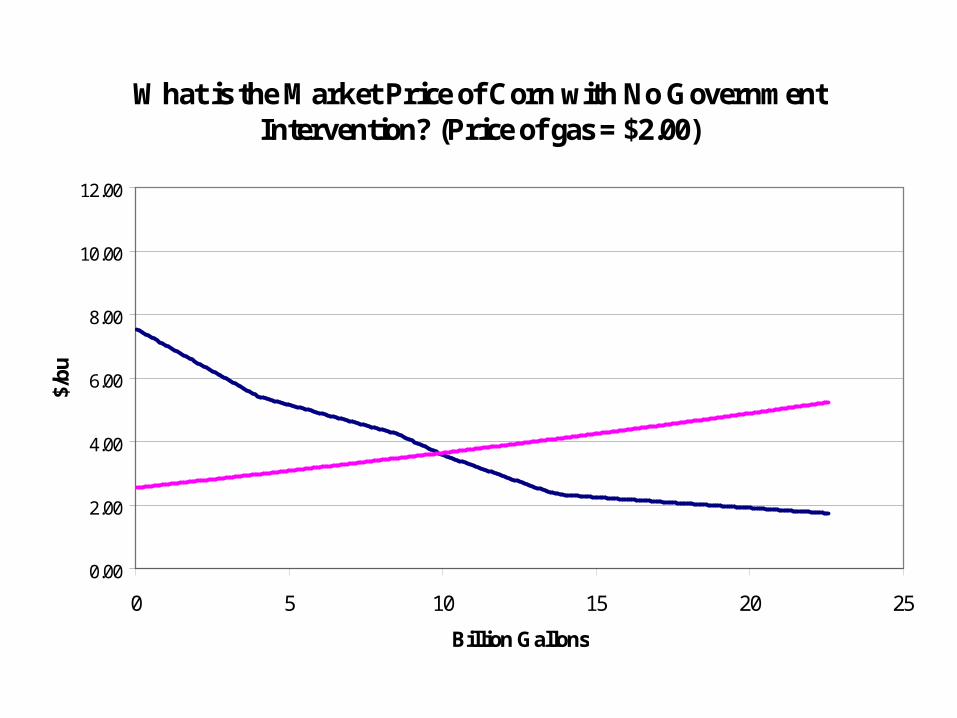
What is the Market Price of Corn with No Government Intervention? (Price of gas = $2.00)
0.00
2.00
4.00
6.00
8.00
10.00
12.00
0 5 10 15 20 25
Billion Gallons
$/b
u
Supply of Ethanol
Demand for Ethanol
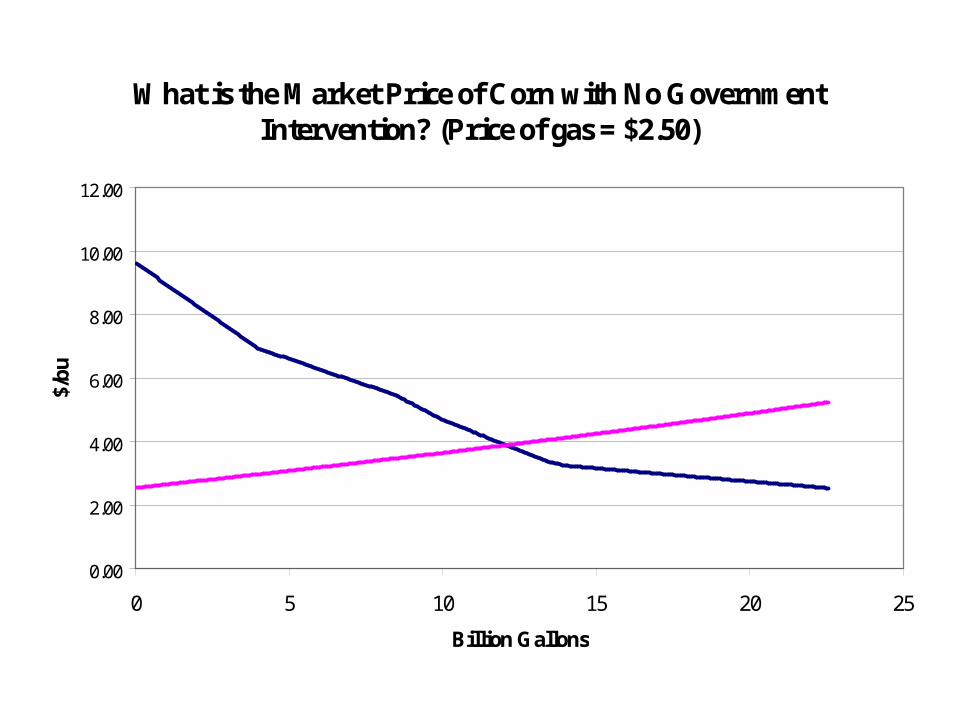
What is the Market Price of Corn with No Government Intervention? (Price of gas = $2.50)
0.00
2.00
4.00
6.00
8.00
10.00
12.00
0 5 10 15 20 25
Billion Gallons
$/b
u
Supply of Ethanol
Demand for Ethanol
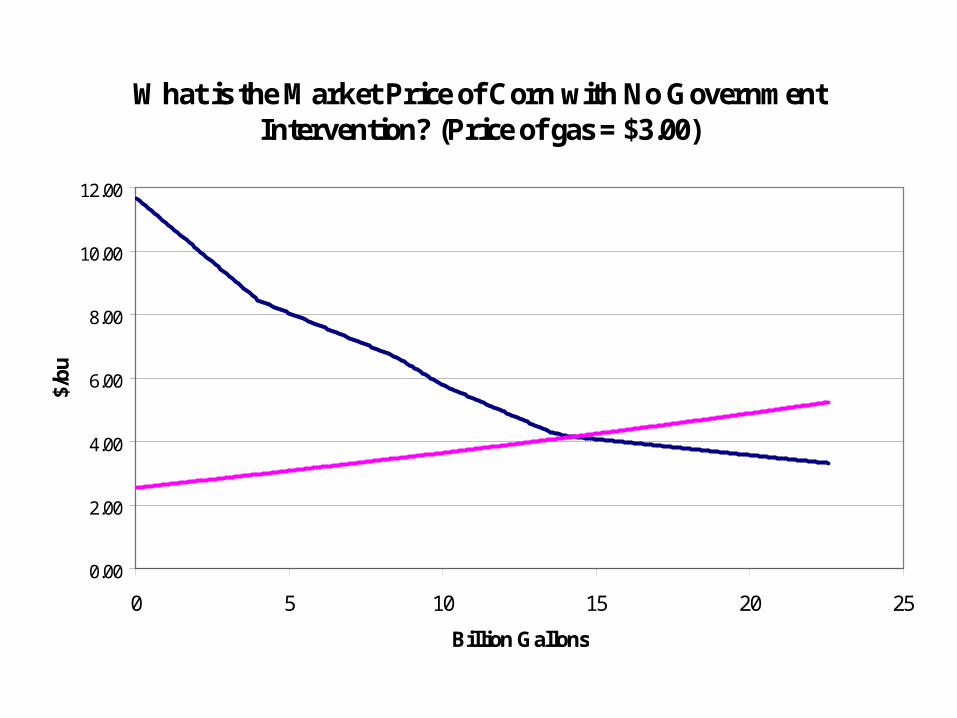
What is the Market Price of Corn with No Government Intervention? (Price of gas = $3.00)
0.00
2.00
4.00
6.00
8.00
10.00
12.00
0 5 10 15 20 25
Billion Gallons
$/b
u
Supply of Ethanol
Demand for Ethanol
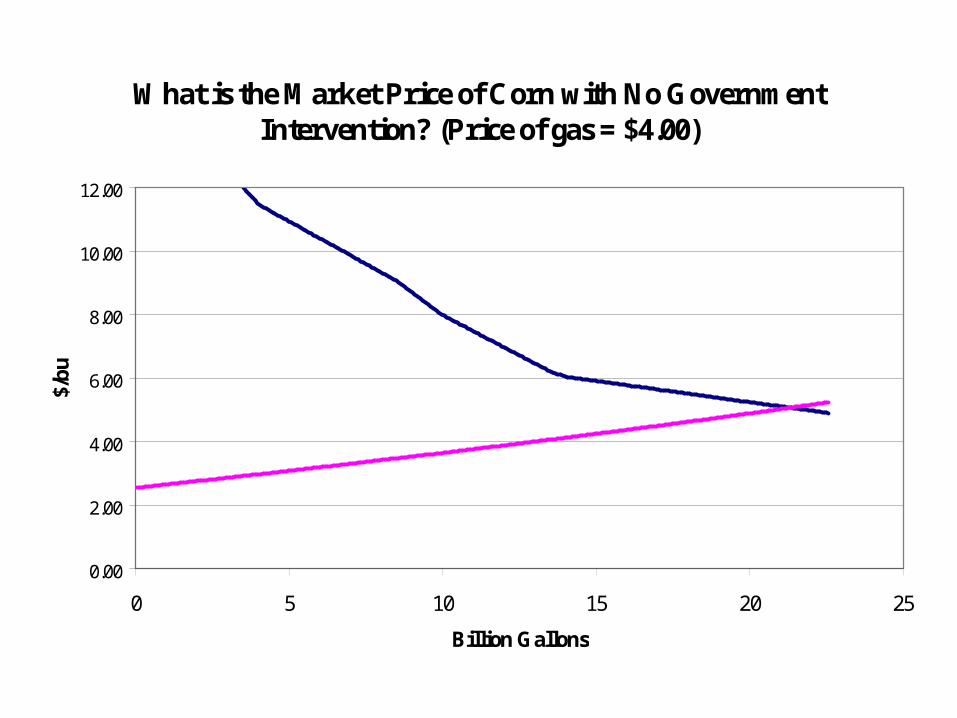
What is the Market Price of Corn with No Government Intervention? (Price of gas = $4.00)
0.00
2.00
4.00
6.00
8.00
10.00
12.00
0 5 10 15 20 25
Billion Gallons
$/b
u
Supply of Ethanol
Demand for Ethanol
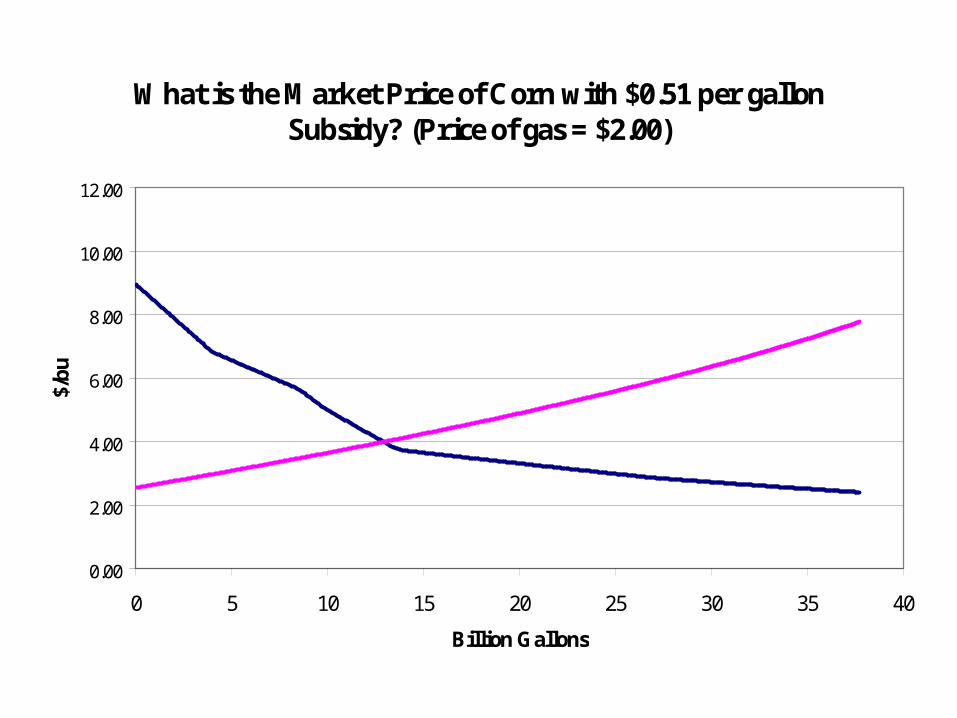
What is the Market Price of Corn with $0.51 per gallon Subsidy? (Price of gas = $2.00)
0.00
2.00
4.00
6.00
8.00
10.00
12.00
0 5 10 15 20 25 30 35 40
Billion Gallons
$/b
u
Supply of Ethanol
Demand for Ethanol
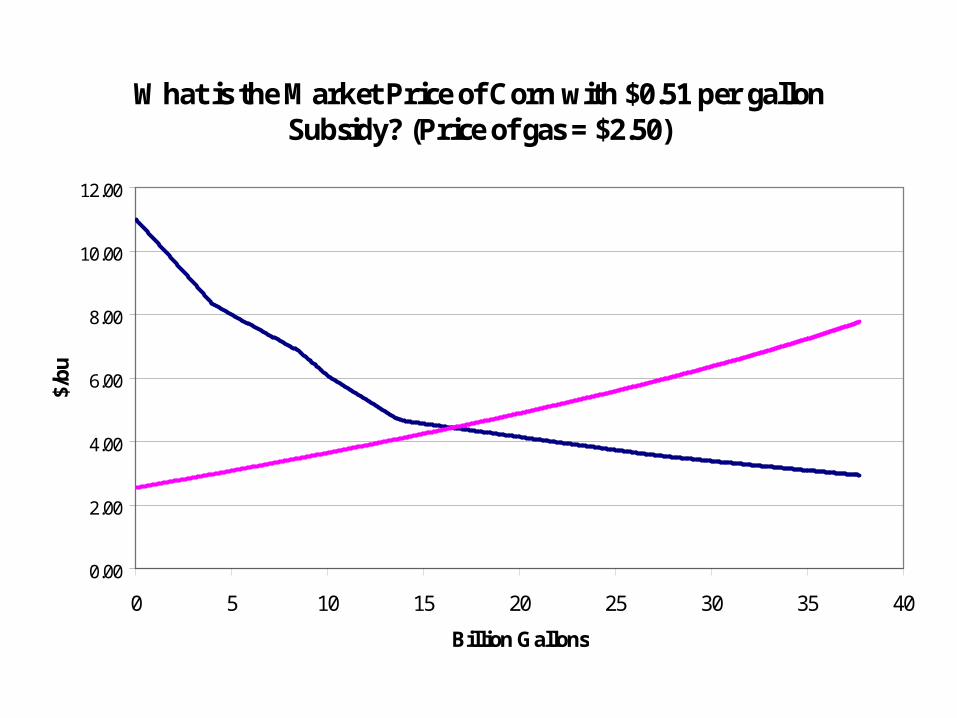
What is the Market Price of Corn with $0.51 per gallon Subsidy? (Price of gas = $2.50)
0.00
2.00
4.00
6.00
8.00
10.00
12.00
0 5 10 15 20 25 30 35 40
Billion Gallons
$/b
u
Supply of Ethanol
Demand for Ethanol
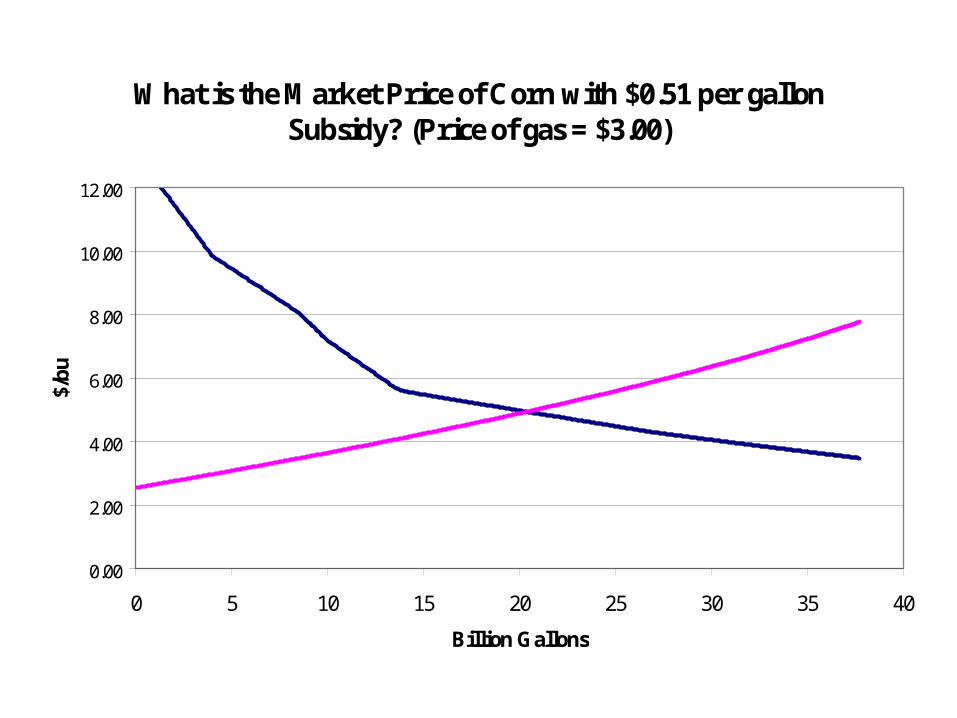
What is the Market Price of Corn with $0.51 per gallon Subsidy? (Price of gas = $3.00)
0.00
2.00
4.00
6.00
8.00
10.00
12.00
0 5 10 15 20 25 30 35 40
Billion Gallons
$/b
u
Supply of Ethanol
Demand for Ethanol
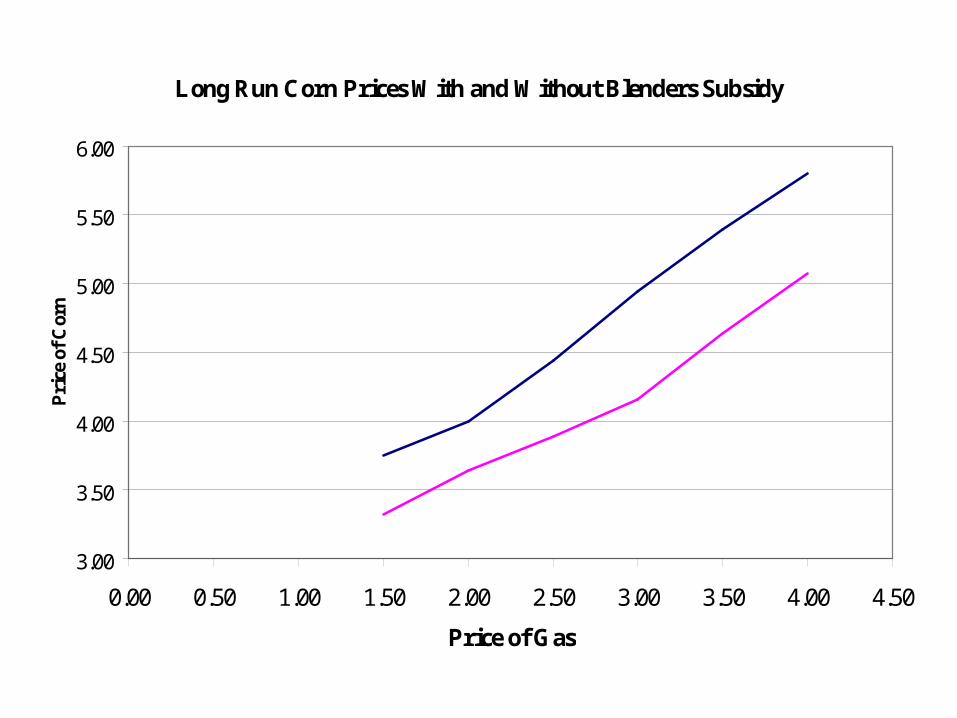
Long Run Corn Prices With and Without Blenders Subsidy
3.00
3.50
4.00
4.50
5.00
5.50
6.00
0.00 0.50 1.00 1.50 2.00 2.50 3.00 3.50 4.00 4.50
Price of Gas
Pri
ce o
f C
orn
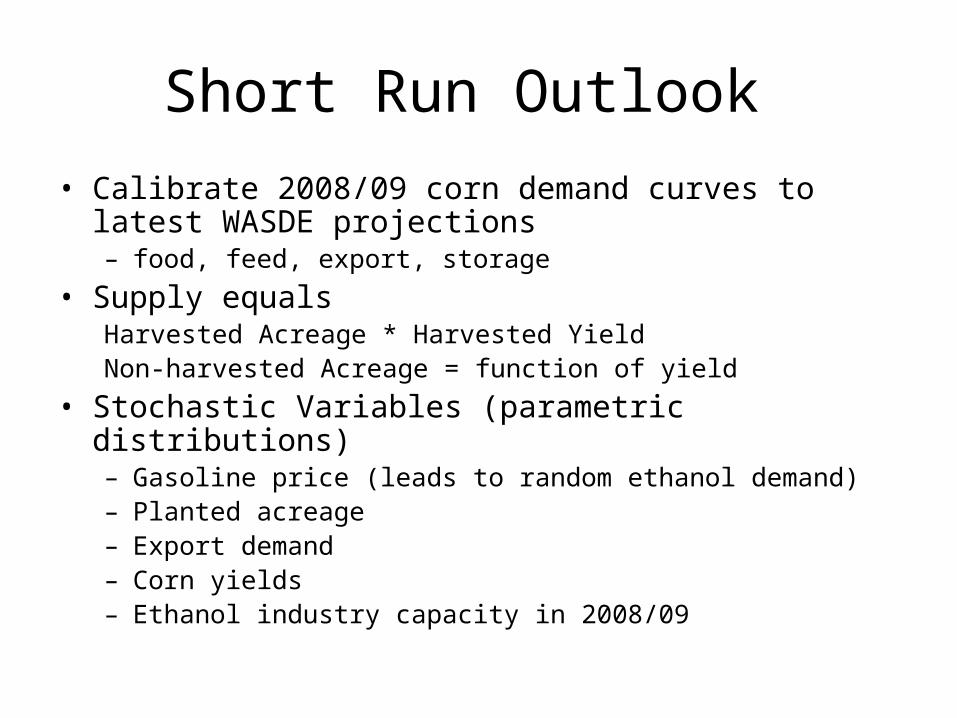
Short Run Outlook
• Calibrate 2008/09 corn demand curves to latest WASDE projections– food, feed, export, storage
• Supply equals Harvested Acreage * Harvested Yield Non-harvested Acreage = function of yield
• Stochastic Variables (parametric distributions)– Gasoline price (leads to random ethanol demand)– Planted acreage– Export demand– Corn yields– Ethanol industry capacity in 2008/09
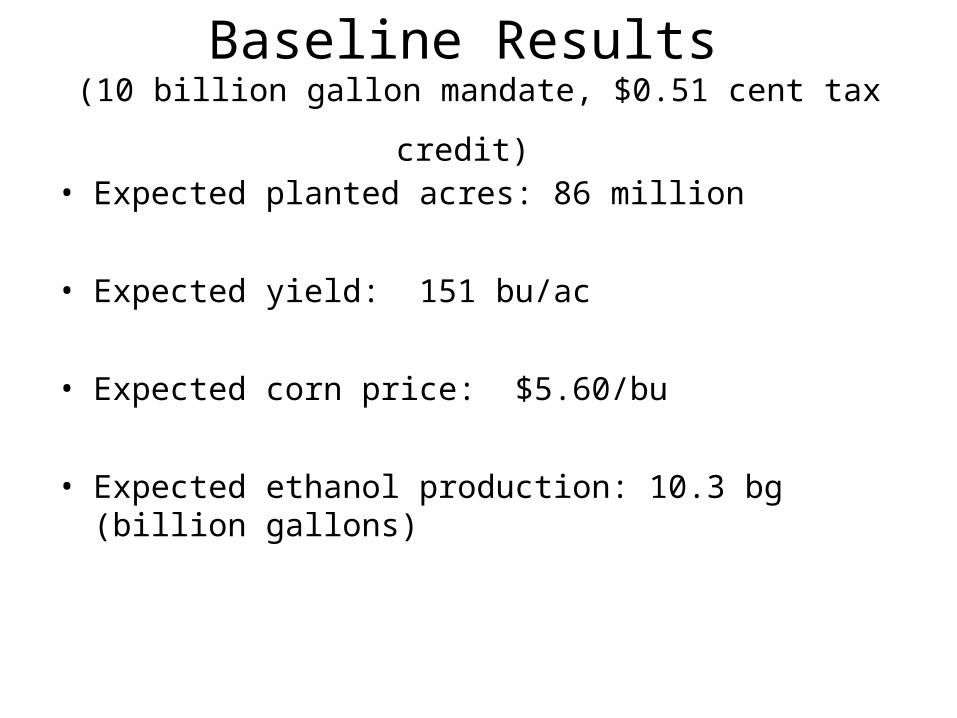
Baseline Results (10 billion gallon mandate, $0.51 cent tax credit)
• Expected planted acres: 86 million
• Expected yield: 151 bu/ac
• Expected corn price: $5.60/bu
• Expected ethanol production: 10.3 bg (billion gallons)
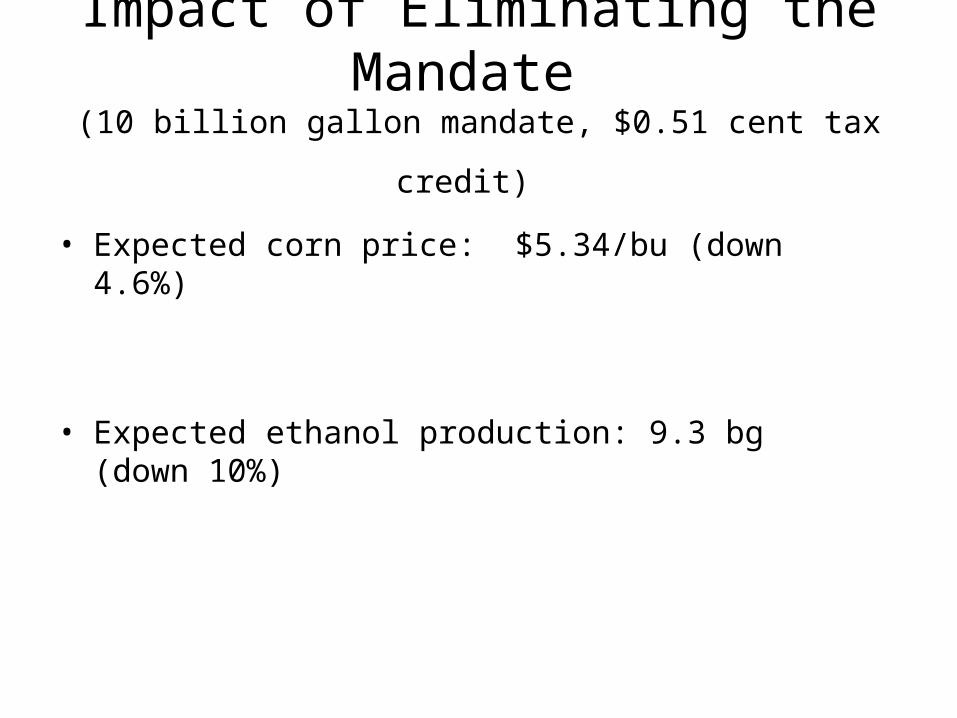
Impact of Eliminating the Mandate (10 billion gallon mandate, $0.51 cent tax credit)
• Expected corn price: $5.34/bu (down 4.6%)
• Expected ethanol production: 9.3 bg (down 10%)
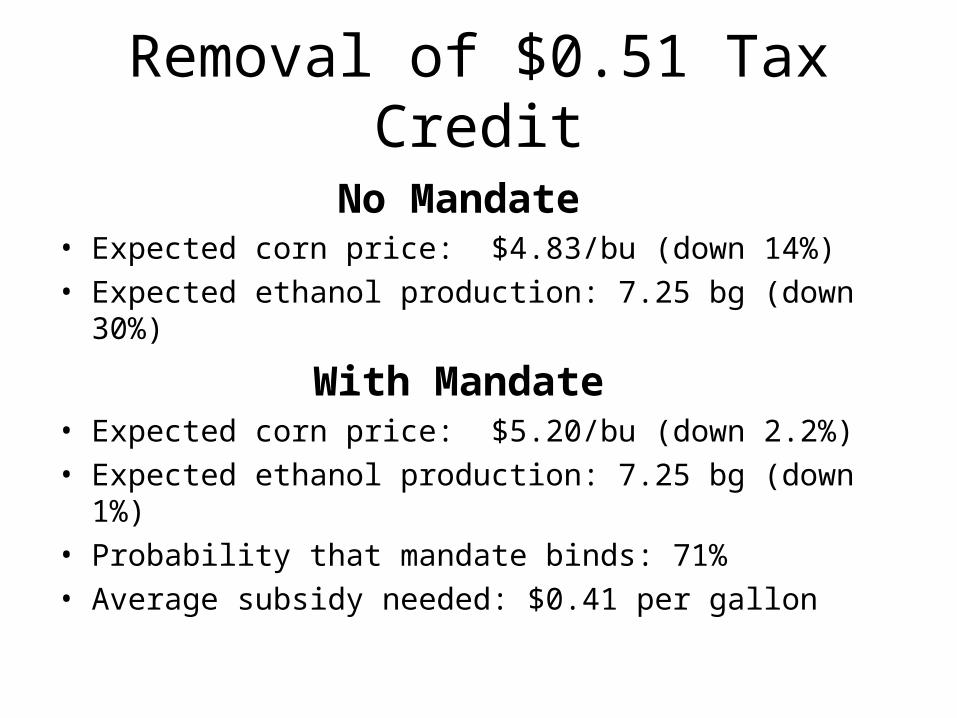
Removal of $0.51 Tax Credit
No Mandate• Expected corn price: $4.83/bu (down 14%)• Expected ethanol production: 7.25 bg (down 30%)
With Mandate• Expected corn price: $5.20/bu (down 2.2%)• Expected ethanol production: 7.25 bg (down 1%)• Probability that mandate binds: 71%• Average subsidy needed: $0.41 per gallon
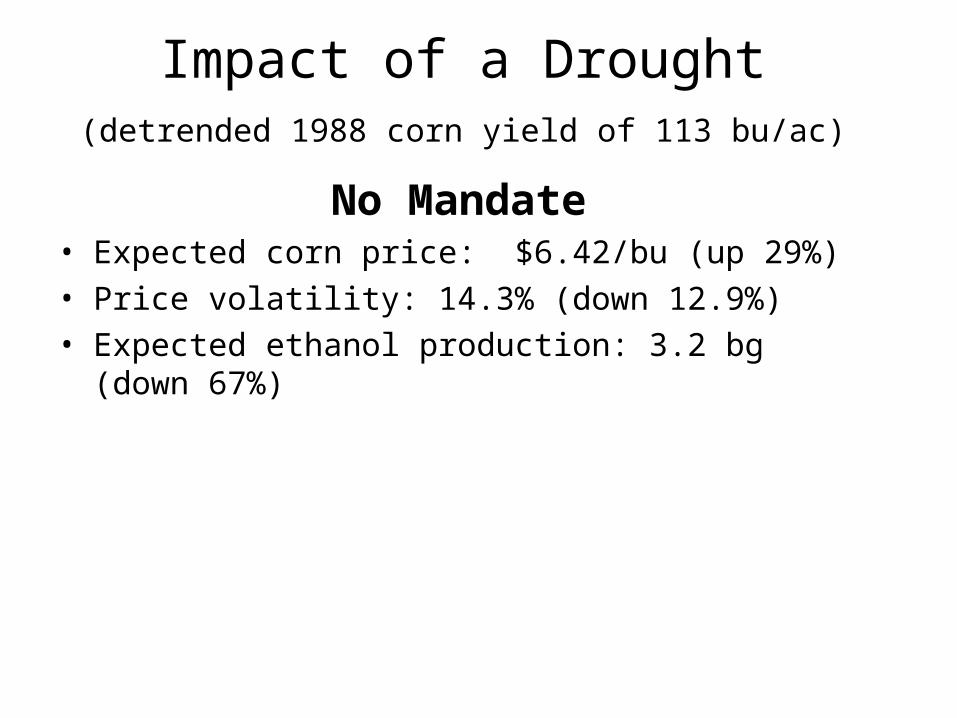
Impact of a Drought (detrended 1988 corn yield of 113 bu/ac)
No Mandate• Expected corn price: $6.42/bu (up 29%)• Price volatility: 14.3% (down 12.9%)• Expected ethanol production: 3.2 bg (down 67%)
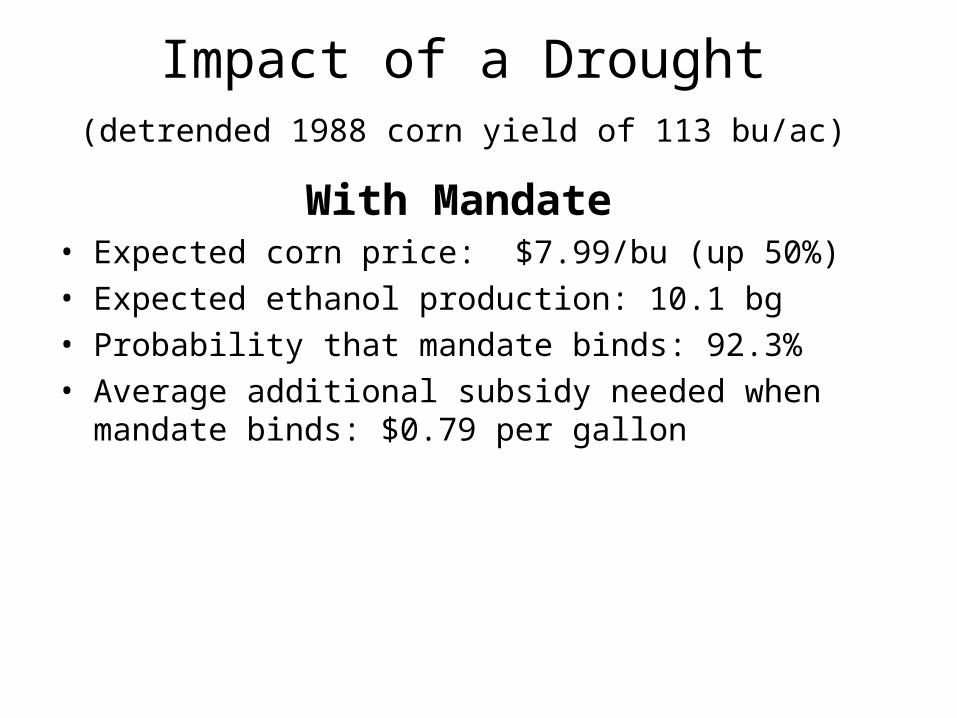
Impact of a Drought (detrended 1988 corn yield of 113 bu/ac)
With Mandate• Expected corn price: $7.99/bu (up 50%)• Expected ethanol production: 10.1 bg • Probability that mandate binds: 92.3%• Average additional subsidy needed when mandate
binds: $0.79 per gallon
Corn Ethanol Impacts
• Lowered gasoline prices

Reduction in Blended Fuel Prices from Increasing Annual Ethanol Volume by 10 Percent
0
1
2
3
4
5
6
7
8
9
May-1990 Jan-1993 Oct-1995 Jul-1998 Apr-2001 Jan-2004 Oct-2006 Jul-2009
cen
ts p
er g
allo
n
Corn Ethanol Accomplishments
• Lowered gasoline prices
• Opened infrastructure pathways to potential cellulosic biofuels
• Forced adjustments in North American livestock industry
• Made world realize that agricultural production should not be taken for granted


