Download - SMART GROWTH NOW - MWRA

Smart Growth and Our Commonwealth’s InfrastructureAndré LerouxMarch 25, 2009
• Unemployment• Foreclosures• Energy Costs• Public Debt
• Transportation• Water
• Economic Competitiveness• Climate Change
• Health Care• Education

SCARCITY
•Boston Society of Architects
•Citizens’ Housing and Planning Association (CHAPA)
•Conservation Law Foundation
•Environmental League of Massachusetts
•Fair Housing Center of Greater Boston
•MA Association of Community Development Corporations
•Metropolitan Area Planning Council
Founding Alliance Members
What We Do• The Massachusetts Smart Growth Alliance
promotes healthy and diverse communities, protects critical environmental resources and working landscapes, advocates for housing and transportation choices, and supports equitable community development and urban reinvestment. Blah blah blah blah Blah blah blah blah Blah blah blah blah Blah blah blah blah Blah blah blah blah

Connecting People to Place
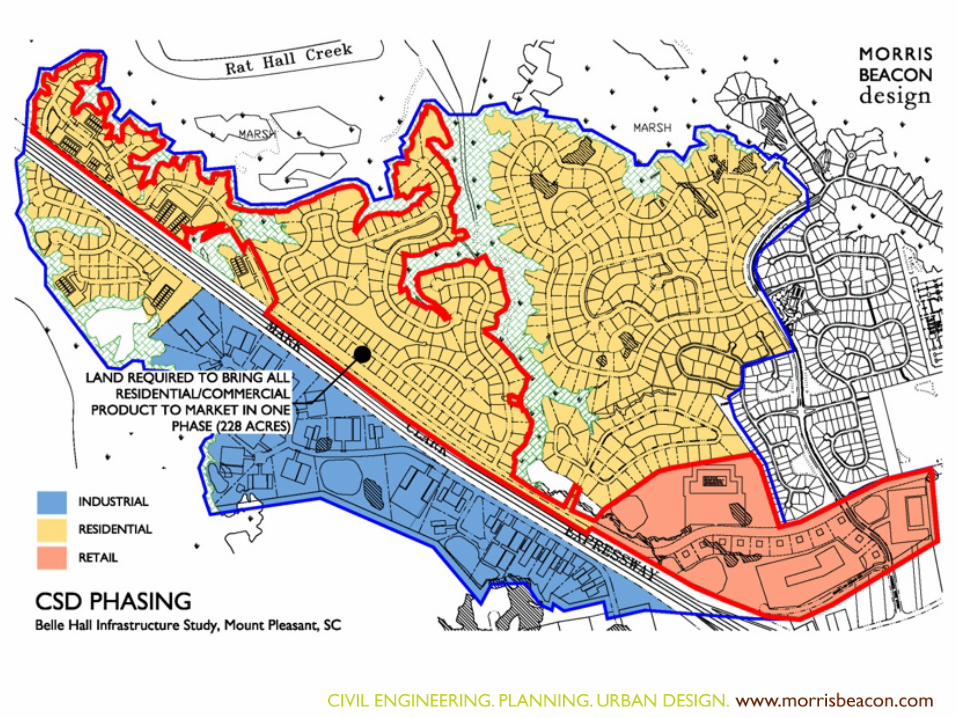


Phase I initial investmentACRES COST/ACRETOTAL COST
Belle Hall
TND: 34 $176,749 $6,010,000
Belle Hall
CSD: 228 $97,591 $22,250,000
Source: EPA White Paper: Risk Reduction through development and phasing strategies (working project). 2007
Phase I of the conventional scenario costs 270% more than the Phase I scenario of the TND

The Transect
Determinism & Top-Down Planning?
Smart Growth is democratic.
Smart Growth encourages participation.

• Focus Groups: 2001• Vision Report: November 2002• Trip to DC & Zoning Overlay
Campaign: 2003• North Canal Charrette: 2004• Alleyways and Canals: 2005• 40R District: 2006

Lawrence Alleyways
Photos courtesy of Lawrence CommunityWorks
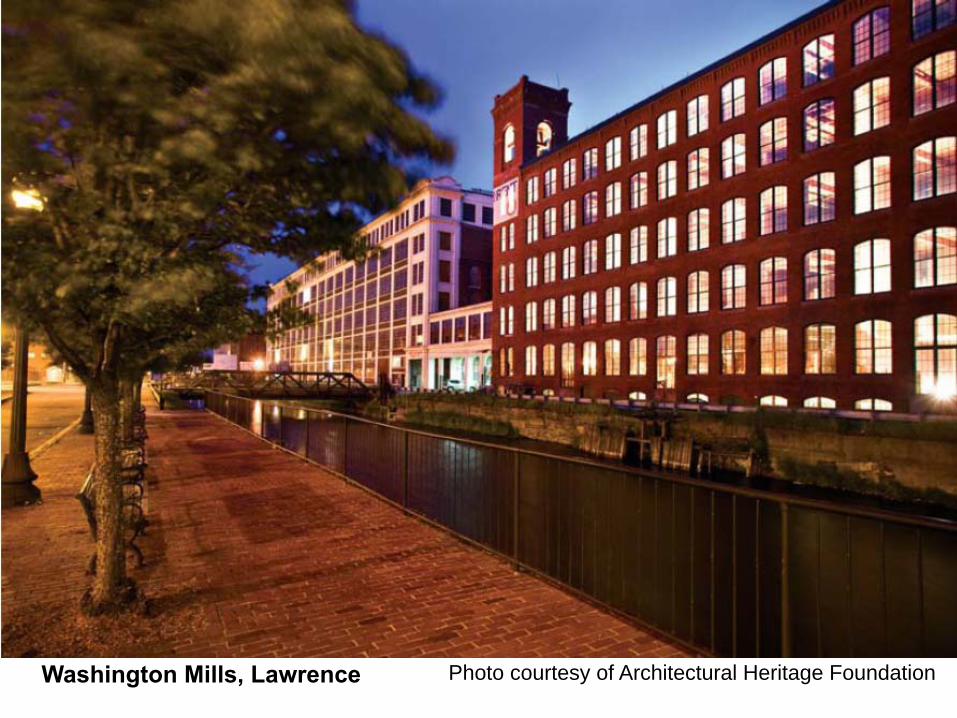
Washington Mills, Lawrence Photo courtesy of Architectural Heritage Foundation
Smart Growth promotes fairness and complete communities.It expands opportunity.
Living on a sphere, ‘Smart Growth’ is an oxymoron.
The choice is not between growth and no growth. It’s between managing growth intelligently or allowing it to proceed haphazardly.

Acres Developed per New Housing Unit
450,000 Units Added
Acres
Fewer Homes on Larger Lots
= Housing Shortage
Lots nearly twice as big:
acres developed / new unit
1986 - 2000
1970 - 1985
Acres282,000 Units Added

Zoning: 1 Unit Per Acre
Photo: Visualizing Density, Lincoln Land Institute
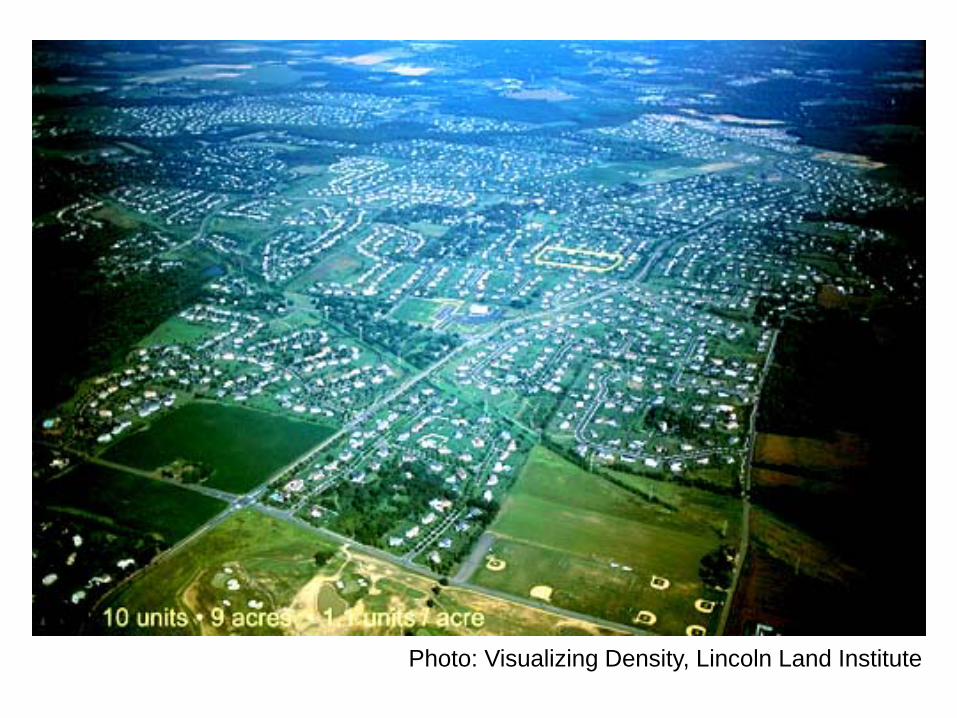
Photo: Visualizing Density, Lincoln Land Institute
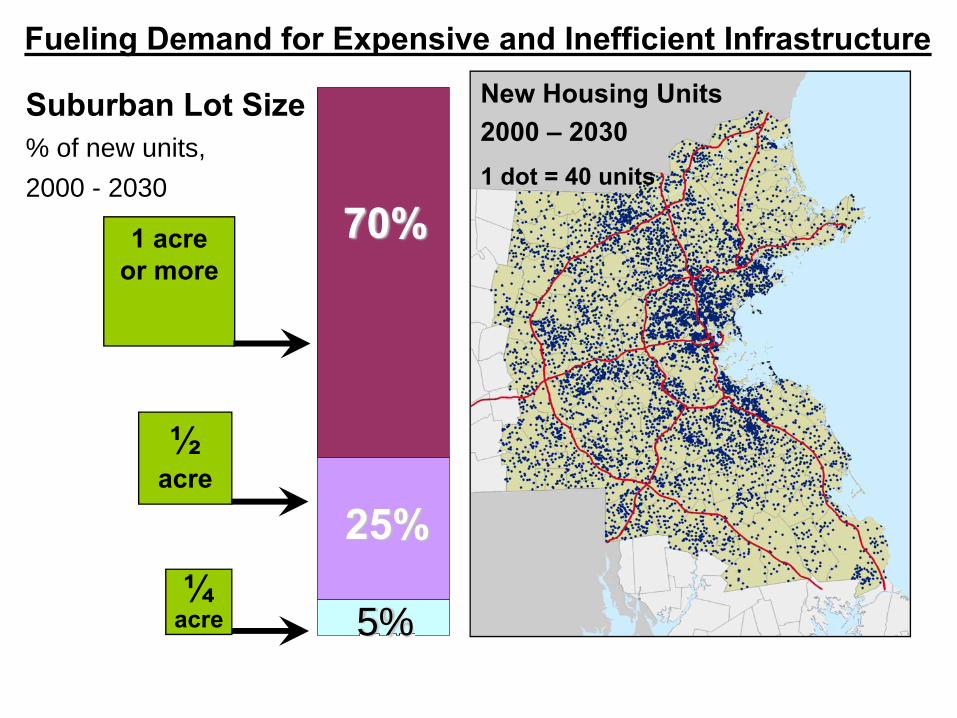
New Housing Units2000 – 20301 dot = 40 units
70%
25%
5%
1 acre or more
½ acre
¼ acre
Suburban Lot Size% of new units, 2000 - 2030
Fueling Demand for Expensive and Inefficient Infrastructure

Balancing regional needs versus local instincts.

<5%5 – 10%10 - 18%>18%
Populations of Color% by town, 2000Region = 18%
Barriers to Mobility
•Persistent segregation
•Inadequate homeownership
opportunities, especially for first-time
homebuyers and minorities

Natural Open Space Lost2000 – 2030
<100
100 - 1000>1000
Acres per town
Loss of Open Space= Degradation of Air and Water Quality, Loss of Landscape, Exacerbates Climate Change
•40 Acres per day statewide
•Metro Boston alone will lose 152,000 acres by 2030
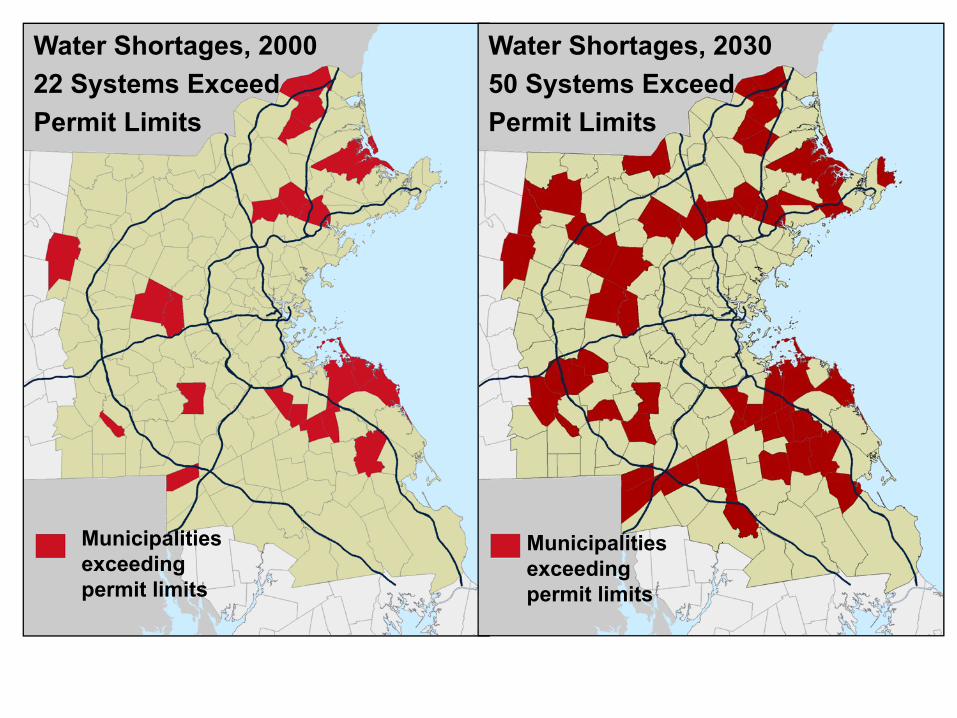
Water Shortages, 200022 Systems ExceedPermit Limits
Municipalities exceeding permit limits
Water Shortages, 203050 Systems ExceedPermit Limits
Municipalities exceeding permit limits

Traffic Congestion, 2030(% Capacity)
<25%25 – 50%50 – 75% 75 – 125%
Traffic Congestion, 2000(% Capacity)
<25%25 – 50%50 – 75%75 – 125%

Market demand for smart growth: It’s here and growing
• Consumer surveys show about one-third of the home buying market wants the smart growth product– Private sector reports (Robert Charles Lesser & Co.
Compiled 2007)– Regional/Metropolitan organizations preference
surveys (SMARTRAQ (Atlanta). 2006.)– Smart growth studies (SGA/NAR. 2004)
Homebuilder surveys (NAHB. 2002)– Academic research (Dowell Meyers. 2001)
Source: EPA White Paper: The Market for Smart Growth. Gregg Logan, Robert Charles Lesser & Co. 2007.


Housing supply by type & preference, 2025
Source: EPA White Paper: Where Will Everybody Live? Arthur C. “Chris” Nelson, Virginia Tech. 2007.
Type Supply – % (units) Preference – % (units) Gap (Units)Lg. Lot (>7k s/f) 54% (76 m) 25% (35 m) -22 mSm. Lot (<7k s/f) 21% (29 m) 37% (52 m) 30 mAttached 25% (35 m) 38% (53 m) 26 m
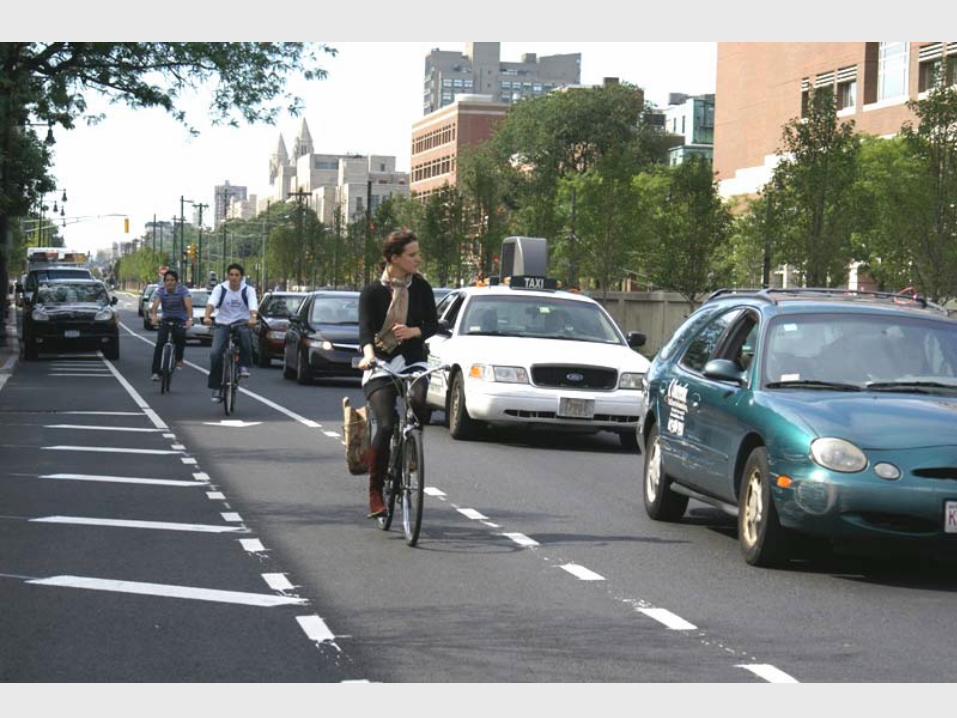

Transportation Crisis
• Turnpike carrying $2.2 B Big Dig debt
• MBTA facing $161M operating deficit

Systems Thinking• Mobility• Connectivity• Proximity
“Transportation choice” should be goal, along with clean and dependable service that runs often

SMART GROWTH MYTHS:•It’s “BIG.”
•It’s top-down.
•Design solves everything.
In Fact, smart growth can be:
•Decentralized.
•Democratic.
•Increase choice.
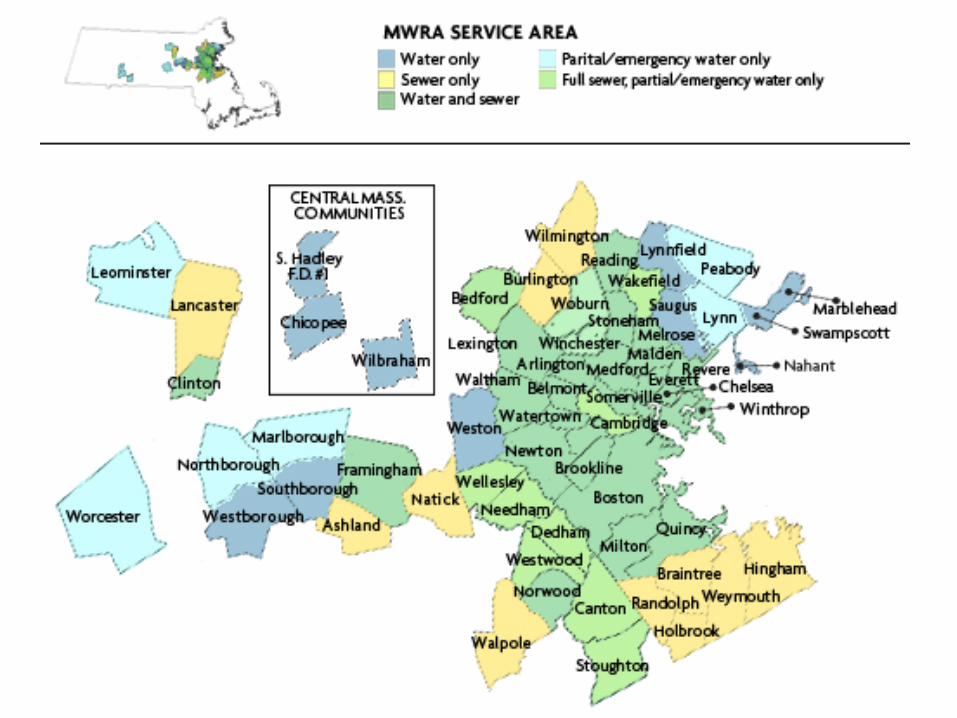

MWRA Expansion Rationale

Furthermore:• MWRA contends that they are
seeing a 3 mgd decrease in demand every year
• Spilled more than they sold last year

MWRA Proposal for 36 mgd excess:1. Sell 12 mgd2. Increase releases
• 6 mgd Swift• 6 mgd Nashua
3. Keep last 12 mgd in reserve


MWRA Accepts Smart Growth Criteria if:
• It is not an unduly prohibitive barrier to entry for municipalities
• There is administrative capacity to evaluate and implement the criteria


Two ParadigmsInfrastructure provision vs. systems model
• MWRA:– Water quality– Volume of flows– Price– Facilities, etc.
• Alliance:– Infrastructure management concerns important, but also:– Articulate local, regional and state land-use objectives– Ensure that state capital investments are consistent with
sustainable development goals, coordinated among agencies, and are mutually reinforcing
– What kind of communities do we want?

1. Elevate the Issue• Convene a Water Resources Summit. EEA
should convene a summit that includes senior-level representatives of all relevant state, municipal, and non-government interested parties. The goal of this summit should be to build on the 2004 Water Policy Task Force effort and produce a set of recommendations, including any necessary statutory measures, that can be acted upon to put the Commonwealth onto a path of long-term sustainable water resources management.
• Engage more stakeholders.

2. Grow Smart• Fostering smart growth is crucial to sustainably
managing our water resources. Smart growth communities are compact and pedestrian-friendly, and offer a mix of uses as well as housing and transportation choices. Smart growth communities are significantly less taxing on our water resources than conventional development. Important smart growth strategies include encouraging low-impact development (LID) techniques, zoning reform, and an aggressive program for repairing old and leaky infrastructure, while not funding infrastructure that supports sprawling development.
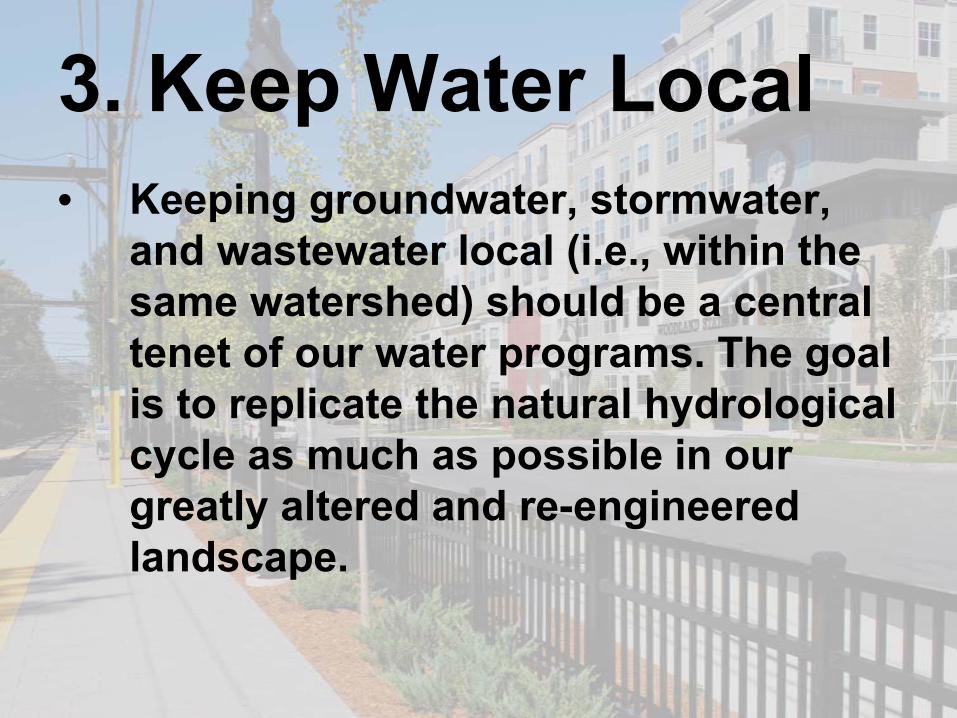
3. Keep Water Local• Keeping groundwater, stormwater,
and wastewater local (i.e., within the same watershed) should be a central tenet of our water programs. The goal is to replicate the natural hydrological cycle as much as possible in our greatly altered and re-engineered landscape.

4. Conserve and Reuse• The Commonwealth has the ability through a
number of programs to require and/or encourage communities to conserve and reuse water. In some communities, water usage doubles in the summer because of lawn watering. This dramatic increase in non-essential water use leaves less water for essential uses and for maintaining healthy streamflows in our rivers, and it hinders economic development. State policies and programs should focus on both incentives and regulations to reduce the most inefficient aspects of water use.

5. Govern Effectively• The staffing of the Commonwealth’s water
resource agencies should be consolidated or at a minimum better coordinated, funding must be increased, important research and technical work must be completed to develop watershed-specific standards for streamflow, and greater effort must be undertaken to work collaboratively with the Legislature, municipalities and other stakeholders.
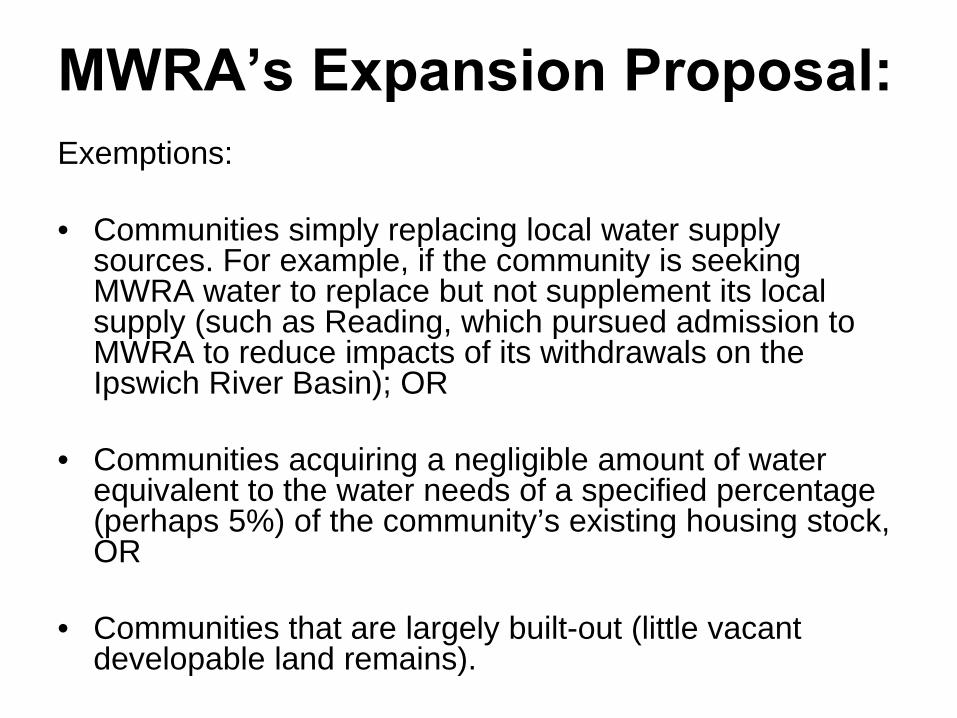
MWRA’s Expansion Proposal:Exemptions:
• Communities simply replacing local water supply sources. For example, if the community is seeking MWRA water to replace but not supplement its local supply (such as Reading, which pursued admission to MWRA to reduce impacts of its withdrawals on the Ipswich River Basin); OR
• Communities acquiring a negligible amount of water equivalent to the water needs of a specified percentage (perhaps 5%) of the community’s existing housing stock, OR
• Communities that are largely built-out (little vacant developable land remains).

The Menu Approach:1. Require density benchmarks for new
growth and monitor municipal performance on an annual basis.
2. Implement a zoning based system with compact development districts combined with OSRD requirements.
3. MWRA determination of consistency with the Commonwealth’s Sustainable Development Principles.

Suggested Criteria by MA Smart Growth Alliance:• Is there a section(s) of the municipality’s proposed water
service area (PWSA) zoned for dense development? For housing development, density in excess of the the Chapter 40R densities for multi-family (20 units per acre), single-family (8 units per acre), and 2- and 3-family housing (12 units per acre) is presumptively sufficient.
• If so, is mixed use development allowed?
• If residential is a permitted use in the section(s) designated for dense development, is multi-family housing allowed?
• Does the municipality have the ability to discharge additional wastewater from new development in the section(s) zoned for dense development?
• Are there impediments to dense development in this section(s), such as excessive frontage, setback or parking requirements?

Suggested Criteria (Cont.)• Does the community have transit-oriented development and/or multi-
mode transportation options?• Are there sections of the PWSA zoned for low-density commercial
development?• If a section(s) of the PWSA is zoned for single-family housing, is
cluster zoning mandated or encouraged (through by-right development or a density bonus)?
• Is low-impact development to increase water recharge a requirement for new developments and redevelopment in the municipality?
• Has the town implemented the 2006 Massachusetts Water Conservation Standards?
• Other factors relating to whether the municipality’s rules and practices are consistent with the Commonwealth’s Sustainable Development Principles, Executive Order 385, and the EEA Water Policy. These include:
– whether supplying MWRA water will effectively relieve pressure on a highly stressed watershed
– is the town seeking to have the MWRA water satisfy the town’s increased summer demand principally due to lawn watering
– is the community discharging wastewater out of basin, and if so, has it implemented inflow and infiltration measures
– does the town have a water reuse program

A New Paradigm• Encourages local water infiltration
and treatment• Adoption of LID practices• Zoning reform and changes• Foster innovation

Example: Spot SeweringSudbury Project w/CWRA:
• Allow for village multi-use density zones serviced by a limited size, groundwater discharge, wastewater treatment plant.
• By limiting the size, sewerage is only provided to the zone, and by employing smart growth techniques like transfer of development rights, growth can be accommodated while village open space character is preserved.
• Additionally, treating and disposing of wastewater in the subwatershed of origin protects the natural water cycle by increasing groundwater recharge and replenishing and sustaining drinking water sources.
• Groundwater discharge also increases treatment options for the removal of pharmaceuticals and personal hygiene products from the waste stream.


Connecting People to Place


