
1
BIBLIOMETRIC ASSESSMENT OF RESEARCH ACTIVITIES
RELATED TO MICROPLASTICS MARINE POLLUTION
BIBLIOMETRIC MAPPING – WHY AND HOW: A MICROPLASTICS PILOT
In addition to the comprehensive mapping of the existing marine research and programs relevant to
JPI Oceans by WP3 and the resource demanding analysis of CSA Oceans' consultation questionnaires
by WP3,4,5,6), there is a need for more targeted, flexible, and less resource consuming mapping
methods.
Bibliometry provides one such tool, and should be used in conjunction with other mapping methods.
Thus, a limited bibliometric study with relevance to the Microplastics Pilot Action was performed. It
gives a good illustration of the usefulness of this tool for CSA Oceans and JPI Oceans when exploring
new fields and evaluating potential new activities. It is also a tool for monitoring and evaluation of
research fields, activities and actors.
BACKGROUND
According to the Description of Work (DOW page 6) for CSA Oceans, "the overall aim of work
package 1 (WP1) is to deliver a coherent draft Strategic Research and Innovation Agenda,
Implementation Plan, Joint Activities ..". Among the specific objectives of [WP1] are to: "Provide
guidance to the mapping and gap analysis activities (WP3, 4, 5, 6) to ensure CSA Oceans collects
information through an appropriate process that is relevant for the JPI Oceans SRIA and
Implementation Plan" and "Develop procedures for continuous mapping after the end of the CSA
Oceans project, based on the experience and best practices gathered in the mapping and gap
Contribution to CSA Oceans by WP1;
The JPI Oceans being broad and addressing cross-cutting issues, will furthermore require the support of specific tools for mapping and gap analysis in defined areas: Baseline setting, continuous monitoring and mapping of researchers, institutions and collaborative networks. "In partnership with the European Commission bibliometric studies will be tabled to support this process." (DOW Part B page 19)

2
analyses (WP3, 4, 5, 6). The overall strategy of CSA Oceans is to complete a number of strategic
actions and come up with concrete deliverables, which will strengthen the foundation and provide
significant momentum for the successful development of the JPI Oceans (DOW Part B page 17).
Likewise mapping and gap analysis will be conducted rationally, thus where questionnaires will be
developed this will be done in cooperation amongst the WPs to cover all needs. Moreover, "the JPI
Oceans being broad and addressing cross-cutting issues will require support of specific tools to quality
and provide baselines for gaps where it is expected that JPI Oceans can add value. In partnership [and
dialogue] with the European Commission bibliometric studies will be tabled to support this process."
(DOW Part B page 19).
WP3 will conduct a comprehensive mapping and analysis of the existing marine research
investments, strategies and programs relevant to JPI Oceans' needs and objectives. Input from the
broad consultations performed by WP3,4,5,6 will be analysed, constituting a comprehensive basis for
the work toward the Strategic Research and Innovation Agenda (SRIA).
The bibliometric study described in this report is an example of one alternative "more targeted,
flexible, and less resource consuming mapping methods"
INDEX
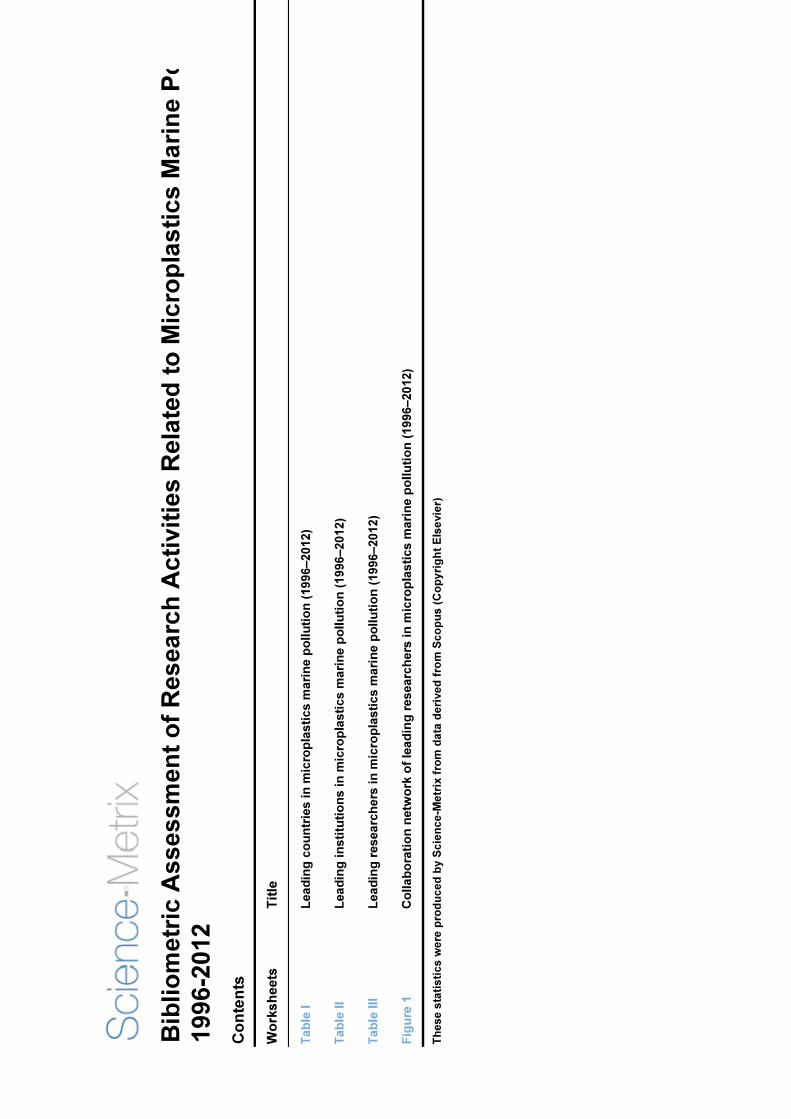
1. "Bibliometric assessment of Research Activities Related to Microplastics Marine Pollution"
Power point slide report by Science-Metrix:
2. Data sheets

1
BIBLIOMETRIC ASSESSMENT OF RESEARCH ACTIVITIES RELATED TO
MICROPLASTICS MARINE POLLUTION
Presentation to: JPI Oceans| February 5th, 2014
2
Introduction
Science-Metrix was mandated by JPI Oceans to provide bibliometric data in thefield of microplastics marine pollution for the 1996-2012 period.
Given that preliminary search yielded very few publications on the topic in thedatabase, this study constitute more of a “scoping exercise” than a full-fledgebibliometric study.
Publishing trends at the world level and for leading countries are presented in thisproject. Leading institutions and researchers over the global period are alsopresented. Other indicators on specialization and scientific impact are includedwhere needed, and a collaboration network between leading researcherscompletes this analysis.

2
3
Methods
Bibliometric data have been produced using the metadata from 24 million scientificpapers published between 1996 and 2012 and indexed in Scopus (Elsevier).
Identification of papers related to microplastics marine pollution: A query thatsearches for specific combinations of keywords within titles, keywords andabstracts has been employed. A primary “plastic” term has been combined with asecondary term. Example of primary “plastic” terms are: microplastic, microscopicplastic, plastic particle, plastic pellet, etc... Secondary terms include ocean, sea,pollution, marine environment, toxicity etc… Those terms were selected through avalidation process which consisted in taking a random sample of the selectedarticles and reading the abstract to see if the article was relevant to microplasticsmarine pollution. If a keyword or a combination of keywords yielded false results itwas discarded. Optimal keywords were selected by repeating this process for everynew keywords or combinations of keywords.
4
Methods (cont’d)
Specialization index (SI): Measures the intensity of research of an entity (e.g.,country, institution) in a given field relative to the intensity of the world in thesame field. It is calculated as follow:
SI = % of the entity papers in microplastic / % of world papers in microplastic
Average of relative citations (ARC): Indicates the observed scientific impact ofresearch conducted by an entity (e.g., country, institution) based on the averagenumber of citations its papers received relative to the average number of citationsreceived by world papers. Citation counts are normalized to account for differentcitation patterns across fields of science.
ARC > 1 The entity’s research is more cited than the average world research
ARC < 1 The entity’s research is less cited than the average world research
Average of relative impact factors (ARIF): Similar to the ARC, but indicates theexpected scientific impact of research conducted by an entity based on the impactfactor of the journals in which its papers are published.

3
5
Methods (cont’d)
Important note on impact scores
Given the small number of papers involved in the following analysis, impact scoresare prone to fluctuation since extreme values can highly impact the averages in thecomputation of the ARC and ARIF.
Usually, Science-Metrix does not compute impact scores for entities with less than30 papers having valid relative citations scores (RC) or relative impact factor scores(RIF), but applying this limitation for this study would have resulted in most entitiesnot having any impact scores presented at all.
Consequently, ARC and ARIF scores are included in the analysis even for entitieswith less than 30 papers with relative impact scores (RCs or RIFs), but in thesecases the ARCs and ARIFs are formatted using a light gray font. The readers shouldbe careful in using/interpreting the following results as most scores would not havebeen computed normally.
6
Methods (cont’d)
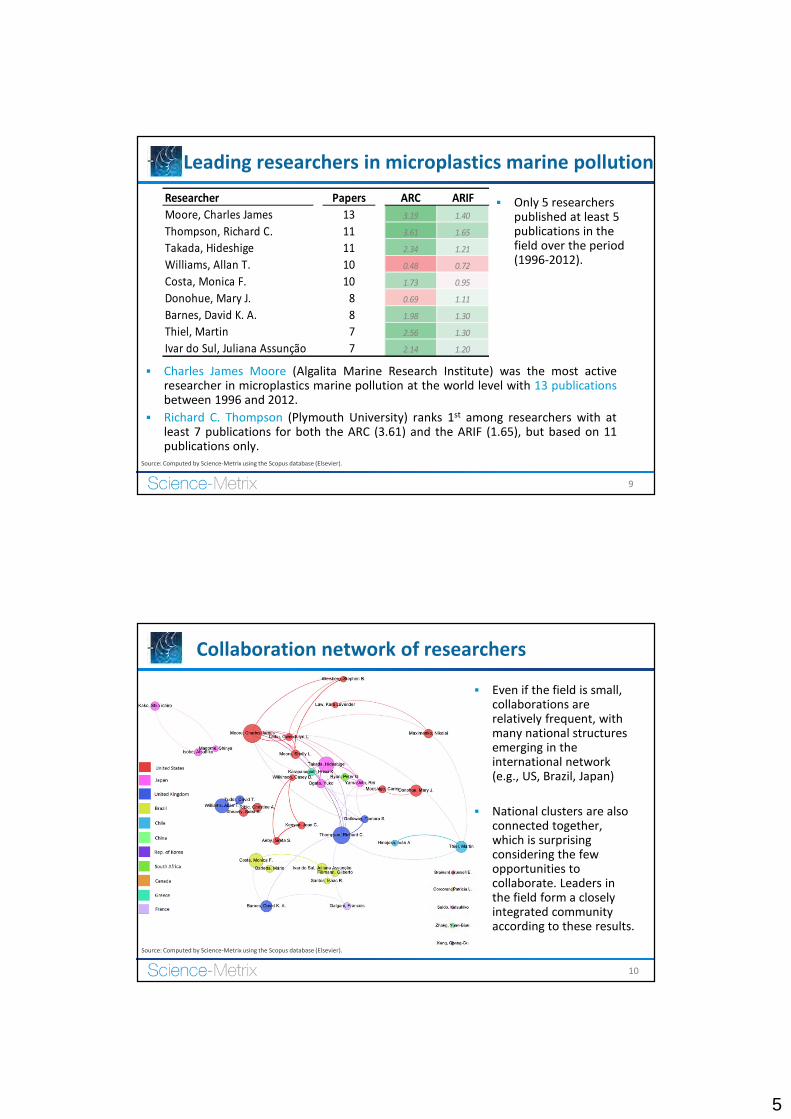
Collaboration network of leading researchers
The node size is proportional to the researcher’s output (varies from 4 to 13 papers).
Each link represent collaborations between two researchers.
The width of links is proportional to the number of collaborations (varies from 1 to 5collaborations).
The color of the nodes represents the country in which all or the majority of aresearcher’s output has been produced.
4
7
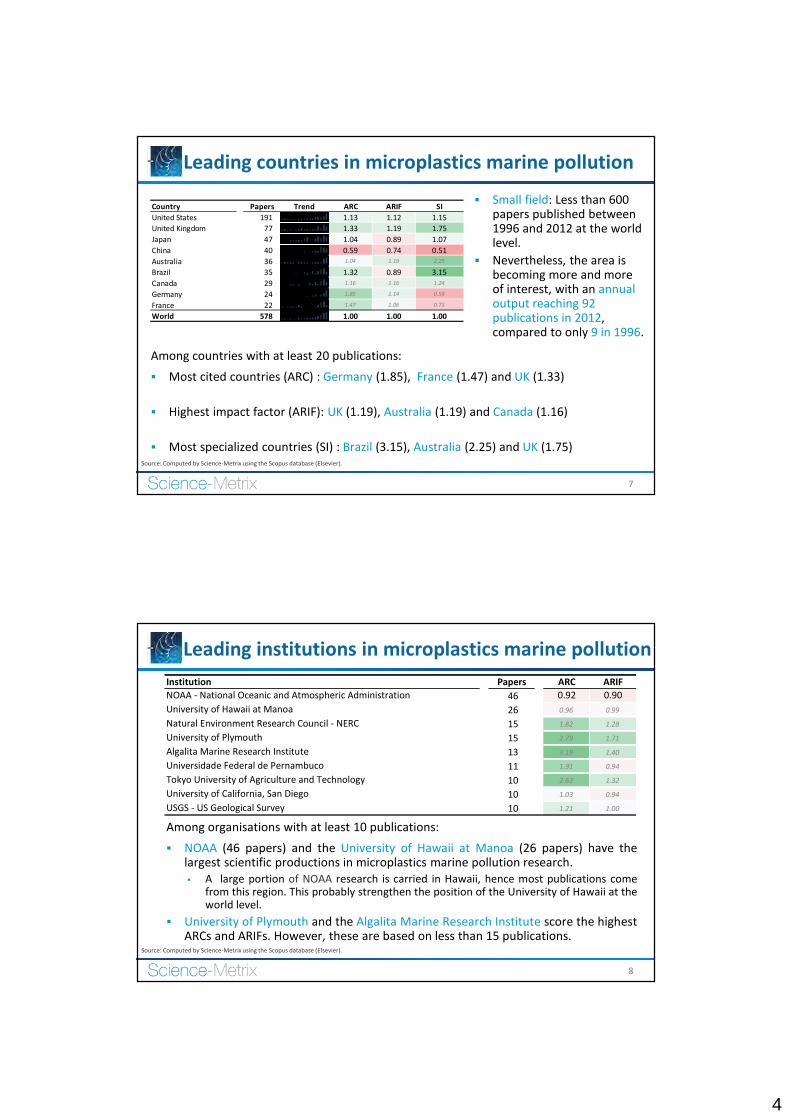
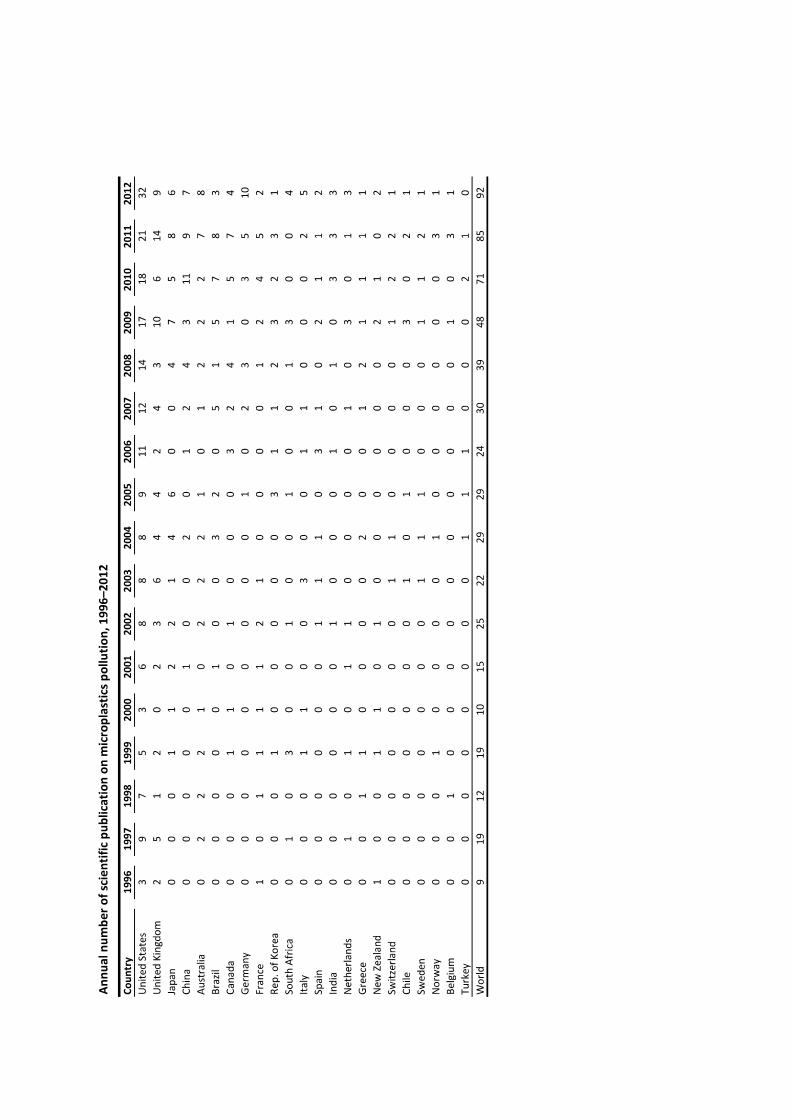
Leading countries in microplastics marine pollution
Among countries with at least 20 publications:
Most cited countries (ARC) : Germany (1.85), France (1.47) and UK (1.33)
Highest impact factor (ARIF): UK (1.19), Australia (1.19) and Canada (1.16)
Most specialized countries (SI) : Brazil (3.15), Australia (2.25) and UK (1.75)
Small field: Less than 600papers published between1996 and 2012 at the worldlevel.
Nevertheless, the area isbecoming more and moreof interest, with an annualoutput reaching 92publications in 2012,compared to only 9 in 1996.
Source: Computed by Science-Metrix using the Scopus database (Elsevier).
Country Papers Trend ARC ARIF SI
United States 191 1.13 1.12 1.15
United Kingdom 77 1.33 1.19 1.75
Japan 47 1.04 0.89 1.07
China 40 0.59 0.74 0.51
Australia 36 1.04 1.19 2.25
Brazil 35 1.32 0.89 3.15
Canada 29 1.16 1.16 1.24
Germany 24 1.85 1.14 0.58
France 22 1.47 1.06 0.73
World 578 1.00 1.00 1.00
8
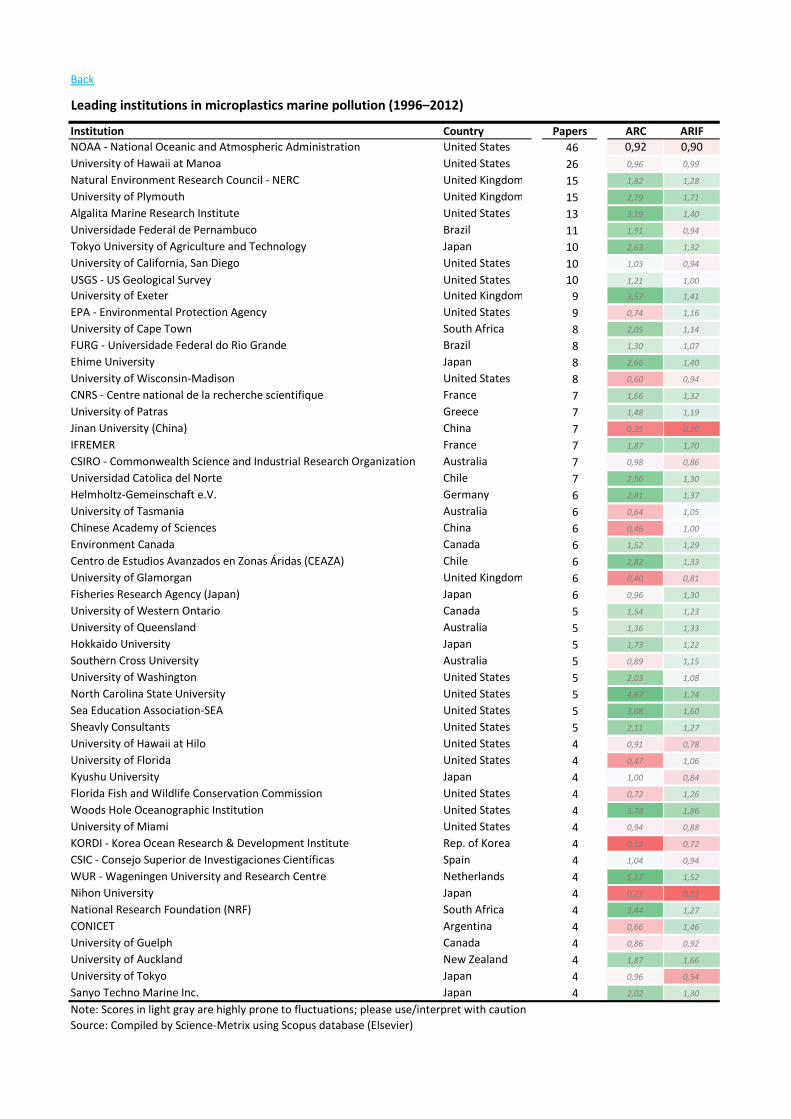
Leading institutions in microplastics marine pollution
Among organisations with at least 10 publications:
NOAA (46 papers) and the University of Hawaii at Manoa (26 papers) have thelargest scientific productions in microplastics marine pollution research. A large portion of NOAA research is carried in Hawaii, hence most publications come
from this region. This probably strengthen the position of the University of Hawaii at theworld level.
University of Plymouth and the Algalita Marine Research Institute score the highestARCs and ARIFs. However, these are based on less than 15 publications.
Source: Computed by Science-Metrix using the Scopus database (Elsevier).
Institution Papers ARC ARIF
NOAA - National Oceanic and Atmospheric Administration 46 0.92 0.90
University of Hawaii at Manoa 26 0.96 0.99
Natural Environment Research Council - NERC 15 1.82 1.28
University of Plymouth 15 2.79 1.71
Algalita Marine Research Institute 13 3.19 1.40
Universidade Federal de Pernambuco 11 1.91 0.94
Tokyo University of Agriculture and Technology 10 2.63 1.32
University of California, San Diego 10 1.03 0.94
USGS - US Geological Survey 10 1.21 1.00
5
9
Leading researchers in microplastics marine pollution
Charles James Moore (Algalita Marine Research Institute) was the most activeresearcher in microplastics marine pollution at the world level with 13 publicationsbetween 1996 and 2012.
Richard C. Thompson (Plymouth University) ranks 1st among researchers with atleast 7 publications for both the ARC (3.61) and the ARIF (1.65), but based on 11publications only.
Source: Computed by Science-Metrix using the Scopus database (Elsevier).
Only 5 researcherspublished at least 5publications in thefield over the period(1996-2012).
Researcher Papers ARC ARIF
Moore, Charles James 13 3.19 1.40
Thompson, Richard C. 11 3.61 1.65
Takada, Hideshige 11 2.34 1.21
Williams, Allan T. 10 0.48 0.72
Costa, Monica F. 10 1.73 0.95
Donohue, Mary J. 8 0.69 1.11
Barnes, David K. A. 8 1.98 1.30
Thiel, Martin 7 2.56 1.30
Ivar do Sul, Juliana Assunção 7 2.14 1.20
10
Collaboration network of researchers
Even if the field is small,collaborations arerelatively frequent, withmany national structuresemerging in theinternational network(e.g., US, Brazil, Japan)
National clusters are alsoconnected together,which is surprisingconsidering the fewopportunities tocollaborate. Leaders inthe field form a closelyintegrated communityaccording to these results.
Source: Computed by Science-Metrix using the Scopus database (Elsevier).
6
11
Contact Information
Grégoire Côté
Vice-President, Bibliometrics
Science-Metrix
E-mail: [email protected]
Telephone : 514-495-6505 ext. 115
www.science-metrix.com
Bastien St-Louis Lalonde
Analyst, Bibliometrics
Science-Metrix
E-mail: [email protected]
Telephone : 514-495-6505 ext. 136

Back
L eadinginstitutionsinm icroplasticsm arinepollution(1996– 2012)
Institution Country P apers A R C A R IF
N O AA -N ationalO ceanicandAtm osphericAdm inistration U nitedS tates 46 0,92 0,90
U niversity ofHaw aiiatM anoa U nitedS tates 26 0,96 0,99
N aturalEnvironm entR esearchCouncil-N ER C U nitedKingdom 15 1,82 1,28
U niversity ofP lym outh U nitedKingdom 15 2,79 1,71
AlgalitaM arineR esearchInstitute U nitedS tates 13 3,19 1,40
U niversidadeFederaldeP ernam buco Brazil 11 1,91 0,94
T okyoU niversity ofAgricultureandT echnology Japan 10 2,63 1,32
U niversity ofCalifornia,S anDiego U nitedS tates 10 1,03 0,94
U S GS -U S GeologicalS urvey U nitedS tates 10 1,21 1,00
U niversity ofExeter U nitedKingdom 9 3,57 1,41
EP A -Environm entalP rotectionAgency U nitedS tates 9 0,74 1,16
U niversity ofCapeT ow n S outhAfrica 8 2,05 1,14
FU R G -U niversidadeFederaldoR ioGrande Brazil 8 1,30 1,07
Ehim eU niversity Japan 8 2,66 1,40
U niversity ofW isconsin-M adison U nitedS tates 8 0,60 0,94
CN R S -Centrenationaldelarecherchescientifique France 7 1,66 1,32
U niversity ofP atras Greece 7 1,48 1,19
JinanU niversity (China) China 7 0,35 0,20
IFR EM ER France 7 1,87 1,70
CS IR O -Com m onw ealthS cienceandIndustrialR esearchO rganization Australia 7 0,98 0,86
U niversidadCatolicadelN orte Chile 7 2,56 1,30
Helm holtz-Gem einschafte.V. Germ any 6 2,81 1,37
U niversity ofT asm ania Australia 6 0,64 1,05
ChineseAcadem y ofS ciences China 6 0,46 1,00
Environm entCanada Canada 6 1,52 1,29
CentrodeEstudiosAvanzadosenZonasÁridas(CEAZA) Chile 6 2,82 1,33
U niversity ofGlam organ U nitedKingdom 6 0,40 0,81
FisheriesR esearchAgency (Japan) Japan 6 0,96 1,30
U niversity ofW esternO ntario Canada 5 1,54 1,23
U niversity ofQ ueensland Australia 5 1,36 1,33
HokkaidoU niversity Japan 5 1,73 1,22
S outhernCrossU niversity Australia 5 0,89 1,15
U niversity ofW ashington U nitedS tates 5 2,03 1,08
N orthCarolinaS tateU niversity U nitedS tates 5 4,67 1,74
S eaEducationAssociation-S EA U nitedS tates 5 3,08 1,60
S heavly Consultants U nitedS tates 5 2,11 1,27
U niversity ofHaw aiiatHilo U nitedS tates 4 0,91 0,78
U niversity ofFlorida U nitedS tates 4 0,47 1,06
Kyushu U niversity Japan 4 1,00 0,84
FloridaFishandW ildlifeConservationCom m ission U nitedS tates 4 0,72 1,26
W oodsHoleO ceanographicInstitution U nitedS tates 4 3,78 1,86
U niversity ofM iam i U nitedS tates 4 0,94 0,88
KO R DI-KoreaO ceanR esearch& Developm entInstitute R ep.ofKorea 4 0,12 0,72
CS IC -ConsejoS uperiordeInvestigacionesCientíficas S pain 4 1,04 0,94
W U R -W ageningenU niversity andR esearchCentre N etherlands 4 5,17 1,52
N ihonU niversity Japan 4 0,23 0,13
N ationalR esearchFoundation(N R F) S outhAfrica 4 3,44 1,27
CO N ICET Argentina 4 0,66 1,46
U niversity ofGuelph Canada 4 0,86 0,92
U niversity ofAuckland N ew Zealand 4 1,87 1,66
U niversity ofT okyo Japan 4 0,96 0,54
S anyoT echnoM arineInc. Japan 4 2,02 1,30
N ote:S coresinlightgray arehighly pronetofluctuations;pleaseuse/interpretw ithcaution
S ource:Com piledby S cience-M etrixusingS copusdatabase(Elsevier)

Back
L eadingresearchersinm icroplasticsm arinepollution(1996– 2012)
R esearcher P apers A R C A R IF
M oore,CharlesJam es 13 3,19 1,40
T hom pson,R ichard C. 11 3,61 1,65
T akada,Hideshige 11 2,34 1,21
W illiam s,AllanT . 10 0,48 0,72
Costa,M onicaF. 10 1,73 0,95
Donohue,M ary J. 8 0,69 1,11
Barnes,David K.A. 8 1,98 1,30
T hiel,M artin 7 2,56 1,30
IvardoS ul,JulianaAssunção 7 2,14 1,20
S heavly,S ebaB. 6 1,58 1,27
T udor,David T . 6 0,53 0,65
M oore,S helly L . 6 1,22 1,08
O gata,Yuko 6 3,59 1,24
R ibic,ChristineA. 6 0,75 1,29
Kako,S hinichiro 6 2,02 1,32
Zhang,Yuan-Biao 5 0,44 0,22
Yam ashita,R ei 5 3,30 1,39
R yan,P eterG. 5 2,44 1,27
M orishige,Carey 5 1,04 1,24
Kenyon,JeanC. 5 0,70 0,41
Fillm ann,Gilberto 5 1,31 1,08
Isobe,Atsuhiko 5 2,02 1,34
Galgani,Francois 5 1,87 1,98
Gallow ay,T am araS . 5 4,04 1,70
Karapanagioti,HrissiK. 5 1,81 1,17
Aeby,GretaS . 5 0,70 0,41
Barletta,M ário 5 2,89 1,01
S aido,Katsuhiko 4 0,23 0,13
W eisberg,S tephenB. 4 0,61 1,00
S antos,IsaacR . 4 1,33 1,13
W ilkinson,Casey B. 4 0,59 0,40
M agom e,S hinya 4 2,02 1,30
M axim enko,N ikolai 4 1,09 1,57
Kang,Chang-Gu 4 0,00 0,38
Hinojosa,IvánA. 4 2,20 1,24
L aw ,KaraL avender 4 2,20 1,68
L attin,Gw endolynL . 4 1,74 1,24
Corcoran,P atriciaL . 4 1,53 1,17
Brainard,R ussellE. 4 1,56 0,98
N ote:S coresinlightgray arehighly pronetofluctuations;pleaseuse/interpretw ithcaution
S ource:Com piled by S cience-M etrix usingS copusdatabase(Elsevier)


