Georgia Department of Education
February 10, 2016 • Page 1 of 66 All Rights Reserved
SLDS District/School Dashboard User Guide
Statewide Longitudinal Data System (SLDS)

SLDS District/School Dashboard User Guide 2
Georgia Department of Education
February 10, 2016 • Page 2 of 66 All Rights Reserved
Table of Contents Brief History of the Statewide Longitudinal Data System ..................................................................... 4
Benefits of SLDS ................................................................................................................................................. 4
How to Access the Georgia SLDS ..................................................................................................................... 4
The District/School Dashboard Landing Page ........................................................................................... 5
Navigation Tool Bar ......................................................................................................................................... 6
Historical and Operational Dashboard Tabs .......................................................................................... 7
Student Search Bar ........................................................................................................................................... 8
Assessment Dashboard .................................................................................................................................. 9
District-level Dashboard versus School-level Dashboard .............................................................. 10
Hover the Cursor for Details ................................................................................................................. 10
Test Administrations ................................................................................................................................ 11
Assessment Dashboard Filters ............................................................................................................. 12
Filter Group and Filter Value Dependency ...................................................................................... 13
Drilldown on charts .................................................................................................................................. 16
School level dashboard ................................................................................................................................ 18
The “More” Button .................................................................................................................................... 19
Enrollment Dashboard ................................................................................................................................ 22
Withdrawal Charts .................................................................................................................................... 26
Attendance Dashboard ................................................................................................................................ 29
Local Assessment ........................................................................................................................................... 30
Operational Dashboard .................................................................................................................................... 31
Assessments ..................................................................................................................................................... 31
Home School Report ..................................................................................................................................... 33
Georgia Virtual Learning (GAVL) Enrollment ..................................................................................... 35
Local Assessment ........................................................................................................................................... 37
GOFAR Assessment ....................................................................................................................................... 37
Student Profile Page .......................................................................................................................................... 38
Demographics and Attendance Chart ................................................................................................ 39
Student Lexile Scores ............................................................................................................................... 41

SLDS District/School Dashboard User Guide 3
Georgia Department of Education
February 10, 2016 • Page 3 of 66 All Rights Reserved
Assessment Results .................................................................................................................................. 42
Overview of Assessments Available on the Student Profile Page and Class Roster ........ 43
Test Administration Details Page ........................................................................................................ 50
Student Growth Percentile..................................................................................................................... 51
Local Assessments..................................................................................................................................... 52
Summary of Assessment Data Locations in SLDS ......................................................................... 53
My Schedule Section ................................................................................................................................. 53
Enrollment History ................................................................................................................................... 54
Grades ............................................................................................................................................................ 55
Accessing the Teacher SLDS Dashboards ................................................................................................. 56
Usage Reports ...................................................................................................................................................... 58
Report Date Range ......................................................................................................................................... 58
Displaying Teacher Page Views ................................................................................................................ 58
Displaying Teacher’s Page Visit Details ................................................................................................ 59
Viewing Page Hits for all Users ................................................................................................................. 60
Help and Training .............................................................................................................................................. 63
Recent Updates ................................................................................................................................................... 64
Logging Out of SLDS .......................................................................................................................................... 65
Glossary .................................................................................................................................................................. 66

SLDS District/School Dashboard User Guide 4
Georgia Department of Education
February 10, 2016 • Page 4 of 66 All Rights Reserved
Brief History of the Statewide Longitudinal Data System
The Statewide Longitudinal Data Systems (SLDS) Grant Program of 2002, was designed to
help state education agencies develop and implement longitudinal data systems. These
systems are intended to enhance the ability of States to efficiently and accurately manage,
analyze, and use education data, including individual student records. The data systems
developed with funds from these grants should:
Help States, Districts, Schools, and Teachers make data-driven decisions to improve
student learning.
Facilitate research to increase student achievement and close achievement gaps.
Benefits of SLDS
Using Georgia's SLDS helps educators:
Identify students' academic strengths and weaknesses
Identify and address potential recurring impediments to student learning, e.g.,
problems with attendance or difficulty in mastering prerequisite knowledge or
skills, before they negatively affect student success
Make more informed (data-driven) decisions designed to improve student learning
Increase student achievement and close achievement gaps
Quickly create targeted differentiation groups and cohorts
How to Access the Georgia SLDS
Administrators can access the Georgia SLDS via a link in their district’s Student Information
System (SIS), e.g., Infinite Campus, Power School, and SchoolMax. The button may be in
several different places
depending on your SIS (see
the graphic below for some
examples). Clicking on the
SLDS link takes you
through the secure SLDS
Tunnel connection and
lands you on the SLDS
District or School
dashboard where you can
view student longitudinal
data.

SLDS District/School Dashboard User Guide 5
Georgia Department of Education
February 10, 2016 • Page 5 of 66 All Rights Reserved
There are three dashboards available in SLDS:
1. District Dashboard (for District/Central Office staff)
2. School Dashboard (for School level staff such as Principals, Asst. Principals,
Counselors, Registrars, etc.)
3. Teacher Dashboard
This guide will focus on the District and School level dashboards, however, the Teacher
level dashboards are also accessible to District and School level staff:
The District/School Dashboard Landing Page
By default, SLDS will initially display the Assessments dashboard. On district-level
dashboards and on elementary and middle school dashboards, the Georgia Milestones End-
of-Grade test (EOG) is the default assessment. On high school dashboards, Georgia
Milestones End-of-Course Test (EOC) is the default assessment. We will discuss the data
displayed on the Assessments dashboard in depth later in this guide.
District-level Assessments Dashboard

SLDS District/School Dashboard User Guide 6
Georgia Department of Education
February 10, 2016 • Page 6 of 66 All Rights Reserved
High School Assessments Dashboard When a High School dashboard is accessed, the default assessment is EOCT.
Navigation Tool Bar
The Navigation Tool Bar includes quick links to move through the SLDS dashboard, and
search features to find students.
The tool bar also includes a feature
to export the data on any SLDS
screen. Any of the images, charts, or graphs that you see on any SLDS page can be exported
to another application, such as Excel, Word, and Adobe PDF.

SLDS District/School Dashboard User Guide 7
Georgia Department of Education
February 10, 2016 • Page 7 of 66 All Rights Reserved
School Selection Dropdown List
If you are viewing the District level dashboard, you have the option to select any school in
the district from the School selection dropdown list. When you select a school, the SLDS
dashboard will display data for the selected school only.
Historical and Operational Dashboard Tabs
There are two tabs on the second level of the SLDS navigation toolbar: Historical
Dashboard and Operational Dashboard. You can hover your mouse over each of these
tabs to view the options under each tab.
Historical Dashboard Tab Options
Operational Dashboard Tab Options
There is one main difference between the data that is displayed under each of the tabs: The
data displayed on the Historical Dashboard tab includes only those students who were
enrolled in the district and/or school during the school year that is being viewed–the
Historical dashboards show historical results for a given school/district based on where
the students were enrolled at the time of testing.

SLDS District/School Dashboard User Guide 8
Georgia Department of Education
February 10, 2016 • Page 8 of 66 All Rights Reserved
By contrast, the data displayed on the Operational Dashboard includes students who are
enrolled in the district/school during the current school year–the Operational dashboards
show historical results for current students.
For example, if the current school year is 2015-16, a student who was enrolled in that
district in 2014-15, but transferred out of the district during 2015-16, will not be displayed
on the Operational dashboard. However, that student’s data will be displayed on the
Historical dashboard when viewing 2014-15 data.
On the other hand, a student who transferred into a district in 2015-16 will be displayed on
the Operational dashboard, but will not be displayed on the Historical dashboard for years
prior to 2015-16.
Student Search Bar
The Student Search Bar is located at the bottom of every page on the
SLDS dashboard. The search bar allows you to go directly to a
student’s profile page using the student’s name or Georgia Testing
Identifier (GTID) number, without going through the student rosters.
District Level users can search for any student within the entire
School System; School level users can search for any student within
that specific school; teachers can search for any student that teacher
has on a class roster.
You can search for a student by entering the Student's GTID in the Search By GTID box and
then clicking on Search. This works great if you have a list of students and their GTIDs.
You can also search for a student by selecting the school of enrollment from the dropdown,
then select the student's grade level. All students in that grade level at the school will be in
the Students List. Select the desired student's name and then click Go.
(Note: If on the School level dashboard, the school name will be pre-populated; if on the
Teacher dashboard, the school name will be pre-populated, and the student list will only
display that teacher’s assigned students.)

SLDS District/School Dashboard User Guide 9
Georgia Department of Education
February 10, 2016 • Page 9 of 66 All Rights Reserved
Assessment Dashboard
As mentioned previously, the assessment dashboard is the default landing page in SLDS. You may wish to view a different assessment type from the one that is displayed by default. To view a different assessment, hover over the Historical Dashboard tab to display the Assessment button. When you hover over the Assessment button, a "fly-out" menu is displayed (see below). From the menu, select the assessment you wish to view.
Note: District-level users may view all Assessment types; School-level users will only be able to view assessment types that are administered at their schools. If they select an assessment type that is not administered at their school, they will see a message that says “No Assessment Data Available.”
Once you have selected the desired assessment, that assessment's data will be displayed in charts that compare the District’s performance to the State’s performance on each subject-area assessment. By default, the charts will display the two most recent years of available assessment data. (Note: If you are viewing a School-level dashboard, you will see three comparison bars in the charts: one for the School, one for the District, and one for the State.)

SLDS District/School Dashboard User Guide 10
Georgia Department of Education
February 10, 2016 • Page 10 of 66 All Rights Reserved
District-level Dashboard versus School-level Dashboard
On the district-level dashboards, the charts that are displayed will contain two bars for each school-year–one bar for the district results and one bar for the state results. On the school-level dashboards, the charts will contain three bars–one for the School, one for the district, and one for the state. Note: If your School Number has changed in the past, data may be limited to that year of change.
Hover the Cursor for Details
On all charts (including enrollment, withdrawal, attendance, etc.), you can hover your
mouse over any data point on the chart to view more detailed information about the data.

SLDS District/School Dashboard User Guide 11
Georgia Department of Education
February 10, 2016 • Page 11 of 66 All Rights Reserved
Test Administrations
There are several assessments that have both main and retest administrations and/or are
administered multiple times during a school year. For your convenience, each of the test
administrations is listed separately on the dashboard. Simply scroll down the dashboard to
view each administration’s results; notice that each administration is listed under an
orange header that details the assessment title, season, and whether it was a main or retest
administration.

SLDS District/School Dashboard User Guide 12
Georgia Department of Education
February 10, 2016 • Page 12 of 66 All Rights Reserved
Assessment Dashboard Filters
The Assessment dashboard allows you to filter reports on the following parameters:
Season, Admin Group, Fiscal year and the combination of Filter Group and Filter value.
After choosing filter parameters, click on “View Report” to generate the desired details.
The filters on Season, Admin Group, Fiscal Year, Filter Group and Filter Value allow you
to choose various combinations on these parameters and view the different reports:
Season: Select one or more values from available seasons for that assessment.
Admin Group: Select one or more values from available Admin group for that assessment
and selected season.
Fiscal Year: Select one or more values from available Fiscal Year for that assessment,
selected season and admin group. This list is sorted in descending order. Default year
selection is the most recent two years of available data.

SLDS District/School Dashboard User Guide 13
Georgia Department of Education
February 10, 2016 • Page 13 of 66 All Rights Reserved
Filter Group: Users can select a specific student demographic attribute by which they can
narrow down the results:
Filter Value: This dropdown populates depending on the value selected in Filter Group
and provides additional level of filter criteria to the data.
Filter Group and Filter Value Dependency
The selections that you can make in the Filter Value
dropdown depend upon which Filter Group you
select. For example, if you choose the Filter Group as
“Grade Level”:

SLDS District/School Dashboard User Guide 14
Georgia Department of Education
February 10, 2016 • Page 14 of 66 All Rights Reserved
The available values in Filter Value change to:
If you would like to filter the assessment results to view only 3rd grade students’ results,
you will need to deselect all of the grade level boxes except for “03,” then click “View
Report.”

SLDS District/School Dashboard User Guide 15
Georgia Department of Education
February 10, 2016 • Page 15 of 66 All Rights Reserved
Here is the report that will be displayed after selecting only grade 3:
At the bottom of the page, the detailed filter criterion is provided to let users know which
filters are applied to the charts that are being displayed.

SLDS District/School Dashboard User Guide 16
Georgia Department of Education
February 10, 2016 • Page 16 of 66 All Rights Reserved
Drilldown on charts
District-level users can drill down on the district bar on each of the charts, and school-level
users can drill down on the school bar to view a list of the students included in each color-
coded category of each bar.
Note: The State level bar in the chart does NOT provide drilldown capability.
Here is a sample drill down for the Meets category on the district level bar:
Users can expand a school to see the detailed list of students that satisfy the criteria by
clicking on “+” sign to the left of school name.

SLDS District/School Dashboard User Guide 17
Georgia Department of Education
February 10, 2016 • Page 17 of 66 All Rights Reserved
The header row of the student list provides the total number of students and the
demographic distribution across various demographic groups.
NOTE:
ELL = English Language Learner
ED = Economically Disadvantaged
SWD = Student With Disability
To filter the list down to the students within a specific demographic group, click on the
hyperlinked number under that group. Here’s an example for 5 “ELL” students for the
applied criteria.
Clicking on a Student Name hyperlink will take users to the Student Profile Page for that
student. The Student Profile will be discussed in detail later in this guide.

SLDS District/School Dashboard User Guide 18
Georgia Department of Education
February 10, 2016 • Page 18 of 66 All Rights Reserved
School level dashboard
At the District level Student list, users can jump to a School dashboard for the specified
assessment by clicking on School name.
Here is an example of School dashboard for “Sandy Creek High School”:

SLDS District/School Dashboard User Guide 19
Georgia Department of Education
February 10, 2016 • Page 19 of 66 All Rights Reserved
Note that the School level information bar is added above the State and District levels for
each fiscal year. Since this is a school-level dashboard, ONLY the school level information is
drillable (District and State become non-drillable).
The “More” Button
At the end of the header row for each test administration there is a More button. This button allows you to drill down to view more details about the results in that test administration only.
After clicking on the More button, you will see a screen similar to the one below. The default selection is to group the results by “Grade Level”; the charts below will display student test results grouped by grade level.
SLDS District/School Dashboard User Guide 20
Georgia Department of Education
February 10, 2016 • Page 20 of 66 All Rights Reserved
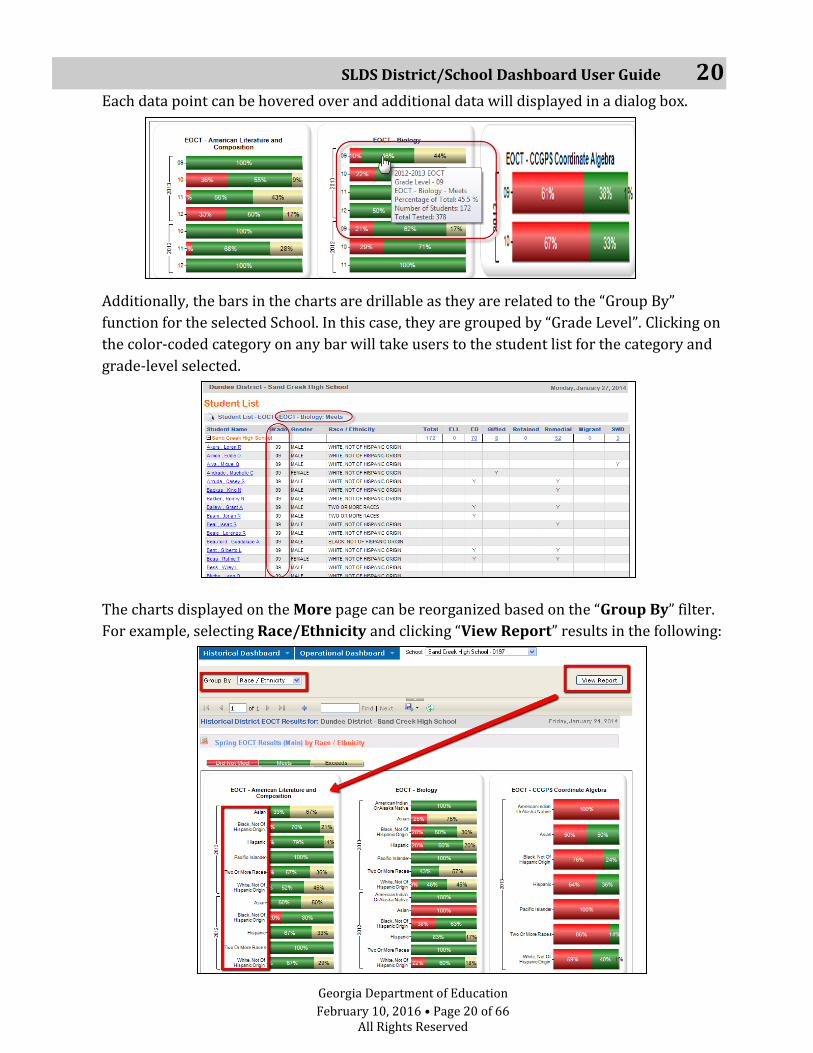
Each data point can be hovered over and additional data will displayed in a dialog box.
Additionally, the bars in the charts are drillable as they are related to the “Group By”
function for the selected School. In this case, they are grouped by “Grade Level”. Clicking on
the color-coded category on any bar will take users to the student list for the category and
grade-level selected.
The charts displayed on the More page can be reorganized based on the “Group By” filter.
For example, selecting Race/Ethnicity and clicking “View Report” results in the following:

SLDS District/School Dashboard User Guide 21
Georgia Department of Education
February 10, 2016 • Page 21 of 66 All Rights Reserved
The More page includes the tabular view below the charts and can be viewed by scrolling
down the page.
Tabular View
Both views represent the same data, but will present the data in different ways. In the tabular view, the numerical data displays the results by group, as well as a Combined total. Clicking on any of the hyperlinked percentages in the table will display a roster of all the students who are included in that percentage.

SLDS District/School Dashboard User Guide 22
Georgia Department of Education
February 10, 2016 • Page 22 of 66 All Rights Reserved
Student roster displayed after clicking on 51.7%
Enrollment Dashboard
Under the Historical Dashboard tab, you can select the Enrollment button to display the Enrollment and Withdrawal dashboard.
This page allows you to see enrollment and withdrawal information for your school. As
you can see in the screen shot below, the data extends back to 2006-2007 school year. It is
important to note that the data displays enrollment and withdrawal records, not the
number of students. The display shows two types of charts for the same data; one chart is a
bar chart, and the second chart is a line graph that shows trend of the data. Unlike the
charts on the Assessment dashboards, you cannot click on the bars within the charts on the
Enrollment dashboard to drill-down and view more details.
District-level Enrollment Dashboard
At the District
level, the
charts will
display
Percent by
School type
Scroll down
to view
Withdrawal
charts

SLDS District/School Dashboard User Guide 23
Georgia Department of Education
February 10, 2016 • Page 23 of 66 All Rights Reserved
Please note that the District level Enrollment and Withdrawal dashboards look different
from the School level dashboards. At the District level, the chart will display the number of
enrollment or withdrawal records by School Type, as a percentage of the total number of
district records submitted in Student Record (SR).
At the School level, the chart will display the number of enrollment or withdrawal records
submitted in SR.
School-level Enrollment Dashboard
There is a More button in the top right corner of the Enrollment charts sections. You can click the More button to drill down to view more details about the data shown in the charts.

SLDS District/School Dashboard User Guide 24
Georgia Department of Education
February 10, 2016 • Page 24 of 66 All Rights Reserved
After clicking on the More button on the Enrollment charts section, you will see a screen similar to the one below. The default "view" is the first item in the left hand side Document Map. Your chart will display detailed information for that section. Each data point can be hovered over and additional data will displayed in a dialog box. You can reorganize the Chart by the items on the left hand side inside the Document Map. If your District/School has at least one student in a subgroup, that subgroup will be listed in your Document Map. Notice that each subgroup has two listings, one for a chart view and the other for a table view. Both views represent the same data, but will present the data in different ways.
School Type Chart View
School Type Table View

SLDS District/School Dashboard User Guide 25
Georgia Department of Education
February 10, 2016 • Page 25 of 66 All Rights Reserved
By default, the most recent year of data is displayed, however, charts and tables can be customized to show different years (or multiple years) of data. To view a different year of data, click the drop-down arrow beside the “School Year” box, check the desired year(s), and then click the “View Report” button.
You can click on the categories in the Document Map to view charts for different academic subgroups compared to the rest of the student population. For example, click the Gender chart category.
Now click the Gender Table category. In the table view, the numerical data displays the subgroup compared to the rest of the population, as well as a Combined number (entire school population). If you are on the District-level dashboard, in the table view, you will notice another way that you can drill down to additional data: the plus sign. Clicking on the plus sign will expand to a list of schools in the district.

SLDS District/School Dashboard User Guide 26
Georgia Department of Education
February 10, 2016 • Page 26 of 66 All Rights Reserved
School Type List Expanded
Clicking on a hyperlinked school name will take you to the first screen in the school level SLDS dashboard, while clicking on the hyperlinked numbers will display student names. Clicking on the hyperlinked number will display a roster of students who are represented in that number, along with their demographics and the academic categories in which they are categorized.
Student roster displayed after clicking on 458

SLDS District/School Dashboard User Guide 27
Georgia Department of Education
February 10, 2016 • Page 27 of 66 All Rights Reserved
Withdrawal Charts
When you use the vertical scroll bar to scroll down past the two Enrollment charts at the top of the page, you will see the Withdrawal charts. There are two sets of charts for withdrawals. The top set of charts show the total withdrawal records; the bottom set of withdrawal charts show withdrawal records categorized by withdrawals for Dropout reasons (orange) versus Non-Dropout reasons (blue).

SLDS District/School Dashboard User Guide 28
Georgia Department of Education
February 10, 2016 • Page 28 of 66 All Rights Reserved
There is a More button in the top right corner of the Withdrawal charts sections. You can
click the More button to drill down to view more details about the data shown in the
charts.
After clicking on the More button on the Withdrawal charts section, you will see a screen similar to the one below. There is an asterisk at the end of the “Dropout” reasons to assist you in distinguishing them from the “Non-dropout” reasons. Remember, you can select the Table View in the Document Map to display student names.
Click More
to see more
details
about
Withdrawal
s

SLDS District/School Dashboard User Guide 29
Georgia Department of Education
February 10, 2016 • Page 29 of 66 All Rights Reserved
Attendance Dashboard
When selecting the Attendance option from the drop-down menu, you will be able to view
the total number of absences submitted in SR for your district/school dating back to the
2006‐2007 school year. Again, the data is displayed in two charts (bar chart and line chart).
The data shows all daily absences reported to GaDOE regardless of whether they are
excused or unexcused. Unlike the charts on the Assessment dashboards, you cannot click on
the bars within the charts on the Attendance dashboard to drill-down and view more details.
There is a More button in the top right corner of the Attendance charts section. You can click the More button to drill down to view more details about the data shown in the charts.
NOTE
The screen displayed after clicking the More button works the same for the Attendance
dashboard as it does for the Enrollment and Withdrawal dashboards.

SLDS District/School Dashboard User Guide 30
Georgia Department of Education
February 10, 2016 • Page 30 of 66 All Rights Reserved
Local Assessment
Please refer to the Local Assessment District and School User Guide for detailed
information on using this feature. The guide is located at:
http://www.gadoe.org/Technology-
Services/SLDS/Documents/Local_Assessment_District_and_School_User_Guide.pdf

SLDS District/School Dashboard User Guide 31
Georgia Department of Education
February 10, 2016 • Page 31 of 66 All Rights Reserved
Operational Dashboard As mentioned previously in this guide, all of the data on the Operational Dashboard is
driven by the students who are currently enrolled in the district/school. The
Operational dashboards show historical results for current students.
Assessments
By clicking on or hovering over the Operational Dashboard Tab, a menu will be displayed showing two options: Assessment and Home School Report. (Note: Only district level users will see the Home School Report option). When you select Assessment, another fly-out menu option is displayed. From the menu, select the assessment that you wish to view.
Once you have selected the desired assessment, that assessment's data will be displayed in
a chart. You will notice that the data is displayed differently than in the Historical
Dashboard. This data is based on your current student population. You will the most recent
assessments administered at your district/school (meaning this school year and one
previous school year), separated by administration period and by assessment area (for
example Milestones EOG will show the four content areas: ELA, Mathematics, Science, and
Social Studies). To the right, you will see the percentage of students in each achievement level; to the Left of
the Content Area Label, you will see a [+] sign.

SLDS District/School Dashboard User Guide 32
Georgia Department of Education
February 10, 2016 • Page 32 of 66 All Rights Reserved
Clicking on the [+] sign beside a content area will expand the content area to display the
Domains tested in that subject for your current student population. This data is divided
into the appropriate Mastery Categories for each Domain. The number of students in each
mastery Category will be displayed inside of a bubble. The larger the bubble, the greater
the number of students (this is to provide a quick visual on which category contains the
most students).
If desired, you may click the [+] sign underneath each Domain to further divide the list into
grade levels.

SLDS District/School Dashboard User Guide 33
Georgia Department of Education
February 10, 2016 • Page 33 of 66 All Rights Reserved
By clicking on any bubble, you will see a list of students that make up that group of
students.
Home School Report
Now that Home School students are being reported to the State, we have developed a Home
School report that will accessed via LDS. Currently, it is only available in SLDS to District
level users. Pursuant to Georgia law (O.C.G.A. § 20-2-690), Home School reporting has
recently changed, pursuant to Georgia Law (O.C.G.A. § 20‐2—690). You can view additional
information on the State’s website at the below URL.
http://www.gadoe.org/Curriculum-Instruction-and-Assessment/Pages/Home-
Schools.aspx
From the District level SLDS dashboard, you can click on or hover over the Operational
Dashboard tab to see the Home School Report option. If you do not see the Home School
Report option, you may not be using the District Admin SLDS role, or the SLDS Role that
you are using has not been provisioned to see the Home School Report. Check with your
District’s System Administrator if provisioning is the issue.

SLDS District/School Dashboard User Guide 34
Georgia Department of Education
February 10, 2016 • Page 34 of 66 All Rights Reserved
Home School Report Example
Below you can see an example of the Home School Report. The list shows one record per
Parent/Guardian, with all of their students listed under the Student Name header. As you
can see, some students show a DOB and some show an Age– those are both options that a
Parent/Guardian can choose from when entering the information.
Report Notes
GaDOE is not responsible for the integrity of the report. All of the data is entered by
parents, caretakers, guardians, etc without any data validation required.
GaDOE reports the data exactly how it is entered into the database by the user.
GaDOE does not assume responsibility for students who are erroneously placed on
the Home Study list.
Parents currently use the Home Study application to submit a Declaration of Intent
(DOI) and/or an Attendance form.

SLDS District/School Dashboard User Guide 35
Georgia Department of Education
February 10, 2016 • Page 35 of 66 All Rights Reserved
Process for notifying GaDOE the student is in Home School ‐ Parents must with
withdraw the student from his or her traditional school and submit a DOI form to
GaDOE. Once the form is submitted, parents can print or save the document. (Note:
Parents may submit the DOI before the student is withdrawn.)
We currently do not have a process for updating the list of home school students.
This means that if the student re‐enrolls in a public school, the records are not
updated in the Home Study database. It also prevents us from being able to remove
duplicates or other erroneous data from the list of homeschooled students.
Parents have the option of entering the students DOB or Age.
Typically, the data is only updated by the parents annually.
The Home Study student search feature is not available in SLDS. Users can only view
a list of Home Study students by district.
The data is updated in SLDS nightly.
This report is not accessible at the School or Teacher level.
Georgia Virtual Learning (GAVL) Enrollment
The purpose of the GAVL Enrollment report is to provide district and school administrators
with information about students who are currently enrolled in their district/school and the
GAVL courses in which they are currently enrolled.
Note: You can also navigate directly from the Assessment section of the Operational dashboard to the GAVL Enrollment report with a link as an alternative option (see below).

SLDS District/School Dashboard User Guide 36
Georgia Department of Education
February 10, 2016 • Page 36 of 66 All Rights Reserved
When you click on GAVL Enrollment, you will see the following page where you can see
student data summarized at the School level. If you are a District level user, this list will
include all schools in the district that have students enrolled in GAVL Courses. The number
in parentheses is the count of students enrolled in GAVL in that district (or in the school if
logged in at the School level).
When you expand the “+ Icon” to the left of the school name, you will see list of all GAVL
Course Subjects taken by students currently enrolled in the school. The data will be
summarized horizontally and vertically at the school level and subject level.
When you expand the
“+ Icon” for a subject,
there will be a list of
students enrolled in
GAVL courses in that
subject area.
When you click on a student name, you will be taken to the existing student profile page.

SLDS District/School Dashboard User Guide 37
Georgia Department of Education
February 10, 2016 • Page 37 of 66 All Rights Reserved
Local Assessment
Please refer to the Local Assessment District and School User Guide for detailed
information on using this feature. The guide is located at:
http://www.gadoe.org/Technology-
Services/SLDS/Documents/Local_Assessment_District_and_School_User_Guide.pdf
GOFAR Assessment
Please refer to the Georgia Online Formative Assessment Resource (GOFAR) User Guide for
detailed information on using this feature. The guide is located at:
http://www.gadoe.org/Curriculum-Instruction-and-
Assessment/Assessment/Documents/GOFAR/GOFAR%20User%20Guide%20v%201%20
8Oct2015.pdf

SLDS District/School Dashboard User Guide 38
Georgia Department of Education
February 10, 2016 • Page 38 of 66 All Rights Reserved
Student Profile Page
You can access a student’s profile in various ways:
1. By clicking on a student name that is listed on any student roster list. This will
display the Student Profile Page.
2. By searching for a student using the student search tool. Select the school, grade
level, and student name, then click “Go.”

SLDS District/School Dashboard User Guide 39
Georgia Department of Education
February 10, 2016 • Page 39 of 66 All Rights Reserved
Student Profile Page for selected student
SLDS District/School Dashboard User Guide 40
Georgia Department of Education
February 10, 2016 • Page 40 of 66 All Rights Reserved
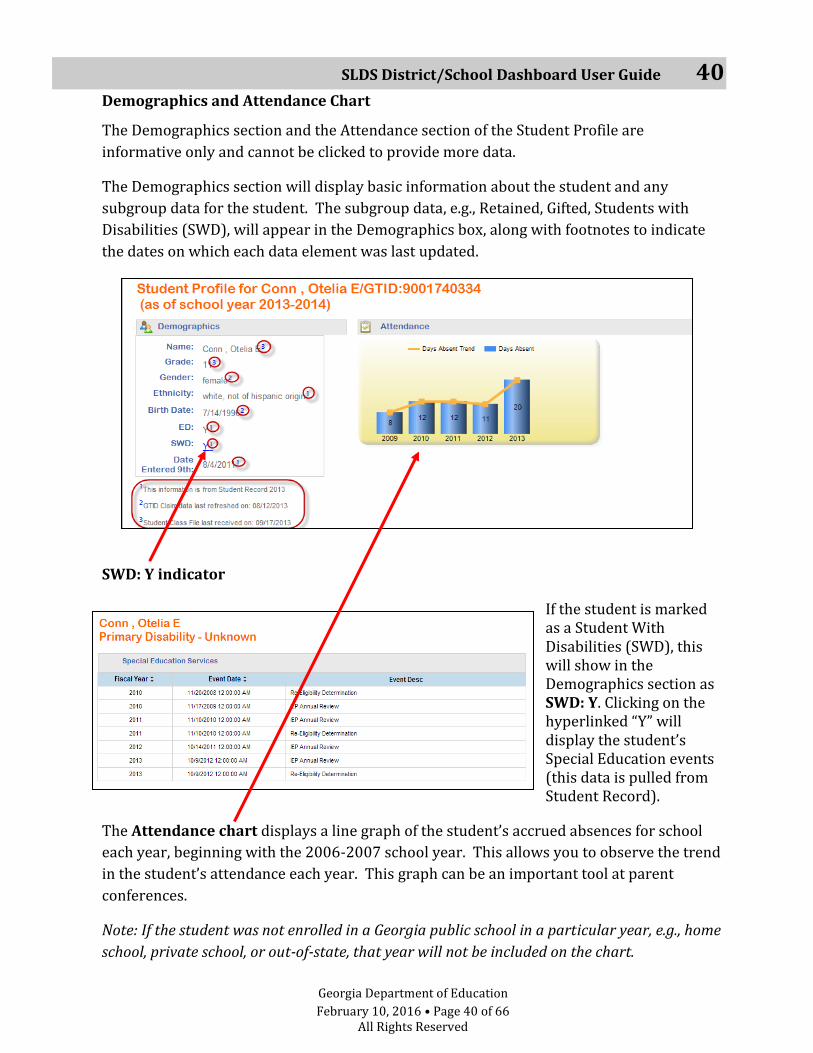
Demographics and Attendance Chart
The Demographics section and the Attendance section of the Student Profile are
informative only and cannot be clicked to provide more data.
The Demographics section will display basic information about the student and any
subgroup data for the student. The subgroup data, e.g., Retained, Gifted, Students with
Disabilities (SWD), will appear in the Demographics box, along with footnotes to indicate
the dates on which each data element was last updated.
SWD: Y indicator
If the student is marked as a Student With Disabilities (SWD), this will show in the Demographics section as SWD: Y. Clicking on the hyperlinked “Y” will display the student’s Special Education events (this data is pulled from Student Record).
The Attendance chart displays a line graph of the student’s accrued absences for school
each year, beginning with the 2006-2007 school year. This allows you to observe the trend
in the student’s attendance each year. This graph can be an important tool at parent
conferences.
Note: If the student was not enrolled in a Georgia public school in a particular year, e.g., home
school, private school, or out-of-state, that year will not be included on the chart.

SLDS District/School Dashboard User Guide 41
Georgia Department of Education
February 10, 2016 • Page 41 of 66 All Rights Reserved
Student Lexile Scores
This chart displays the student’s lexile score achieved on the ELA EOG and/or Reading CRCT,
and on the EOC and/or EOCT in 9th Grade Literature and American Literature each year as
compared to the stretch lexile range (between the 25th and 75th percentile) established for that
grade level. The student’s score is displayed with a red star.
This chart can help you determine which of the students fall outside of the stretch lexile range, and can also be used to observe the trend in the student’s lexile scores each year.
If you would like more information about Lexiles, you can click on the link above the chart entitled “Additional Information about Lexiles.” This will open a web page with Lexile information and tools for educators.

SLDS District/School Dashboard User Guide 42
Georgia Department of Education
February 10, 2016 • Page 42 of 66 All Rights Reserved
Assessment Results
The Assessment section displays all statewide summative assessments, including retests, for the student. A student’s assessment history may go as far back as the 2006-2007 school year, provided that the student’s GTID is linked to the assessment. The students’ assessments will be displayed regardless of the district and school the student was enrolled in when he or she took the assessment.
Each of the color-coded test result boxes is hyperlinked. You can view domain level results and other test administration details by clicking on a specific test result box.

SLDS District/School Dashboard User Guide 43
Georgia Department of Education
February 10, 2016 • Page 43 of 66 All Rights Reserved
Overview of Assessments Available on the Student Profile Page and Class Roster
Any statewide assessment taken by the student will be displayed in the Assessments
section of the Student Profile. Assessments are listed in descending order by
administration date.
The Georgia Milestones EOG and EOC test result boxes (please refer to the glossary at the
end of this guide for the unabbreviated titles of each of these assessments) are all color-
coded according to this legend:
Additionally, each test result box displays the scale score that the student achieved on the
test. The Milestones EOC also displays the grade conversion.
The CRCT, EOCT, GHSGT, GHSWT, G8WT, G5WT, and G3WT test result boxes (please refer
to the glossary at the end of this guide for the unabbreviated titles of each of these
assessments) are all color-coded according to this legend:
Additionally, each test result box displays the scale score that the student achieved on the
test, with the exception of the EOCT which displays the grade conversion.
Note: G3WT scores are reported in four domains across three genres of writing as shown here:

SLDS District/School Dashboard User Guide 44
Georgia Department of Education
February 10, 2016 • Page 44 of 66 All Rights Reserved
There are some assessments that follow a different legend from the tests listed above. They
are CRCT-M, 21 CSA, ACCESS, Alternative ACCESS, GAA, GKIDS, Georgia Pre-K Assessment,
and Local Assessments (please refer to the glossary at the end of this guide for the
unabbreviated titles of each of these assessments).
CRCT-M
As displayed on the Student Profile Page:
21st Century Skills Assessment (21 CSA)
As displayed on the Student Profile Page:
Clicking on one of the 21 CSA test result boxes will display the test administration details:

SLDS District/School Dashboard User Guide 45
Georgia Department of Education
February 10, 2016 • Page 45 of 66 All Rights Reserved
ACCESS As displayed on the Student Profile Page:
Clicking on one of the ACCESS test result boxes will display the following test administration
details:

SLDS District/School Dashboard User Guide 46
Georgia Department of Education
February 10, 2016 • Page 46 of 66 All Rights Reserved
Alternative ACCESS As displayed on the Student Profile Page:
Clicking on one of the Alternative ACCESS test result boxes will display the following test
administration details:

SLDS District/School Dashboard User Guide 47
Georgia Department of Education
February 10, 2016 • Page 47 of 66 All Rights Reserved
GAA
As displayed on the Student Profile Page:
Clicking on the GAA test result box will display the following test administration details:

SLDS District/School Dashboard User Guide 48
Georgia Department of Education
February 10, 2016 • Page 48 of 66 All Rights Reserved
GKIDS
As displayed on the Student Profile Page:
Clicking on the GKIDS test result box will display the following test administration details:

SLDS District/School Dashboard User Guide 49
Georgia Department of Education
February 10, 2016 • Page 49 of 66 All Rights Reserved
Georgia Pre-K Assessment
As displayed on the Student Profile Page:
Clicking on the Pre-K test result box will display the following test administration details:

SLDS District/School Dashboard User Guide 50
Georgia Department of Education
February 10, 2016 • Page 50 of 66 All Rights Reserved
Test Administration Details Page
For all assessments, with the exception of GAA and Pre-K, clicking on an individual test
result box will display domain-specific results and other details about the assessment. The
table displays the domains tested in the subject, along with more details about the
student’s performance in that domain.
Notice that there are hyperlinked performance levels available to click. Once any of the
hyperlinked numbers is clicked, a bar graph will display for that particular domain that
compares the student’s performance to the rest of the students in that same grade level in
his/her classroom, school, district, and state. Each bar can be hovered over to provide the
teacher with additional information.

SLDS District/School Dashboard User Guide 51
Georgia Department of Education
February 10, 2016 • Page 51 of 66 All Rights Reserved
Student Growth Percentile
Students’ growth percentiles are displayed on the Student Profile Page. The growth
percentile boxes display the student’s growth percentile followed by the student’s scale
score on the assessment. The boxes are color-coded based on whether the student
achieved high growth, typical growth, or low growth on the assessment.

SLDS District/School Dashboard User Guide 52
Georgia Department of Education
February 10, 2016 • Page 52 of 66 All Rights Reserved
Local Assessments
If the district completes the process to upload its students’ local assessment data to SLDS,
the assessment results will be displayed on the Student Profile Page for those students who
have taken the assessment(s).
Detailed assessment results for this student.
You may click here for more detailed information about Local Assessments.

SLDS District/School Dashboard User Guide 53
Georgia Department of Education
February 10, 2016 • Page 53 of 66 All Rights Reserved
Summary of Assessment Data Locations in SLDS
Administrative Dashboard
Teacher Landing Page
Student Rosters Student Profile Page
EOC EOG CRCT
CRCT-M
EOCT
GHSGT
GHSWT
G8WT
G5WT G3WT 21CSA
Local Assessments GOFAR Assessments
EOC EOG CRCT
EOCT
GHSGT
Student Lexile Scores Local Assessments
GOFAR Assessments
EOC EOG CRCT
CRCT-M
EOCT
GHSGT
GHSWT
G8WT
G5WT
21CSA
GAA
ACCESS Alternative ACCESS
GKIDS
Georgia Pre-K Assessment Student Lexile Scores
EOC EOG CRCT
CRCT-M
EOCT
GHSGT
GHSWT
G8WT
G5WT
G3WT
21CSA
GAA
ACCESS Alternative ACCESS
GKIDS
Georgia Pre-K Assessment Student Lexile Scores
Student Growth Percentiles Local Assessments
My Schedule Section
This section of the Student Profile displays the student’s current course schedule. Each
course has a key to the left of the course title. Clicking on the key will display the
standards for the course, and allow the user to launch the Teacher Resources Link (TRL)
(see the TRL User Guide located on the SLDS Contact and Connect Page).

SLDS District/School Dashboard User Guide 54
Georgia Department of Education
February 10, 2016 • Page 54 of 66 All Rights Reserved
Enrollment History
This section of the Student Profile displays the student’s district and school enrollment
history within the Georgia public school system since 2006-2007. Teachers will also be
able to see the academic subgroups that the student was part of in each district for each
school year. If a student has withdrawn from a school or district, a withdrawal date and
reason will be displayed. If a student moves out of the state, enrolls in a private school, or
is home schooled, the information for that time period will not be available.
NOTE:
Each enrollment will be an individual line, even if multiple enrollments occur in a single school year. You can
see transfer history on a student, and SLDS makes it much easier to research students who transfer to a
district, school, or class mid-year.

SLDS District/School Dashboard User Guide 55
Georgia Department of Education
February 10, 2016 • Page 55 of 66 All Rights Reserved
Grades
The Grades section of the Student Profile for the selected student shows all classes and final grades submitted in SR dating back to 2006-2007 or since the student entered a Georgia public school. This is different from the Grades section on the teacher landing page, in that the Student Profile page displays ALL grades, not just the grades in subjects that are related to the teacher’s courses. Please note that in 2010-2011, schools began reporting classes for Elementary students, although many schools do not report final grades for K-5, thus 6th grade may be the first year that you see a numerical grade reported. The grade displayed in K-5 courses may be a “0”–This DOES NOT mean that the student failed the course; it means that a grade was not reported.
Note: This is NOT the student’s transcript (although it may be close). It does not include summer school classes, credit recovery, out of state grades, etc.

SLDS District/School Dashboard User Guide 56
Georgia Department of Education
February 10, 2016 • Page 56 of 66 All Rights Reserved
Accessing the Teacher SLDS Dashboards
The Teacher level SLDS dashboard can be accessed by first going to that teacher’s School
level dashboard.
Once on the School level dashboard, scroll to the bottom of the landing page, and click on
the Teacher Dashboards icon.
SLDS District/School Dashboard User Guide 57
Georgia Department of Education
February 10, 2016 • Page 57 of 66 All Rights Reserved
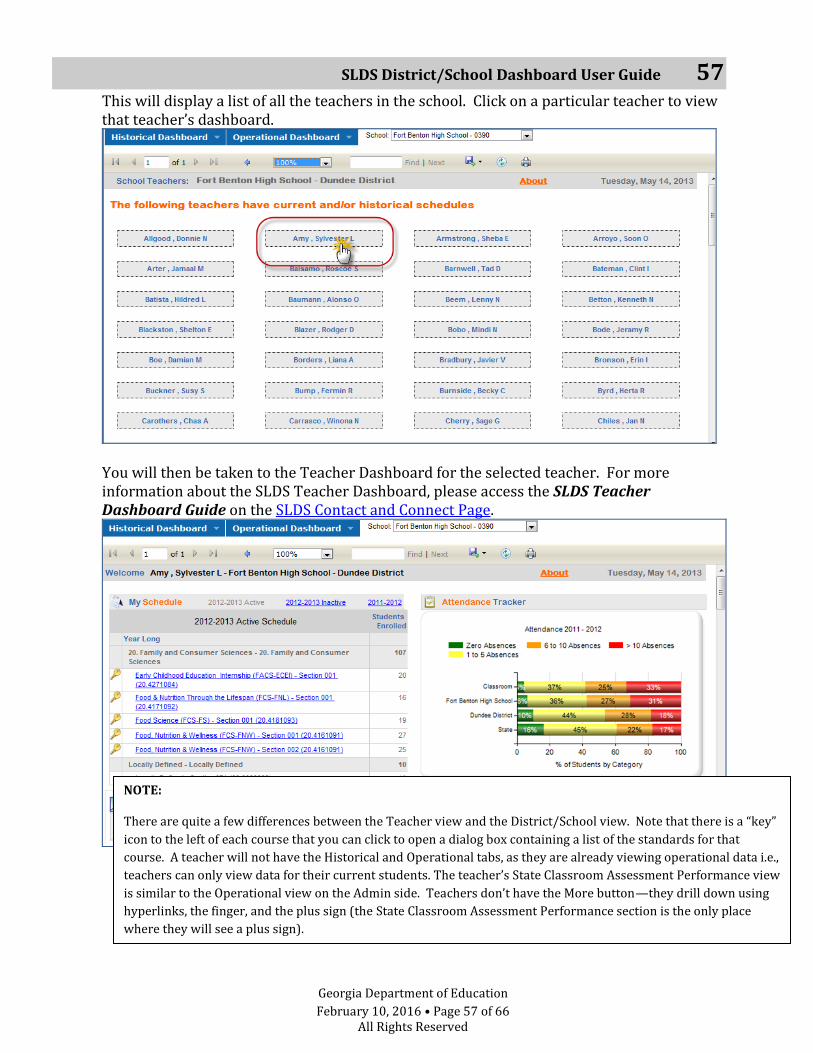
This will display a list of all the teachers in the school. Click on a particular teacher to view that teacher’s dashboard.
You will then be taken to the Teacher Dashboard for the selected teacher. For more information about the SLDS Teacher Dashboard, please access the SLDS Teacher Dashboard Guide on the SLDS Contact and Connect Page.
NOTE:
There are quite a few differences between the Teacher view and the District/School view. Note that there is a “key”
icon to the left of each course that you can click to open a dialog box containing a list of the standards for that
course. A teacher will not have the Historical and Operational tabs, as they are already viewing operational data i.e.,
teachers can only view data for their current students. The teacher’s State Classroom Assessment Performance view
is similar to the Operational view on the Admin side. Teachers don’t have the More button—they drill down using
hyperlinks, the finger, and the plus sign (the State Classroom Assessment Performance section is the only place
where they will see a plus sign).

SLDS District/School Dashboard User Guide 58
Georgia Department of Education
February 10, 2016 • Page 58 of 66 All Rights Reserved
Usage Reports
The Usage Reports provide statistics of the district’s SLDS user logins. Click the Usage Reports button to view this data.
The usage report will default to displaying the Teacher Usage Report. Note: If you are a district-level user, you can see all schools in the district; if you are a school-level user, you will only see your school.
Report Date Range
The date range for the report will default to June 1 – May 31. The date range can be changed by changing the date in the “Activity Start Date” and “Activity End Date” fields and then clicking “View Report”. Note: You may only select dates within the same fiscal year, defined as June 1 through May 31 of the next year.
Displaying Teacher Page Views
You may click on the Page View count beside the school name to view each teacher’s page views.

SLDS District/School Dashboard User Guide 59
Georgia Department of Education
February 10, 2016 • Page 59 of 66 All Rights Reserved
This will display a list of all teachers in the school (as reported in CPI), along with each of their page view counts.
Displaying Teacher’s Page Visit Details
You may click on the Page View count beside the school name to view each teacher’s page views by application.
Clicking on the page view count beside an application will display details about each page that
the teacher visited within the application.

SLDS District/School Dashboard User Guide 60
Georgia Department of Education
February 10, 2016 • Page 60 of 66 All Rights Reserved
Page View Detail
Viewing Page Hits for all Users
District and School level users can also run more detailed reports of usage on all SLDS applications by clicking the Click here to go to Usage Summary Report link located at the top right of the Teacher Usage window. Specifically, you can run reports of District-level, School-level, Teacher-level, Parent, and Student usage in SLDS, TRL, Growth Model, LOR, and IIS.

SLDS District/School Dashboard User Guide 61
Georgia Department of Education
February 10, 2016 • Page 61 of 66 All Rights Reserved
Once the Usage Report opens, you can run a customized report by selecting the following:
Activity start and end dates for the report (you must choose dates within one fiscal year, defined as June 1 through May 31 of the next year)
Application on which to report usage (All, Growth Model, IIS, SLDS, LOR, or TRL) Role for which you would like to report usage (All, District-level usage, School-level
usage, Teacher-level, Parent, or Student usage) School ID for which you would like to report usage (District-level users may select
one school or they may set it to the default of “all” schools; School-level users will only be able to see usage at their school.)
After selecting the options for which to run the report, click the View Report button.

SLDS District/School Dashboard User Guide 62
Georgia Department of Education
February 10, 2016 • Page 62 of 66 All Rights Reserved
Your report will be generated within the same window. The report may consist of several pages, which you can navigate through by clicking the next page and previous page buttons. You may also export the report to several different applications by clicking on the Export button and selecting an application.
Additionally, notice that all of the items in the Page Views column are hyperlinked. Clicking on any of these hyperlinked items will allow you to drill down for more details on the pages that the users viewed with that application.

SLDS District/School Dashboard User Guide 63
Georgia Department of Education
February 10, 2016 • Page 63 of 66 All Rights Reserved
Help and Training
To access help and training materials for SLDS, click on the link in the top right-hand corner of the SLDS taskbar.
The following page will open in a new window:
Links to SLDS
and TRL
training
resources
Contact information
for GaDOE training
team
Join the SLDS
Mailing List
to receive
updates
about SLDS
and TRL
Click here
to request
training
Click here to
see what
has been
recently
updated in
SLDS, TRL,
IIS, etc.
applications

SLDS District/School Dashboard User Guide 64
Georgia Department of Education
February 10, 2016 • Page 64 of 66 All Rights Reserved
Recent Updates
The Recent Updates page will list any recent enhancements and changes to the data or
features available in the SLDS applications.

SLDS District/School Dashboard User Guide 65
Georgia Department of Education
February 10, 2016 • Page 65 of 66 All Rights Reserved
Logging Out of SLDS
When you have finished using SLDS, always logout properly to keep your students’
personal data secure. Do not close the browser window for SLDS without first clicking
the “Logout” button. Failure to properly logout of SLDS will result in your SLDS session
remaining active on the computer that you are using.
To logout of SLDS, click the Logout button in the top right-hand corner of the SLDS toolbar. After logging out, you may close your browser window.

SLDS District/School Dashboard User Guide 66
Georgia Department of Education
February 10, 2016 • Page 66 of 66 All Rights Reserved
Glossary
Term Definition
ACCESS Assessing Comprehension and Communication in English State to State for English Language Learners (ACCESS for ELLs)
Alternative ACCESS
Alternative Version of Assessing Comprehension and Communication in English State to State for English Language Learners (ACCESS for ELLs)
CCGPS Common Core Georgia Performance Standards CRCT An abbreviation for Criterion Referenced Competency Test CRCT-M An abbreviation for Modified Criterion Referenced Competency Test Digital Resources
Web-based objects used for aid or reference
ELL An abbreviation for English Language Learner
EOC An abbreviation for the Georgia Milestones End of Course assessment (for high school-level courses)
EOCT An abbreviation for End of Course Test
EOG An abbreviation for the Georgia Milestones End of Grade assessment (for grades 3-8)
FERPA Family Educational Rights and Privacy Act
G8WT An abbreviation for Grade 8 Writing Test G5WT An abbreviation for Grade 5 Writing Test G3WT An abbreviation for Grade 3 Writing Test GAA An abbreviation for Georgia Alternative Assessment GaDOE An abbreviation for Georgia Department of Education GHSGT An abbreviation for Georgia High School Graduation Test GHSWT An abbreviation for Georgia High School Writing Test GKIDS Georgia Kindergarten Inventory of Developing Skills GOFAR Georgia Online Formative Assessment Resource GPS An abbreviation for Georgia Performance Standards
Lexile The Lexile® Framework is an educational tool that links text complexity and reader’s ability on a common scale metric known as the Lexile
NETS-S National Educational Technology Standards for Students SLDS An abbreviation for State Longitudinal Data System SWD An abbreviation for Students With Disabilities TRL An abbreviation for Teacher Resource Link


