Download - Site Analytics for Retailers

You can’t increase profi tability without knowing your customers inside and out
eXPeRIAN FOOTFALL:COUNT THeM. CAPTURe THeM. CONVeRT THeM.
www.footfall.com + 44 (0) 121 711 4652
PAge 2
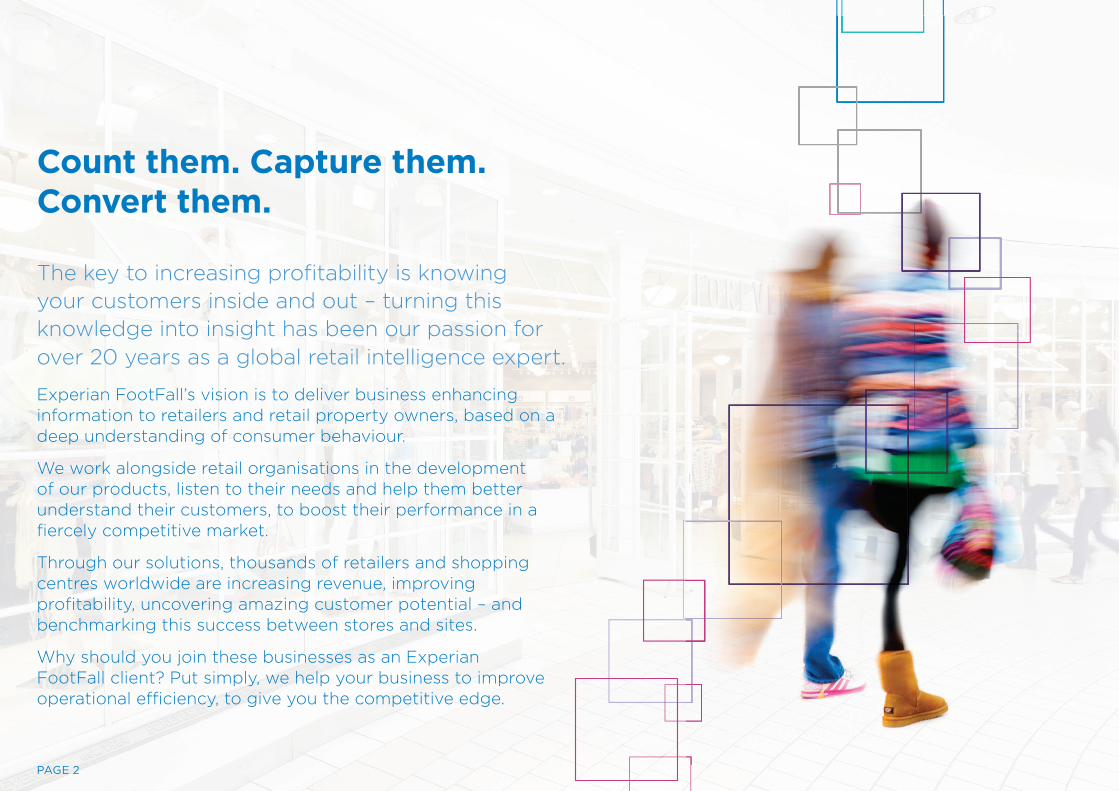
Count them. Capture them. Convert them.
The key to increasing profi tability is knowing your customers inside and out – turning this knowledge into insight has been our passion for over 20 years as a global retail intelligence expert.
Experian FootFall’s vision is to deliver business enhancing information to retailers and retail property owners, based on a deep understanding of consumer behaviour.
We work alongside retail organisations in the development of our products, listen to their needs and help them better understand their customers, to boost their performance in a fi ercely competitive market.
Through our solutions, thousands of retailers and shopping centres worldwide are increasing revenue, improving profi tability, uncovering amazing customer potential – and benchmarking this success between stores and sites.
Why should you join these businesses as an Experian FootFall client? Put simply, we help your business to improve operational effi ciency, to give you the competitive edge.

Site Analytics – Total Consumer Activity Insight
Wherever and however they shop, consumers create a wealth of valuable information. Experian FootFall’s Site Analytics solutions consolidate this data from multiple sources into a single, detailed view of customer activity – from which better business decisions can be made.
Our solutions are more than a means of centralising key information; they enable your business to analyse and measure key performance indicators, in order to make profi t generating decisions. It’s a case of turning business information into business intelligence.
We understand that each area of your business will benefi t from access to diff erent types of information. That’s why we’ve created two user interface options – Site Analytics and Site Analytics expert – to deliver the most appropriate insights to individual users.
PAge 3
Underpinned by the same consistent data sources, our solutions provide complete insight into consumer activity at multiple levels, including:
Intra-day insight – empower store and centre managers to make actionable and timely decisions that drive performance; immediate takeaways that they can act on
Trends insight – empower analysts and head offi ce personnel with detailed analysis, to assess campaign eff ectiveness and business performance planning

How Site Analytics works
Site Analytics combines key data streams – from sales and workforce activity to footfall, weather and consumer movements, and much more – to create a 360 degree overview of shopper behaviour on a single platform.
It has the fl exibility to incorporate existing business data assets, so that nothing is wasted or duplicated.
Sales
Sta�
Online
Visitors In-Store
Queue
Weather & Events
SITEANALYTICS
Key benefi ts
Site Analytics – Total Consumer Activity Insight
Analyse consumer behaviour at macro and micro level – including an hourly breakdown updated throughout the day
Consolidate multiple data measures on a single platform
Customise dashboards for diff erent users within your business
Benchmark performance through analysis of data by site, region or business-wide
Distribute reports via email on a daily/weekly/monthly service level
Structure reporting to suit business hierarchical grouping such as management territories, store formats or geographical regions
Receive technical support from an expert experian FootFall consultant
PAge 4

Finding the Right Solution for Your Business
How can Site Analytics enhance your business performance?
In today’s closely contested retail environment, a ‘one size fits all’ solution is not enough to gain competitive advantage, or helpful to all users within your business. That’s why we’ve created a tailored interface for site and area managers.
As the first and last point of contact with shoppers, Site Analytics enables managers to monitor, analyse and – most importantly – act on performance measurement situations.
Our solution now features a unique Interior Analytics capability, enabling users to understand anonymous visitor movements and create informed views of what happens beyond the entrance.
Customer insights
�•� �How�do�visitor�volumes�change�by�hour, week, month and year. Is there a trend which can be anticipated and be prepared for?
•� �What�journeys�do�visitors�take�around your store or centre, what area of the store is drawing them in?
•� �What�are�the�visitor�dwell�times�within key areas of your store, such as changing room and POS waiting times?
•� �What�proportion�of�your�customers�are repeat visitors and do they concentrate in key areas of your store?
•� �What�marketing�activities�are�driving�unique visitors to your store, driving your footfall?
•� �Are�there�clear�differences�in�shopper�behaviour between stores and centres, which explain performance variances.
Store insights
•� �What�proportion�of�passing�shoppers�come into your store?
•� �How�do�conversion�rates�and�average�transaction values vary by hour, day, week, month and year?
•� �Which�staff�to�visitor�ratio�is�most�profitable? When are conversion rates or customer service levels being compromised?
•� �How�are�marketing�promotions�driving loyalty by increasing frequency and lengths of visits to the store? How is this impacting sales numbers?
•� �Which�marketing�activities�drive�the�greatest return on investment?
•� �How�is�each�store�performing�when�benchmarked across similar stores, regions – or your entire network?
Shopping Centre insights
•� �Which�retail�outlets�are�the�most�popular? Where can rental incomes be optimised by changing the mix of retailers, or their locations in the centre?
•� �What�is�the�sales�per�head�or�per�square metre for each retail unit within the centre?
•� �What�are�the�opportunities�to�see�(OTS) in key digital media locations and how can this drive incremental revenues?
•� �Which�marketing�activities�improve�loyalty and increase the frequency of customers visits? Which campaigns drive new visitors?
•� �How�many�customers�are�using�facilities such as food and beverage outlets, service areas?
•� �What�changes�can�you�make�across�your centre to increase dwell times?
•� �How�is�each�centre�performing�when�benchmarked across your portfolio?
Site Analytics - who’s it for? Store and centre managers, regional operations
PAge 5

Site AnalyticsWhat will users see?
Our Site Analytics solution can be personalised to individual retailer, centre or user requirements, providing direct access to the data streams most relevant�to�your�job�role�–�without�unnecessary�complexity.
Detailed analysis can be performed on an hour-by-hour level, enabling users to make timely decisions during the day, in order to maximise profitability.
The application is mobile-optimised, granting access to key performance data from desktop, tablet and mobile devices. Users can also choose how information is displayed; for example, pulling out key data streams such as daily traffic, sales and conversions as numbers, rather than displaying the results in graph format.
PAge 6

Site Analytics Expert is based on the same data platform as our Site Analytics solution, with added analytics tools and reporting functions.
It’s ideal for advanced users and head office personnel, who require detailed analytical capabilities to explore wider trends across your business.
Who’s it for?
Head office personnel, including business insight analysts and product managers, directors of finance, marketing, operations, and board members.
PAge 7
Site Analytics Expert
How can it enhance your business performance?
By combining data relating to a huge range of critical business metrics, Site Analytics expert converts an overwhelming stream of information into actionable business insights.
To enhance this solution, experian FootFall has created analysis tools and reporting templates, so users can communicate key information throughout your organisation.
Data streams that can be compared and analysed
•� �Visitor�footfall�by�hour,�day,�week,� month and year
•� Shopper�movement�and�dwell�times�•� �Staff�to�visitor�ratios�to�assess�returns�
against costs•� Marketing�promotion�revenues•� Online�data•� Customer�survey�results•� �Benchmark�performances�across�stores�or�
shopping centres
In the Store
•� Sales�figures,�broken�down�by�category•� Conversion�rates•� Average�transaction�values•� Queue�performance�•� Loyalty�card�data
In the Shopping Centre
•� Rental�income�•� �Retail�performance,�sales�per�head�and�
per square metre •� Outlet�vacancy�rates•� Car�park�data

Site Analytics ExpertWhat will users see?
The Site Analytics expert dashboard has been optimised for use on desktop devices.
Clear web-style pages present users with a comprehensive range of analytics tools. From this, they can measure, interpret and act on key data – for use in campaign evaluation, business reviews or planning/forecasting.
Predefined reporting templates enable users to quickly and efficiently communicate their findings throughout your business.
PAge 8

Benefit Enablers Benefit Achievers
Measure Integrate Analysis Discover action
data & technology people & process
customer data capture
and relevant complimentary
data feeds
integration into secure cloud
platform
client self-service access to reports and
dashboards
recommendations for business
improvement and value generating
action plans
regular analysis and discovery of
insights by a global team of
analysts
PAge 9
Consultancy - Uncover Amazing Insight to Increase Profi tability
Experian FootFall believes in acting on insight to ensure the value we create delivers a rapid and measurable return on your investment. Above anyone else, Experian FootFall understand and recognise that this is the challenge for all retailers when investing in technology.
This is why we have a team of dedicated consultant on hand to help you unlock and realise the potential revealed in your data.
We�don’t�just�give�you�the�tools�to�make�informed�business�decisions;�we�support�you�with recommendations and action plans for tangible performance improvement, so you can deliver on the promised return on investment and drive business performance at regional�and�global�level,�whether�on�a�pilot�project�or�through�full�deployment.
Based on the principles of our Visitor to Customer strategy, experian FootFall provides a range of services which complements the needs of our clients. In addition to bespoke consulting engagements based on individual client guidance and specifi cation, we have created a wide range of business insight packs that focus on all the key retail issues.
These packs are designed to reveal unrecognised insights and off er advice and recommendations, for measuring in-store performance and optimisation, comparing relative online versus in-store sales performance and measuring and predicting seasonal trends, as well as the impact of peak trading periods, such as easter Weekend, Black Friday or golden Week

How are economic, social, cultural and political events in your region impacting retail traffi c? Our globally recognised, market-leading index can provide the answer.
experian FootFall’s global Retail Traffi c Index has tracked shopper numbers across the world for over twenty years, providing a barometer of shopper confi dence.
Relied upon by retailers, shopping centres, media outlets and expert commentators internationally, it is a consistent and trusted benchmark for consumer retail activity – both to measure performance in attracting visitors and to forecast likely future footfall levels.
Through our index , you can understand and benchmark performance from store to store, or determine best practice for each location, based on profi le. You can also analyse the impact of factors such as the weather, public holidays, sporting and cultural events, economic issues and political changes on each location.
Our indexes are published on a weekly and monthly basis, with regional breakdowns available in many areas. We also produce detailed performance reports within many markets – for example consumer activity within retail parks, department stores and city centres.
In addition, experian FootFall provides bespoke indexes for hundreds of our clients, enabling them to compare results on a like-for-like basis, and identify where opportunities for improvement exist.
Experian FootFall’s Global Retail Traffi c Index – the industry benchmark of shopper confi dence
PAge 10
OCTOBER
SEPTEMBER
AUGUST
JULY
JUNE
MAY
1.6
-1.9
-0.1
-3.7
1.3
3.1
1.3
-1.7
-0.2
-1.0
-0.5
-0.8
5.4
-65.1
-12.3
-14.3
-0.9
27.1
-1.6
-0.3
-0.5
1.8
-0.2
-
FootFallMONTH ON MONTH
% charge
FootFallYEAR ON YEAR
% charge
Retail SalesMONTH ON MONTH
% charge
Consumer ConfidenceMONTH ON MONTH
% charge
* Above visuals for presentation purposes onlyIndice
FootFall
X on X Percentage Change
IndiceFootFall
YOY Percentage Change
Nov
131.27
12.7 %
⇑
118.90
10.4 %
⇑
Dec
182.34
38.9 %
⇑
166.13
9.8 %
⇑
Jan
133.47
-26.8 %
⇓
133.85
-0.3 %
⇓
Fev
111.04
-16.8 %
⇓
117.55
-5.5 %
⇓
Mar
111.61
0.5 %
⇑
112.22
-0.5 %
⇓
Avr
108.88
-2.4 %
⇓
111.26
-2.1 %
⇓
Indice Mensuel FootFall - Mois commençant le 01/04/12
60
80
100
120
140
160
180
200
Jan Fev Mar Avr Mai Jun Jul Août Sep Oct Nov Dec
2010 2011 2012
Mois parmois
Année parannée
Indice FootFall
Mois
Analyse comparative des 6 derniers mois
L'indice FootFall est une référence nationale de la fréquentation de centres commerciaux répartis géographiquement sur la France. Pour plus d'informations,
vous pouvez nous écrire à l'adresse suivante [email protected] propos de l'indice FootFall
N / N-1
Indice
-2.1 %7580859095
100105110115120
20112012
Evolution en Cumul
Ile de France
© Copyright FootFall® Ltd
L'indice FootFall est une référence nationale de la fréquentation de centres commerciaux répartis géographiquement sur la France. Pour plus d'informations,
© Copyright FootFall® Ltd
IndiceFootFall
X on X Percentage Change
IndiceFootFall
YOY Percentage Change
Nov
116.11
8.6 %
⇑
108.19
7.3 %
⇑
Dec
159.65
37.5 %
⇑
149.99
6.4 %
⇑
Jan
116.76
-26.9 %
⇓
118.98
-1.9 %
⇓
Fev
100.81
-13.7 %
⇓
106.70
-5.5 %
⇓
Mar
98.82
-2.0 %
⇓
101.41
-2.6 %
⇓
Avr
94.90
-4.0 %
⇓
100.77
-5.8 %
⇓
Indice Mensuel FootFall - Mois commençant le 01/04/12
60
70
80
90
100
110
120
130
140
150
160
Jan Fev Mar Avr Mai Jun Jul Août Sep Oct Nov Dec
2010 2011 2012
Mois parmois
Année parannée
Indice FootFall
Mois
Analyse comparative des 6 derniers mois
L'indice FootFall est une référence nationale de la fréquentation de centres commerciaux répartis géographiquement sur la France. Pour plus d'informations,
vous pouvez nous écrire à l'adresse suivante [email protected] propos de l'indice FootFall
N / N-1
Indice
-3.9 %7580859095
100105110
20112012
Evolution en Cumul
© Copyright FootFall® Ltd
L'indice FootFall est une référence nationale de la fréquentation de centres commerciaux répartis géographiquement sur la France. Pour plus d'informations,
Novembro Dezembro Janeiro Fevereiro MarçoAbril
79,4596,79
79,3376,73
76,7479,85
7,0%21,8%
-18,0%-3,3%
0,0%4,1%
-5,9%-2,9%
0,6%-2,0%
-1,7%-1,2%
-1,09%
Comentário
Indice FootFall - Portugal Variação Mensal
Abril 2012
Variação Percentual
Indice FootFall
Variação Anual
70
80
90
100
110
Indi
ce
Mês
20102011
2012
Baseado no mês de Julho, 2003 com um Indice 100, recalculado desde 2007
Indice FootFall de Portugal
©Copyright FootFall®
O Indice está avaliado por dados dos Centros Comerciais em Portugal repartidos por todo o ámbito nacional. O Indice mostra alterações percentuais de um mês frente ao
anterior no número total de visitantes de ámbito nacional.
Comentário realizado por Experian FootFall.
757677787980
2011 2012
Indice Acumulado

PAge 7www.footfall.com @footfallinsight
About Experian FootFallExperian FootFall is the leading global retail intelligence service, enabling international retailers and shopping centres to understand their customers inside and out, and generate greater profits from that insight.
Part of global information services group, Experian, FootFall has been providing actionable insight into consumer behaviour for 20 years and now acts as a trusted advisor to retailers and shopping centres in Europe, Asia and the US. Our customer insight solutions are used in 40 countries by thousands of retail
businesses, all of whom want to gain greater understanding of customer behaviour and key performance indicators such as sales conversions, staff productivity and promotional effectiveness, in order to make profitable business decisions.
In 2014, Experian FootFall launched Interior Analytics, a new solution that uses the latest connectivity technique to track customers as they move around your store or shopping centre. Available as a standalone service or to enhance our Site Analytics solutions, which captures all of your business data, Interior Analytics provides our most detailed insight into what is affecting your business performance.
To find out how Experian FootFall can improve your profits visit www.footfall.com or contact our team in your region on + 44 (0) 121 711 4652.
PAge 11

www.footfall.com @footfallinsight
To find out how experian FootFall can improve your profits visit www.footfall.com or contact our team in your region on + 44 (0) 121 711 4652.


