SITAC Meeting
December 19, 2017
Pioneer Room, State Capitol
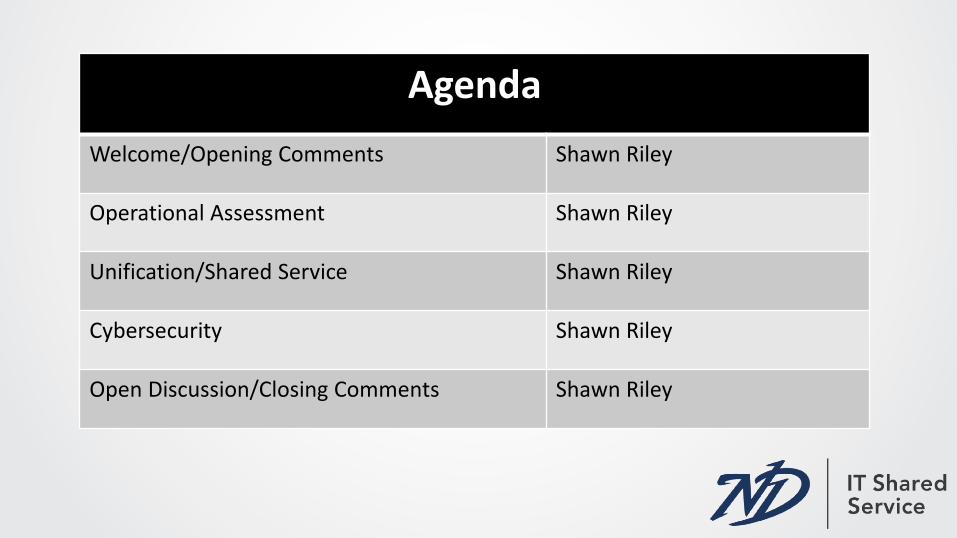
Agenda
Welcome/Opening Comments Shawn Riley
Operational Assessment Shawn Riley
Unification/Shared Service Shawn Riley
Cybersecurity Shawn Riley
Open Discussion/Closing Comments Shawn Riley

Operational Transformation

Why are we completing these assessments, what is the methodology, and what are the goals?

5
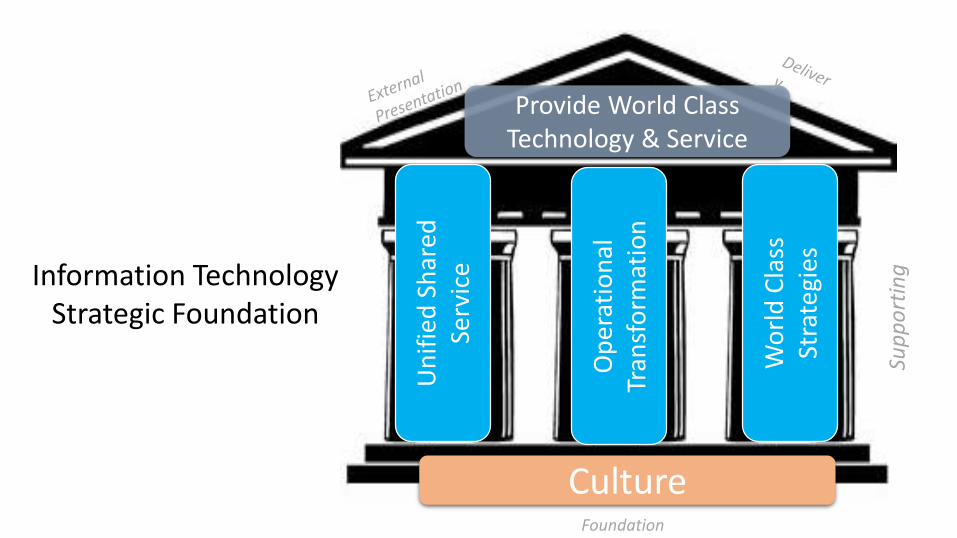
IT STRATEGY PILLARS
ND IT is striving to deliver World Class IT services
The IT Strategic Pillars are:
1) Unified Shared Service (Unification)
• Enables Alignment
2) Operational Transformation
• Enables Efficiency
3) World Class Strategies
• Enables Delivery
To help ensure success, IT will need to enhance their Culture
Pulling all the components together will allow IT to Provide
World Class Technology & Services

Why are we performing these assessments?
This assessment is being conducted to ensure that the services provided by the IT organization are performed in an optimum manner.
The assessment measures how consistent the IT organization’s processes are with best practices in the industry. The measurement creates a baseline against which to measure future performance. Initial areas included in the assessment are:
1. General – how is IT performing overall, general findings and observations2. ITSM – IT Service Management 3. SDLC – Software Development Lifecyle Management4. EPMO – Enterprise Project Management Office
*These are the first assessments of many possible areas

Why start in these areas?
On time, on Budget
Operational Tails
~65% of the IT
workforce Impacted
Cyber Security
New Functionality
Problem Management
Code Control
Help DeskBuy v. Build
Meeting Scope
Programming / DevelopmentSDLC ITSM
PPM
Operations Strategic & Operations
Strategic
Run Grow Transform
~91% ~9% ~0%
We can create greater value across IT by
moving from run to grow & transform
Helps us to understand…

Goals of this assessment
Utilizing the Capability Maturity Model Standard Assessment Framework:
• Conduct an unbiased assessment as to what the current maturity ratings are by capability and phase
• Summarization of where IT is today, remaining gaps and why, and recommendations for improvement
• Establish a maturity baseline so that focus can be made in identified areas and future measurements can be made to show progress in specific areas
• Report based on general area of findings
• The desired outcome is to provide recommendations to move the organization in a planned and positive direction
(1) Ad Hoc
(2) Repeata
ble
(3) Defined
(4) Optimize
d
(5) Innovati
ng
Organization has few formal
processes or controls defined
Organization has a
standard, consistent
process dependent on
individuals
Organization has control over tools & process and
active measurements
of results
Organization has dynamic processes in
place to evolve and continually
improve
Organization has standard,
consistent tools & process in
place which are institutionalize
d

9
ASSESSMENT METHODOLOGY
FINDINGS VALIDATION / FOLLOW-UP
DISCOVERY
ANALYSISRECOMMENDATIONS
INTERVIEWS + SURVEY + DOCUMENTATION REVIEW
10 Individual, 25 Group
✓ What we
heard
✓ Does it
resonate
✓ Additional
verification?
Themes
-- Strategy & Business
Alignment
-- Organization & People
-- Demand and
Governance
✓ IT perceptions about IT
✓ Business perceptions about IT
✓ Strengths
✓ Gaps
✓ Maturity
✓ Recommended RoadmapPresentation
What did we learn?
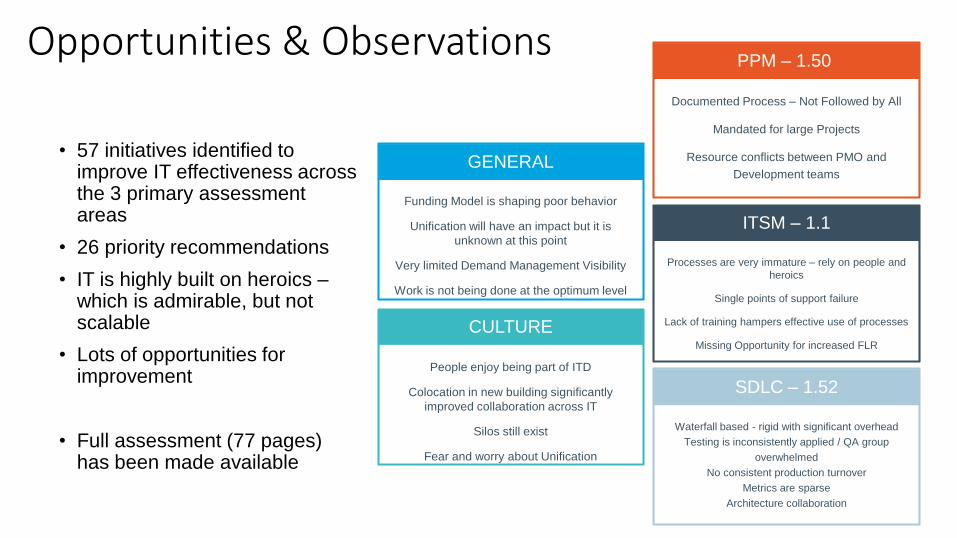
Opportunities & Observations
People enjoy being part of ITD
Colocation in new building significantly
improved collaboration across IT
Silos still exist
Fear and worry about Unification
Waterfall based - rigid with significant overhead
Testing is inconsistently applied / QA group
overwhelmed
No consistent production turnover
Metrics are sparse
Architecture collaboration
Documented Process – Not Followed by All
Mandated for large Projects
Resource conflicts between PMO and
Development teams
Processes are very immature – rely on people and
heroics
Single points of support failure
Lack of training hampers effective use of processes
Missing Opportunity for increased FLR
Funding Model is shaping poor behavior
Unification will have an impact but it is
unknown at this point
Very limited Demand Management Visibility
Work is not being done at the optimum level
GENERAL
ITSM – 1.1
PPM – 1.50
SDLC – 1.52
CULTURE
• 57 initiatives identified to improve IT effectiveness across the 3 primary assessment areas
• 26 priority recommendations
• IT is highly built on heroics –which is admirable, but not scalable
• Lots of opportunities for improvement
• Full assessment (77 pages) has been made available
12
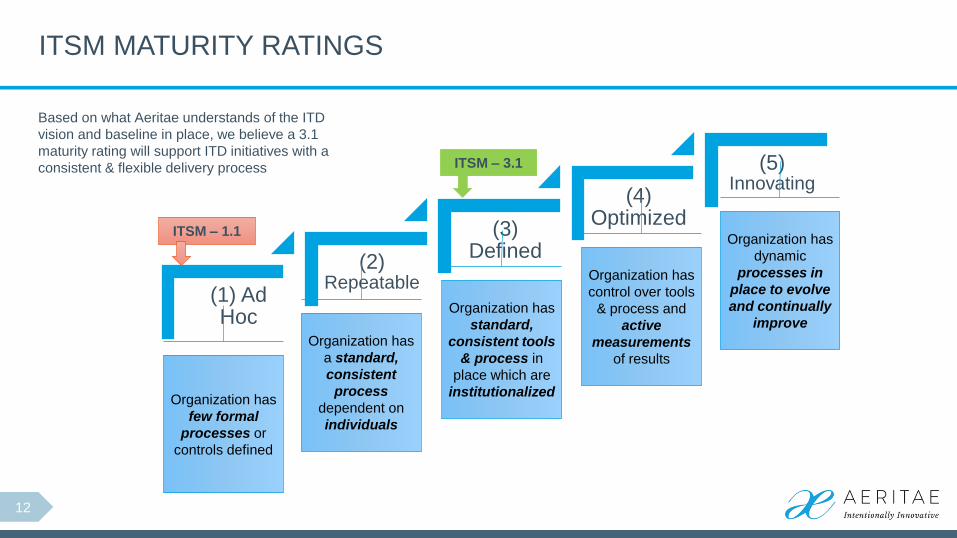
ITSM MATURITY RATINGS
(1) Ad Hoc
(2) Repeatable
(3) Defined
(4) Optimized
(5) Innovating
Organization has
few formal
processes or
controls defined
Organization has
a standard,
consistent
process
dependent on
individuals
Organization has
control over tools
& process and
active
measurements
of results
Organization has
dynamic
processes in
place to evolve
and continually
improve
ITSM – 1.1
Organization has
standard,
consistent tools
& process in
place which are
institutionalized
ITSM – 3.1
Based on what Aeritae understands of the ITD
vision and baseline in place, we believe a 3.1
maturity rating will support ITD initiatives with a
consistent & flexible delivery process
13
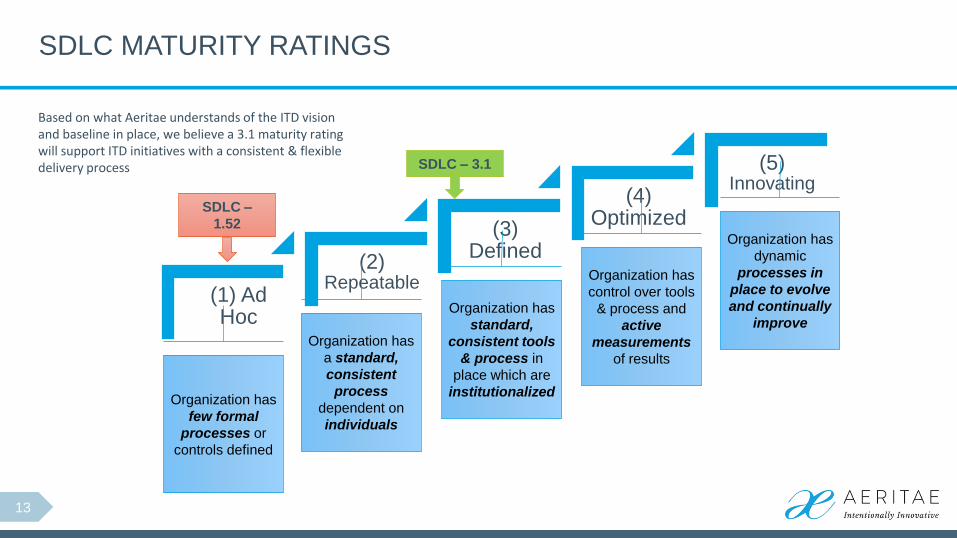
SDLC MATURITY RATINGS
(1) Ad Hoc
(2) Repeatable
(3) Defined
(4) Optimized
(5) Innovating
Organization has
few formal
processes or
controls defined
Organization has
a standard,
consistent
process
dependent on
individuals
Organization has
control over tools
& process and
active
measurements
of results
Organization has
dynamic
processes in
place to evolve
and continually
improve
SDLC –
1.52
Based on what Aeritae understands of the ITD vision and baseline in place, we believe a 3.1 maturity rating will support ITD initiatives with a consistent & flexible delivery process
Organization has
standard,
consistent tools
& process in
place which are
institutionalized
SDLC – 3.1

14
IT PPM MATURITY RATING DEFINITIONS
(1) Ad Hoc
(2) Repeatable
(3) Defined
(4) Optimized
(5) Innovating
Organization has
few formal
processes or
controls defined
Organization has
a standard,
consistent
process
dependent on
individuals
Organization has
standard,
consistent tools
& process in
place which are
institutionalized
Organization has
dynamic
processes in
place to evolve
and continually
improve
PPM – 1.50
Organization has
control over tools
& process and
active
measurements
of results
PPM – 3.2
Based on what Aeritae understands of the ITD vision and baseline in place, we believe a 3.2 maturity rating will support ITD initiatives with a consistent & flexible delivery process

15
CULTURE ROADMAP
Disciplined and measured ✓ Ad Hoc in process adherence
Fast & agile ✓ Slow & bureaucratic
Enterprise/Horizontal ✓ Division/Vertical
Consistent service delivery ✓ Request and task delivery
Connected, coordinated, collaborative ✓ Siloed
Open ✓
Growth Mindset ✓ Fixed Mindset
Shared knowledge, depth of coverage ✓ Knowledge Failure points
Measured & rewarded ✓ Inconsistent measurements for success
From To
Open
World Class IT
• Business fully
understands IT
• Culture of
continuous
improvement with
metrics
• Deep business
understanding by
IT
• Differentiated by
Automation
enterprise wide
• IT continuously
evaluates to
leverage partners
• Excellence in
Customer Sat
• Known for talented
and engaged
employees

Next Steps

17
UNIFY PROJECT MANAGEMENT, SLDC AND ITSM
Analysis
Design
Build
Test
Deploy
Support
Project Mgmt.. SDLC
Requirements
Specification
Architecture & DesignDevelopment
Methodology
Test Strategy & Results
Knowledge/Support
Documents
Implementation
Checklist
Hyper-care PlanLessons
Learned
Support
Turnover
Architecture & Design
To achieve the Future State, IT must mature to consistent usage of the Project Management -AND- the SDLC -AND- the ITSM artifacts/processes
Future State
Key:
Mo
nitor
& C
on
tro
l Art
ifa
cts
Mature to use of consistent artifacts/process
RFC/CAB
ITSM
On time, on Budget
Operational Tails
~65% of the IT workforce
Impacted
Cyber Security
New Functionality
Problem Management
Code Control
Help DeskBuy v. Build
Meeting Scope
Programming / DevelopmentSDLC ITSM
PPM

Run Grow Transform Opportunity
R-G-T as a %
Run Grow Transform
91
90
R-G-T as FTE (pre-Unification)
Run Grow Transform
319
320
Current
R-G-T as a %
Run Grow Transform
70
2010
R-G-T as FTE
Run Grow Transform
246
7035
Mid-Term Goal
R-G-T as a %
Run Grow Transform
50
3020
R-G-T as FTE
Run Grow Transform
176
10570
World ClassZERO decrease in overall FTE, but significantly improved operations (moving away from heroics and towards process and automation enhancement) frees large resources to take on grow and transform

Taking Action
• 10 initiatives currently at the front of the list to kickoff immediately
• All 50+ will be undertaken in time
• Top 10 take into consideration and prioritized on:
• Impact on Unification
• Impact on Run, Grow, Transfer percentages
• Impact on strategic pillars (State of ND, IT, etc)
• Impact on service (both positive and negative)
• Resource availability
• Timeline
• 18-24 month range for ~24 of the initiatives
• Challenges
• Dependencies on Unification – we don’t want to change the process multiple times
• Must change operations in order to have resources to change operations
• Next Assessment: Cyber Security
Leading 10
ITSM
• Major Incident Process
• Knowledge & Config Management
• Incident Management Redesign
SDLC
• Move development to Dev-PaaS
• Develop in a bi-modal model
• Automate build/deploy activities
PPM
• Deploy Program and Portfolio Management
• Management in a bi-modal model
• Deploy PM-light processes
Overall
• Develop a Growth Mindset / Servant Leadership Culture
Initiatives

Questions & Appendix
Unification Update

IT Strategic Pillars
USS ND -Unified Shared Services
Operational Transformation World Class Strategies
Alignment Efficiency Delivery
Three Core Pillars
Culture
Provide World Class Technology & Service
Foundational
Supporting
Op
erat
ion
al
Tran
sfo
rmat
ion
Wo
rld
Cla
ss
Stra
tegi
es
Un
ifie
d S
har
ed
Serv
iceInformation Technology
Strategic Foundation

IT Unification
• Governor Burgum has charged the Executive Cabinet Agencies to align their IT functions into a single shared service• Why
• Economies of scale
• Opportunities for process alignment
• Cost efficiencies
• Skillset and workforce
• Etc
• How• Use the defined Workforce Transition process facilitated via today’s ITD
• All 17 cabinet agencies included (~600-650 IT staff)

Workforce Transition Approach
25
Key Elements Benefits
Key Impact data collection
step
Impact category and change
management activity
assignment
Action plan development,
including workforce transition
activities
Provides a summary of the
expected changes
Determines the type of change
and the support opportunities
available
Role Mapping input data
collection
Role Mapping activities
Role Mapping results and
validation
Clearly defined scope of audience
Assignment of new roles,
responsibilities, processes, and
technologies to current state jobs
Responsibility map
Input into workforce transition
materials and activities
Change Impact level
determination for each role
identified
Assignment of
Start/Continue/Stop activities
Detailed understanding of impact
levels to roles and employee
groups
Concise, detailed explanation of
specific changes to a role
Development and support of
Workforce Transition Guides
Development and use of
teaming/ responsibility
workshops
Effective, structured materials to
support transition
Responsibilities defined for critical
convergence transition/
collaboration points
Expanded breadth to engage end
users
Role Mapping
Detailed Change
Impact
Assessment
Workforce
Transition
Activities
High-Level Change
Impact Analysis
1
2
3
4
✓
✓
✓
✓
✓
✓
✓
Leadership
Support
✓✓Data Availability
✓✓✓✓✓Roles &
Responsibilities
✓✓✓Process Structure /
Definition
✓✓Data Integrity
✓
✓
Job/Org
Change
✓
✓
✓
Training
✓
✓
Capability
Transfer
✓✓Governance &
Accountability
✓✓✓Skill & Capability
Skills
Assessment
✓
Workforce
Transition
✓
CommunicationsKey Change
Integration &
Collaboration
✓
✓
✓
✓
✓
✓
✓
Leadership
Support
✓✓Data Availability
✓✓✓✓✓Roles &
Responsibilities
✓✓✓Process Structure /
Definition
✓✓Data Integrity
✓
✓
Job/Org
Change
✓
✓
✓
Training
✓
✓
Capability
Transfer
✓✓Governance &
Accountability
✓✓✓Skill & Capability
Skills
Assessment
✓
Workforce
Transition
✓
CommunicationsKey Change
Integration &
Collaboration
A dedicated team has been assembled to
deliver this work• Finance• HR• Communications• WFT Analysts
This team will be directly working with the CIO, IT leadership, and customer leaders
26
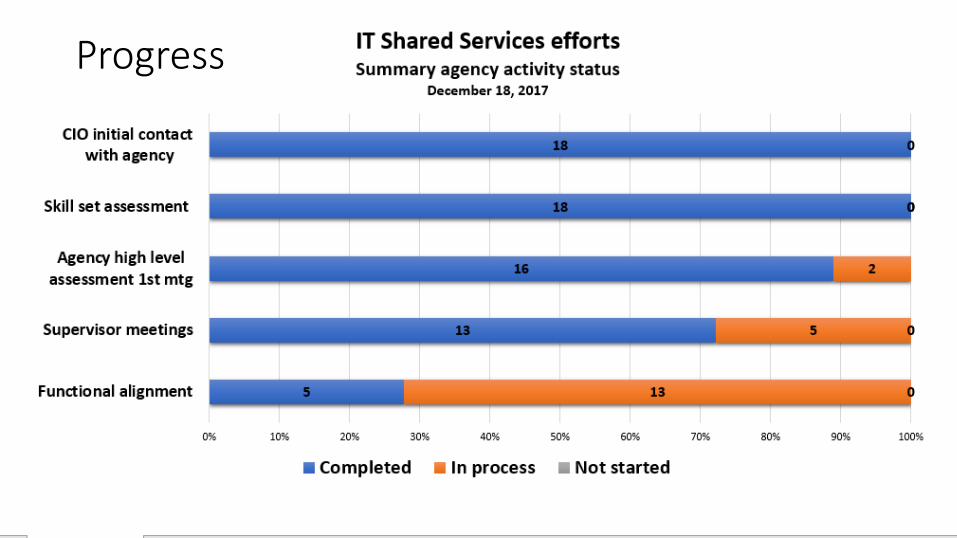
Progress

Opportunities
• Numerous areas where processes can be streamlined (short list)• Same data being input multiple times into different systems
• Information moving from digital to paper and back to digital again
• Numerous areas where technologies can be streamlined (short list)• Redundant applications across the state
• 7 incident management systems identified to date
• Licensing agreements that are not ‘enterprise’
• Systems not configured (or unable) to meet the needs of the business
• Different versions of software in use for same purposes

Questions

Cyber Update

THREATSCYBERSECURITY
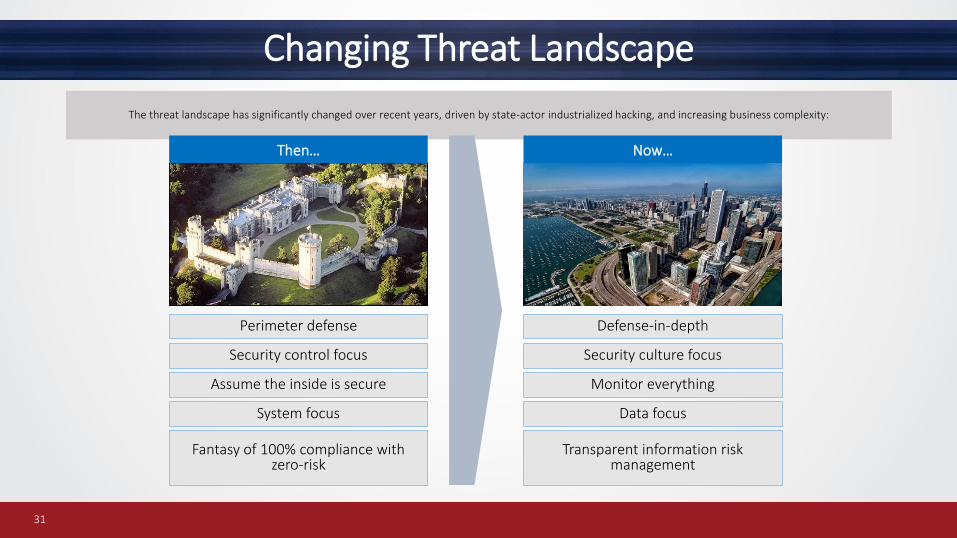
The threat landscape has significantly changed over recent years, driven by state-actor industrialized hacking, and increasing business complexity:
Changing Threat Landscape
31
Then… Now…
Perimeter defense
Fantasy of 100% compliance with zero-risk
System focus
Assume the inside is secure
Defense-in-depth
Transparent information risk management
Data focus
Monitor everything
Security control focus Security culture focus

THREATSComplexity of Cyber Attack Capabilities are Growing (2015 Survey)
DATA IN SECURE BUSINESS SYSTEMS
▪ Mainframe systems
▪ Internetworking
▪ Emergence of open systems
INTERNET ACCESS AND HIGHLY CONNECTED SYSTEMS
▪ Online access to citizen data
▪ Advances in internetworking
▪ Citizen self service
ACCESS ANYWHERE & ANYTIME
▪ Integrated online eligibility systems
▪ Big data
▪ Cloud
▪ Mobile
DATA EVERYWHERE; USER EXPERIENCE DRIVEN
▪ Wearable technology
▪ Internet of things
▪ Smart devices
▪ Drones
▪ Artificial intelligence
▪ Mobile payment
▪ Etc.Low
BUSINESS IMPACT:▪ Citizen trust
▪ Cost to protect
▪ Legal/ regulatory
▪ Critical infrastructure
Now2000s 2010-20141990s
High
Cyber terrorismInsecure codes
Cyber crime
Identity theft
Hackers
Data breach
Network attacks
Malware
Critical infrastructure attacks
Foreign state sponsored cyber espionage
Cyber warfare
42+ organizations in the US had over 1,000,000 records stolen in 2017

THREATSSpecific to Energy Sector
Attackers and tools
▪ Dragonfly 2.0
– Successfully breached 20 companies this summer gaining control of corporate services and operations controls
– Had the ability to shut down circuits and disrupt generation
▪ Ukrainian grid
– Successful attacks with power disruption
▪ BlackEnergy
– Tools specifically built for the purpose of attacking energy generation

The ResponseState of North Dakota’s Cyber Security
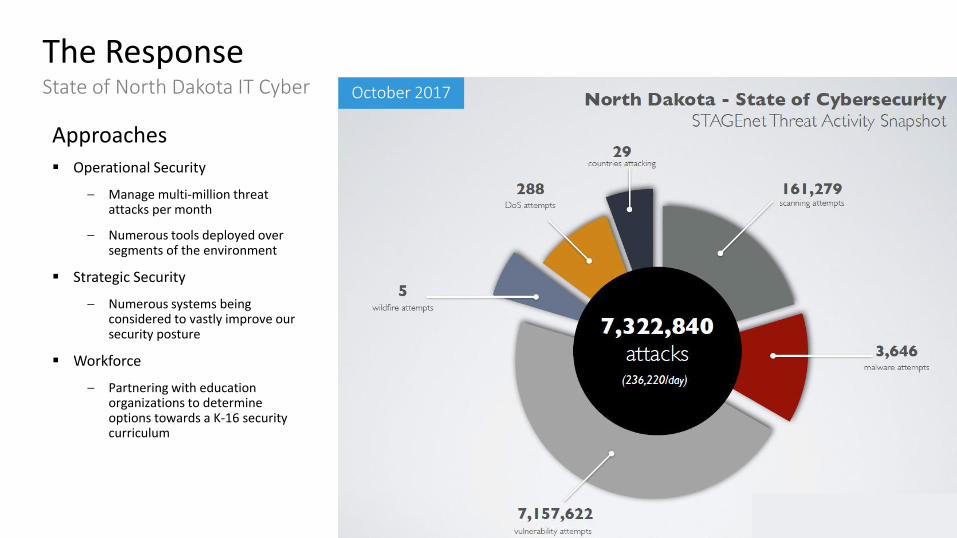
The ResponseState of North Dakota IT Cyber
Approaches
▪ Operational Security
– Manage multi-million threat attacks per month
– Numerous tools deployed over segments of the environment
▪ Strategic Security
– Numerous systems being considered to vastly improve our security posture
▪ Workforce
– Partnering with education organizations to determine options towards a K-16 security curriculum
October 2017

The opportunityPartnerships

The Opportunity• Across the state of North Dakota Approaches
▪ SLIC (State and Local Intelligence Center)
– Information sharing organization
– Made of numerous partners across the state (Department of Emergency Services, National Guard, State Patrol, Homeland Security, BCI, State IT Service, etc.)
▪ Cyber Task Force
– Private / Public partnership
– Focuses on Critical Infrastructure information sharing and protection
– Kicked off in November
– First critical infrastructure: Energy / Electrical

The Opportunity
38
In an effort to evaluate the State of North Dakota’s (the State) current state of IT and information security maturity; in conjunction with the State’s unification efforts, ND Cyber Defense (NDCD) is conducting an IT and Information Security Assessment. The following assessment objectives have been identified:
Assessment Objectives
Identify the State’s “Crown Jewel” assets (e.g., Servers, Applications, Databases, Data)
Evaluate the maturity of the State’s IT and information security program
Conduct a vulnerability assessment and penetration test of selected State “Crown Jewels”
Examine NDCD’s IT and information security strategy and identify opportunities to enhance
1
2
4
3

Questions


