This is a repository copy of Shrinkage properties of plain and recycled steel–fibre-reinforced rapid hardening mortars for repairs.
White Rose Research Online URL for this paper:http://eprints.whiterose.ac.uk/154394/
Version: Accepted Version
Article:
Al-musawi, H., Figueiredo, F.P., Guadagnini, M. orcid.org/0000-0003-2551-2187 et al. (1 more author) (2019) Shrinkage properties of plain and recycled steel–fibre-reinforced rapidhardening mortars for repairs. Construction and Building Materials, 197. pp. 369-384. ISSN 0950-0618
https://doi.org/10.1016/j.conbuildmat.2018.11.099
Article available under the terms of the CC-BY-NC-ND licence (https://creativecommons.org/licenses/by-nc-nd/4.0/).
[email protected]://eprints.whiterose.ac.uk/
Reuse
This article is distributed under the terms of the Creative Commons Attribution-NonCommercial-NoDerivs (CC BY-NC-ND) licence. This licence only allows you to download this work and share it with others as long as you credit the authors, but you can’t change the article in any way or use it commercially. More information and the full terms of the licence here: https://creativecommons.org/licenses/
Takedown
If you consider content in White Rose Research Online to be in breach of UK law, please notify us by emailing [email protected] including the URL of the record and the reason for the withdrawal request.

1
Shrinkage properties of plain and recycled steelȂfibre-reinforced 1
rapid hardening mortars for repairs 2
Hajir Al-musawi a,*, Fabio P. Figueiredo a, Maurizio Guadagnini a, Kypros Pilakoutas a 3
aDepartment of Civil and Structural Engineering, The University of Sheffield, Sir Frederick Mappin Building, 4
Mappin Street, S1 3JD Sheffield, UK. 5
* CラヴヴWゲヮラミSキミェ ;デエラヴげゲ Wマ;キノぎ [email protected] Tel: +44 (0) 114 222 5729, Fax: +44 (0) 114 6
2225700 7
H I G H L I G H T S 8
• Non-uniform drying of rapid hardening overlays can lead to cracking and delamination. 9
• Mixes with CSA cement showed much lower shrinkage strains than mixes with RSC cement. 10
• RSC and FRSC mixes showed considerable autogenous shrinkage at the age of 60 days. 11
• FE analysis were used to predict shrinkage development using hygral contraction coefficient. 12
• Creep plays an important role in moderating stresses of overlays. 13
Abstract 14
This article investigates the time dependent transport properties and shrinkage performance of rapid 15
hardening plain and fibre reinforced mortars for repair applications. Two plain and two SFRC mixes 16
with 45 kg/m3 of recycled clean steel fibers made with rapid hardening cements (CSA - calcium 17
sulfoaluminate cement and RSC - calcium aluminate cement) are studied. It is found that mixes with 18
CSA cement have much lower shrinkage values (around 220 and 365 microstrains) compared to mixes 19
with RSC cement (around 2690 and 2530 microstrains), but most of the shrinkage in these mixes is 20
autogenous. Nonetheless, fibres reduce the drying shrinkage of RSC cement mixes by approximately 21
12%. Model code 2010 and ACI equations can be used to estimate the shrinkage development with 22
*Revised ManuscriptClick here to view linked References
2
time for these mixes provided suitable parameters for each cement type are adopted. Inverse analysis 23
using finite element method is successfully employed to determine the moisture diffusivity and the 24
hygral contraction coefficient of each mix. A comparison is made between the values of shrinkage 25
strain predicted by the numerical models over time, for different depths, and code equations. A simple 26
analytical procedure is used to assess cracking and/or delamination risks due to restrained shrinkage 27
for these materials in overlay applications. 28
Key words: SFRC, rapid hardening cements, shrinkage and transport properties, FE analysis 29
1. Introduction 30
Concrete overlays are extensively used in the repair and strengthening of concrete structures either 31
to replace damaged concrete or directly cast as a new layer. In both applications, moisture from the 32
fresh layer does not only diffuse to the environment, but also to the concrete substrate, resulting in 33
faster drying shrinkage. Shrinkage is restrained by the substrate layer leading to tensile and interfacial 34
shear stresses in the repair layer. These stresses, if they exceed material capacity, can lead to cracking 35
and/or debonding, accelerating the deterioration of the repairs [1]. The cracking potential of repairs 36
increases in rapid hardening materials that are often used to minimise disruption during repair works, 37
due to faster shrinkage rate [2] and lower creep compliance [3]. 38
Although fibres are reported to have a marginal effect in preventing shrinkage strains from developing 39
in concrete, they are used to control crack widths [4] as well as increase tensile strength and fatigue 40
resistance [5] in an attempt to achieve more durable repair layers. To reduce the environmental 41
impact of manufactured steel fibres (MSF), recycled clean steel fibres can also be used as alternative 42
fibre reinforcement [6, 7]. 43
Recycled clean steel fibres (RCSF) were obtained by recycling steel fibre cords, left over from the 44
manufacture of tyres. As a result, they have a consistent length as opposed to recycled tyre steel fibres 45
3
(RTSF) which are extracted mechanically from post-consumer tyres and, thus, have more variable 46
lengths. 47
Since crack width is one of the main parameters that governs the durability of repairs [8], a thorough 48
understanding of the effect of moisture movement and restraint from the substrate is needed to 49
predict crack development in concrete, a material which has widely varied and dynamic porosity 50
systems [9]. The moisture transport mechanism of cementitious mixes is complex and is the subject 51
of extensive research [9-17]. FRC mixes, however, have been studied to a lesser extent [15, 18]. It is 52
known that w/c ratio, cement content and cement type, directly affect moisture diffusion. Fibres may 53
also affect the moisture transport properties of concrete by changing the porosity structure and thus 54
their effect needs to be better understood. 55
Silfwerbrand [19] provided an analytical procedure to calculate the tensile and shear stresses that 56
develop in overlaid concrete layers and determine the risk of cracking and/or delamination. However, 57
this procedure does not calculate cracking widths, a vital aspect in predicting concrete performance. 58
Eurocode 2 (EC) [20], Model Code 2010 (MC) [21] and ACI 209.2R-08 (ACI) [22] provide procedures to 59
predict shrinkage strain evolution for concrete structures of certain cement types with good accuracy. 60
However, they do not account for rapid hardening cements for which often little information is 61
provided by manufacturers other than setting time and strength. They also do not consider the effect 62
of fibres on concrete shrinkage strain in the predictive equations. 63
This paper presents a detailed investigation on the time dependent transport properties and shrinkage 64
performance of rapid hardening plain and fibre reinforced mortars for repair applications. It starts by 65
reviewing the factors involved in diffusion and shrinkage of both plain and FRC mixes. It then presents 66
experimental work on moisture movement and shrinkage. The results are used in inverse analysis to 67
determine the moisture diffusion coefficient, surface factor and shrinkage hygral coefficient which are 68
needed to predict shrinkage performance. The available code procedures to predict the shrinkage of 69

4
these mixes over time are also evaluated and new factors for each cement type are proposed. The 70
Silfwerbrand procedure is then used to determine cracking and delamination risks. 71
2. Moisture diffusion and shrinkage 72
Moisture movement during drying of concrete is characterised by two stages; a constant drying rate 73
stage which is succeeded by a falling drying rate [12, 15, 23], depending on the degree of continuity 74
between liquid and vapour phases and on driving force variations [16]. At the beginning of drying, the 75
evaporation rate is constant and is approximately equal to the rate of evaporation of water exposed 76
to the same conditions [24-25]. As the cementitious material is fully saturated, there is no hydraulic 77
potential gradient to drive the moisture movement inside the porous medium and the internal vapour 78
pressure is equivalent to the saturated vapour pressure. However, at the boundary layer, there is a 79
pressure variation from saturated vapour pressure to ambient vapour pressure, driving moisture out 80
to the surrounding air. Moisture evaporation at the surface causes a slight reduction in vapour 81
pressure [16]. This small vapour pressure gradient is sufficient to cause moisture flow towards the 82
surface, since at this stage the hydraulic diffusivity is high [26]. As drying continues, moisture 83
decreases inside the material. Drying is still considered to be in stage one as long as the capillary 84
system is saturated. When the liquid phase becomes discontinuous upon further drying, a transition 85
from stage one to stage two takes place, at which diffusion of water vapour becomes the dominant 86
mechanism for moisture transport [26]. During this stage, the evaporation rate drops, as moisture is 87
only limited to movement of water vapour rather than liquid water diffusion [27] as is the case in the 88
first stage, and the vapour pressure falls below the saturation vapour pressure value. The moisture 89
content continues to decrease until vapour pressure reaches ambient level. Figure 1 shows a typical 90
cumulative moisture loss and evaporation rate during stage one and stage two for a cement paste 91
sample [15]. It is shown that during stage one, the drying behaviour is independent of capillary 92
microstructure [26]. In a study performed by Bakhashi & Mobasher [15] to investigate the effect of 93

5
curing time on the diffusion characteristics of cement paste, it was found that the moisture loss was 94
substantially reduced by curing the cement paste for 24 hours and the transition from stage one to 95
stage two took place quicker compared to non-cured samples. This can be attributed to 96
microstructural and pore distribution changes with additional hydration. It can be argued that for fast 97
setting materials, stage one is expected to be much shorter than for conventional mortar, as most 98
hydration takes place during the first few hours and phase transition happens faster. This will be 99
investigated in this paper to understand the role of cement type on diffusion properties. 100
101
Figure 1. Typical cumulative moisture loss and evaporation rate of a cement paste sample versus time: (a) in 102
linear scale; (b) in log scale [15] 103
FキIニげゲ ゲWIラミS ノ; (Equation 1) can be used to model moisture movement in concrete for various stages 104
of drying, with a moisture diffusivity that represents liquid and vapour diffusion [16]. 105
擢寵擢痛 噺 経 擢鉄寵擢諜鉄 Equation 1 106
where C is the moisture concentration (kg/m3), D is the moisture diffusion coefficient (m2/s) and t is 107
time (s). 108

6
As the moisture transfer equations are analogous to heat transfer equations and heat transfer analysis 109
is readily available in FEA packages, this analogy is often exploited for moisture transfer studies [16, 110
18, 28]. 111
Another important factor in moisture distribution problems is the surface factor or convective factor 112
(虚). This factor determines the moisture exchange between the concrete surface and the atmosphere. 113
It depends on several other factors like the w/c ratio [11] and wind speed [29]. A wide range of surface 114
factors is reported in literature [(0.75-7.5 mm/day [11]), 18, 29]. However, this parameter can be 115
determined by inverse analysis for specific mortar mixes to improve the accuracy of the predicted 116
moisture distribution. 117
The hydro-shrinkage coefficient (also called hygral contraction coefficient) is a factor that links free 118
shrinkage strain to moisture content. It is a unique material property for each mix type. An exponential 119
relationship was found by Ayano and Wittmann [13] while Huang et al. [28] used a linear relationship 120
to simulate non-linear shrinkage in box girders. This factor can also be obtained through inverse 121
analysis. 122
3. Experimental program 123
3.1. Mix proportions 124
Two plain and two SFRC mixes with 45 kg/m3 (Vf = 0.57%) of recycled clean steel fibres (RCSF) were 125
investigated in this study, details of which are given in Table 1. Two commercial cement types were 126
used: calcium sulfoaluminate cement (CSA); and rapid setting calcium aluminate cement (RSC). River 127
washed sand (0-5mm, SG=2.65) was used as fine aggregates. The length of the RCSF used in this study 128
is 21 mm and the diameter is 0.2 mm. Further details on the mixes and material characteristics are 129
given elsewhere [6]. 130

7
Table 1 131
Mix proportions 132
Mix Cement
(kg/m3) w/c SPa
Sand
(kg/m3)
Fibre dosage
(kg/m3)
CSA はどど 0.40 どは 1420 ど
FCSA はどど 0.41 どはな 1420 ねの
RSC はどど 0.35 どに 1300 ど
FRSC はどど 0.36 どにな 1300 ねの a % by cement mass. 133
3.2. Flexural and Compressive strength 134
To characterize the flexural performance, mortar prisms of 40*40*160 mm were tested according to 135
BS EN 13892-2, (2002) [30] in displacement control to better capture the post-peak behaviour. A 136
specially designed aluminum yoke (based on the Japanese standard JSCE-SF4 [31]) was mounted on 137
the specimens. The prisms were tested at different ages ranging from one hour up to one year to 138
assess the flexural behaviour over time. After flexural testing, the two parts of the fractured prisms 139
were tested under uniaxial compressive loading according to BS EN 13892-2, (2002) [30]. The results 140
in terms of first cracking strength (fctm,fl) and compressive strength (fcu) (associated standard deviation 141
is given in brackets) are shown in Table 2. 142
Table 2 143
Flexural strength (fctm,fl) and compressive strength (fcu) for all mixes (MPa) 144
Time (Days)
FCSA
fctm,fl fcu
FRSC
fctm,fl fcu
CSA
fctm,fl fcu
RSC
fctm,fl fcu
(1hr) 0.0417 3.52 26.13 (4.61) 3.52 21.34 (3.04) 2.58 21.14 (2.96) 2.53 17.23 (1.92)
(3hrs) 0.125 6.76 31.55 (3.69) 3.54 28.29 (3.54) 3.98 26.92 (2.78) 2.86 24.16 (2.04)
1 6.46 36.60 (2.27) 4.98 37.92 (2.40) 4.34 31.75 (2.51) 3.54 33.01 (2.00)
7 8.18 41.05 (3.27) 5.54 46.16 (3.20) 5.30 35.97 (3.02) 4.22 40.38 (2.43)
28 8.67 43.13 (3.23) 5.65 51.52 (2.88) 5.37 38.62 (2.30) 4.39 46.51 (2.61)
365 8.67 45.47 (3.03) 5.63 54.49 (6.64) 5.40 40.90 (2.27) 4.48 48.09 (3.74)
145
3.3. Moisture measurement in mortars 146

8
To obtain the time history of the moisture profile, needed to obtain the moisture diffusivity of the 147
repair layers, the modified gravimetric method was adopted following the approach of Jafarifar [18]. 148
It involves casting all specimens at the same height and then cutting them at different depths before 149
putting them back together. Thus, the boundary condition from the underlying depth of the concrete 150
specimens is preserved by keeping both segments in contact for the duration of the measurements. 151
The specimens were cast in 200*50*50 mm steel moulds. After around the expected setting time, 152
water was added to the samples, while still in the moulds and they were covered with plastic sheets 153
to prevent moisture evaporation. The setting time of cement pastes was assessed by the authors [6] 154
using an automatic Vicat apparatus according to ASTM C191 (2013) [32]. The final setting time for CSA, 155
FCSA, RSC and FRSC were 10.5, 11, 14.5 and 15 minutes. After around 40 minutes of curing, the 156
samples were demoulded. Each prism was then immediately sliced into two segments at the 157
prescribed depths of 10, 20, 30 mm, under wet conditions. Their weights were recorded, and the 158
specimens were directly wrapped with cling film and sealed using a high performance ply laminated 159
plastic foil tape. The surfaces 1-5 for the bottom segment and 1-4 for the upper part of the sliced 160
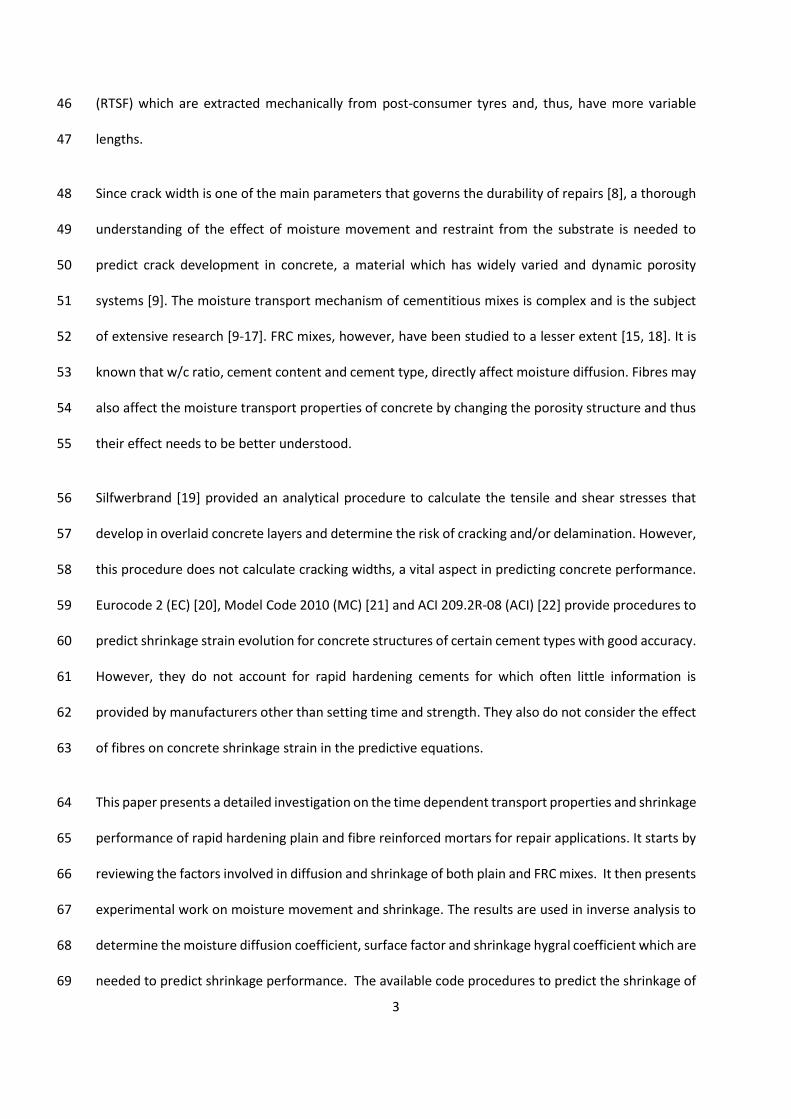
specimens were sealed separately [Figure 2], creating one dimensional drying conditions. 161
162
Figure 2. Sealing specimens for the modified gravimetric method 163
After each weight measurement, the two segments were assembled back together [Figure 2] and the 164
joint was sealed using a new plastic tape [Figure 2]. The weight measurements were taken at one hour 165
9
and a half, three hours, one day and every day for one week. They were then recorded every week for 166
one month and monthly for four months. After four months, the specimens were unwrapped and 167
dried in the oven for ten days at 70 C0. After that, the two parts of each prism were weighed. The 168
details of how to determine the moisture content at each depth over time is given in [11,18]. 169
170
3.4 Free shrinkage measurement 171
The ASTM C157/C157M (2008) standard [33] for measuring shrinkage of mortars adopts prisms of 172
dimension of 25*25*285 mm. However, due to the use of fibres with a length of 21 mm and to 173
minimize the boundary effects, it was decided to use bigger prisms of 40*40*160 mm instead. As for 174
the specimens used for moisture transport studies, the specimens were cured for around 40 minutes 175
in the moulds. After the curing, the specimens were demolded and demec points were attached to 176
them. The total number of shrinkage samples for each mix was six prisms. Three prisms were kept in 177
an environmental chamber with a relative humidity of 40±3% and temperature of 21±2 C0 to measure 178
the total shrinkage while the other three prisms were wrapped in cling film and left in a mist room to 179
measure their autogenous shrinkage. After that, they were only unwrapped to take measurements. 180
Shrinkage was measured on both faces of each prism using a 100 mm Demec gauge. The shrinkage 181
measurements started at one hour and a half and continued at frequent time intervals up to 120 days. 182
4. Experimental results and discussion 183
4.1. Moisture measurements 184
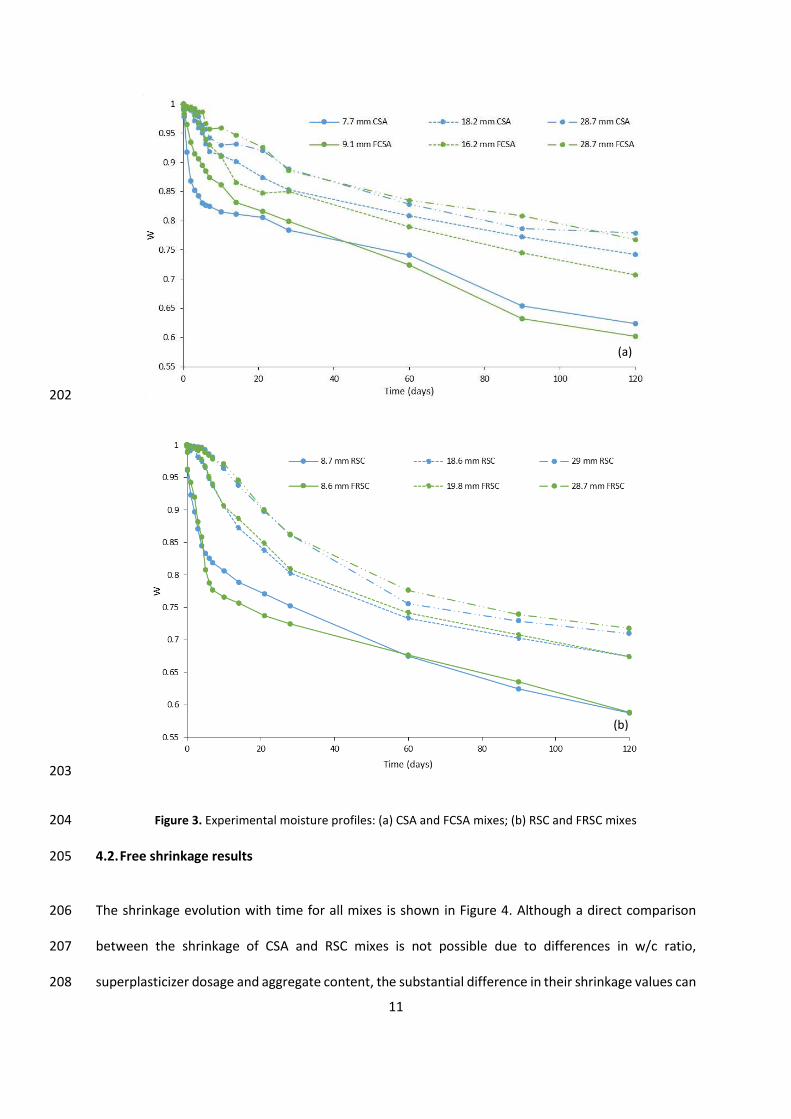
The time history of moisture content for each mix is shown in Figure 3. Each curve represents the 185
mean value of two samples. The results confirm that drying is non-uniform across the depth of the 186
specimens with faster drying at the top. For all the mixes, the water content of the upper layer ranges 187

10
between 0.59 に 0.62 compared with 0.67 に 0.78 for the lower layers. 188
At the beginning of drying, the rate of drying is relatively faster for RSC and FRSC mixes compared to 189
specimens with CSA and FCSA mixes. However, the rate of drying slows down towards the end of the 190
drying period. The experimental moisture profiles are used in the following section to back calculate 191
moisture diffusivity and surface factor for each mix. 192
Although literature states that fibre may affect the moisture transport properties of concrete, in this 193
article, however, the fibre inclusion was confirmed not to have a major role on the moisture transport 194
properties of rapid hardening mortar mixes, which allows the use of the MC equation [21], that is 195
usually used to estimate the moisture diffusivity of plain concrete, to calculate their moisture 196
diffusivities. 197
198
199
200
201
11
202
203
Figure 3. Experimental moisture profiles: (a) CSA and FCSA mixes; (b) RSC and FRSC mixes 204
4.2. Free shrinkage results 205
The shrinkage evolution with time for all mixes is shown in Figure 4. Although a direct comparison 206
between the shrinkage of CSA and RSC mixes is not possible due to differences in w/c ratio, 207
superplasticizer dosage and aggregate content, the substantial difference in their shrinkage values can 208
(a)
(b)
12
mainly be attributed to the different cement types. As expected, mixes with CSA cement showed much 209
lower shrinkage strains than mixes with RSC cement. This is due to the expansive nature of their 210
hydration products [34] and their higher water consumption during hydration [35]. For RSC cement, 211
the reaction of its main component, monocalcium aluminate (CA), with water results in CAH10 and 212
C2AH8 as the main hydration products as in Equation 2 and Equation 3 [36]: 213
系畦 髪 など茎 蝦 系畦茎怠待 Equation 2 214
に系畦 髪 なは茎 蝦 系態畦茎腿 髪 畦茎戴 Equation 3 215
The subsequent conversion reactions of the metastable phases to the stable phases are: 216
にCAH怠待 蝦 C態AH腿 髪 AH戴 髪 ひH Equation 4 217 ぬC態AH腿 蝦 にC戴AH滞 髪 AH戴 髪 ひH Equation 5 218
While for CSA cement, the main crystalline hydration products (ettringite and monosulfate) require 219
more water to form as per Equation 6 and Equation 7 [35]: 220
C替A戴S 髪 なぱH 蝦 C戴A CS なにH 髪 にAH戴 Equation 6 (monosulfate formation) 221 C替A戴S 髪 にCSH態 髪 ぬねH 蝦 C戴A ぬCS ぬにH 髪 にAH戴 Equation 7 (ettringite formation) 222
If less free water is available for drying, then less drying shrinkage can occur. 223
FCSA develops higher shrinkage strains compared to CSA at all ages. It is known that fibre inclusion 224
introduces air in the mix [18, 37]. Also, the water content and SP dosage are higher for FCSA compared 225
to CSA mix which can contribute to the higher recorded shrinkage values. 226
The provisions of EC, MC and ACI code were followed to obtain the shrinkage development of CSA and 227
FCSA mixes with time. Both EC and MC require defining parameters üSゲ1 and üSゲ2 which depend on 228
cement type. For the cements used, these parameters were obtained by nonlinear regression analysis. 229
The ACI requires defining the ultimate shrinkage strain ɸshu. This value was obtained by multiplying the 230
cumulative product of the correction parameters (sh, as defined in [22]) by a factor P, obtained by 231
13
non-linear regression analysis. The predicted and experimental free shrinkage strain for CSA and FCSA 232
are given in Figure 5. As shown, the codes can predict the shrinkage evolution of these mixes 233
reasonably well provided suitable parameters for cement type are used. 234
The autogenous shrinkage strains obtained for both CSA and FCSA sealed specimens were very small 235
which indicates that some expansive reactions took place and, hence, not shown in Figure 4. On the 236
other hand, both RSC and FRSC mixes showed considerable autogenous shrinkage, 1644 н0 and 1722 237
н0 at the age of 60 days respectively, which accounts for about 64 % and 71% of their total shrinkage 238
at this age, respectively. Mixes with RSC cement has higher compressive strength compared to CSA 239
cement mixes. Autogenous shrinkage is known to be directly related to compressive strength. In 240
addition to, RSC has higher cement fineness that can increase the shrinkage [38]. High autogenous 241
shrinkage can also be attributed to conversion of RSC cement. Nevertheless, no compressive strength 242
reduction was noticed for RSC and FRSC specimens stored in the same conditions [6]. 243
By examining further the RSC and FRSC results, it can be seen that drying shrinkage cannot be obtained 244
by simply deducting autogenous shrinkage from the total shrinkage as the autogenous shrinkage 245
continues at a faster rate than drying, possibly because drying affects the nature of the hydration 246
reactions [39]. Thus, an alternative method is needed to derive the drying shrinkage. MC relates the 247
autogenous shrinkage (shrAuto) to the compressive strength at 28 days and to the type of cement. 248

14
249
Figure 4. Experimental shrinkage development for all mixes with time 250
251
Figure 5. Experimental shrinkage of CSA and FCSA prisms and their predicted values based on MC, EC and ACI 252
code 253
As the hydration reactions directly affect the strength development, these methods can be used to 254
CSA

15
predict ShrAuto for RSC and FRSC using the compressive strength of the sealed specimens, provided 255
that ɲďƐ (a factor that is a function of cement type) is accurately calculated. The resulting shrAuto for 256
RSC and FRSC, following the MC approach and regression analysis is shown in Figure 6. The optimised 257
ɲďƐ along with the compressive strength at 28 days of drying samples were used to predict the 258
autogenous shrinkage component from the total shrinkage strain. FRSC has slightly higher autogenous 259
shrinkage (4.79 %) than RSC prisms, likely due to its higher compressive strength. 260
The drying shrinkage is obtained by subtracting shrAuto from the total strain. The MC was also used to 261
predict the drying shrinkage by assigning suitable üSゲ1 ;ミS üSゲ2 for RSC and FRSC, see Figure 7. 262
Although the ACI code does not consider separate components of shrinkage, it can also be used to 263
predict the total shrinkage (Figure 7). The shrinkage parameters used to estimate shrinkage for each 264
mix based on the different codes are listed in Table 3. 265
Table 3 266
Shrinkage parameters for various mixes 267
Mixes
Codes
MC EC ACI
üSゲ1 üSゲ2 üSゲ1 üSゲ2 P ü
CSA 0.1 0.012 0.29 0.11 108 1.32
FCSA 1.7 0.012 0.77 0.009 180 1.32
268
Mixes
Codes
MC ACI
ShrAuto ShrDry ShrTotal
üHゲ üds1 üSゲ2 P ü
RSC 17900 7 0.004 1320 1.65
FRSC 16780 5 0.004 1260 1.63
269
16
270
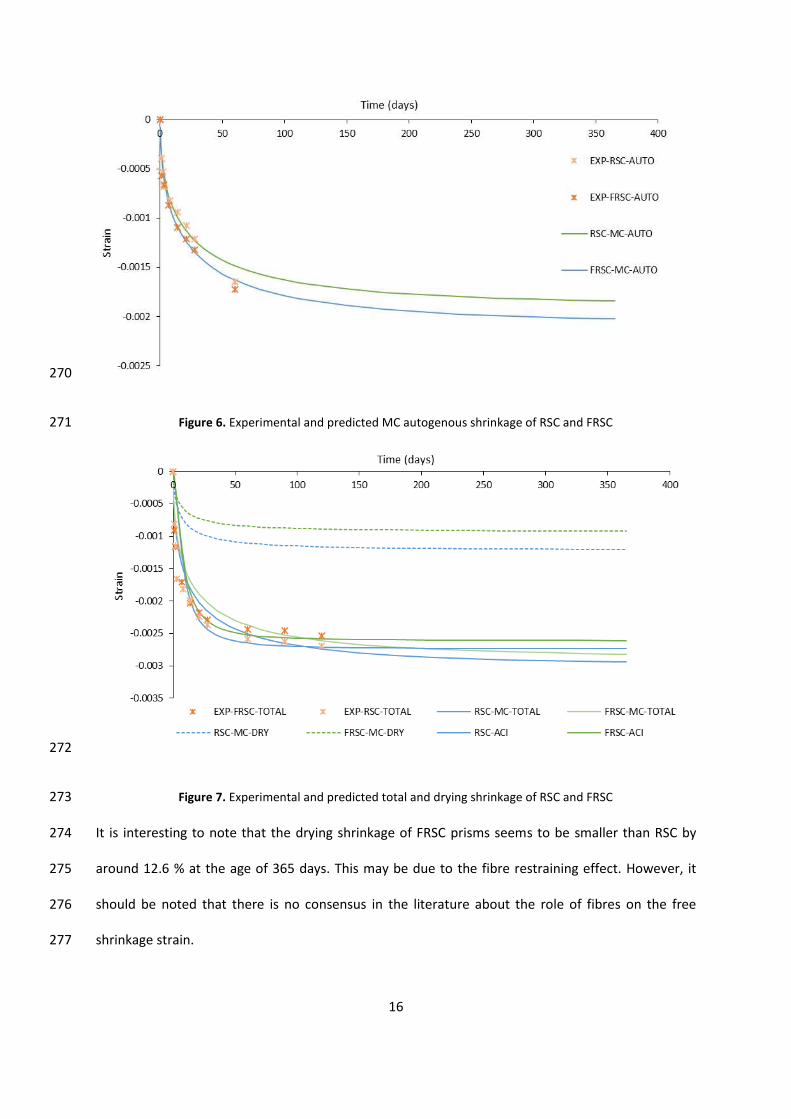
Figure 6. Experimental and predicted MC autogenous shrinkage of RSC and FRSC 271
272
Figure 7. Experimental and predicted total and drying shrinkage of RSC and FRSC 273
It is interesting to note that the drying shrinkage of FRSC prisms seems to be smaller than RSC by 274
around 12.6 % at the age of 365 days. This may be due to the fibre restraining effect. However, it 275
should be noted that there is no consensus in the literature about the role of fibres on the free 276
shrinkage strain. 277
17
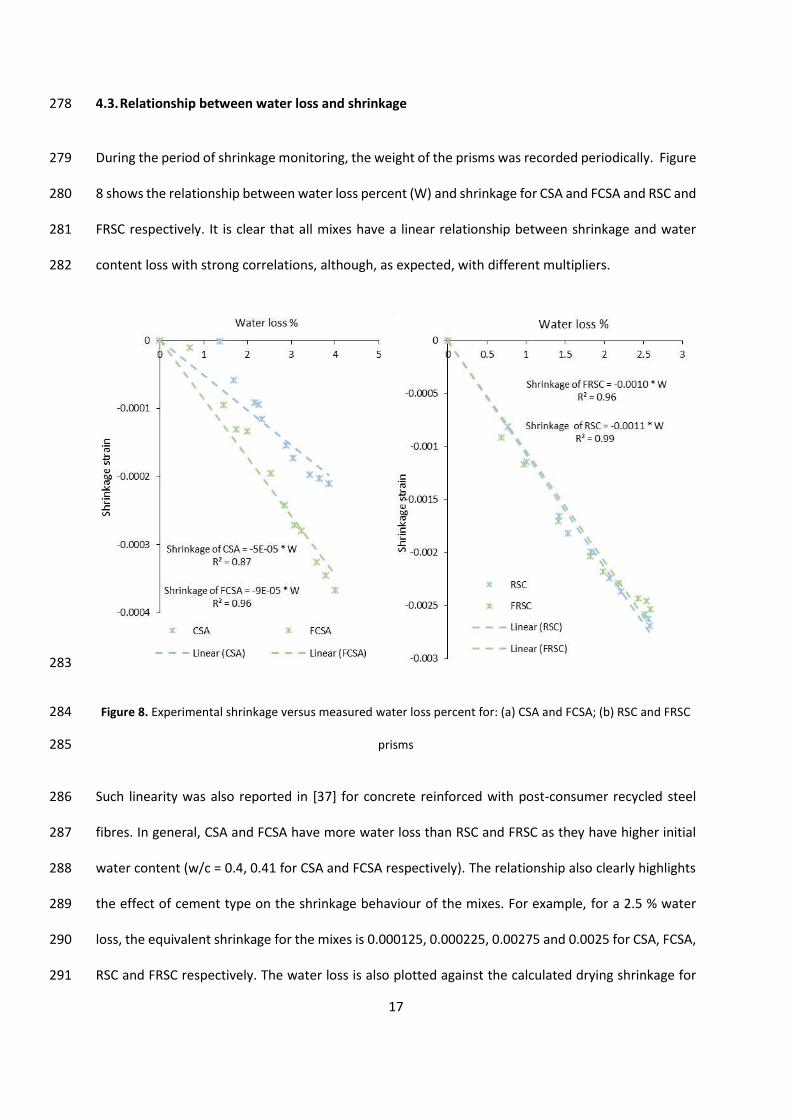
4.3. Relationship between water loss and shrinkage 278
During the period of shrinkage monitoring, the weight of the prisms was recorded periodically. Figure 279
8 shows the relationship between water loss percent (W) and shrinkage for CSA and FCSA and RSC and 280
FRSC respectively. It is clear that all mixes have a linear relationship between shrinkage and water 281
content loss with strong correlations, although, as expected, with different multipliers. 282
283
Figure 8. Experimental shrinkage versus measured water loss percent for: (a) CSA and FCSA; (b) RSC and FRSC 284
prisms 285
Such linearity was also reported in [37] for concrete reinforced with post-consumer recycled steel 286
fibres. In general, CSA and FCSA have more water loss than RSC and FRSC as they have higher initial 287
water content (w/c = 0.4, 0.41 for CSA and FCSA respectively). The relationship also clearly highlights 288
the effect of cement type on the shrinkage behaviour of the mixes. For example, for a 2.5 % water 289
loss, the equivalent shrinkage for the mixes is 0.000125, 0.000225, 0.00275 and 0.0025 for CSA, FCSA, 290
RSC and FRSC respectively. The water loss is also plotted against the calculated drying shrinkage for 291

18
RSC and FRSC specimens (Figure 9). This relationship is essential when introducing shrinkage in FE 292
modeling through the hygral contraction coefficient 293
294
Figure 9. Calculated drying shrinkage versus measured water loss percent for RSC and FRSC prisms 295
5. Numerical studies 296
5.1. Numerical analysis approach 297
Heat transfer analysis available in FE package Abaqus was used to model moisture diffusion during 298
drying. For this analysis, two parameters are essential; moisture diffusion and surface factor. The MC 299
uses an equation that relates moisture diffusivity to relative humidity. As from the measurements 300
taken only the normalized moisture content can be determined, this parameter is adopted instead of 301
relative humidity as shown in Equation 8. 302
経岫系津墜追陳岻 噺 経怠岫糠 髪 怠貸底怠袋岾迭貼頓韮任認尿迭貼頓迩 峇韮岻 Equation 8 303
Where: 304
D1 is the max diffusion coefficient when Cnorm equals 1.0 and the samples are fully saturated (D1 = 1 305
19
× 10-8/fck, fck = characteristic concrete strength), 306
ü represents the ratio D0/D1; D0 is the minimum D, Cc is the normalised moisture concentration at 307
D(Cnorm) = 0.5D1. 308
The MC suggested values of ü Э ヰくヰヵが Cc = 0.8 and n = 15 were initially used to calculate the diffusion 309
coefficient. The resultant D(Cnorm) for each mix was then adopted in the heat transfer analysis. 310
Diffusive heat transfer 20-node quadratic brick elements (DC3D20) were used for the thermal analysis. 311
As in the experiments, drying was only permitted through the top surface, which was assigned a 312
surface factor, and the other surfaces were considered sealed having no moisture interaction with the 313
environment. At the beginning of the drying, the normalised moisture concentration was 100% and 314
the ambient relative humidity was considered constant at 40%. Initial values of the parameters for 315
model code model of D(Cnorm) as well as surface factors were optimized (Table 4) to minimize the 316
difference between numerical and experimental moisture profile of each mix. 317
To calculate shrinkage deformations, the thermal analysis was coupled with a structural analysis in 318
which the thermal expansion is replaced by a hygral contraction coefficient. C3D20R element type was 319
used for the structural analysis. The tensile and compressive material characteristics were obtained 320
from the experimental results and inverse analysis studies; further details on the procedures used are 321
given elsewhere [6]. To accurately predict the shrinkage history, the development of the material 322
properties with time was incorporated into the structural analysis through the implementation of the 323
user subroutine, USDFLD. This allows the use of solution-dependent material properties and thus the 324
user can define the field variables at a material point as a function of time [40]. The hygral coefficient 325
was optimized to minimize the difference between measured experimental and FE predicted 326
shrinkage strain. 327
5.2. Numerical results and discussion 328
20
5.2.1. Determination of moisture diffusivities and surface factor 329
The set of parameters implemented in MC 330
equation (Equation 8) [21] to determine the 331
moisture diffusivity coefficient for each mix 332
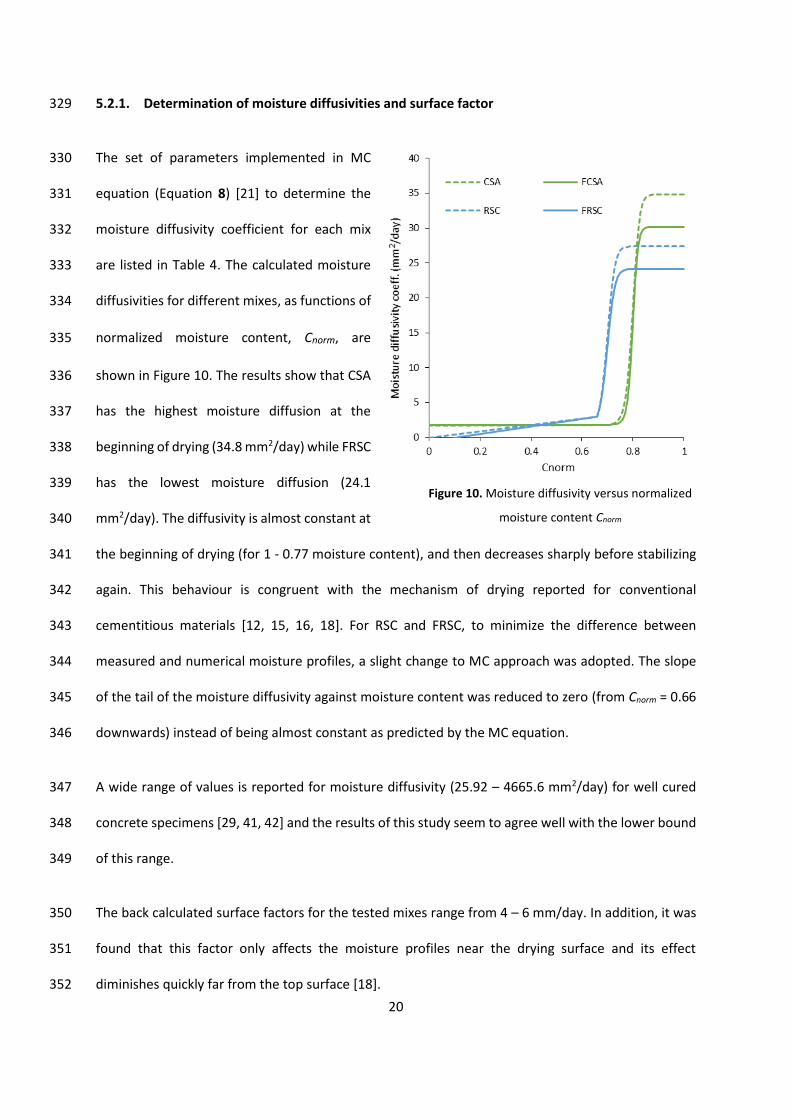
are listed in Table 4. The calculated moisture 333
diffusivities for different mixes, as functions of 334
normalized moisture content, Cnorm, are 335
shown in Figure 10. The results show that CSA 336
has the highest moisture diffusion at the 337
beginning of drying (34.8 mm2/day) while FRSC 338
has the lowest moisture diffusion (24.1 339
mm2/day). The diffusivity is almost constant at 340
the beginning of drying (for 1 - 0.77 moisture content), and then decreases sharply before stabilizing 341
again. This behaviour is congruent with the mechanism of drying reported for conventional 342
cementitious materials [12, 15, 16, 18]. For RSC and FRSC, to minimize the difference between 343
measured and numerical moisture profiles, a slight change to MC approach was adopted. The slope 344
of the tail of the moisture diffusivity against moisture content was reduced to zero (from Cnorm = 0.66 345
downwards) instead of being almost constant as predicted by the MC equation. 346
A wide range of values is reported for moisture diffusivity (25.92 に 4665.6 mm2/day) for well cured 347
concrete specimens [29, 41, 42] and the results of this study seem to agree well with the lower bound 348
of this range. 349
The back calculated surface factors for the tested mixes range from 4 に 6 mm/day. In addition, it was 350
found that this factor only affects the moisture profiles near the drying surface and its effect 351
diminishes quickly far from the top surface [18]. 352
Figure 10. Moisture diffusivity versus normalized
moisture content Cnorm

21
Table 4 353
Optimised parameters for MC equation and inverse analysis 354
Mix
Optimised parameters of Equation 8
SF é(C) D1 ü Cc n
CSA 34.801 0.05 0.8 15 5 0.00038
FCSA 30.146 0.06 0.8 20 6 0.00065
RSC 27.399 0.035 0.7 20 4 0.0048
FRSC 24.139 0.05 0.7 20 4 0.0045
355
5.2.2. Determination of the hygral contraction coefficient 356
The hygral contraction coefficients for the mixes were back-calculated as functions of moisture 357
content, C, using the free shrinkage test results. It was found that there is a strong linear relationship 358
between shrinkage strain and moisture loss (Section 4.3), Equation 9. 359
岫綱鎚朕岻暢 噺 紅岫寵岻 抜 岫系待 伐 系岻 Equation 9 360
Where (sh)M is the free shrinkage strain, é(C) is the contraction coefficient and C0 is the reference 361
moisture content, 1.0. It should be noted that since both the total and drying shrinkage of RSC and 362
FRSC show a linear relationship with water loss, the total shrinkage for samples of these mixes was 363
modeled using a single hygral contraction coefficient. The calculated values of é(C) are listed in Table 364
4. As expected, mixes with calcium aluminate cement (CSA and FCSA) have much smaller contraction 365
coefficient compared to the other mixes. However, for FCSA, é(C) is approximately 70% higher than 366
that of CSA. This increase of shrinkage due to fibre addition is much higher than reported in literature. 367
Nonetheless, those studies are only limited to Portland cement with/without pozzolanic additions. 368
The value of é(C) for FRSC is slightly lower than that of RSC, possibly due to the restraining effect of the 369
fibres at the large shrinkage strains developed. 370
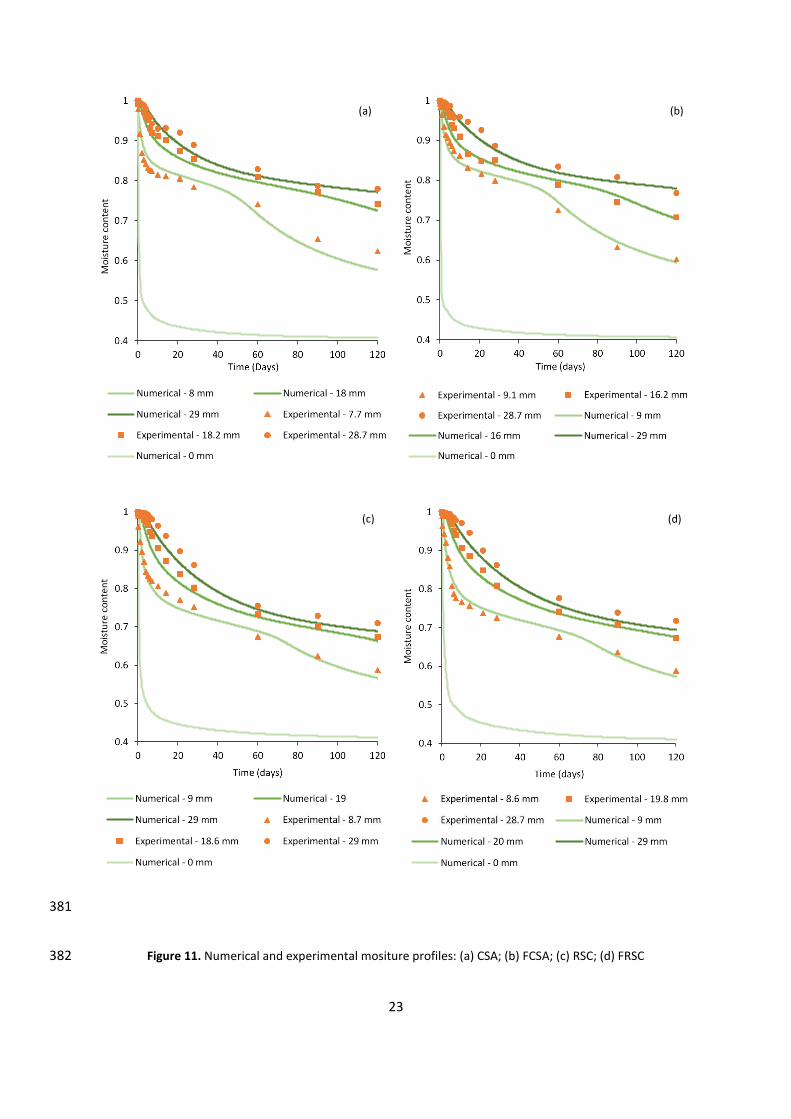
5.2.3. Numerical moisture profiles: Results and Discussion 371
22
The numerical and experimental moisture profiles are compared in Figure 11. As it can be seen, the 372
heat transfer analysis based on moisture diffusivities, calculated based on MC equation, predicts well 373
the experimental moisture profiles with less than 5% difference. 374
5.2.4. Numerical shrinkage strain 375
The development of shrinkage strain with time, using parameters calculated in the previous sections, 376
is compared to the experimental curves in Figure 12. As seen in Figure 12, the FE analysis satisfactorily 377
represents the measured shrinkage, validating the factors adopted in the analysis. 378
379
380
23
381
Figure 11. Numerical and experimental mositure profiles: (a) CSA; (b) FCSA; (c) RSC; (d) FRSC 382
(a) (b)
(c) (d)

24
383
Figure 12. Numerical free shrinkage strain compared with experimental results: (a) CSA & FCSA; (b) RSC & FRSC 384
385
(b)
(a)
(b)
25
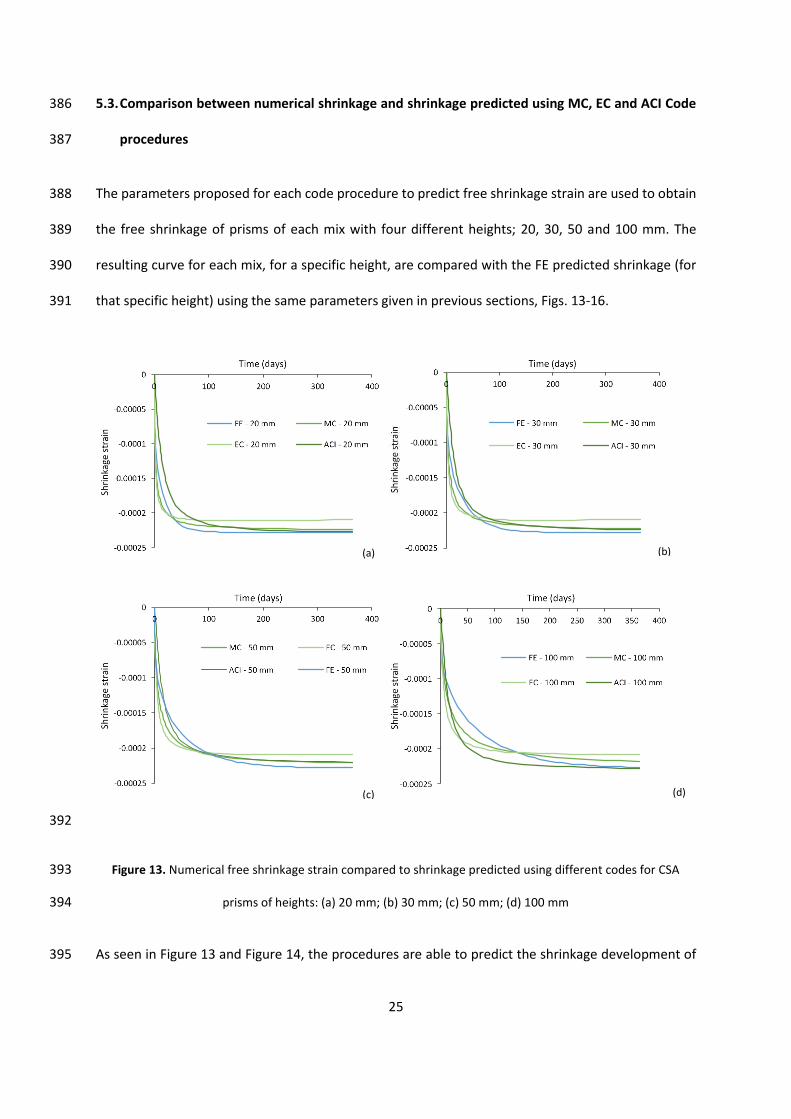
5.3. Comparison between numerical shrinkage and shrinkage predicted using MC, EC and ACI Code 386
procedures 387
The parameters proposed for each code procedure to predict free shrinkage strain are used to obtain 388
the free shrinkage of prisms of each mix with four different heights; 20, 30, 50 and 100 mm. The 389
resulting curve for each mix, for a specific height, are compared with the FE predicted shrinkage (for 390
that specific height) using the same parameters given in previous sections, Figs. 13-16. 391
392
Figure 13. Numerical free shrinkage strain compared to shrinkage predicted using different codes for CSA 393
prisms of heights: (a) 20 mm; (b) 30 mm; (c) 50 mm; (d) 100 mm 394
As seen in Figure 13 and Figure 14, the procedures are able to predict the shrinkage development of 395
(b) (a)
(c) (d)
26
CSA and FCSA samples, respectively, over time with reasonable accuracy, especially for thinner 396
sections. The MC seems to offer the best estimate at both the beginning and the end of drying. 397
However, EC appears to slightly overestimate the shrinkage at the beginning of drying while 398
underestimates it towards the end of the testing period. 399
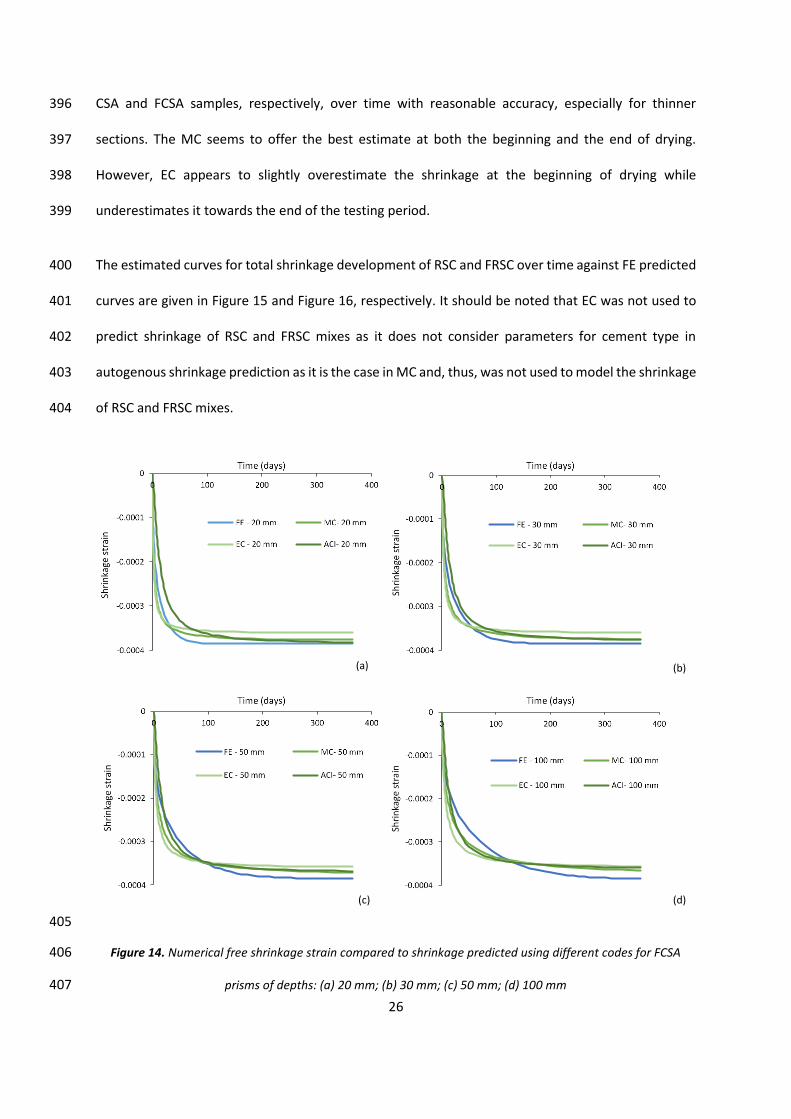
The estimated curves for total shrinkage development of RSC and FRSC over time against FE predicted 400
curves are given in Figure 15 and Figure 16, respectively. It should be noted that EC was not used to 401
predict shrinkage of RSC and FRSC mixes as it does not consider parameters for cement type in 402
autogenous shrinkage prediction as it is the case in MC and, thus, was not used to model the shrinkage 403
of RSC and FRSC mixes. 404
405
Figure 14. Numerical free shrinkage strain compared to shrinkage predicted using different codes for FCSA 406
prisms of depths: (a) 20 mm; (b) 30 mm; (c) 50 mm; (d) 100 mm 407
(b) (a)
(c) (d)

27
As shown, for very thin sections, ACI offers slightly better predictions of shrinkage development with 408
time compared to MC. At thicker sections, however, the MC seems to better capture the shrinkage 409
history as ACI tends to overestimate the shrinkage development at the beginning of the testing and 410
rather underestimates the shrinkage at later stages. 411
412
Figure 15. Numerical free shrinkage strain compared to shrinkage predicted using different codes for RSC 413
prisms of heights: (a) 20 mm; (b) 30 mm; (c) 50 mm; (d) 100 mm 414
415
416
(a) (b)
(c) (d)

28
417
Figure 16. Numerical free shrinkage strain compared to shrinkage predicted using different codes for FRSC 418
prisms of heights: (a) 20 mm; (b) 30 mm; (c) 50 mm; (d) 100 mm 419
6. Case studies 420
To assess the risk of cracking and/or delamination due to restrained shrinkage in repair layers 421
prepared from the mixes developed in this study, the Silfwerbrand procedure [19] is followed. This 422
requires knowing the free shrinkage of the overlay, the elastic modulus of the overlay layer and the 423
substrate concrete as well as the tensile strength of the repair layer. The interface shear strength and 424
the bond coefficient (K) should also be known. 425
(d) (c)
(a) (b)

29
To assess the risk of cracking and/or delamination, at one-year of age, the bonding conditions shown 426
in Table 5 are considered. A layer with dimensions of 50*150*1000 mm is overlaid above an old 427
concrete substrate with 200*150*1000 mm. The analysis is run twice for each mix; with and without 428
creep in the overlay. When considering creep, the stresses were calculated by using the modulus of 429
elasticity modified by creep coefficients. The creep coefficients were calculated based on the 430
recommendations of MC 2010 [21]. As the substrate is already a few years old, it is considered 431
conservative to neglect its creep deformations. 432
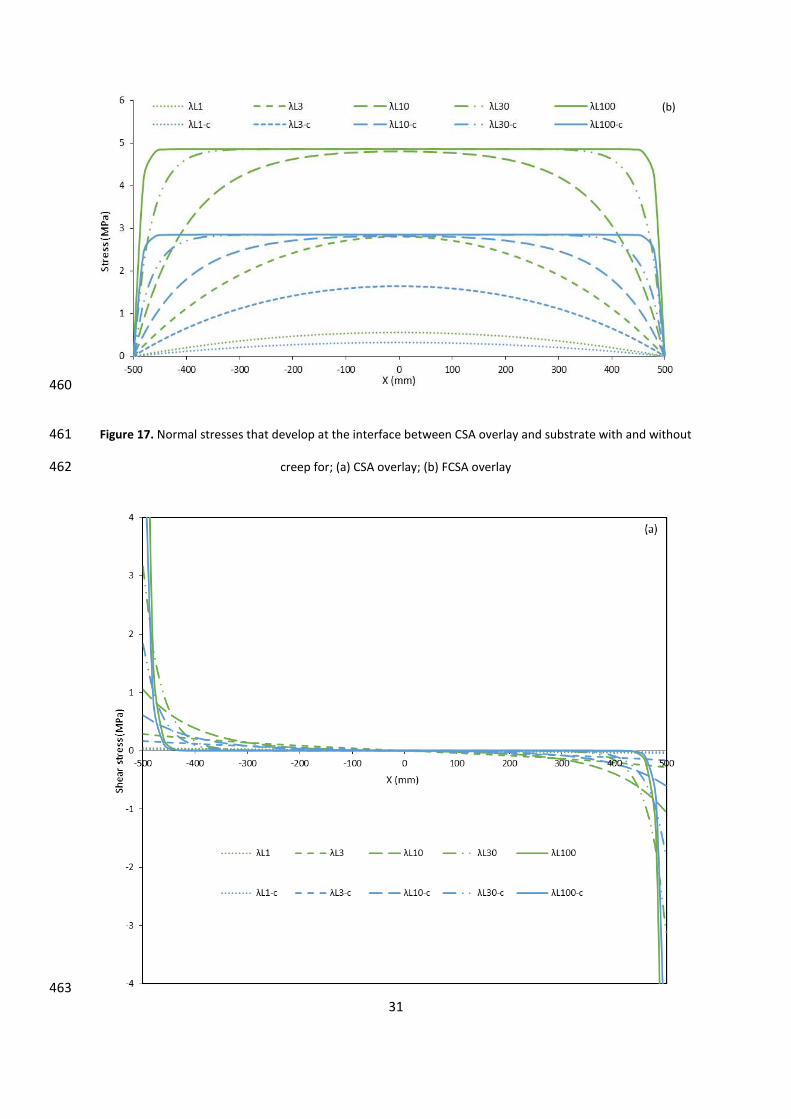
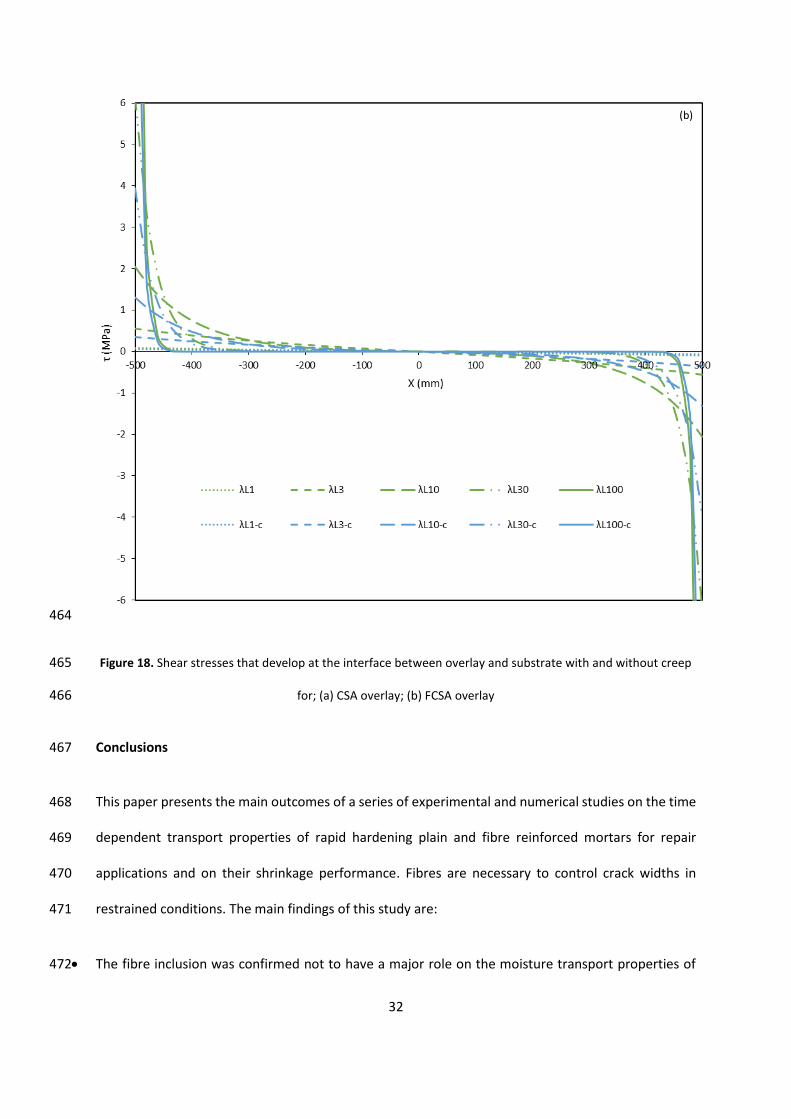
The calculated tensile stresses for CSA and FCSA overlaid prisms are shown in Fig. 17 while the shear 433
stresses that develop at the interface are presented in Fig. 18 for different bond conditions. The effect 434
of creep is also shown (curves labelled -c). 435
Table 5 436
Material properties used for the case studies 437
Layer type Ec (GPa) Tensile strength
(MPa) ゜L
Substrate 35 ------ 1
CSA 21.73 3.30 3
FCSA 28.00 4.00 10
RSC 20.56 3.02 30
FRSC 26.11 3.3 100
As shown in Figure 17 and Figure 18, neglecting creep leads to an overestimation of both tensile and 438
shear stresses. When considering creep, for both CSA and FCSA overlays, the maximum tensile stress 439
that develops at the interface is lower than the overlay tensile strength and thus it is predicted that 440
cracking is unlikely to develop. However, for the strongest bond condition assumed (゜L=100), high 441
values of shear stresses develop with 6.11 MPa and 13.15 MPa for CSA and FSCA, respectively, at the 442
edge of the composite prism, implying delamination if the shear strength at the interface is assumed 443
to be similar to the tensile strength of concrete for well-prepared surfaces. For smaller ゜L, low shear 444
stresses developed and thus the risk of delamination is lower (see Figure 18). 445
30
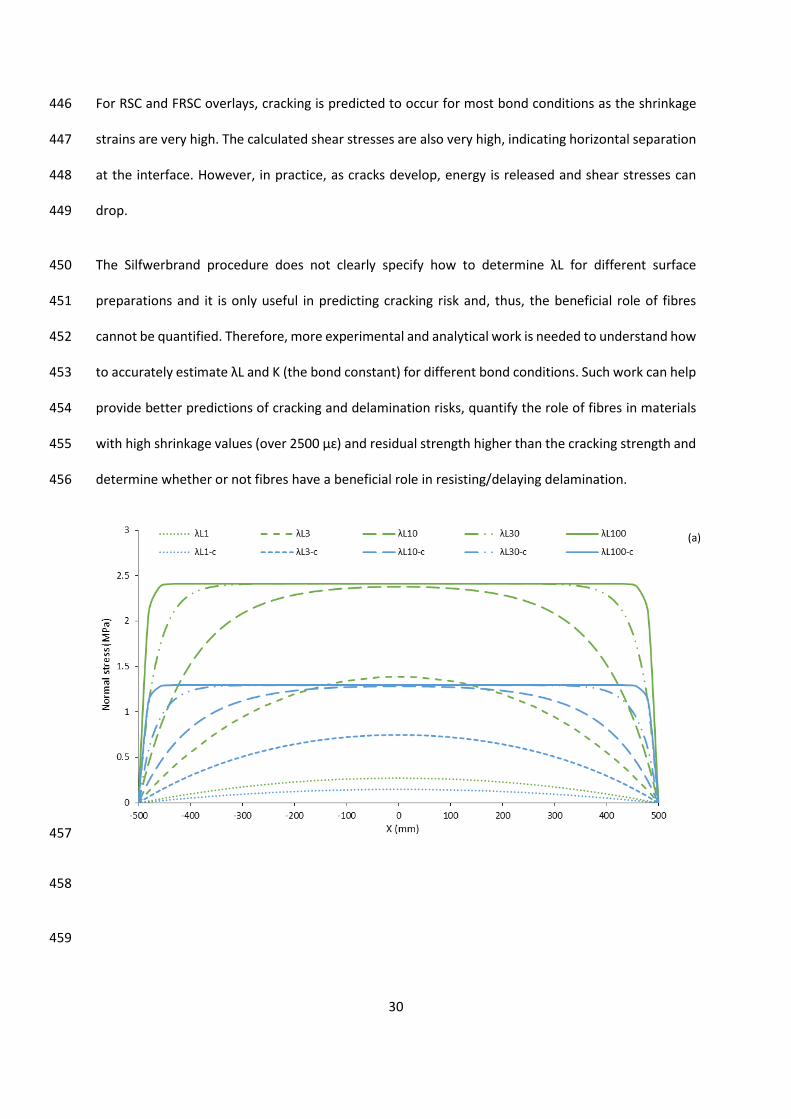
For RSC and FRSC overlays, cracking is predicted to occur for most bond conditions as the shrinkage 446
strains are very high. The calculated shear stresses are also very high, indicating horizontal separation 447
at the interface. However, in practice, as cracks develop, energy is released and shear stresses can 448
drop. 449
The Silfwerbrand procedure does not clearly specify how to determine ゜L for different surface 450
preparations and it is only useful in predicting cracking risk and, thus, the beneficial role of fibres 451
cannot be quantified. Therefore, more experimental and analytical work is needed to understand how 452
to accurately estimate ゜L and K (the bond constant) for different bond conditions. Such work can help 453
provide better predictions of cracking and delamination risks, quantify the role of fibres in materials 454
with high shrinkage values (over 2500 н坐ぶ ;ミS ヴWゲキS;ノ ゲデヴWミェデエ higher than the cracking strength and 455
determine whether or not fibres have a beneficial role in resisting/delaying delamination. 456
457
458
459
(a)
31
460
Figure 17. Normal stresses that develop at the interface between CSA overlay and substrate with and without 461
creep for; (a) CSA overlay; (b) FCSA overlay 462
463
(b)
32
464
Figure 18. Shear stresses that develop at the interface between overlay and substrate with and without creep 465
for; (a) CSA overlay; (b) FCSA overlay 466
Conclusions 467
This paper presents the main outcomes of a series of experimental and numerical studies on the time 468
dependent transport properties of rapid hardening plain and fibre reinforced mortars for repair 469
applications and on their shrinkage performance. Fibres are necessary to control crack widths in 470
restrained conditions. The main findings of this study are: 471
• The fibre inclusion was confirmed not to have a major role on the moisture transport properties of 472
(b)

33
rapid hardening mortar mixes, which allows the use of the MC equation, usually used to estimate the 473
moisture diffusivity of plain concrete, to calculate their moisture diffusivities with good accuracy. 474
• Mixes with CSA cement showed much lower shrinkage strains (211 and 367 µ坐) compared to mixes 475
with RSC cement (2690 and 2532 µ坐) at 120 days. Unlike CSA and FCSA, RSC and FRSC mixes showed 476
considerable autogenous shrinkage which accounts for around 64 % and 71% of their total shrinkage 477
at the age of 60 days. 478
• FE analyses were used in combination with experimental moisture distribution measurements to back 479
calculate the moisture diffusivity of the tested mixes. It was found that the moisture diffusivities for 480
mixes with rapid hardening cements are high at the beginning of drying (34.8 に 24.14 mm2/day) and 481
remain almost constant up to moisture contents of 85% - 75%, for different mixes, then sharply 482
decreases upon further drying. 483
• There is a linear relationship between shrinkage and moisture loss for all the mixes with good 484
correlation ratios. 485
• The hygral contraction coefficient, for each mix, were back calculated using inverse analysis for 486
measured shrinkage strains. The coefficients range from 0.00038 to 0.0048 depending on the cement 487
type and fibre inclusion. 488
• MC and ACI equations can be used to predict the shrinkage development with time provided 489
appropriate coefficients for each cement type are used. 490
• Creep was found to play an important role in moderating tensile and shear stresses of the overlays. 491
• The Silfwerbrand procedure is used to determine normal and shear stresses in an overlay case study. 492
Though the procedure is simple, it relies on parameters (゜L and K) that are not easy to determine. 493
Acknowledgments 494
The authors acknowledge the financial support of the Higher Committee for Education Development 495
in Iraq (HCED-Iraq) for the PhD studies of Hajir Al-musawi. The authors also thank Twincon Ltd for 496

34
material supply and in-kind contributions. 497
References 498
[1] Beushausen, H., Alexander, M.G., (2006). Failure mechanisms and tensile relaxation of bonded 499
concrete overlays subjected to differential shrinkage. Cem. Concr. Res. 36 (10), 1908-1914. Available 500
at: 501
https://www.sciencedirect.com/science/article/pii/S0008884606001608. 502
[2] Scrivener, K., (2003). Calcium Aluminate Cement. In Newman, J., Advanced Concrete Technology. 503
2/1-2/29. Oxford: ButterworthHeinemann. 504
[3] Jewell, R., (2015). Influence of Calcium Sulfoaluminate Cement on the Pullout Performance of 505
Reinforcing Fibres: An Evaluation of the Micro-Mechanical Behavior. PhD Thesis. University of 506
Kentucky. Available at: http://uknowledge.uky.edu/ce_etds/27. [Accessed March 28, 2018]. 507
[4] Swamy, R.N., Stavrides, H., (1979). Influence of fiber reinforcement on restrained shrinkage and 508
cracking. In Journal Proceedings. ACI J. 76(3), 443-460. 509
[5] Graeff, A.G., Pilakoutas, K., Neocleous, K., Peres, M.V.N.N., (2012). Fatigue resistance and cracking 510
mechanism of concrete pavements reinforced with recycled steel fibres recovered from post-511
consumer tyres. Eng. Struct. 45, 385に395. https://doi.org/10.1016/j.engstruct.2012.06.030. 512
[6] Al-musawi, H., Figueiredo, F., Bernal, S.A., Guadagnini, M., Pilakoutas, K., (2018). Performance of 513
rapid hardening SFRC materials for repair applications. Accepted for publication. 514
[7] Hu, H., Papastergiou, P., Angelakopoulos, H., Guadagnini, M., Pilakoutas K., (2018). Mechanical 515
properties of SFRC using blended recycled tyre steel cords and recycled tyre steel fibres, Constr. Build. 516
Mater., 187, 553-564. Available at: 517

35
https://www.sciencedirect.com/science/article/pii/S0950061818318750?via%3Dihub. 518
[8] Banthia, N., Zanotti, C. and Sappakittipakorn, M., (2014). Sustainable fibre reinforced concrete for 519
repair applications. Constr. Build. Mater., 67 (PART C), 405に412. Available at: 520
http://dx.doi.org/10.1016/j.conbuildmat.2013.12.073. 521
[9] Xin, D., Zollinger, D.G., Allen, G.D., (1995). An approach to determine diffusivity in hardening 522
concrete based on measured humidity profiles. Adv. Cem. Based Mater., 2(4), 138に144. Available at: 523
https://www.sciencedirect.com/science/article/pii/1065735595900144. 524
[10] Bazant, Z.P., Najjar L.J., (1972). Nonlinear water diffusion in non-saturated concrete. Mater. 525
Struct., 5, 3に20. Available at: 526
https://link.springer.com/article/10.1007%2FBF02479073. 527
[11] Sakata, K., (1983). A study on moisture diffusion in drying and drying shrinkage of concrete. Cem. 528
Concr. Res., 13(2), 216に224. Available at: 529
https://www.sciencedirect.com/science/article/pii/0008884683901047. 530
[12] Selih, J., Sousa, A.C.M., Bremner, T.W., (1996). Moisture transport in initially saturated concrete 531
during drying. Transp. Porous Media, 24, 81に106. Available at: 532
https://link.springer.com/article/10.1007%2FBF00175604. 533
[13] Ayano, T., Wittmann, F.H., (2002). Drying moisture distribution, and shrinkage of cement-based 534
materials. Mater. Struct., 35, 134に140. Available at: 535
https://link.springer.com/article/10.1007%2FBF02533581. 536

36
[14] Shekarchi, M., Bonakdar, A., Bakhshi, M., Mirdamadi, A., Mobasher, B., (2010). Transport 537
properties in metakaolin blended concrete. Constr. Build. Mater., 24 (11), 2217-2223. Available at: 538
https://www.sciencedirect.com/science/article/pii/S0950061810001558. 539
[15] Bakhshi, M., Mobasher, B., (2011). Experimental observations of early-age drying of Portland 540
cement paste under low-pressure conditions. Cem. Concr. Compos., 33(4), 474-484. Available at: 541
https://www.sciencedirect.com/science/article/pii/S0958946511000229. 542
[16] Bakhshi, M., Mobasher, B., Soranakom, C., (2012). Moisture loss characteristics of cement-based 543
materials under earlyage drying and shrinkage conditions. Constr. Build. Mater., 30, 413に425. 544
Available at: 545
https://www.sciencedirect.com/science/article/pii/S0950061811006453?via%3Dihub. 546
[17] Bakhshi, M., Mobasher, B. and Zenouzi, M., (2012). Model for early-age rate of evaporation of 547
cement-based materials. J. Eng. Mech., 138 (11), 1372-1380. 548
[18] Jafarifar, N., (2012). Shrinkage behaviour of steel-fibre-reinforced-concrete pavements. PhD 549
thesis. University of Sheffield. Available at: 550
http://etheses.whiterose.ac.uk/7475/. 551
[19] Silfwerbrand, J., (1997). Stresses and strains in composite concrete beams subjected to 552
differential shrinkage. ACI Struct. J., 94(4), 347-353. 553
[20] CEN, (2004). Eurocode 2: Design of concrete structures, Part 1-1: General rules and rules for 554
buildings. European Committee for Standardization. Brussels, Belgium. 555
[21] F.I. du Béton, (2013). Fib Model Code for Concrete Structures 2010, Wilhelm Ernst & 556
Sohn, Berlin, Germany. 557
37
[22] ACI, (2008). ACI 209.2R-08: guide for modeling and calculating shrinkage and creep in hardened 558
concrete. American Concrete Institute, Farmington Hills. 559
[23] Azenha, M., Maekawa, K., Ishida, T. and Faria, R., (2007). Drying induced moisture losses from 560
mortar to the environment. Part I: experimental research. Mater. Struct., 40(8), 801-811. Available at: 561
https://link.springer.com/article/10.1617/s11527-007-9244-y. 562
[24] Lura, P., Pease, B., Mazzotta, G.B., Rajabipour, F. and Weiss, J., (2007). Influence of shrinkage-563
reducing admixtures on development of plastic shrinkage cracks. ACI Mater. J., 104(2), 187-194. 564
[25] Hall, C., Hoff, W.D. and Nixon, M.R., (1984). Water movement in porous building materialsねVI. 565
Evaporation and drying in brick and block materials. Build. Environ., 19(1), 13-20. 566
[26] Hall, C. and Hoff, W.D., (2002). Water transport in brick, stone and concrete. New York: Taylor & 567
Francis. 568
[27] Vu T.H., (2006). Influence of pore size distribution on drying behaviour of porous media by a 569
continuous model. MSc Dissertation. Germany: Otto-von-Guericke-Universität Magdeburg. 570
[28] Huang, H., Garcia, R., Guadagnini, M. and Pilakoutas, K., (2017). Effect of section geometry on 571
development of shrinkage-induced deformations in box girder bridges. Mater. Struct., 50:222. 572
Available at: 573
https://link.springer.com/article/10.1617/s11527-017-1090-y. 574
[29] Baluch, M.H., Rahman, M.K., Al-Gadhib, A.H., Raza, A. and Zafar, S., (2006). Crack minimization 575
model for hot weather concreting. Arabian J. Sci. Eng., 31(1C), 77-91. 576
[30] BS EN 13892-2, (2002). Methods of test for screed materials ね Part 2: Determination of flexural 577
and compressive strength. 578
38
[31] JSCE-SF4, (1984). Standard for Flexural Strength and Flexural Toughness, Method of Tests for Steel 579
Fiber Reinforced Concrete, Concrete library of JSCE, Japan Concrete Institute (JCI), Japan. 580
[32] ASTM C191, (2013). Standard Test Method for Time of Setting of Hydraulic Cement by Vicat 581
Needle. ASTM International, (May), 1-8. 582
[33] ASTM C 157, (2008). Test method for length change of hardened hydraulic cement mortar and 583
concrete. ASTM International. 584
[34] Pera, J., and Ambroise, J., (2004). New applications of calcium sulfoaluminate cement. Cem. Concr. 585
Res., 34(4), 671-676. 586
[35] Winnefeld, F., and Lothenbach, B., (2010). Hydration of calcium sulfoaluminate cementsね587
experimental findings and thermodynamic modelling. Cem. Concr. Res., 40(8), 1239-1247. 588
[36] Scrivener, K. (2003). Calcium Aluminate Cement. In Newman, J. and Choo, B.S., Advanced 589
Concrete Technology. 2/1-2/29. Oxford: Butterworth-Heinemann. 590
[37] Al-Kamyani, Z., Guadagnini M., and Pilakoutas, K., (2018). Predicting shrinkage induced curvature 591
in plain and reinforced concrete. Eng. Struct. J., 176, 468-480. Available at: 592
https://www.sciencedirect.com/science/article/pii/S014102961831023X. 593
[38] Neville, A.M., (1995). Properties of concrete (4th ed.). London: Longman. 594
[39] Wu, L., Farzadnia, N., Shi, C., Zhang, Z. and Wang, H., (2017). Autogenous shrinkage of high 595
performance concrete: A review. Constr. Build. Mater., 149, 62-75. 596
[40] ABAQUS 2017 Documentation. 597
39
[41] B;;ミデが ZくPく ;ミS N;テテ;ヴが LくJくが (1971). Drying of concrete as a nonlinear diffusion problem. Cem. 598
Concr. Res., 1(5), 461-473. 599
[42] Kim, J.K. and Lee, C.S., (1999). Moisture diffusion of concrete considering self-desiccation at early 600
ages. Cem. Concr. Res., 29(12), 1921-1927. 601


![The fibre reinforced concrete with using recycled aggregates · [8], the recycled material can be limited by the maximum particle size according to the thickness of the design slab](https://cdn.vdocuments.us/doc/165x107/60057d76accdaa50d270ed2c/the-fibre-reinforced-concrete-with-using-recycled-aggregates-8-the-recycled-material.jpg)