
Self-Correlating Predictive Information Tracking for Large-Scale Production Systems
Zhao, Tan, Gong, Gu, WamboltPresented by: Andrew Hahn

Introduction
Information TrackingCapture time-varying system informationAvailable via QueryFundamental to Autonomic ComputingDistributed Computing StructureWorker NodesExecute application tasksManagement NodesMonitor worker node conditionsSystem management
Worker nodes report,via sensors, metric values to the management nodes

Introduction
Problem:Provide scalable and precise continuous system monitoring
Management NodesUp-to-datePrecise knowledge of systemGlobal information
High cost of system monitoringGeographically dispersedSize of systemNumber of metrics

Goal
Design and implement InfoTrackPredictive information tracking systemReduce monitoring costMinimize loss of coverage or precisionSuppress remote information updateReduce network trafficLower resource consumptionTemporal correlation within one nodeSelf-similaritySpatial correlation among distributed nodesGroup-similarity

Correlations
Temporal correlations• Metric value predictor
Pi installed at monitoring node and management node
• If attribute can be predicted, update is suppressed
Spatial correlations• Group values inferred from
one reporting node

System Model

Approach Overview
Temporal Correlationai,t can be inferred using previous m values within user-defined error boundSpatial CorrelationTwo nodes have correlated attributes if ai,t=f(ai,t)f(ai,t)=ai,t
f(ai,t)=ai,t+Cf(ai,t)=ai,t*K

Infomation Tracking Cost Analysis
Cost without suppression
T=update intervalN=number of nodesSi=message sizeai=attributes
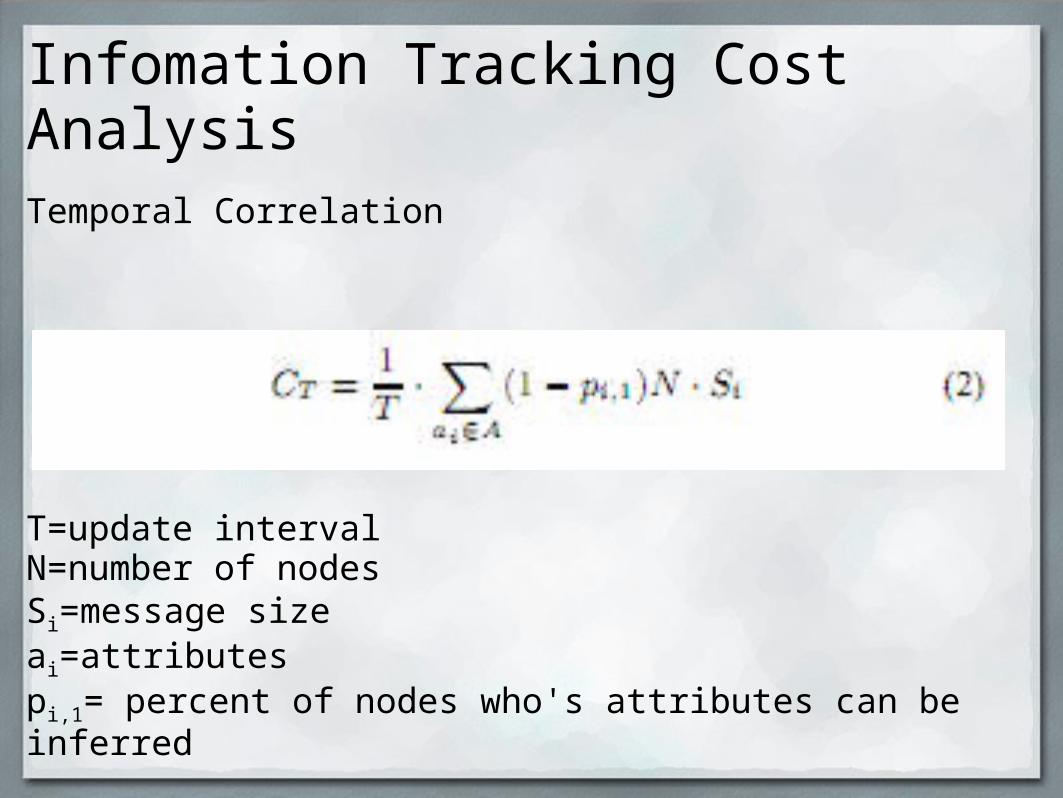
Infomation Tracking Cost Analysis
Temporal Correlation
T=update intervalN=number of nodesSi=message sizeai=attributespi,1= percent of nodes who's attributes can be inferred

Infomation Tracking Cost Analysis
Spatial Correlation
T=update intervalN=number of nodesSi=message sizeai=attributespi,2= percent of nodes who's attributes can be inferredli=number of groups

Infomation Tracking Cost Analysis
Integrated Correlation
T=update intervalN=number of nodesSi=message sizeai=attributespi,2= percent of nodes who's attributes can be inferredli=number of groupsp'i,2=number of nodes inferred based on cluster heads

Compression Ratio
Cto=Overhead of updating temporal predictorsCso=Dynamic cluster update cost

Exploring Temporal Correlation
Predictor installed at worker node and management node
Need to keep prediction overhead lowLast-value predictorUses the last value of ai,t
Simple and no overheadKalman filterPredictive information trackingn internal statesm observable measurement
x=state vector z=measurement vector

Exploring Temporal Correlation
Kalman Filter predicts and correctsxt is predicted and then corrected if a true measurement is availableFilters at the monitoring site and at the management node make predictions and correct when a sensor measurement is received
Tradeoff between update cost and accuracy

Exploring Spatial Correlation
Monitored nodes clustered into different groups based on ai
Only the head node of the group reports
Group by similarity.V&U are vectors of attributes of worker nodesAll values pushed to management node to start clustering

Exploring Spatial Correlation
Two Ways to cluster objectsk-meansk objects selected to act as seedsNode assigned to cluster most similar to seedLow computational complexityMay suffer from bad seedsUnweighted Pair Group Method with Arithmetic Mean Each node starts out as own clusterMerges similar clusters togetherForms as hierarchical tree to create natural clusters

Integrated Approach
Combine both temporal and spatial correlations
Sensor reports value for attribute only when it can't be inferred by either method within error bound
If not reported to the management node, both attributes are accurateSometimes only one attribute will be accurateSend flag to management node to indicate which is correctUpdates periodically sent at certain intervalsAfter Interval: Non-cluster head is removedCluster head will be replaced

Prototype Implementation
Prototype of InfoTrack deployed to PlanetLab and VCL
Monitoring sensor collects 66 attributes
Temporal correlationLast-value approachKalman filterSpatial correlationk-meansUPGMA

Traces and Their Characteristics
Experiment ran for several months on 300 PlanetLab nodes
Most attributes collected without interrupting normal workload
Trace data for more than a week collected for difficult attributes

Evaluation Methodology
Randomly select starting point in traceEvaluate next 9000 samples for CPU-10 and MEM-10Evaluate next 3000 samples for CPU-30 and MEM30One dayUPGMA produces clusters between 10 and 20k-means generates the same amount of clusters as UPGMAError bound range from 0.001 to 0.1Models evaluated based on Compression Ratio

Results and Analysis - Temporal
Compression radio achieved with Kalmal and Last-value model
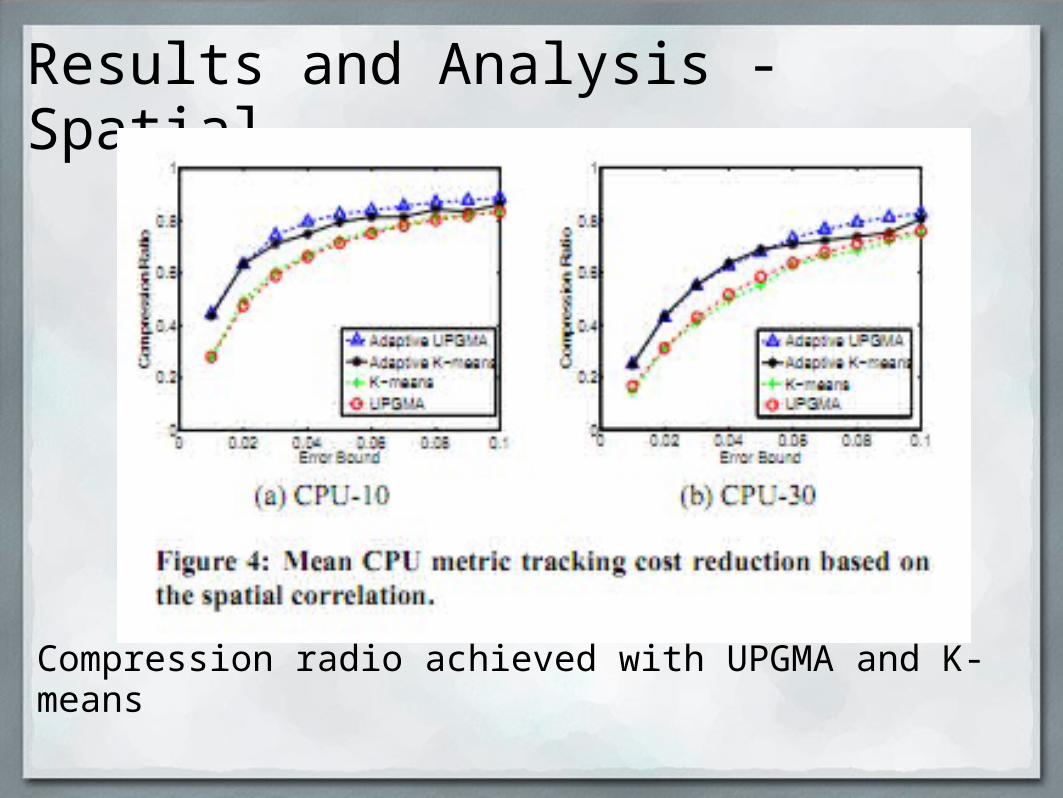
Results and Analysis - Spatial
Compression radio achieved with UPGMA and K-means

Overhead
Memory had large variance

Results and Analysis - Integrated

Related Work
Most large-scale systems are statically configured with long update intervals
Decentralized architectures scale better
Infotrack explores correlation patterns to achieve continuous information monitoring
Sensor network monitoringDistributed event trackingResource discovery

Conclusion
InfotrackSelf-correlating predictive information tracking systemTemporal and Spatial correlations integratedReduces tracking costsCorrelation patterns exist in production systemsDiscoverable using light-weight schemesReduce information updates by up to 95%Deploy to more complicated systems for further research

Questions


