
RapidFire Selected Therapeutic Areas
and Screening Techniques
RapidFire: SPE/MS/MS
Life Sciences Group
William A. LaMarr, Ph.D.
Senior R&D Manager, RapidFire

RapidFire Mass Spectrometry
Ultra-fast autosampler &
online SPE system
• Replaces LC in LC/MS
• Reusable SPE cartridge
• Integrates with standard ESI MS
instruments
• Cycle time = 7-13 s/sample
Compatible with various matrices
• Sub-cellular fractions
• Cell culture supernatants
• Cell / tissue extracts
• Biological fluids

Advantages of mass spectrometry
• True label-free detection
• Direct, quantitative measurements
• Native reaction substrates & products
– (no radioactivity, no surrogate analytes,
no indirect or secondary components)
• Functional biochemical assays
– (rather than target binding assays)
instead of :
PO4
PO4
Limitations of MS
Molecules must be charged
Desalting step required
Sample purification is
– Serial
– slow
Instrumentation is expensive,
– not easily scalable
– to meet demand

Applications of the RapidFire Platform
1) Native Analyte Detection
- surrogate substrates can introduce confounding factors, effect enzyme kinetics, and produce data artifacts
2) Replace Intractable Assays
- assays may present challenges in workflow, may be resource intensive, may be cost prohibitive, may present regulatory issues (radioactivity)
3) Enable Target Classes
- multiple modification events on the same substrate are impossible to track by many common optical and radioactive methodlogies

ADS Customer Base
One
Target
Customers
Multiple
Target
Customers
Primary
Screening
(6x)
“Secondary”
Screening
(27x)
Large Pharma
Biopharma
Biotech
Secondary Screening &
Support
Primary Screening
“High
Profile”
Targets
“Unique”
Targets

Targeted Therapeutic Areas
Anti-Infectives
Inflammation
Metabolic Disorder Oncology
Cardiovascular
Disease
Inflammation
Other
Epigenetics
Metabolic
Disorder

Metabolic Disorder
Metabolic Disorders
Class of genetic disease that encompasses varied
conditions • Inborn errors of metabolism
• Congenital metabolic disease
Most are due to a single enzyme mutation effecting conversion of
substrate to product and often result in:
• accumulation of toxic substances
or
• reduced ability to synthesize essential compounds
Because of the diverse nature of the diseases in the group, accurate
numbers for incidence are difficult to determine. One Canadian study*
found that approximately 15% of single gene disorders in the population are
considered metabolic disorders.
* Applegarth DA, Toone JR, Lowry RB (January 2000). "Incidence of inborn errors of metabolism in
British Columbia, 1969-1996". Pediatrics 105 (1): e10

Enzymes and associated disorder(s)
An example of enzymes discussed in today’s
presentation:
Enzyme Role Associated Metabolic
Disorder(s)
Serine palmitoyltransferase Involved in sphingolipid biosynthesis Hereditary sensory neuropathy type 1
Acetyl CoA Carboxylase Involved in fatty acid synthesis Type 2 Diabetes
ATP citrate lyase Crucial in many biosynthetic pathways
including lipogenesis and cholesterolgenesis Fatty liver disease, type 2 diabetes
GM3 Synthase Involved in the biosynthesis of complex
gangliosides Infantile seizure/epilepsy disorder
Stearoyl CoA Desaturase Important for the desaturation of fatty
acids Obesity, liver disease
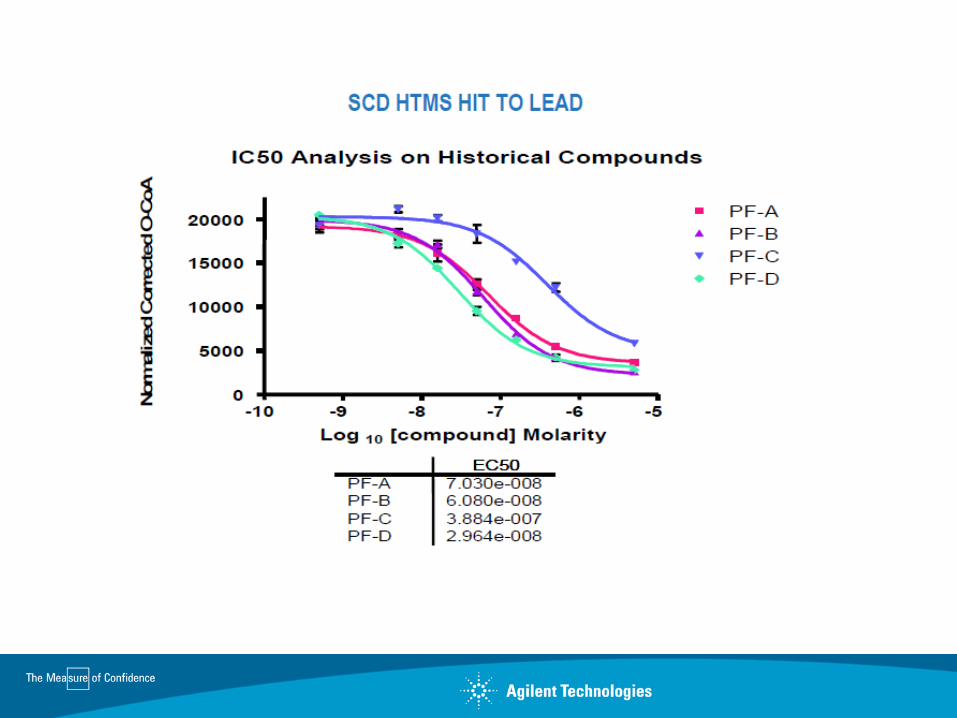
Diacylglycerol Acyltransferase Catalyzes the synthesis of triglycerides from
digylcerides obesity

Acetyl-Coenzyme A Carboxylase
Acetyl Coenzyme A
Malonyl Coenzyme A
KH14CO3
14C
O
OH2
+
AT
P

Acetyl-Coenzyme A
AssayConditions
50 mM HEPES, pH 7.4
2 mM MgCl2
2 mM tripotassium citrate
2 mM DTT
0.75 mg/mL BSA
4 mM ATP
12.5 mM KHCO3
20 mM Acetyl-Coenzyme A
*ACC assay conditions based on previously published 14C-incorporation assay
protocol: Harwood, H.J., Jr. et al. J. Biol. Chem. (2003), 278 (39): 37099-37111

Acetyl-Coenzyme A (m.w. 809)
Malonyl-Coenzyme A (m.w. 853)
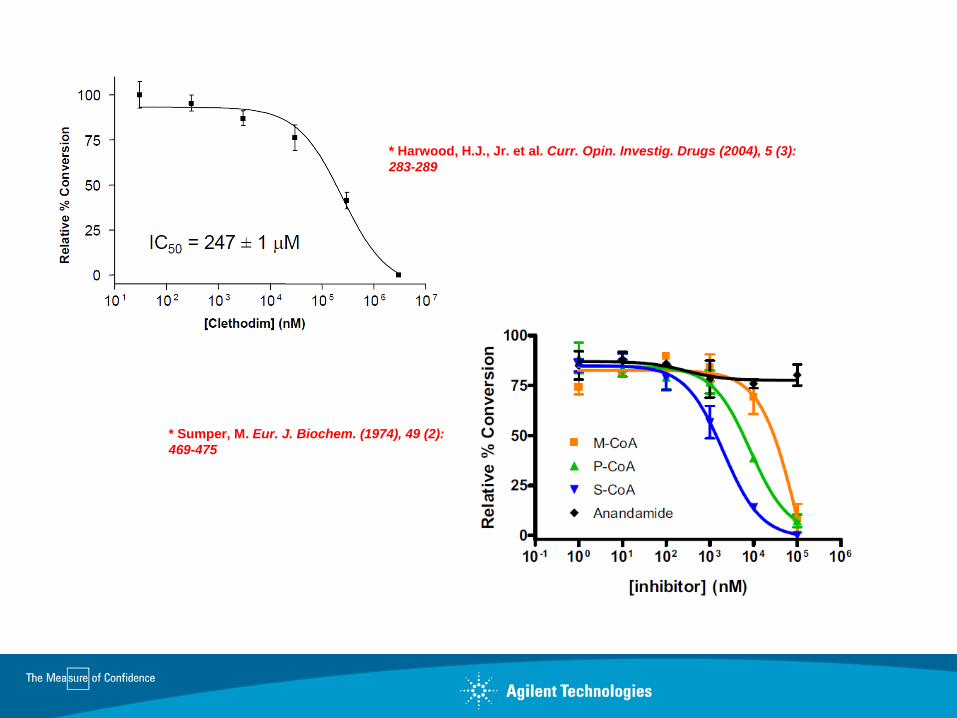
* Harwood, H.J., Jr. et al. Curr. Opin. Investig. Drugs (2004), 5 (3):
283-289
* Sumper, M. Eur. J. Biochem. (1974), 49 (2):
469-475

Stearoyl-Coenzyme A Desaturase
OH
O-O-
HHN
O
HN
O
OP
OO
O OP
O
O-
P O OH
O
N
N
NH2
N
N
NH4+ NH4
+
NH4+
HO
O
S3H
3H
OH
O-O-
HHN
O
HN
O
OP
OO
O OP
O
O-
P O OH
O
N
N
NH2
N
N
NH4+ NH4
+
NH4+
HO
S
O
3H
O3H
+
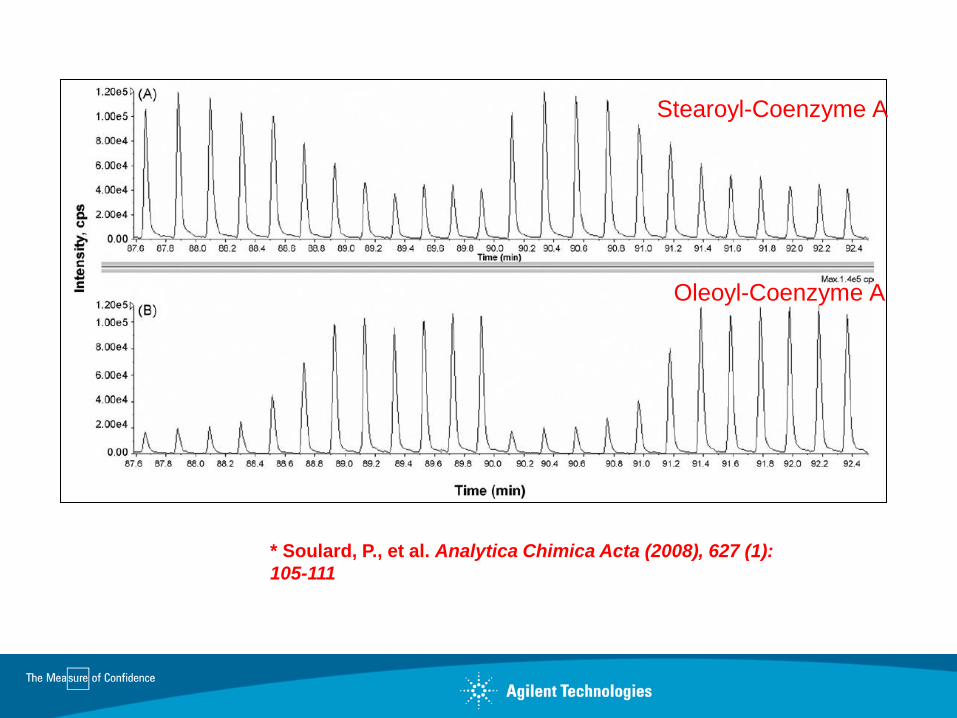
Stearoyl-Coenzyme A
Oleoyl-Coenzyme A
* Soulard, P., et al. Analytica Chimica Acta (2008), 627 (1):
105-111

0.00
0.20
0.40
0.60
0.80
1.00
0 50 100 150 200 250 300 350 400 450 500 550
Plate Number
Z' S
co
re
> 200,000 wells screened
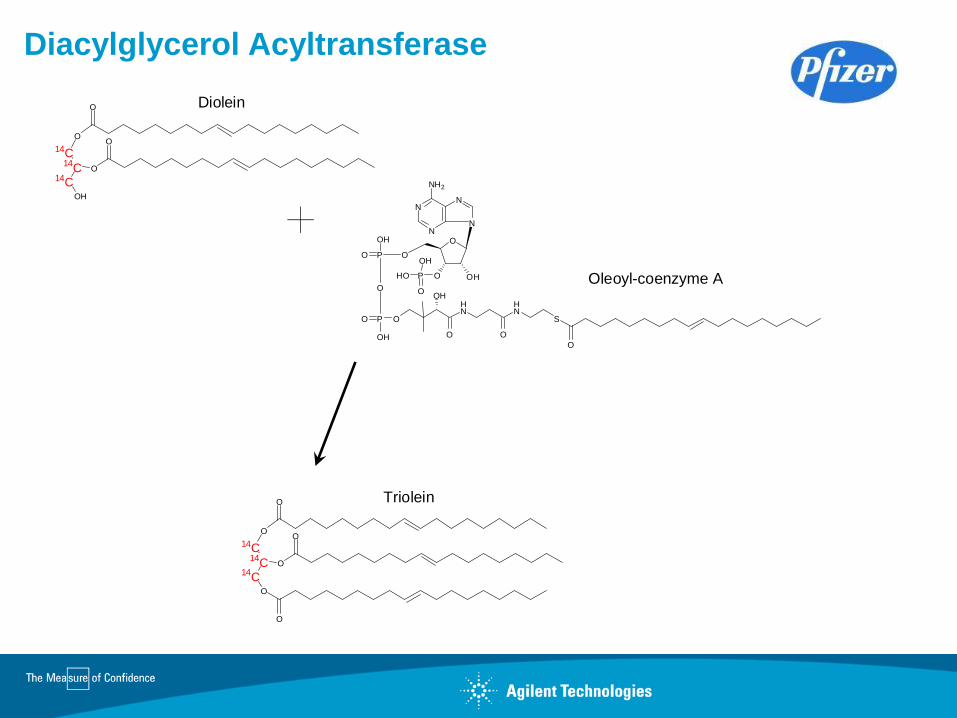
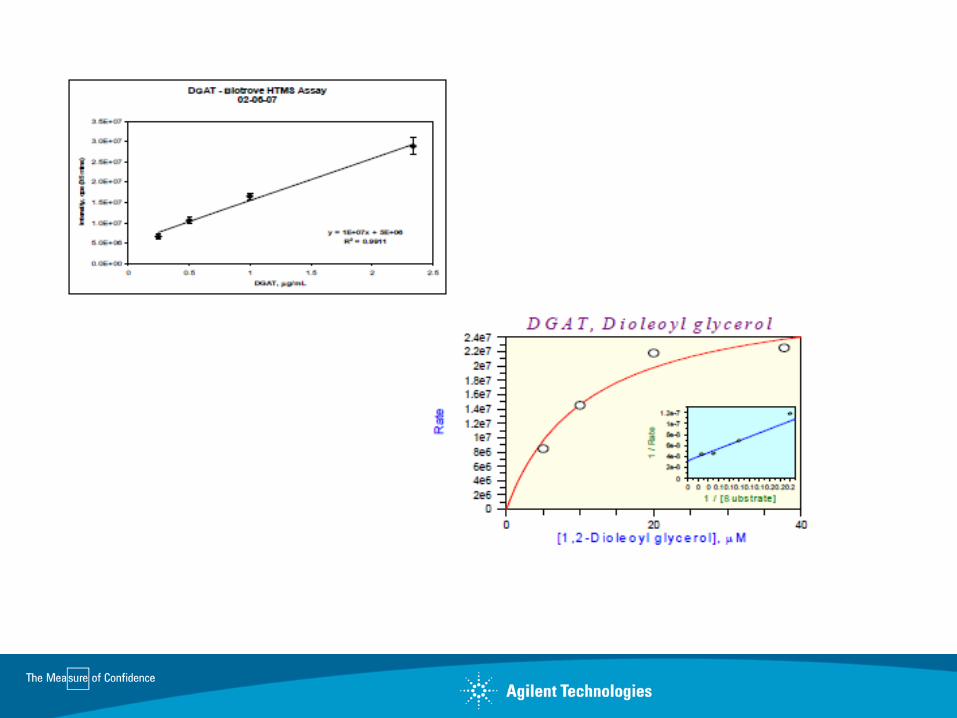
Diacylglycerol Acyltransferase
N
N
N
NH2
N
O
OP
OH
O
O
OPO
OH
OH
O
HN
HN
O
S
OHO
OH
PHO
O
O
Oleoyl-coenzyme A
O
O
O14
C14C
14C
OH
O
Diolein
O
O
O14
C14
C
14C
O
O
O
Triolein
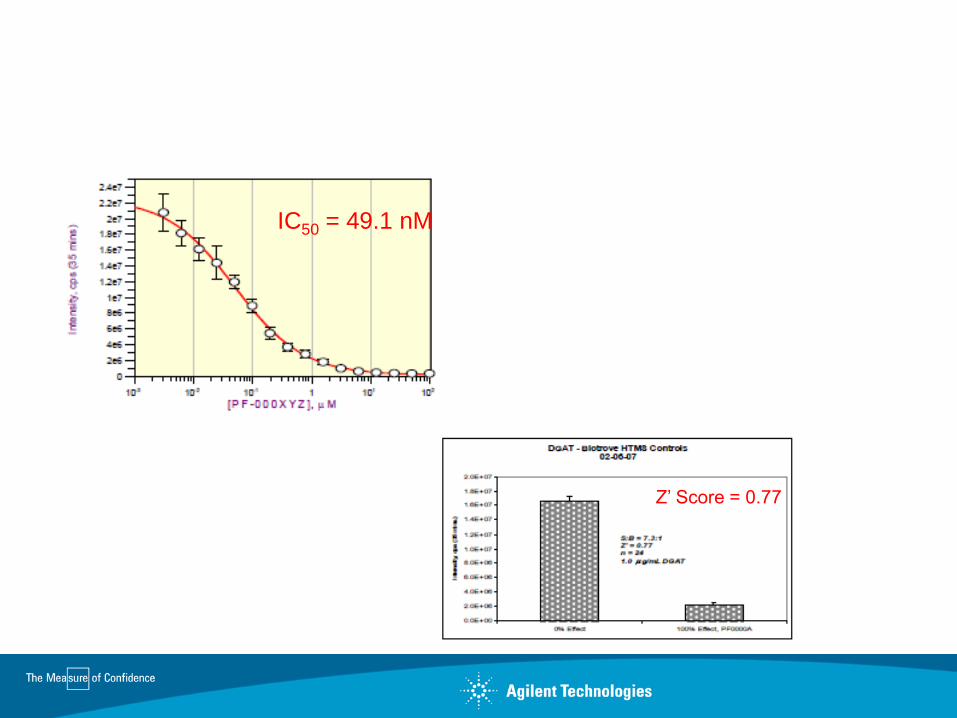
IC50 = 49.1 nM
Z’ Score = 0.77

Epigenetics

ThioGlo Assay – SAH detection
Protein Methyltransferase Assay Strategies
AlphaScreen
Pan- methylation or
selective antibodies
are needed for multiple
states
F. Liu et.al., Journal of Medicinal Chemistry. 2009:669-81.
Masoud Vedadi
Amy Quinn
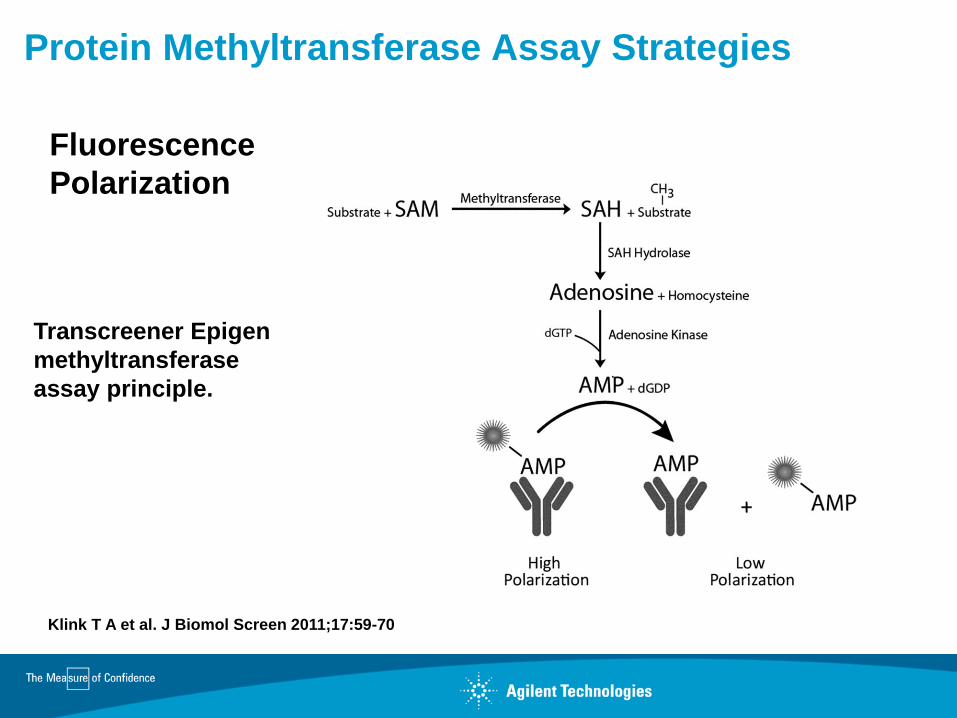
Protein Methyltransferase Assay Strategies
Transcreener Epigen
methyltransferase
assay principle.
Klink T A et al. J Biomol Screen 2011;17:59-70
Fluorescence
Polarization

Methylation-Sensitive Proteolysis Assay on EZ
Reader II
26
Wigle et al, Chemistry & Biology, 2010

Co-Product Measurements
-Histone Methyltransferases (HMTs)
S-adenosyl-methionine (SAM) to S-adenosyl-homocysteine (SAH)
-Histone Acetyltransferases (HATs)
Acetyl-coenzyme A (ACoA) to Coenzyme A (CoA)
-Sirtuin Deacetylases (SIRTs)
Nicotinamide adenine dinucleotide (NAD+) to
nicotinamide + 2’-O-acetyl-ADP-ribose (OAADPr)
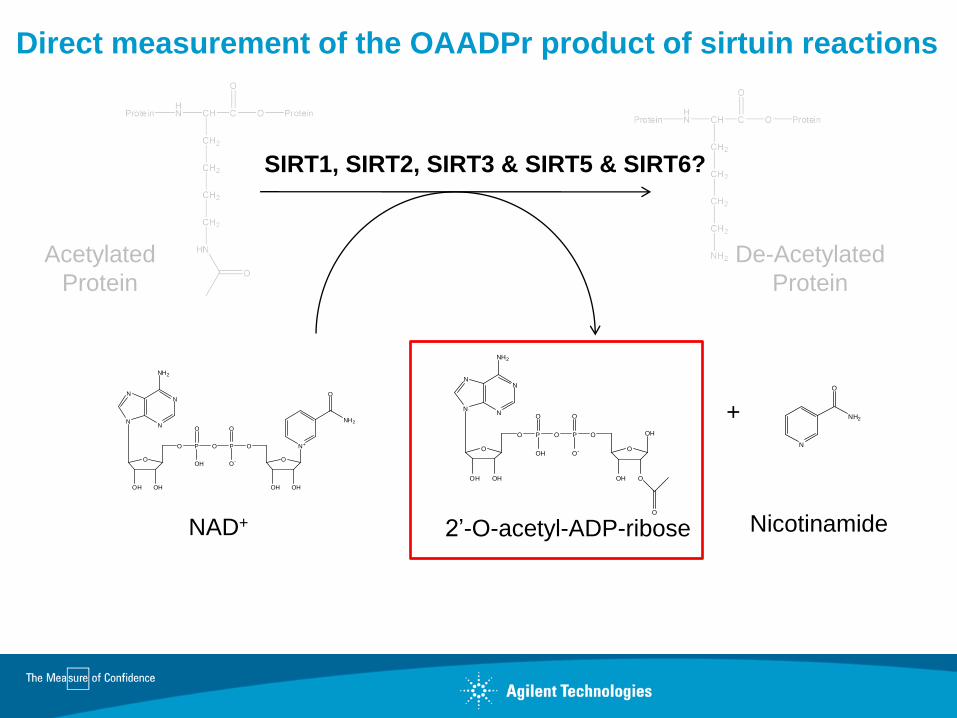
Direct measurement of the OAADPr product of sirtuin reactions
NN
N
NH2
N
O
OH OH
O P O
OH
O
P O
O-
O
O
OH OH
N+
NH2
O
NAD+
NN
N
NH2
N
O
OH OH
O P O
OH
O
P O
O-
O
O
OH O
OH
O
Acetylated
Protein
De-Acetylated
Protein
+
2’-O-acetyl-ADP-ribose
N
NH2
O
Nicotinamide
SIRT1, SIRT2, SIRT3 & SIRT5 & SIRT6?
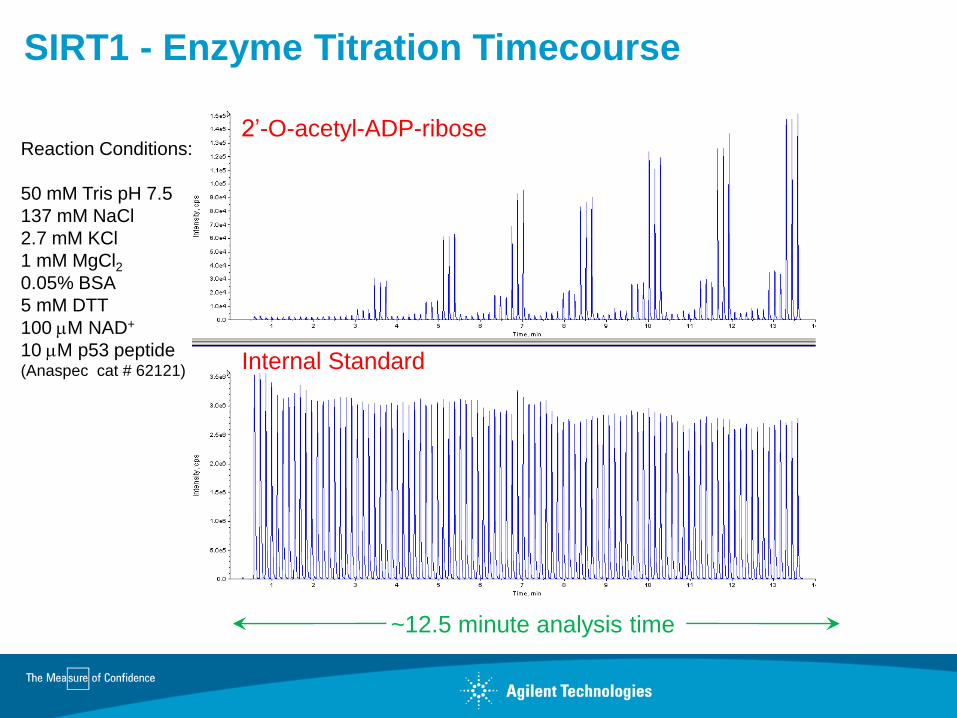
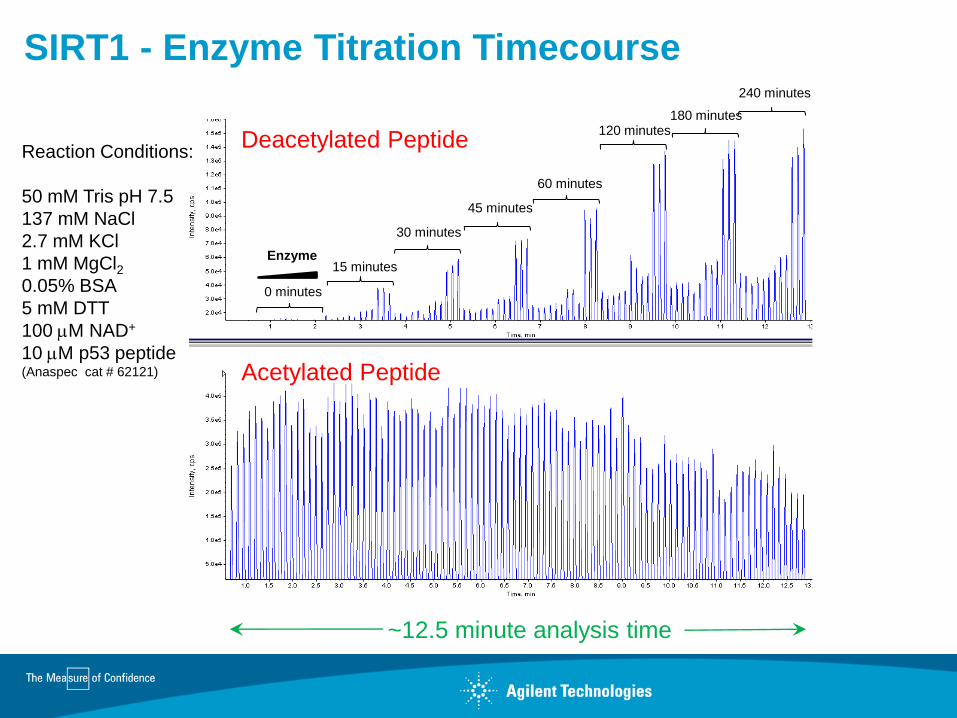
SIRT1 - Enzyme Titration Timecourse
Reaction Conditions:
50 mM Tris pH 7.5
137 mM NaCl
2.7 mM KCl
1 mM MgCl2
0.05% BSA
5 mM DTT
100 mM NAD+
10 mM p53 peptide (Anaspec cat # 62121)
~12.5 minute analysis time
2’-O-acetyl-ADP-ribose
Internal Standard

SIRT1 - Enzymatic Parameters (Linearity, Km & IC50)
2’-O-acetyl-ADP-ribose Based Analysis
R² = 0.9995
0.0E+00
2.0E-05
4.0E-05
6.0E-05
8.0E-05
1.0E-04
1.2E-04
0 0.001 0.002 0.003Init
ial V
elo
cit
y (
V0)
Enzyme Dilution
Km = 28 ± 5 mM
Km = 54 ± 1 mM IC50 = 77 ± 1 mM

Comparison of Peptide Based and 2’-O-acetyl-
ADP-ribose Based Assay Parameters
Km of NAD+ Km of peptide IC50 of nicotinamide
SIRT1
SIRT3
SIRT2
Peptide
Read
2OAADPr
Read
Peptide
Read
2OAADPr
Read
Peptide
Read
2OAADPr
Read
38 ± 4 mM 54 ± 1 mM 25 ± 6 mM 28 ± 5 mM 62 ± 1 mM 77 ± 1 mM
46 ± 11 mM 50 ± 8 mM 8 ± 3 mM 12 ± 1 mM 10 ± 1 mM 11 ± 1 mM
118 ± 44 mM 144 ± 21 mM 4 ± 1 mM 6 ± 1 mM 31 ± 1 mM 39 ± 1 mM

Direct Peptide Measurements
Histone Demethylases
Lysine Demethylase 1 (LSD-1) uses Flavin Adenine Dinucleotide (FAD)
Jumanji Domain 2a (JMJD2a) uses Fe+2 mediated oxidative chemistry
Histone Deacetylases
Histone Deacetylase 1 (HDAC-1) uses a metal dependent hydrolysis
SIRT1 - Enzyme Titration Timecourse
Reaction Conditions:
50 mM Tris pH 7.5
137 mM NaCl
2.7 mM KCl
1 mM MgCl2
0.05% BSA
5 mM DTT
100 mM NAD+
10 mM p53 peptide (Anaspec cat # 62121)
~12.5 minute analysis time
0 minutes
240 minutes
180 minutes 120 minutes
60 minutes
45 minutes
30 minutes
15 minutes Enzyme
Deacetylated Peptide
Acetylated Peptide
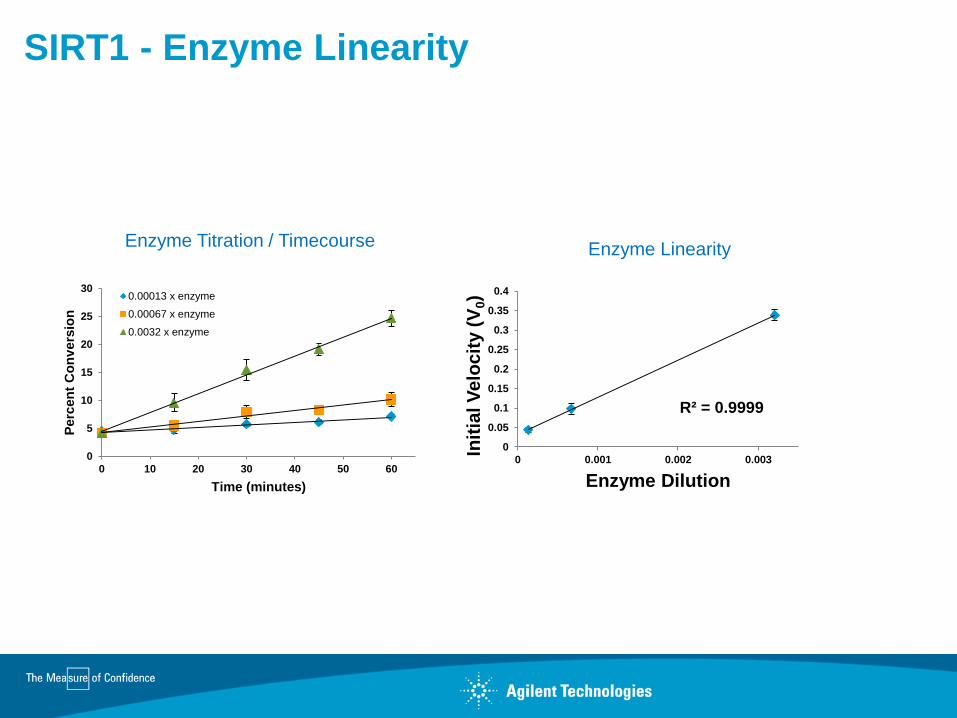
SIRT1 - Enzyme Linearity
0
5
10
15
20
25
30
0 10 20 30 40 50 60
Perc
en
t C
on
vers
ion
Time (minutes)
0.00013 x enzyme
0.00067 x enzyme
0.0032 x enzyme
R² = 0.9999
0
0.05
0.1
0.15
0.2
0.25
0.3
0.35
0.4
0 0.001 0.002 0.003
Init
ial V
elo
cit
y (
V0)
Enzyme Dilution
Enzyme Titration / Timecourse Enzyme Linearity

SIRT1 - Enzymatic Parameters (Km, IC50, etc…)
Km = 25 ± 6 mM Km = 38 ± 4 mM
IC50 = 62 ± 1 mM
Deacetylated peptide
Acetylated peptide
Nicotinamide
~ 3 minute analysis time (8-point log-dilution IC50 curve, n=3)
Literature IC50 value ~ 50 mM Bitterman et. al., J. Biol. Chem. (2002) 277: 45099-45107
Marcotte et. al., Anal. Biochem. (2005) 332:90-99
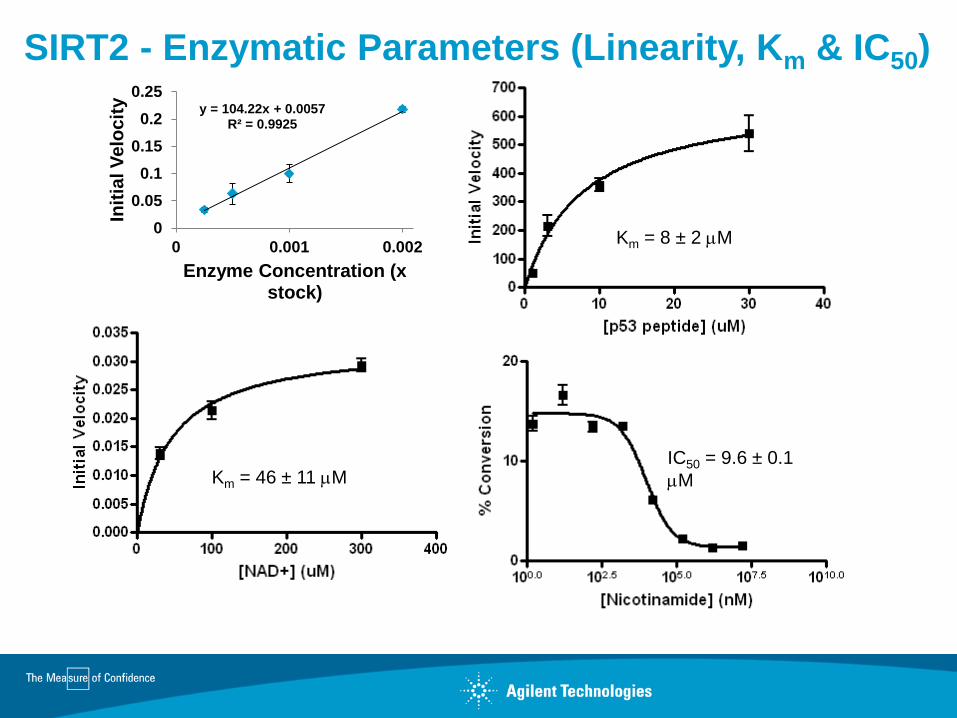
SIRT2 - Enzymatic Parameters (Linearity, Km & IC50)
y = 104.22x + 0.0057 R² = 0.9925
0
0.05
0.1
0.15
0.2
0.25
0 0.001 0.002
Init
ial V
elo
cit
y
Enzyme Concentration (x stock)
IC50 = 9.6 ± 0.1
mM Km = 46 ± 11 mM
Km = 8 ± 2 mM

SIRT3 - Enzymatic Parameters (Linearity, Km & IC50)
IC50 = 31 mM
Km = 118 ± 44 mM
Km = 4.3 ± 1.0 mM
y = 63.717x - 0.0062 R² = 0.9998
0
0.05
0.1
0.15
0.2
0.25
0 0.001 0.002 0.003
Init
ial V
elo
cit
y
Enzyme Concentration (x …

Labeled vs. Un-labeled Sirtuin Assay
HN CH C
CH2
O
O
CH2
CH2
CH2
HN
ProteinProtein
O
H2N CH C
CH2
O
O
CH2
CH2
CH2
NH2
Protein
SIRT1/Chymotrypsin
“Labeled”
Acetylated
Peptide
De-Acetylated
Peptide
Resveratrol
Free fluorophore
Reaction
Activation
HN CH C
CH2
O
O
CH2
CH2
CH2
HN
ProteinProtein
O
HN CH C
CH2
O
O
CH2
CH2
CH2
NH2
ProteinProtein
“Unlabeled”
Acetylated
Peptide
De-Acetylated
Peptide
Resveratrol
X No
Reaction
Activation
SIRT1/Chymotrypsin
Howitz et. al., Nature (2003) 425:191-
196
Kaeberlein et. al., J. Biol. Chem. (2005) 280:17038-
17045
Beher et. al., Chem. Biol. Rug Des. (2009) 74:619-
624
Pacholec et. al., J. Biol. Chem. (2010) 285:8340-8351

SIRT1 - Substrate Dependant Activation by Resveratrol
“Labeled” Peptide “Unlabeled” Peptide
Rye et. al., J. Biomol. Screen. (2011) 16:1217-1226
Milne et. al., Nature (2007) 450:712-716

Multiple Modification Events on a Single Peptide
Preferred
acetylation
sites
potential
acetylation site
potential
acetylation site
-Human p53 (368-386)
-19-mer peptide
- Six potential acetylation sites
Rye et. al., J. Biomol. Screen. (2011) 16:1186-1195
Prives et. al., Nature (2007) 450:712-716

Direct Measurement of Modification Events on
Whole Histone Proteins
10-2 10-1 100 101 102 103 104
0
20
40
60
80
100
[Garcinol] (mM)
Perc
en
t o
f C
on
tro
l
AcCoA/CoA (QqQ)
Protein (Q-TOF)
Incorporation of a high-resolution (Q-TOF) mass spectrometer into the RapidFire workflow allows the substitution of whole proteins for representative peptide based sequences in a high-throughput screening compatible mode.
Rye et. al., J. Biomol. Screen. (2011) 16:1186-1195

Screening Histone Demethylases in a
Pharmaceutical Drug Discovery Setting
Plant et. al., J. Anal. Biochem. (2011) 419: 217-227
Hutchinson et. al., J. Biomol. Screen. (2012) 17: 39-48
Melanie Leveridge, MipTec 2011, oral presentation
Kruidenier et. al., Nature (2012) 488: 404-408
Conclusions
Mass spectrometry is an excellent tool for epigenetic target based drug discovery because if it’s ability to:
- Directly measure native, label-free peptides and generic reaction co-products
- Directly and independently measure multiple modification events on single substrates
- Directly measure modifications to whole protein substrates

Fragment Based
Drug Discovery

Fragment Based Drug Discovery

BACE-1 Assay: Fragment Based Screen
Cary Eclipse Fluorescence
Spectrophotometer
X
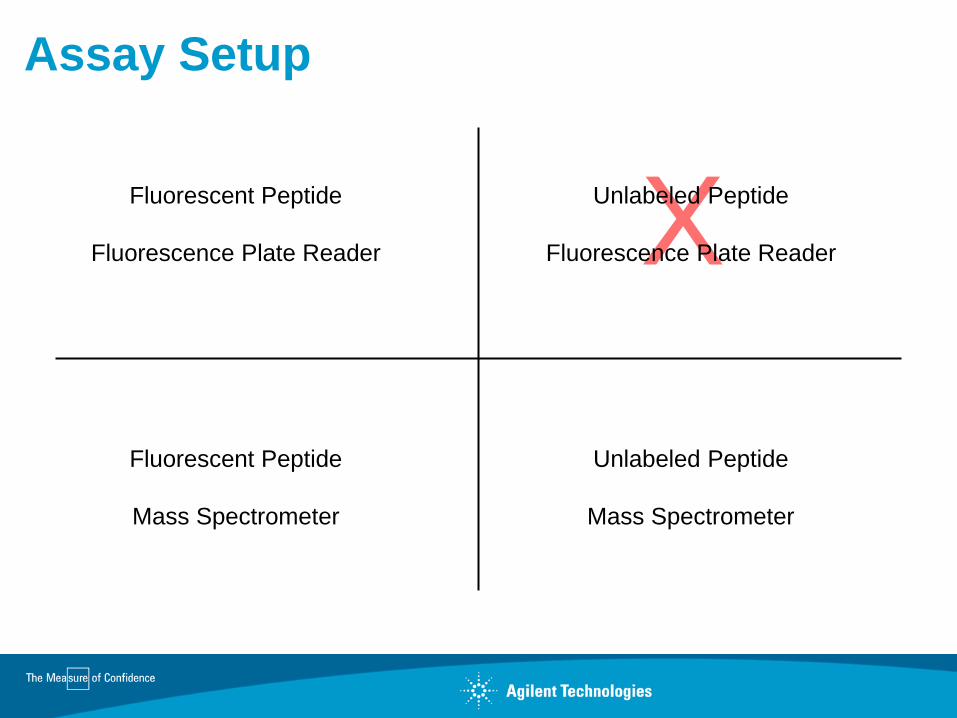
Assay Setup
Fluorescent Peptide
Fluorescence Plate Reader
Unlabeled Peptide
Mass Spectrometer
Fluorescent Peptide
Mass Spectrometer
Unlabeled Peptide
Fluorescence Plate Reader

Assay System Characterization
Unlabeled Substrate By MS (UMS)
Fluorescently Labeled Substrate by FS (FS)
Fluorescently Labeled Substrate by MS (LMS)

Initial Screening Results
UM
S
LMS
FS all 3
UMS 211 14 41 -
LMS 14 32 22 -
FS 41 22 122 -
all 3 - - - 8
UMS
LMS FS
Hits by Assay Format
Hits by Assay Format

Hits Observed by MS Only
Follow-up of selected hits confirmed that compound autofluorescence (AF) obscured several hits
in the FS data, including the most potent analyte. Titration of that compound revealed a
concentration-dependent increase in signal in the FS assay, suggesting AF, while the MS data were
consistent with a traditional inhibition curve.

Hits Observed with the Labeled Peptide Only
A second class of compounds was uncovered consisting of those molecules that appear as hits when the
labeled peptide is employed (as in the FS and LMS assays), but do not show inhibition when the more
native substrate is used (UMS). These results suggest that perhaps compounds exist that interfere with
the enzyme’s ability to bind the peptide carrying the bulky label but not with the tighter binding exhibited by
the enzyme for the unlabeled substrate, raising the possibility of misleading data being produced when
modified substrates are employed.

Hits Observed with the Unlabeled Peptide Only
Yet another class of inhibitors was detected in the unlabeled assay (UMS)
but was not found with the fluorescent peptide (FS or LMS). Because MS
eliminates the need for unnatural modification of substrates, it allows the
study of more biologically relevant molecules. These more realistic
substrates could reveal activities that are lost with modified peptides,
possibly due to altered binding, which in this case was clearly revealed by
the Km experiments.
Unlabeled Substrate By MS (UMS)
Fluorescently Labeled Substrate by MS (LMS)

Conclusions • Robust assays were developed for both a labeled and an unlabeled substrate of the BACE-1 enzyme.
• Screening a fragment library against both substrates using both detection methods produced three disparate hit sets.
• FS and MS produced different hit sets when used as complementary detection methods on the same samples. While some MS hits (including the most potent) were obscured by autofluorescence in the FS assay, this did not account for all of the differences between the methods.
• MS generated different hit sets for the labeled and the unlabeled peptide, underscoring the importance of substrate selection.
•Label-free screening by high-throughput MS has proven to be a valid method for conducting activity-based screens of fragment libraries that enables the study of more native molecules and is less susceptible to confounding factors, such as AF.

Target
Binding
Assays
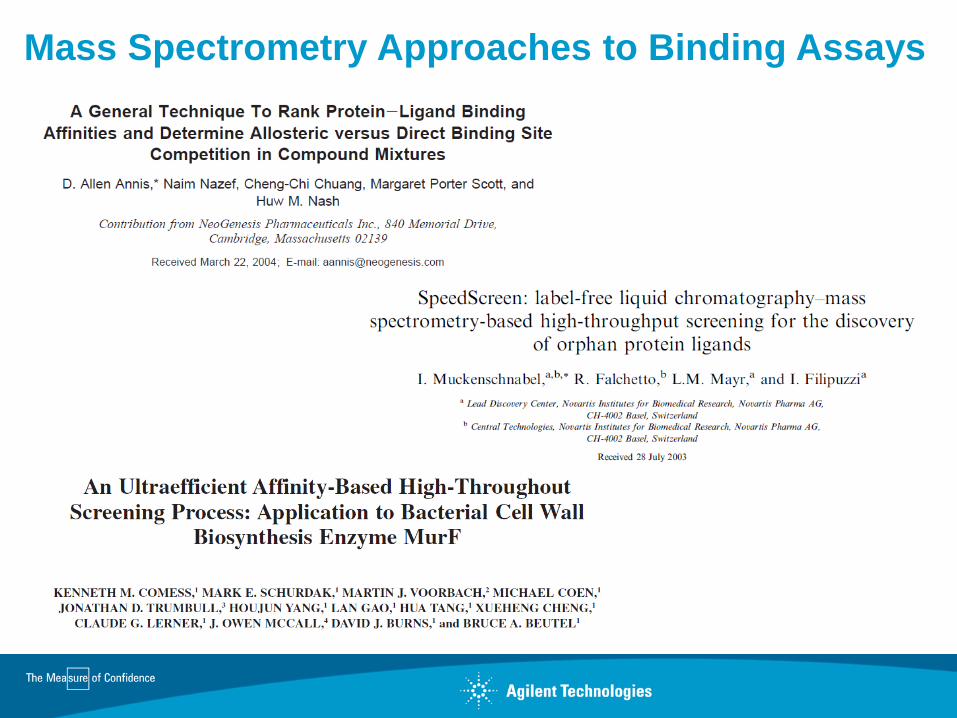
Mass Spectrometry Approaches to Binding Assays

Questions?
Agilent Technologies
www.Agilent.com
William A. LaMarr, Ph.D.
Senior R&D Manager, RapidFire
781-928-2718


