Sedentary Time and Its Association With Risk for Disease Incidence,Mortality, and Hospitalization in AdultsA Systematic Review and Meta-analysisAviroop Biswas, BSc; Paul I. Oh, MD, MSc; Guy E. Faulkner, PhD; Ravi R. Bajaj, MD; Michael A. Silver, BSc; Marc S. Mitchell, MSc;and David A. Alter, MD, PhD
Background: The magnitude, consistency, and manner of asso-ciation between sedentary time and outcomes independent ofphysical activity remain unclear.
Purpose: To quantify the association between sedentary timeand hospitalizations, all-cause mortality, cardiovascular disease,diabetes, and cancer in adults independent of physical activity.
Data Sources: English-language studies in MEDLINE, PubMed,EMBASE, CINAHL, Cochrane Library, Web of Knowledge, andGoogle Scholar databases were searched through August 2014with hand-searching of in-text citations and no publication datelimitations.
Study Selection: Studies assessing sedentary behavior inadults, adjusted for physical activity and correlated to at least 1outcome.
Data Extraction: Two independent reviewers performed dataabstraction and quality assessment, and a third reviewer re-solved inconsistencies.
Data Synthesis: Forty-seven articles met our eligibility criteria.Meta-analyses were performed on outcomes for cardiovasculardisease and diabetes (14 studies), cancer (14 studies), and all-
cause mortality (13 studies). Prospective cohort designs wereused in all but 3 studies; sedentary times were quantified usingself-report in all but 1 study. Significant hazard ratio (HR) associ-ations were found with all-cause mortality (HR, 1.240 [95% CI,1.090 to 1.410]), cardiovascular disease mortality (HR, 1.179 [CI,1.106 to 1.257]), cardiovascular disease incidence (HR, 1.143[CI, 1.002 to 1.729]), cancer mortality (HR, 1.173 [CI, 1.108 to1.242]), cancer incidence (HR, 1.130 [CI, 1.053 to 1.213]), andtype 2 diabetes incidence (HR, 1.910 [CI, 1.642 to 2.222]). Haz-ard ratios associated with sedentary time and outcomes weregenerally more pronounced at lower levels of physical activitythan at higher levels.
Limitation: There was marked heterogeneity in research de-signs and the assessment of sedentary time and physical activity.
Conclusion: Prolonged sedentary time was independently as-sociated with deleterious health outcomes regardless of physicalactivity.
Primary Funding Source: None.
Ann Intern Med. 2015;162:123-132. doi:10.7326/M14-1651 www.annals.orgFor author affiliations, see end of text.
Adults are advised to accumulate at least 150 min-utes of weekly physical activity in bouts of 10 min-
utes or more (1). The intensity of such habitual physicalactivity has been found to be a key characteristic ofprimary and secondary health prevention, with an es-tablished preventive role in cardiovascular disease,type 2 diabetes, obesity, and some cancer types (2, 3).Despite the health-enhancing benefits of physical activ-ity, this alone may not be enough to reduce the risk fordisease and illness. Population-based studies havefound that more than one half of an average person'swaking day involves sedentary activities ubiquitouslyassociated with prolonged sitting, such as watchingtelevision and using the computer (4). This lifestyletrend is particularly worrisome because studies suggestthat long periods of sitting have deleterious health ef-fects independent of adults meeting physical activityguidelines (5–7). Moreover, physical activity and seden-tary behaviors may be mutually exclusive. For example,some persons who achieve their recommended physi-cal activity targets may be highly sedentary throughoutthe remainder of their waking hours, whereas otherswho may not regularly participate in physical activitymay be nonsedentary because of their leisure activities,workplace environments, or both (8). Although studiesand subgroups of systematic reviews have explored theindependent association between sedentary behaviors
and outcomes after adjustment for physical activity, themagnitude and consistency of such associations andthe manner by which they change according to thelevel of participation in physical activity remain unclear(9–11).
The objective of this meta-analysis was to quantita-tively evaluate the association between sedentary timeand health outcomes independent of physical activityparticipation among adult populations. We hypothe-sized that sedentary time would be independently as-sociated with both cardiovascular and noncardiovascu-lar outcomes after adjusting for participation in physicalactivity but that the relative hazards associated withsedentary times would be attenuated in those who par-ticipate in higher levels of physical activity comparedwith lower levels (10).
See also:
Editorial comment . . . . . . . . . . . . . . . . . . . . . . . . . 146
Web-Only
SupplementCME quiz
Annals of Internal Medicine REVIEW
© 2015 American College of Physicians 123
METHODSData Sources and Searches
The Preferred Reporting Items for Systematic Re-views and Meta-Analyses guidelines were followed inthe conduct and reporting of this meta-analysis (9).Published studies on the association between seden-tary behavior and various health outcomes were iden-tified and cross-checked by 2 reviewers through a sys-tematic search of the MEDLINE, PubMed, EMBASE,CINAHL, Cochrane Library, Web of Knowledge, andGoogle Scholar databases. The health outcomes in-cluded all-cause mortality, cardiovascular disease inci-dence (including diabetes), cardiovascular diseasemortality, cancer incidence, cancer mortality, and all-cause hospitalizations. Searches were restricted toEnglish-language primary research articles through Au-gust 2014 with no publication date limitations (Supple-ment, available at www.annals.org). The following key-words were applied to the search: (exercise ORphysical activity OR habitual physical activity) AND (sed-entar* OR inactivity OR television OR sitting) AND(survival OR morbidity OR mortality OR disease OR hos-pital* OR utilization). References from relevant publica-tions and review articles were hand-searched to sup-plement the electronic searches. A broad andcomprehensive search strategy was chosen to encom-pass the range of outcomes associated with sedentarybehavior among different populations or settings andvariations in the operational definition of leisure-timesedentary behavior.
Study SelectionThe inclusion criteria were primary research studies
that assessed sedentary behavior in adult participantsas a distinct predictor variable, independent of physicalactivity and correlated to at least 1 health outcome. Webroadly defined sedentary behavior as a distinct classof waking behaviors characterized by little physicalmovement and low-energy expenditure (≤1.5 meta-bolic equivalents), including sitting, television watch-ing, and reclined posture (11). We allowed for studiesthat assessed the effects of varying intensities of physi-cal activity, provided that they also correlated a mea-sure of sedentary behavior with an outcome. We ex-cluded studies that assessed nonadult populations(such as children and youth), those that did not adjustfor physical activity in their statistical regression modelsor only assessed sedentary behavior as a reference cat-egory to the effects of physical activity, and those thatmeasured sedentary behavior as the lowest category ofdaily or weekly physical activity.
Data Extraction and Quality AssessmentData were extracted from all articles that met selec-
tion criteria and deemed appropriate for detailed re-view by 3 authors. If several articles of the same studywere found, then data were extracted from the mostrecently published article. Details of individual studieswere collected and characterized on the basis of au-thors or year of publication; study design; sample sizeor characteristics (age and sex); data collection meth-
ods; study outcomes; study limitations; and hazard ra-tios (HRs), odds ratios, or relative risk ratios (and theirassociated 95% CIs or SEs). We restricted studies re-porting health outcomes to those with direct associa-tions with death, disease incidence (that is, risk for dis-ease in a given period), and health service use (that is,change in health service use) outcomes. This led to theexclusion of studies reporting indirect surrogate out-comes with inconsistent clinical end points and cutoffs(such as insulin sensitivity, quality of life, activities ofdaily living, metabolic biomarkers, the metabolic syn-drome, and weight gain). Our study's primary exposurewas overall sedentary or sitting time (hours per week orhours per day). Studies reporting information on totalscreen time (television or computer screen use), televi-sion viewing time, and metabolic equivalents (hoursper week) were also abstracted when information onthe primary exposure was unavailable.
We assessed articles for quality on the basis ofmethods used by Proper and colleagues (12). Theirquality assessment tool had been previously validated(face and content) and evaluated to limit the risk of biasfrom study participation, study attrition, measurementof prognostic factors, measurement of and controllingfor confounding variables, measurement of outcomes,and analysis approaches (13, 14). Each study was eval-uated according to a standardized set of predefinedcriteria consisting of 15 items (Table 1) (15). The use ofthe original quality assessment tool was expanded topermit and score nonprospective studies. The items ofthe tool assessed study quality within the domains ofstudy population, study attrition, data collection, anddata analysis. Each quality criterion was rated as posi-tive, negative, or unknown. As with other meta-analyses, we required positive quality criteria of 8 itemsor more to be included in our study (12, 16). Two re-viewers independently scored each article for quality.Any scoring inconsistencies were discussed with an ad-ditional reviewer. Scores from each reviewer were aver-aged to attain a final quality score assessment and ver-ified by a single reviewer. When such data wereavailable, we also considered whether the effects ofprolonged bouts of sedentary time were modified bythe highest or lowest reported participation in physicalactivity (herein termed as “joint effects”).
Data Synthesis and AnalysisAll meta-analyses were done using Comprehensive
Meta-analysis, version 2 (Biostat), and the metafor pack-age of R (R Foundation for Statistical Computing) (17,18). Odds ratios, relative risk ratios, and HRs with asso-ciated 95% CIs were collected from studies for eachoutcome, if available. We considered relative risk ratiosto be equal to HRs, and when only odds ratios wereprovided, they were approximated to relative risk ratiosin which we used the assumption of rare events accord-ing to methods described and demonstrated else-where (19, 20). When studies presented several statis-tical risk-adjustment models, we only consideredrelative risk ratios associated with the statistical modelsthat contained the fewest number of additional covari-
REVIEW Sedentary Time and Disease Incidence, Mortality, and Hospitalization
124 Annals of Internal Medicine • Vol. 162 No. 2 • 20 January 2015 www.annals.org

ates beyond physical activity to enhance comparabilityacross studies. Adjustment for physical activity (ratherthan moderate to vigorous physical activity) allowed fora broader range of studies, some of which may nothave specified the intensity of physical activity in re-gression models. Knapp–Hartung small sample estima-tion was used to pool the analysis of the overall effectsize for each outcome. Studies that separately pre-sented results for men and women were combined us-ing a fixed-effects model. We received a 79% responserate from authors we had contacted to provide addi-tional statistical information for our meta-analysis (11out of 14).
Potential modifying effects of physical activity onsedentary time were examined by comparing the sta-
tistical effect sizes of any studies that reported the lon-gest period of sedentary time with the highest and low-est duration and intensity of physical activity. Statisticalheterogeneity was assessed using the Cochran Q sta-tistic and the I2 statistic of the proportion of total varia-tion because of heterogeneity (21). When we saw sub-stantial heterogeneity, we considered a Knapp–Hartungmodified random-effects model (22). For the summaryestimate, a P value less than 0.05 was considered sta-tistically significant. The potential for small study ef-fects, such as publication bias, was explored graphi-cally using funnel plots through the Egger test ofasymmetry and quantitatively by the Egger linear re-gression method (23). We also did a sensitivity analysison the effect of individual studies on the pooled meta-
Table 1. Criteria List for the Assessment of the Quality of Prospective and Nonprospective Studies*
Criteria Quality Criteria ofInformativeness orValidity/Precision
Prospective StudiesMeeting Criteria,n/N (%)
Nonprospective StudiesMeeting Criteria,n/N (%)
Study population and participation (baseline)1. Adequate (sufficient information to be able to repeat the
study) description of the source populationInformativeness 32/38 (84) 7/9 (78)
2. Adequate (sufficient information to be able to repeat thestudy) description of the sampling frame, recruitmentmethods, period of recruitment, and place of recruitment(setting and geographic location)
Validity/Precision 33/38 (87) 9/9 (100)
3. Participation rate at baseline ≥80% or if the nonresponse wasnot selective (show that the baseline study sample does notsignificantly differ from the population of eligible participants)
Informativeness 17/38 (45) 6/9 (67)
4. Adequate description of the baseline study sample (i.e.,persons entering the study) for key characteristics (number,age, sex, sedentary behavior, and health outcome)†
Informativeness 32/38 (84) 8/9 (89)
Study attrition5. Provision of the exact number at each follow-up measurement Informativeness 19/38 (50) 0/9 (0)6. Provision of the exact information on follow-up duration Validity/Precision 24/38 (63) 0/9 (0)7. Response at short-term follow-up (≤12 mo) was ≥80% of the
number at baseline, and response at long-term follow-up was≥70% of the number at baseline
Validity/Precision 20/38 (53) 0/9 (0)
8. Information on nonselective nonresponse during thefollow-up measurement(s)‡
Validity/Precision 6/38 (16) 0/9 (0)
Data collection9. Adequate measurement of sedentary behavior: done by
objective measures (i.e., accelerometry, heart rate monitoring,and observation) and not by self-report (self-report = no;no/insufficient information = unknown)
Validity/Precision 5/38 (13) 2/9 (22)
10. Sedentary behavior was assessed at a time before themeasurement of the health outcome
Validity/Precision 38/38 (100) 9/9 (100)
11. Adequate measurement of the health outcome: objectivemeasurement of the health outcome done by trainedpersonnel by means of a standardized protocol(s) ofacceptable quality and not by self-report (self-report = no;no/insufficient information = unknown)
Validity/Precision 27/38 (71) 5/9 (56)
Data analyses12. The statistical model was appropriate§ Validity/Precision 38/38 (100) 9/9 (100)13. The number of cases was ≥10 times the number of
independent variablesValidity/Precision 33/38 (87) 8/9 (89)
14. Presentation of point estimates and measures of variability(CI or SE)
Informativeness 38/38 (100) 9/9 (100)
15. No selective reporting of results Validity/Precision 29/38 (76) 8/9 (89)
* Criteria were rated as follows: "Yes" refers to an informative description of the criterion at issue and met the quality criterion, "no" refers to aninformative description but an inadequate execution or lack of description of the criterion, and "unknown" refers to an unclear or incompletedescription of the criterion.† "Yes" was given only if adequate information (sufficient information to be able to repeat the study) was given on all criteria.‡ "Yes" was given only if nonselective withdrawal on key characteristics (such as age, sex, sedentary behavior, and health outcomes) was reportedin the text or tables.§ "Yes" was given only if a multivariate regression model was used.
Sedentary Time and Disease Incidence, Mortality, and Hospitalization REVIEW
www.annals.org Annals of Internal Medicine • Vol. 162 No. 2 • 20 January 2015 125
analysis results of each outcome. The exclusion of eachindividual study and the corresponding changes on ef-fect size allowed for the determination of whether anyparticular study was influencing the pooled point esti-mate and CI.
Role of the Funding SourceThis study received no specific external funding.
RESULTSLiterature Search Results
A total of 20 980 studies were identified throughdatabase searching (7354 from PubMed, 3854 fromMEDLINE, 2591 from Web of Knowledge, 2751 fromEMBASE, 1119 from CINAHL, 2561 from GoogleScholar, and 750 from the Cochrane Library), and 25studies were added after hand-searching in-text cita-tions (Appendix Figure, available at www.annals.org).Forty-one studies provided statistical effects relevant tothe meta-analyses on all-cause mortality (829 917 par-ticipants) (24–36), cardiovascular disease-related inci-dence and mortalities (551 366 participants) (24, 27,29, 30, 32, 36–39), cancer-related incidence and mor-talities (744 706 participants) (24, 27, 29, 30, 32, 36,40–47), and type 2 diabetes incidence (26 700 partici-pants) (5, 6, 48–50). One study examined the associa-tion between sedentary time and potentially prevent-able hospitalization that met our inclusion criteria (51).
Study CharacteristicsThe characteristics of the studies assessed for qual-
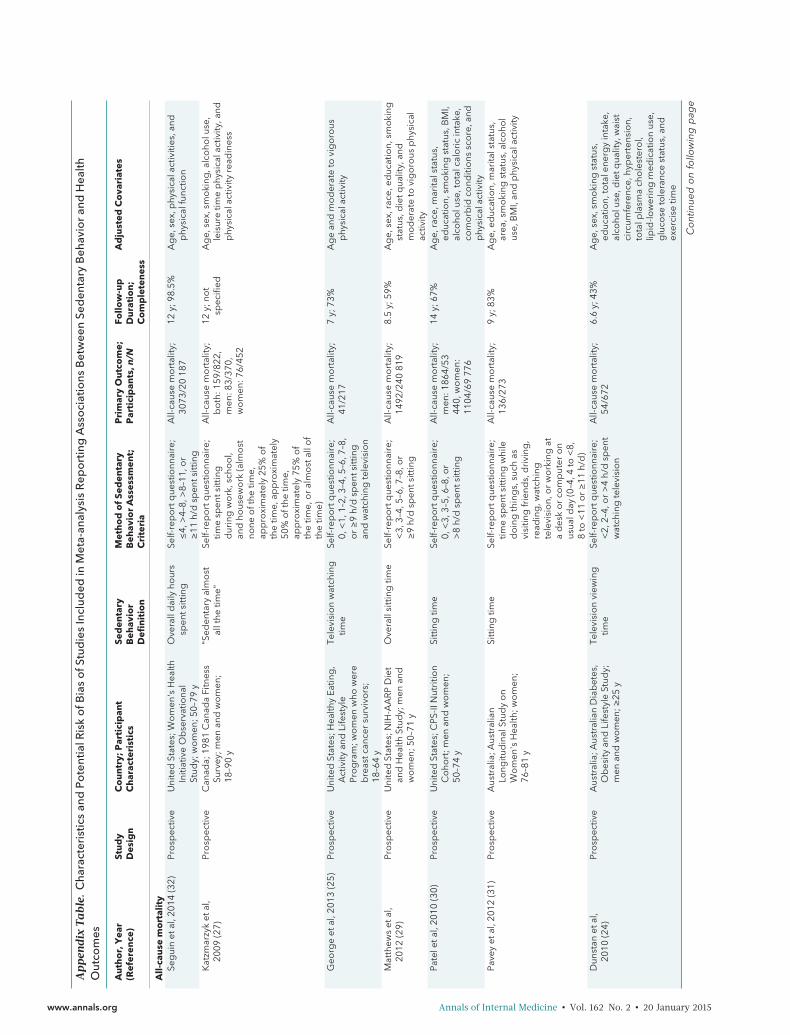
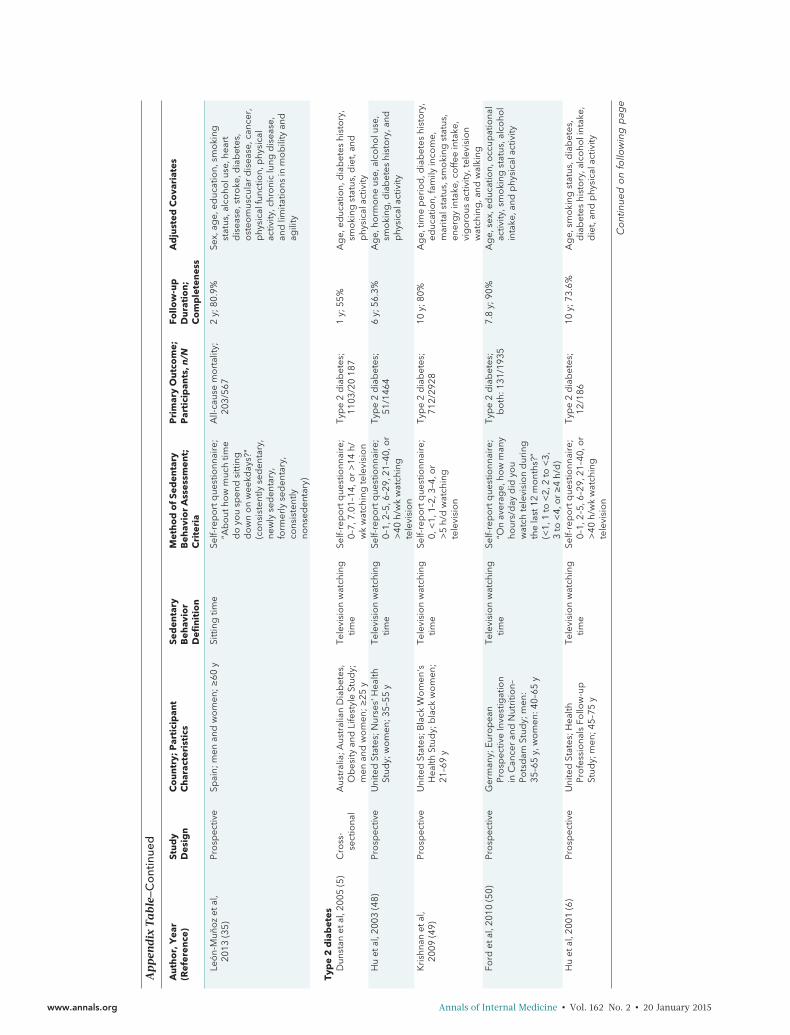
ity in our meta-analysis are summarized in Table 1. Nostudy was excluded solely because of low-qualityscores less than 8 (<50%). No randomized, controlledtrials met our selection criteria. Most studies used pro-spective cohort study designs, and 3 studies usedcross-sectional and case–control study designs. All but1 study used self-reported methods to measure pat-terns of sedentary behavior and physical activity, andthese were collected either by trained staff or directlyfrom the persons being observed. Definitions for sed-entary time varied across studies, and a range of crite-ria was used to collect information on sedentary timefrom self-report questionnaires (Appendix Table, avail-able at www.annals.org).
Publication Bias and HeterogeneityThere was statistical evidence of publication bias
among studies reporting all-cause mortality (Egger re-gression intercept, 2.63 [P = 0.015]) and cancer inci-dence (Egger regression intercept, 1.870 [P = 0.046])but no statistical evidence of publication bias for car-diovascular disease mortality (Egger regression inter-cept, 1.51 [P = 0.160]) and cancer mortality (Egger re-gression intercept, 0.957 [P = 0.156]). Publication biaswas not assessed for cardiovascular disease incidenceand type 2 diabetes incidence because the relativelyfew studies may overestimate the effects of bias.
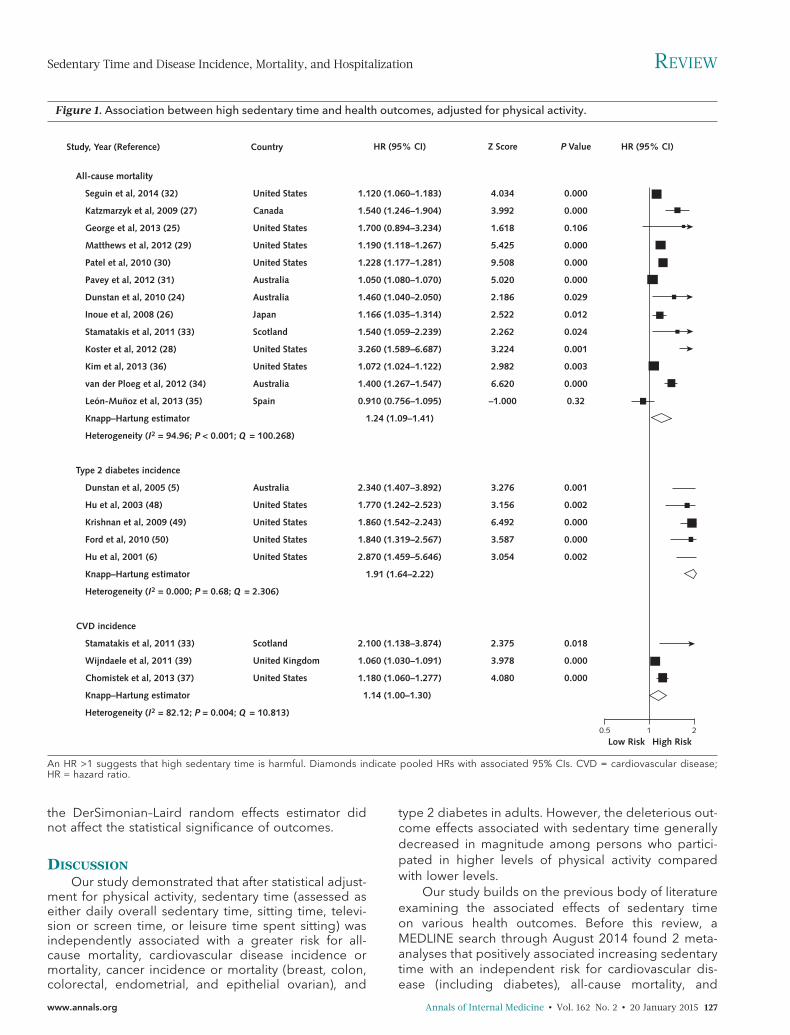
Figures 1 and 2 summarize the degree of hetero-geneity across studies. As per Higgins and colleagues'classification (52), heterogeneity within studies report-
ing all-cause mortality and cardiovascular disease inci-dence as outcomes may be high. Heterogeneity wasfound to be low for cardiovascular disease mortality,cancer mortality, cancer incidence, and type 2 diabetesincidence.
Independent Effects of Sedentary Time onHealth Outcomes
Greater sedentary time was found to be positivelyassociated with an increased risk for all-cause mortality,cardiovascular disease mortality, cancer mortality, car-diovascular disease incidence, cancer incidence, andtype 2 diabetes incidence (Figures 1 and 2). The largeststatistical effect was associated with the risk for type 2diabetes (pooled HR, 1.910 [CI, 1.642 to 2.222]).Among studies assessing cancer mortality and inci-dence, significant associations were specifically foundwith breast, colon, colorectal, endometrial, and epithe-lial ovarian cancer (3, 12, 21, 45, 52). The only studythat evaluated associations with all-cause hospitaliza-tion was a prospective study that examined whethersedentary behavior (among other modifiable health be-haviors) was correlated with potentially modifiable hos-pitalization (defined as avoidable or ambulatory care–sensitive hospitalizations) (51). Conducted among alarge cohort of men and women aged 45 years or olderin Australia, the study found that participants self-reporting fewer than 8 hours of sitting time per day hada 14% lower risk for potentially preventable hospitaliza-tion (HR, 0.86 [CI, 0.83 to 0.89]). The multivariate re-gression model was adjusted for age, sex, education,marital status, income, geographic remoteness of resi-dence, language spoken at home, health insurance,chronic disease history, previous admission for poten-tially preventable hospitalization, moderate to vigorousphysical activity, and other health behaviors.
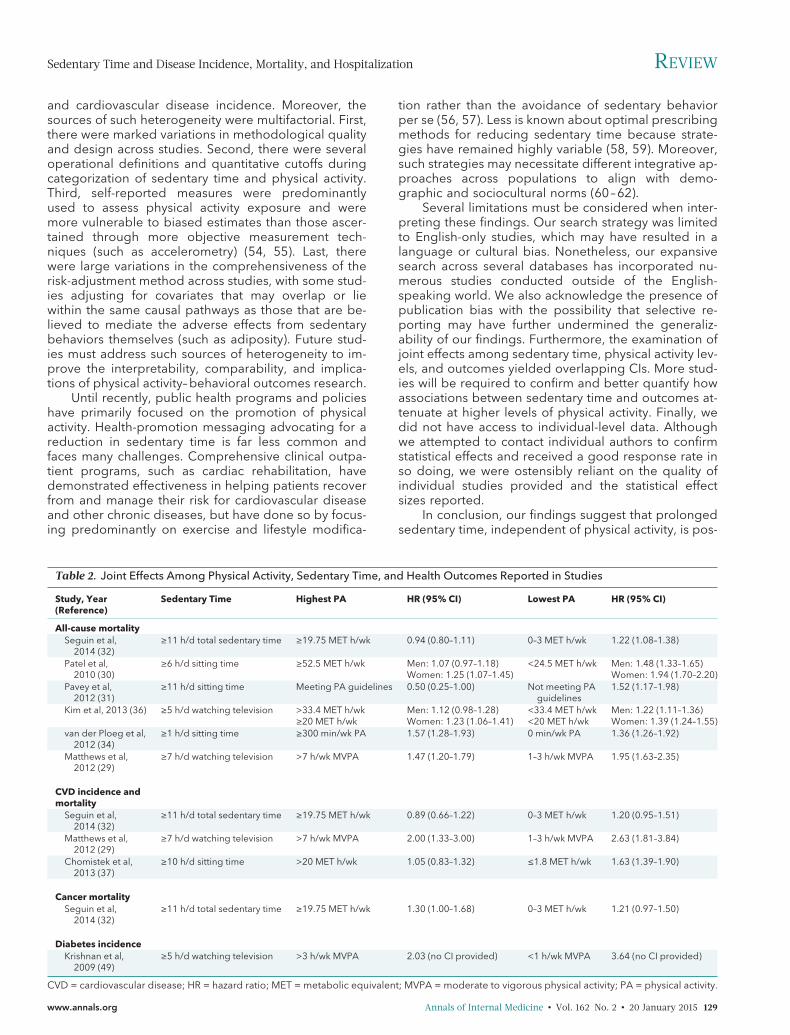
Joint Effects Among Physical Activity, SedentaryTime, and Health Outcomes
Ten studies reported joint effects among sedentarytime, physical activity, and health outcomes (29–32, 34,36, 37, 49). The relative hazards associated with seden-tary time on outcomes varied according to physical ac-tivity levels and were generally more pronounced atlower levels than at higher levels (Table 2). However,given the limited number of available studies, ourmeta-analysis examining the joint effects betweenphysical activity and exercise was restricted to all-causemortality. Sedentary time was associated with a 30%lower relative risk for all-cause mortality among thosewith high levels of physical activity (pooled HR, 1.16 [CI,0.84 to 1.59]) as compared with those with low levels ofphysical activity (pooled HR, 1.46 [CI, 1.22 to 1.75])(Figure 3).
Sensitivity AnalysisThe pooled effect estimates for the associations
between sedentary time and risk for all-cause mortality,cardiovascular disease mortality, cancer mortality, can-cer incidence, and diabetes did not change substan-tially with the exclusion of any individual study. The ex-clusion of nonprospective studies as well as applying
REVIEW Sedentary Time and Disease Incidence, Mortality, and Hospitalization
126 Annals of Internal Medicine • Vol. 162 No. 2 • 20 January 2015 www.annals.org
the DerSimonian–Laird random effects estimator didnot affect the statistical significance of outcomes.
DISCUSSIONOur study demonstrated that after statistical adjust-
ment for physical activity, sedentary time (assessed aseither daily overall sedentary time, sitting time, televi-sion or screen time, or leisure time spent sitting) wasindependently associated with a greater risk for all-cause mortality, cardiovascular disease incidence ormortality, cancer incidence or mortality (breast, colon,colorectal, endometrial, and epithelial ovarian), and
type 2 diabetes in adults. However, the deleterious out-come effects associated with sedentary time generallydecreased in magnitude among persons who partici-pated in higher levels of physical activity comparedwith lower levels.
Our study builds on the previous body of literatureexamining the associated effects of sedentary timeon various health outcomes. Before this review, aMEDLINE search through August 2014 found 2 meta-analyses that positively associated increasing sedentarytime with an independent risk for cardiovascular dis-ease (including diabetes), all-cause mortality, and
Figure 1. Association between high sedentary time and health outcomes, adjusted for physical activity.
All-cause mortality
Seguin et al, 2014 (32)
Katzmarzyk et al, 2009 (27)
George et al, 2013 (25)
Matthews et al, 2012 (29)
Patel et al, 2010 (30)
Pavey et al, 2012 (31)
Dunstan et al, 2010 (24)
Inoue et al, 2008 (26)
Stamatakis et al, 2011 (33)
Koster et al, 2012 (28)
Kim et al, 2013 (36)
van der Ploeg et al, 2012 (34)
León-Muñoz et al, 2013 (35)
Knapp–Hartung estimator
Heterogeneity (I2 = 94.96; P < 0.001; Q = 100.268)
Type 2 diabetes incidence
Dunstan et al, 2005 (5)
Hu et al, 2003 (48)
Krishnan et al, 2009 (49)
Ford et al, 2010 (50)
Hu et al, 2001 (6)
Knapp–Hartung estimator
Heterogeneity (I2 = 0.000; P = 0.68; Q = 2.306)
CVD incidence
Stamatakis et al, 2011 (33)
Wijndaele et al, 2011 (39)
Chomistek et al, 2013 (37)
Knapp–Hartung estimator
Heterogeneity (I2 = 82.12; P = 0.004; Q = 10.813)
Study, Year (Reference) Country
United States
Canada
United States
United States
United States
Australia
Australia
Japan
Scotland
United States
United States
Australia
Spain
Australia
United States
United States
United States
United States
Scotland
United Kingdom
United States
Z Score
4.034
3.992
1.618
5.425
9.508
5.020
2.186
2.522
2.262
3.224
2.982
6.620
–1.000
3.276
3.156
6.492
3.587
3.054
2.375
3.978
4.080
HR (95% CI)
1.120 (1.060–1.183)
1.540 (1.246–1.904)
1.700 (0.894–3.234)
1.190 (1.118–1.267)
1.228 (1.177–1.281)
1.050 (1.080–1.070)
1.460 (1.040–2.050)
1.166 (1.035–1.314)
1.540 (1.059–2.239)
3.260 (1.589–6.687)
1.072 (1.024–1.122)
1.400 (1.267–1.547)
0.910 (0.756–1.095)
1.24 (1.09–1.41)
2.340 (1.407–3.892)
1.770 (1.242–2.523)
1.860 (1.542–2.243)
1.840 (1.319–2.567)
2.870 (1.459–5.646)
1.91 (1.64–2.22)
2.100 (1.138–3.874)
1.060 (1.030–1.091)
1.180 (1.060–1.277)
1.14 (1.00–1.30)
P Value HR (95% CI)
Low Risk High Risk
0.000
0.000
0.106
0.000
0.000
0.000
0.029
0.012
0.024
0.001
0.003
0.000
0.32
0.001
0.002
0.000
0.000
0.002
0.018
0.000
0.000
210.5
An HR >1 suggests that high sedentary time is harmful. Diamonds indicate pooled HRs with associated 95% CIs. CVD = cardiovascular disease;HR = hazard ratio.
Sedentary Time and Disease Incidence, Mortality, and Hospitalization REVIEW
www.annals.org Annals of Internal Medicine • Vol. 162 No. 2 • 20 January 2015 127

certain cancer types (20, 53). However, unlike our sys-tematic review and meta-analysis, which focused exclu-sively on studies that adjusted for physical activity, onlya few studies included in these 2 previous meta-analyses adjusted for physical activity, and did so onlyamong a limited subgroup of available studies. Previ-ous studies lacked precision in the estimated indepen-dent effect sizes of associations between sedentarytime and outcomes. Moreover, previous meta-analyseswere not designed to examine the extent to which lev-els of physical activity may potentially modify associa-tions between sedentary time and outcomes. The con-sistency in the magnitude of effects associated withsedentary time across various cardiovascular and non-
cardiovascular outcomes after adjustment for physicalactivity underscores the validity and strength of associ-ation and provides confidence that such associationsmay indeed be causally linked. Although more re-search is required to better understand how changes inphysical activity may modify the deleterious effects ofprolonged sedentary time, our study suggests thatthese associations may vary according to the level ofphysical activity and become less pronounced as par-ticipation in physical activity increases.
Our study has also provided greater insight intothe various sources of heterogeneity than previouslypublished systematic reviews. Statistical heterogeneitywas highest for studies examining all-cause mortality
Figure 2. Association between high sedentary time and health outcomes, adjusted for physical activity.
CVD mortality
Seguin et al, 2014 (32)
Katzmarzyk et al, 2009 (27)
Matthews et al, 2012 (29)
Patel et al, 2010 (30)
Dunstan et al, 2010 (24)
Kim et al, 2013 (36)
Knapp–Hartung estimator
Heterogeneity (I2 = 19.22; P = 0.170; Q = 7.766)
Cancer incidence
Friberg et al, 2006 (41)
Howard et al, 2008 (42)
Zhang et al, 2004 (43)
George et al, 2010 (44)
Hildebrand et al, 2013 (45)
Teras et al, 2012 (46)
Peplonska et al, 2008 (47)
Knapp–Hartung estimator
Heterogeneity (I2 = 0.00; P = 0.39; Q = 6.355)
Cancer mortality
Seguin et al, 2014 (32)
Campbell et al, 2013 (40)
Katzmarzyk et al, 2009 (27)
Patel et al, 2010 (30)
Matthews et al, 2012 (29)
Dunstan et al, 2010 (24)
Kim et al, 2013 (36)
Knapp–Hartung estimator
Heterogeneity (I2 = 0.23; P = 0.54; Q = 5.039)
Study, Year (Reference) HR (95% CI)
Low Risk High Risk210.5
Country
United States
Canada
United States
United States
Australia
United States
Sweden
United States
China
United States
United States
United States
Poland
United States
United States
Canada
United States
United States
Australia
United States
Z Score
2.262
2.438
2.262
5.323
1.955
2.753
2.534
2.228
1.960
1.383
2.188
0.867
0.594
3.674
2.294
0.330
3.521
2.275
1.478
3.517
HR (95% CI)
1.140 (1.018–1.277)
1.540 (1.091–2.173)
1.160 (1.020–1.319)
1.228 (1.139–1.324)
1.800 (0.998–3.245)
1.115 (1.032–1.205)
1.18 (1.11–1.24)
1.800 (1.142–2.836)
1.240 (1.026–1.498)
1.190 (1.000–1.416)
1.120 (0.954–1.315)
1.100 (1.010–1.198)
1.066 (0.923–1.232)
1.100 (0.803–1.506)
1.13 (1.05–1.21)
1.220 (1.097–1.357)
1.620 (1.073–2.446)
1.070 (0.716–1.600)
1.146 (1.062–1.236)
1.120 (1.016–1.235)
1.480 (0.880–2.490)
1.149 (1.063–1.241)
1.16 (1.10–1.22)
P Value
0.024
0.014
0.024
0.000
0.051
0.006
0.011
0.026
0.050
0.167
0.029
0.386
0.552
0.000
0.022
0.742
0.000
0.023
0.140
0.000
An HR >1 suggests that high sedentary time is harmful. Diamonds indicate overall HRs with associated 95% CIs. CVD = cardiovascular disease;HR = hazard ratio.
REVIEW Sedentary Time and Disease Incidence, Mortality, and Hospitalization
128 Annals of Internal Medicine • Vol. 162 No. 2 • 20 January 2015 www.annals.org
and cardiovascular disease incidence. Moreover, thesources of such heterogeneity were multifactorial. First,there were marked variations in methodological qualityand design across studies. Second, there were severaloperational definitions and quantitative cutoffs duringcategorization of sedentary time and physical activity.Third, self-reported measures were predominantlyused to assess physical activity exposure and weremore vulnerable to biased estimates than those ascer-tained through more objective measurement tech-niques (such as accelerometry) (54, 55). Last, therewere large variations in the comprehensiveness of therisk-adjustment method across studies, with some stud-ies adjusting for covariates that may overlap or liewithin the same causal pathways as those that are be-lieved to mediate the adverse effects from sedentarybehaviors themselves (such as adiposity). Future stud-ies must address such sources of heterogeneity to im-prove the interpretability, comparability, and implica-tions of physical activity–behavioral outcomes research.
Until recently, public health programs and policieshave primarily focused on the promotion of physicalactivity. Health-promotion messaging advocating for areduction in sedentary time is far less common andfaces many challenges. Comprehensive clinical outpa-tient programs, such as cardiac rehabilitation, havedemonstrated effectiveness in helping patients recoverfrom and manage their risk for cardiovascular diseaseand other chronic diseases, but have done so by focus-ing predominantly on exercise and lifestyle modifica-
tion rather than the avoidance of sedentary behaviorper se (56, 57). Less is known about optimal prescribingmethods for reducing sedentary time because strate-gies have remained highly variable (58, 59). Moreover,such strategies may necessitate different integrative ap-proaches across populations to align with demo-graphic and sociocultural norms (60–62).
Several limitations must be considered when inter-preting these findings. Our search strategy was limitedto English-only studies, which may have resulted in alanguage or cultural bias. Nonetheless, our expansivesearch across several databases has incorporated nu-merous studies conducted outside of the English-speaking world. We also acknowledge the presence ofpublication bias with the possibility that selective re-porting may have further undermined the generaliz-ability of our findings. Furthermore, the examination ofjoint effects among sedentary time, physical activity lev-els, and outcomes yielded overlapping CIs. More stud-ies will be required to confirm and better quantify howassociations between sedentary time and outcomes at-tenuate at higher levels of physical activity. Finally, wedid not have access to individual-level data. Althoughwe attempted to contact individual authors to confirmstatistical effects and received a good response rate inso doing, we were ostensibly reliant on the quality ofindividual studies provided and the statistical effectsizes reported.
In conclusion, our findings suggest that prolongedsedentary time, independent of physical activity, is pos-
Table 2. Joint Effects Among Physical Activity, Sedentary Time, and Health Outcomes Reported in Studies
Study, Year(Reference)
Sedentary Time Highest PA HR (95% CI) Lowest PA HR (95% CI)
All-cause mortalitySeguin et al,
2014 (32)≥11 h/d total sedentary time ≥19.75 MET h/wk 0.94 (0.80–1.11) 0–3 MET h/wk 1.22 (1.08–1.38)
Patel et al,2010 (30)
≥6 h/d sitting time ≥52.5 MET h/wk Men: 1.07 (0.97–1.18)Women: 1.25 (1.07–1.45)
<24.5 MET h/wk Men: 1.48 (1.33–1.65)Women: 1.94 (1.70–2.20)
Pavey et al,2012 (31)
≥11 h/d sitting time Meeting PA guidelines 0.50 (0.25–1.00) Not meeting PAguidelines
1.52 (1.17–1.98)
Kim et al, 2013 (36) ≥5 h/d watching television >33.4 MET h/wk≥20 MET h/wk
Men: 1.12 (0.98–1.28)Women: 1.23 (1.06–1.41)
<33.4 MET h/wk<20 MET h/wk
Men: 1.22 (1.11–1.36)Women: 1.39 (1.24–1.55)
van der Ploeg et al,2012 (34)
≥1 h/d sitting time ≥300 min/wk PA 1.57 (1.28–1.93) 0 min/wk PA 1.36 (1.26–1.92)
Matthews et al,2012 (29)
≥7 h/d watching television >7 h/wk MVPA 1.47 (1.20–1.79) 1–3 h/wk MVPA 1.95 (1.63–2.35)
CVD incidence andmortality
Seguin et al,2014 (32)
≥11 h/d total sedentary time ≥19.75 MET h/wk 0.89 (0.66–1.22) 0–3 MET h/wk 1.20 (0.95–1.51)
Matthews et al,2012 (29)
≥7 h/d watching television >7 h/wk MVPA 2.00 (1.33–3.00) 1–3 h/wk MVPA 2.63 (1.81–3.84)
Chomistek et al,2013 (37)
≥10 h/d sitting time >20 MET h/wk 1.05 (0.83–1.32) ≤1.8 MET h/wk 1.63 (1.39–1.90)
Cancer mortalitySeguin et al,
2014 (32)≥11 h/d total sedentary time ≥19.75 MET h/wk 1.30 (1.00–1.68) 0–3 MET h/wk 1.21 (0.97–1.50)
Diabetes incidenceKrishnan et al,
2009 (49)≥5 h/d watching television >3 h/wk MVPA 2.03 (no CI provided) <1 h/wk MVPA 3.64 (no CI provided)
CVD = cardiovascular disease; HR = hazard ratio; MET = metabolic equivalent; MVPA = moderate to vigorous physical activity; PA = physical activity.
Sedentary Time and Disease Incidence, Mortality, and Hospitalization REVIEW
www.annals.org Annals of Internal Medicine • Vol. 162 No. 2 • 20 January 2015 129

itively associated with various deleterious health out-comes. These results and others reaffirm the need forgreater public awareness about the hazards associatedwith sedentary behaviors and justify further research toexplore the effectiveness of interventions designed totarget sedentary time independently from, and in addi-tion to, physical activity.
From the Institute of Health Policy, Management and Evalua-tion, and the Faculty of Kinesiology and Physical Education,University of Toronto; University Health Network–Toronto Re-habilitation Institute, Cardiovascular Prevention and Rehabili-tation Program; Sunnybrook Health Sciences Centre; YorkUniversity; and Institute for Clinical Evaluative Sciences, To-ronto, Ontario, Canada.
Financial Support: Dr. Alter is supported with a career inves-tigator award from the Heart and Stroke Foundation of Can-ada. Dr Faulkner is supported with a Canadian Institutes ofHealth Research-Public Health Agency of Canada (CIHR-PHAC) Chair in Applied Public Health. Dr. Oh is supportedwith a Goodlife Fitness Chair in Cardiovascular Rehabilitationand Prevention, University Health Network-Toronto Rehabili-tation Institute, University of Toronto.
Disclosures: Authors have disclosed no conflicts of interest.Forms can be viewed at www.acponline.org/authors/icmje/ConflictOfInterestForms.do?msNum=M14-1651.
Requests for Single Reprints: David A. Alter, MD, PhD, Insti-tute for Clinical Evaluative Sciences, 2075 Bayview Avenue,
Figure 3. Pooled associations between high sedentary time and health outcomes and modifying effects of physical activity.
Pooled effects
Outcome
All-cause mortality (13 studies)
CVD mortality (6 studies)
CVD incidence (3 studies)
Cancer mortality (7 studies)
Cancer incidence (7 studies)
Diabetes incidence (5 studies)
Knapp–Hartung estimator
Heterogeneity (I2 = 92.62; P < 0.001; Q = 40.234)
Modifying effects of physical activity on risk for all-cause mortality
Study, Year (Reference)
High physical activity, high sedentary time
Seguin et al, 2014 (32)
Patel et al, 2010 (30)
Pavey et al, 2012 (31)
Kim et al, 2013 (36)
van der Ploeg et al, 2012 (34)
Matthews et al, 2012 (29)
Knapp–Hartung estimator
Heterogeneity (I2 = 90.06; P < 0.001; Q = 26.487)
Low physical activity, high sedentary time
Seguin et al, 2014 (32)
Patel et al, 2010 (30)
Pavey et al, 2012 (31)
Kim et al, 2013 (36)
van der Ploeg et al, 2012 (34)
Matthews et al, 2012 (29)
Knapp–Hartung estimator
Heterogeneity (I2 = 89.83; P <0.001; Q = 38.126)
Effects Z Score
3.276
5.049
0.633
5.469
3.378
8.377
–0.741
2.692
–1.960
3.149
4.306
3.777
3.180
11.729
3.120
6.879
7.891
7.156
HR (95% CI)
1.240 (1.090–1.410)
1.179 (1.106–1.257)
1.143 (1.002–1.729)
1.173 (1.108–1.242)
1.130 (1.053–1.213)
1.910 (1.642–2.222)
1.26 (1.03–1.55)
0.940 (0.798–1.107)
1.120 (1.031–1.216)
0.500 (0.250–1.000)
1.170 (1.061–1.290)
1.570 (1.279–1.928)
1.470 (1.204–1.795)
1.16 (0.84–1.59)
1.220 (1.079–1.379)
1.649 (1.517–1.793)
1.520 (1.168–1.977)
1.288 (1.198–1.384)
1.360 (1.260–1.468)
1.950 (1.624–2.341)
1.46 (1.22–1.75)
P Value HR (95% CI)
Low Risk High Risk
0.001
0.000
0.53
0.000
0.001
0.000
0.46
0.007
0.050
0.002
0.000
0.000
0.001
0.000
0.002
0.000
0.000
0.000
210.5
An HR >1 suggests that high sedentary time is harmful. Diamonds indicate overall HRs with associated 95% CIs. CVD = cardiovascular disease;HR = hazard ratio.
REVIEW Sedentary Time and Disease Incidence, Mortality, and Hospitalization
130 Annals of Internal Medicine • Vol. 162 No. 2 • 20 January 2015 www.annals.org

G1-06, Toronto, Ontario M4N 3M5, Canada; e-mail, [email protected].
Current author addresses and author contributions are avail-able at www.annals.org.
References1. Canadian Society for Exercise Physiology. Canadian Physical Ac-tivity Guidelines and Canadian Sedentary Behaviour Guidelines.2013. Accessed at www.csep.ca/guidelines on 28 August 2014.2. Warburton DER, Katzmarzyk PT, Rhodes RE, Shephard RJ.Evidence-informed physical activity guidelines for Canadian adults.Appl Physiol Nutr Metab. 2007;32:S16-S68.3. Lee IM, Sesso HD, Oguma Y, Paffenbarger RS Jr. Relative intensityof physical activity and risk of coronary heart disease. Circulation.2003;107:1110-6. [PMID: 12615787]4. Matthews CE, Chen KY, Freedson PS, Buchowski MS, Beech BM,Pate RR, et al. Amount of time spent in sedentary behaviors in theUnited States, 2003–2004. Am J Epidemiol. 2008;167:875-81.[PMID: 18303006] doi:10.1093/aje/kwm3905. Dunstan DW, Salmon J, Owen N, Armstrong T, Zimmet PZ, Wel-born TA, et al; AusDiab Steering Committee. Associations of TVviewing and physical activity with the metabolic syndrome in Austra-lian adults. Diabetologia. 2005;48:2254-61. [PMID: 16211373]6. Hu FB, Leitzmann MF, Stampfer MJ, Colditz GA, Willett WC, RimmEB. Physical activity and television watching in relation to risk for type2 diabetes mellitus in men. Arch Intern Med. 2001;161:1542-8.[PMID: 11427103]7. Hamilton MT, Hamilton DG, Zderic TW. Role of low energy expen-diture and sitting in obesity, metabolic syndrome, type 2 diabetes,and cardiovascular disease. Diabetes. 2007;56:2655-67. [PMID:17827399]8. Craft LL, Zderic TW, Gapstur SM, Vaniterson EH, Thomas DM,Siddique J, et al. Evidence that women meeting physical activityguidelines do not sit less: an observational inclinometry study. Int JBehav Nutr Phys Act. 2012;9:122. [PMID: 23034100] doi:10.1186/1479-5868-9-1229. Moher D, Liberati A, Tetzlaff J, Altman DG; PRISMA Group. Pre-ferred reporting items for systematic reviews and meta-analyses: thePRISMA statement. Ann Intern Med. 2009;151:264-9, W64. [PMID:19622511]10. Salmon J, Bauman A, Crawford D, Timperio A, Owen N. Theassociation between television viewing and overweight among Aus-tralian adults participating in varying levels of leisure-time physicalactivity. Int J Obes Relat Metab Disord. 2000;24:600-6. [PMID:10849582]11. Tremblay MS, Colley RC, Saunders TJ, Healy GN, Owen N. Phys-iological and health implications of a sedentary lifestyle. Appl PhysiolNutr Metab. 2010;35:725-40. [PMID: 21164543] doi:10.1139/H10-07912. Proper KI, Singh AS, van Mechelen W, Chinapaw MJ. Sedentarybehaviors and health outcomes among adults: a systematic reviewof prospective studies. Am J Prev Med. 2011;40:174-82. [PMID:21238866] doi:10.1016/j.amepre.2010.10.01513. Hoogendoorn WE, van Poppel MN, Bongers PM, Koes BW,Bouter LM. Systematic review of psychosocial factors at work andprivate life as risk factors for back pain. Spine (Phila Pa 1976). 2000;25:2114-25. [PMID: 10954644]14. Singh AS, Mulder C, Twisk JW, van Mechelen W, Chinapaw MJ.Tracking of childhood overweight into adulthood: a systematic re-view of the literature. Obes Rev. 2008;9:474-88. [PMID: 18331423]doi:10.1111/j.1467-789X.2008.00475.x15. Hayden JA, Cote P, Bombardier C. Evaluation of the quality ofprognosis studies in systematic reviews. Ann Intern Med. 2006;144:427-37. [PMID: 16549855]16. Koeneman MA, Verheijden MW, Chinapaw MJ, Hopman-RockM. Determinants of physical activity and exercise in healthy older
adults: a systematic review. Int J Behav Nutr Phys Act. 2011;8:142.[PMID: 22204444] doi:10.1186/1479-5868-8-14217. Borenstein M, Hedges L, Higgins J, Rothstein H. ComprehensiveMeta Analysis. 2nd ed. Englewood, NJ: Biostat; 2005.18. Viechtbauer W. Conducting meta-analyses in R with the metaforpackage. J Stat Softw. 2010;36:1-48.19. Zhang J, Yu KF. What's the relative risk? A method of correctingthe odds ratio in cohort studies of common outcomes. JAMA. 1998;280:1690-1. [PMID: 9832001]20. Wilmot EG, Edwardson CL, Achana FA, Davies MJ, Gorely T,Gray LJ, et al. Sedentary time in adults and the association with dia-betes, cardiovascular disease and death: systematic review andmeta-analysis. Diabetologia. 2012;55:2895-905. [PMID: 22890825]doi:10.1007/s00125-012-2677-z21. Higgins JP, Thompson SG. Quantifying heterogeneity in a meta-analysis. Stat Med. 2002;21:1539-58. [PMID: 12111919]22. Knapp G, Hartung J. Improved tests for a random effects meta-regression with a single covariate. Stat Med. 2003;22:2693-710.[PMID: 12939780]23. Egger M, Davey Smith G, Schneider M, Minder C. Bias in meta-analysis detected by a simple, graphical test. BMJ. 1997;315:629-34.[PMID: 9310563]24. Dunstan DW, Barr EL, Healy GN, Salmon J, Shaw JE, Balkau B,et al. Television viewing time and mortality: the Australian Diabetes,Obesity and Lifestyle Study (AusDiab). Circulation. 2010;121:384-91. [PMID: 20065160] doi:10.1161/CIRCULATIONAHA.109.89482425. George ES, Rosenkranz RR, Kolt GS. Chronic disease and sittingtime in middle-aged Australian males: findings from the 45 and UpStudy. Int J Behav Nutr Phys Act. 2013;10:20. [PMID: 23394382] doi:10.1186/1479-5868-10-2026. Inoue M, Iso H, Yamamoto S, Kurahashi N, Iwasaki M, Sasazuki S,et al; Japan Public Health Center-Based Prospective Study Group.Daily total physical activity level and premature death in men andwomen: results from a large-scale population-based cohort studyin Japan (JPHC study). Ann Epidemiol. 2008;18:522-30. [PMID:18504139] doi:10.1016/j.annepidem.2008.03.00827. Katzmarzyk PT, Church TS, Craig CL, Bouchard C. Sitting timeand mortality from all causes, cardiovascular disease, and cancer.Med Sci Sports Exerc. 2009;41:998-1005. [PMID: 19346988] doi:10.1249/MSS.0b013e318193035528. Koster A, Caserotti P, Patel KV, Matthews CE, Berrigan D, VanDomelen DR, et al. Association of sedentary time with mortality in-dependent of moderate to vigorous physical activity. PLoS One.2012;7:e37696. [PMID: 22719846] doi:10.1371/journal.pone.003769629. Matthews CE, George SM, Moore SC, Bowles HR, Blair A, Park Y,et al. Amount of time spent in sedentary behaviors and cause-specific mortality in US adults. Am J Clin Nutr. 2012;95:437-45.[PMID: 22218159] doi:10.3945/ajcn.111.01962030. Patel AV, Bernstein L, Deka A, Feigelson HS, Campbell PT, Gap-stur SM, et al. Leisure time spent sitting in relation to total mortality ina prospective cohort of US adults. Am J Epidemiol. 2010;172:419-29. [PMID: 20650954] doi:10.1093/aje/kwq15531. Pavey TG, Peeters GG, Brown WJ. Sitting-time and 9-year all-cause mortality in older women. Br J Sports Med. 2012. [PMID:23243009]32. Seguin R, Buchner DM, Liu J, Allison M, Manini T, Wang CY, et al.Sedentary behavior and mortality in older women: the Women'sHealth Initiative. Am J Prev Med. 2014;46:122-35. [PMID: 24439345]doi:10.1016/j.amepre.2013.10.02133. Stamatakis E, Hamer M, Dunstan DW. Screen-based enter-tainment time, all-cause mortality, and cardiovascular events:population-based study with ongoing mortality and hospital eventsfollow-up. J Am Coll Cardiol. 2011;57:292-9. [PMID: 21232666] doi:10.1016/j.jacc.2010.05.06534. van der Ploeg HP, Chey T, Korda RJ, Banks E, Bauman A. Sittingtime and all-cause mortality risk in 222 497 Australian adults. ArchIntern Med. 2012;172:494-500. [PMID: 22450936] doi:10.1001/archinternmed.2011.2174
Sedentary Time and Disease Incidence, Mortality, and Hospitalization REVIEW
www.annals.org Annals of Internal Medicine • Vol. 162 No. 2 • 20 January 2015 131
35. Leon-Munoz LM, Martınez-Gomez D, Balboa-Castillo T, Lopez-Garcıa E, Guallar-Castillon P, Rodrıguez-Artalejo F. Continued sed-entariness, change in sitting time, and mortality in older adults. MedSci Sports Exerc. 2013;45:1501-7. [PMID: 23439420] doi:10.1249/MSS.0b013e3182897e8736. Kim Y, Wilkens LR, Park SY, Goodman MT, Monroe KR, KolonelLN. Association between various sedentary behaviours and all-cause, cardiovascular disease and cancer mortality: the MultiethnicCohort Study. Int J Epidemiol. 2013;42:1040-56. [PMID: 24062293]doi:10.1093/ije/dyt10837. Chomistek AK, Manson JE, Stefanick ML, Lu B, Sands-Lincoln M,Going SB, et al. Relationship of sedentary behavior and physical ac-tivity to incident cardiovascular disease: results from the Women'sHealth Initiative. J Am Coll Cardiol. 2013;61:2346-54. [PMID:23583242] doi:10.1016/j.jacc.2013.03.03138. Stamatakis E, Hamer M, Dunstan DW. Screen-based enter-tainment time, all-cause mortality, and cardiovascular events:population-based study with ongoing mortality and hospital eventsfollow-up. J Am Coll Cardiol. 2011;57:292-9. [PMID: 21232666] doi:10.1016/j.jacc.2010.05.06539. Wijndaele K, Brage S, Besson H, Khaw KT, Sharp SJ, Luben R,et al. Television viewing time independently predicts all-cause andcardiovascular mortality: the EPIC Norfolk study. Int J Epidemiol.2011;40:150-9. [PMID: 20576628] doi:10.1093/ije/dyq10540. Campbell PT, Patel AV, Newton CC, Jacobs EJ, Gapstur SM.Associations of recreational physical activity and leisure time spentsitting with colorectal cancer survival. J Clin Oncol. 2013;31:876-85.[PMID: 23341510] doi:10.1200/JCO.2012.45.973541. Friberg E, Mantzoros CS, Wolk A. Physical activity and risk ofendometrial cancer: a population-based prospective cohort study.Cancer Epidemiol Biomarkers Prev. 2006;15:2136-40. [PMID:17057024]42. Howard RA, Freedman DM, Park Y, Hollenbeck A, Schatzkin A,Leitzmann MF. Physical activity, sedentary behavior, and the risk ofcolon and rectal cancer in the NIH-AARP Diet and Health Study. Can-cer Causes Control. 2008;19:939-53. [PMID: 18437512] doi:10.1007/s10552-008-9159-043. Zhang M, Xie X, Lee AH, Binns CW. Sedentary behaviours andepithelial ovarian cancer risk. Cancer Causes Control. 2004;15:83-9.[PMID: 14970738]44. George SM, Irwin ML, Matthews CE, Mayne ST, Gail MH, MooreSC, et al. Beyond recreational physical activity: examining occupa-tional and household activity, transportation activity, and sedentarybehavior in relation to postmenopausal breast cancer risk. Am JPublic Health. 2010;100:2288-95. [PMID: 20864719] doi:10.2105/AJPH.2009.18082845. Hildebrand JS, Gapstur SM, Campbell PT, Gaudet MM, Patel AV.Recreational physical activity and leisure-time sitting in relation topostmenopausal breast cancer risk. Cancer Epidemiol BiomarkersPrev. 2013;22:1906-12. [PMID: 24097200] doi:10.1158/1055-9965.EPI-13-040746. Teras LR, Gapstur SM, Diver WR, Birmann BM, Patel AV. Recre-ational physical activity, leisure sitting time and risk of non-Hodgkinlymphoid neoplasms in the American Cancer Society Cancer Preven-tion Study II Cohort. Int J Cancer. 2012;131:1912-20. [PMID:22275172] doi:10.1002/ijc.2744547. Peplonska B, Lissowska J, Hartman TJ, Szeszenia-Dabrowska N,Blair A, Zatonski W, et al. Adulthood lifetime physical activity and
breast cancer. Epidemiology. 2008;19:226-36. [PMID: 18277160]doi:10.1097/EDE.0b013e3181633bfb48. Hu FB, Li TY, Colditz GA, Willett WC, Manson JE. Televisionwatching and other sedentary behaviors in relation to risk of obesityand type 2 diabetes mellitus in women. JAMA. 2003;289:1785-91.[PMID: 12684356]49. Krishnan S, Rosenberg L, Palmer JR. Physical activity and televi-sion watching in relation to risk of type 2 diabetes: the Black Wom-en's Health Study. Am J Epidemiol. 2009;169:428-34. [PMID:19056835] doi:10.1093/aje/kwn34450. Ford ES, Schulze MB, Kroger J, Pischon T, Bergmann MM, Boe-ing H. Television watching and incident diabetes: Findings from theEuropean Prospective Investigation into Cancer and Nutrition-Potsdam Study. J Diabetes. 2010;2:23-7. [PMID: 20923471] doi:10.1111/j.1753-0407.2009.00047.x51. Tran B, Falster MO, Douglas K, Blyth F, Jorm LR. Health behav-iours and potentially preventable hospitalisation: a prospective studyof older Australian adults. PLoS One. 2014;9:e93111. [PMID:24691471] doi:10.1371/journal.pone.009311152. Higgins JP, Thompson SG, Deeks JJ, Altman DG. Measuringinconsistency in meta-analyses. BMJ. 2003;327:557-60. [PMID:12958120]53. Schmid D, Leitzmann MF. Television viewing and time spent sed-entary in relation to cancer risk: a meta-analysis. J Natl Cancer Inst.2014;106. [PMID: 24935969] doi:10.1093/jnci/dju09854. Colley RC, Garriguet D, Janssen I, Craig CL, Clarke J, TremblayMS. Physical activity of Canadian adults: accelerometer results fromthe 2007 to 2009 Canadian Health Measures Survey. Health Rep.2011;22:7-14. [PMID: 21510585]55. Atkin AJ, Gorely T, Clemes SA, Yates T, Edwardson C, Brage S,et al. Methods of Measurement in epidemiology: sedentary Behav-iour. Int J Epidemiol. 2012;41:1460-71. [PMID: 23045206] doi:10.1093/ije/dys11856. Taylor RS, Brown A, Ebrahim S, Jolliffe J, Noorani H, Rees K, et al.Exercise-based rehabilitation for patients with coronary heart dis-ease: systematic review and meta-analysis of randomized controlledtrials. Am J Med. 2004;116:682-92. [PMID: 15121495]57. Whaley MH, Brubaker PH, Otto RM, Armstrong LE, AmericanCollege of Sports Medicine. ACSM's Guidelines for Exercise Testingand Prescription. 7th ed. Philadelphia: Lippincott Williams & Wilkins;2006.58. Wisse W, Boer Rookhuizen M, de Kruif MD, van Rossum J, Jor-dans I, ten Cate H, et al. Prescription of physical activity is not suffi-cient to change sedentary behavior and improve glycemic control intype 2 diabetes patients. Diabetes Res Clin Pract. 2010;88:e10-3.[PMID: 20138384] doi:10.1016/j.diabres.2010.01.01559. Sørensen JB, Skovgaard T, Puggaard L. Exercise on prescriptionin general practice: a systematic review. Scand J Prim Health Care.2006;24:69-74. [PMID: 16690553]60. Owen N, Sugiyama T, Eakin EE, Gardiner PA, Tremblay MS, SallisJF. Adults' sedentary behavior determinants and interventions. Am JPrev Med. 2011;41:189-96. [PMID: 21767727] doi:10.1016/j.amepre.2011.05.01361. Ainsworth BE, Macera CA. Physical Activity and Public HealthPractice. Philadelphia: Taylor & Francis; 2012.62. Dunstan DW, Kingwell BA, Larsen R, Healy GN, Cerin E, Hamil-ton MT, et al. Breaking up prolonged sitting reduces postprandialglucose and insulin responses. Diabetes Care. 2012;35:976-83.[PMID: 22374636] doi:10.2337/dc11-1931
REVIEW Sedentary Time and Disease Incidence, Mortality, and Hospitalization
132 Annals of Internal Medicine • Vol. 162 No. 2 • 20 January 2015 www.annals.org
Current Author Addresses: Mr. Biswas: Institute of Health Pol-icy, Management and Evaluation, University of Toronto, 4thFloor, 155 College Street, Toronto, Ontario M5T 3M6,Canada.Dr. Oh: University Health Network–Toronto Rehabilitation In-stitute, 347 Rumsey Road, Toronto, Ontario M4G 1R7,Canada.Dr. Faulkner and Mr. Mitchell: Faculty of Kinesiology andPhysical Education, University of Toronto, 55 Harbord Street,Toronto, Ontario M5S 2W6, Canada.Dr. Bajaj: Department of Cardiology, Sunnybrook Health Sci-ences Centre, 2075 Bayview Avenue, Toronto, Ontario M4N3A5, Canada.Mr. Silver: Osgoode Hall Law School, York University, 4700Keele Street, Toronto, Ontario M3J 1P3, Canada.Dr. Alter: Institute for Clinical Evaluative Sciences, 2075 Bay-view Avenue, G1-06, Toronto, Ontario M4N 3M5, Canada.
Author Contributions: Conception and design: A. Biswas, R.R.Bajaj, M.A. Silver, D.A. Alter.Analysis and interpretation of the data: A. Biswas, P.I. Oh, G.E.Faulkner, M.A. Silver, M.S. Mitchell, D.A. Alter.Drafting of the article: A. Biswas, P.I. Oh, G.E. Faulkner, M.S.Mitchell, D.A. Alter.Critical revision of the article for important intellectual con-tent: A. Biswas, G.E. Faulkner, R.R. Bajaj, M.A. Silver, M.S.Mitchell, D.A. Alter.Final approval of the article: A. Biswas, P.I. Oh, G.E. Faulkner,R.R. Bajaj, M.S. Mitchell, D.A. Alter.Provision of study materials or patients: D.A. Alter.Statistical expertise: A. Biswas, M.S. Mitchell.Administrative, technical, or logistic support: M.A. Silver, D.A.Alter.Collection and assembly of data: A. Biswas, M.A. Silver.
Annals of Internal Medicine
www.annals.org Annals of Internal Medicine • Vol. 162 No. 2 • 20 January 2015
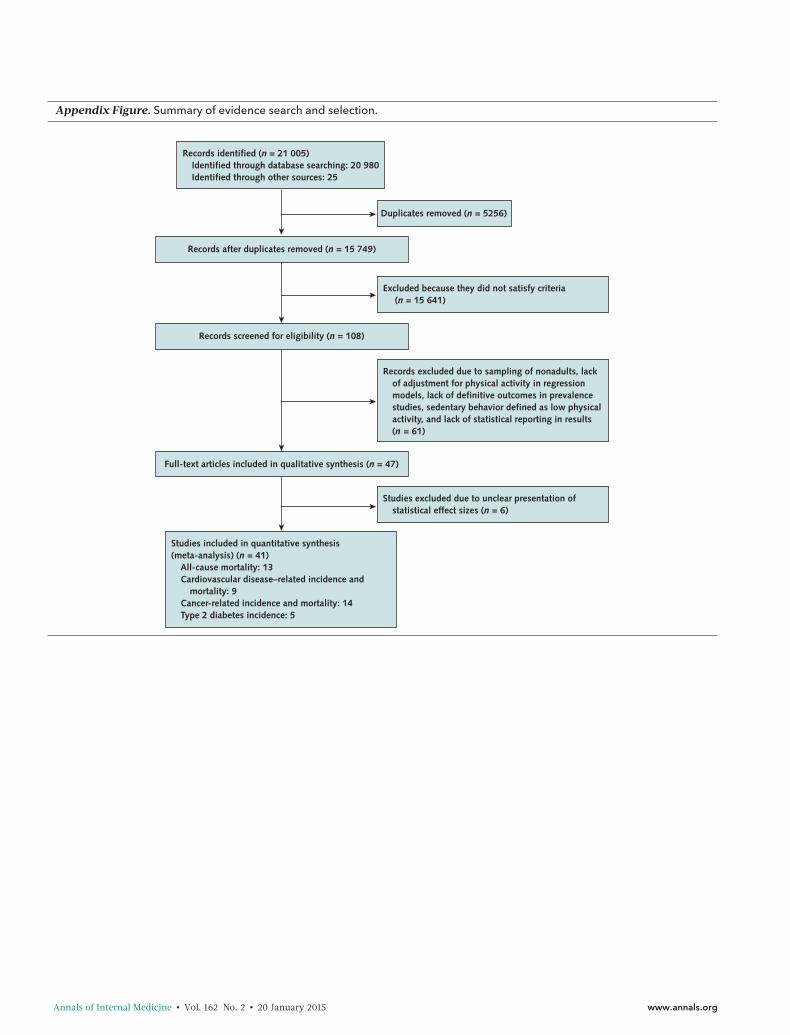
Appendix Figure. Summary of evidence search and selection.
Records identified (n = 21 005)Identified through database searching: 20 980Identified through other sources: 25
Records after duplicates removed (n = 15 749)
Duplicates removed (n = 5256)
Records screened for eligibility (n = 108)
Full-text articles included in qualitative synthesis (n = 47)
Studies excluded due to unclear presentation of statistical effect sizes (n = 6)
Excluded because they did not satisfy criteria (n = 15 641)
Records excluded due to sampling of nonadults, lack of adjustment for physical activity in regression models, lack of definitive outcomes in prevalence studies, sedentary behavior defined as low physical activity, and lack of statistical reporting in results (n = 61)
Studies included in quantitative synthesis (meta-analysis) (n = 41)
All-cause mortality: 13Cardiovascular disease–related incidence and
mortality: 9Cancer-related incidence and mortality: 14Type 2 diabetes incidence: 5
Annals of Internal Medicine • Vol. 162 No. 2 • 20 January 2015 www.annals.org
Ap
pen
dix
Tabl
e.C
hara
cter
istic
san
dPo
tent
ialR
isk
ofB
ias
ofS
tud
ies
Incl
uded
inM
eta-
anal
ysis
Rep
ort
ing
Ass
oci
atio
nsB
etw
een
Sed
enta
ryB
ehav
ior
and
Hea
lthO
utco
mes
Au
tho
r,Y
ear
(Ref
eren
ce)
Stu
dy
Des
ign
Co
un
try;
Par
tici
pan
tC
har
acte
rist
ics
Sed
enta
ryB
ehav
ior
Defi
nit
ion
Met
ho
do
fSe
den
tary
Beh
avio
rA
sses
smen
t;C
rite
ria
Pri
mar
yO
utc
om
e;P
arti
cip
ants
,n/N
Follo
w-u
pD
ura
tio
n;
Co
mp
lete
nes
s
Ad
just
edC
ova
riat
es
All-
cau
sem
ort
alit
ySe
gui
net
al,2
014
(32)
Pro
spec
tive
Uni
ted
Stat
es;W
om
en's
Hea
lthIn
itiat
ive
Ob
serv
atio
nal
Stud
y;w
om
en;5
0–79
y
Ove
rall
dai
lyho
urs
spen
tsitt
ing
Self-
rep
ort
que
stio
nnai
re;
≤4,
>4–
8,>
8–11
,or
≥11
h/d
spen
tsitt
ing
All-
caus
em
ort
ality
;30
73/2
018
712
y;98
.5%
Ag
e,se
x,p
hysi
cala
ctiv
ities
,and
phy
sica
lfun
ctio
n
Kat
zmar
zyk
etal
,20
09(2
7)Pr
osp
ectiv
eC
anad
a;19
81C
anad
aFi
tnes
sSu
rvey
;men
and
wo
men
;18
–90
y
"Sed
enta
ryal
mo
stal
lthe
time"
Self-
rep
ort
que
stio
nnai
re;
time
spen
tsitt
ing
dur
ing
wo
rk,s
cho
ol,
and
hous
ewo
rk(a
lmo
stno
neo
fthe
time,
app
roxi
mat
ely
25%
of
the
time,
app
roxi
mat
ely
50%
oft
hetim
e,ap
pro
xim
atel
y75
%o
fth
etim
e,o
ral
mo
stal
lof
the
time)
All-
caus
em
ort
ality
;b
oth
:159
/822
,m
en:8
3/37
0,w
om
en:7
6/45
2
12y;
not
spec
ified
Ag
e,se
x,sm
oki
ng,a
lco
holu
se,
leis
ure
time
phy
sica
lact
ivity
,and
phy
sica
lact
ivity
read
ines
s
Geo
rge
etal
,201
3(2
5)Pr
osp
ectiv
eU
nite
dSt
ates
;Hea
lthy
Eatin
g,
Act
ivity
and
Life
styl
ePr
og
ram
;wo
men
who
wer
eb
reas
tcan
cer
surv
ivo
rs;
18–6
4y
Tele
visi
on
wat
chin
gtim
eSe
lf-re
po
rtq
uest
ionn
aire
;0,
<1,
1–2,
3–4,
5–6,
7–8,
or
≥9
h/d
spen
tsitt
ing
and
wat
chin
gte
levi
sio
n
All-
caus
em
ort
ality
;41
/217
7y;
73%
Ag
ean
dm
od
erat
eto
vig
oro
usp
hysi
cala
ctiv
ity
Mat
thew
set
al,
2012
(29)
Pro
spec
tive
Uni
ted
Stat
es;N
IH-A
AR
PD
iet
and
Hea
lthSt
udy;
men
and
wo
men
;50–
71y
Ove
rall
sitt
ing
time
Self-
rep
ort
que
stio
nnai
re;
<3,
3–4,
5–6,
7–8,
or
≥9
h/d
spen
tsitt
ing
All-
caus
em
ort
ality
;14
92/2
4081
98.
5y;
59%
Ag
e,se
x,ra
ce,e
duc
atio
n,sm
oki
ngst
atus
,die
tqua
lity,
and
mo
der
ate
tovi
go
rous
phy
sica
lac
tivity
Pate
leta
l,20
10(3
0)Pr
osp
ectiv
eU
nite
dSt
ates
;CPS
-IIN
utri
tion
Co
hort
;men
and
wo
men
;50
–74
y
Sitt
ing
time
Self-
rep
ort
que
stio
nnai
re;
0,<
3,3–
5,6–
8,o
r>
8h/
dsp
ents
ittin
g
All-
caus
em
ort
ality
;m
en:1
864/
5344
0,w
om
en:
1104
/69
776
14y;
67%
Ag
e,ra
ce,m
arita
lsta
tus,
educ
atio
n,sm
oki
ngst
atus
,BM
I,al
coho
luse
,to
talc
alo
ric
inta
ke,
com
orb
idco
nditi
ons
sco
re,a
ndp
hysi
cala
ctiv
ityPa
vey
etal
,201
2(3
1)Pr
osp
ectiv
eA
ustr
alia
;Aus
tral
ian
Long
itud
inal
Stud
yo
nW
om
en's
Hea
lth;w
om
en;
76–8
1y
Sitt
ing
time
Self-
rep
ort
que
stio
nnai
re;
time
spen
tsitt
ing
whi
led
oin
gth
ing
s,su
chas
visi
ting
frie
nds,
dri
ving
,re
adin
g,w
atch
ing
tele
visi
on,
or
wo
rkin
gat
ad
esk
or
com
put
ero
nus
uald
ay(0
–4,4
to<
8,8
to<
11o
r≥
11h/
d)
All-
caus
em
ort
ality
;13
6/27
39
y;83
%A
ge,
educ
atio
n,m
arita
lsta
tus,
area
,sm
oki
ngst
atus
,alc
oho
lus
e,B
MI,
and
phy
sica
lact
ivity
Dun
stan
etal
,20
10(2
4)Pr
osp
ectiv
eA
ustr
alia
;Aus
tral
ian
Dia
bet
es,
Ob
esity
and
Life
styl
eSt
udy;
men
and
wo
men
;≥25
y
Tele
visi
on
view
ing
time
Self-
rep
ort
que
stio
nnai
re;
<2,
2–4,
or
>4
h/d
spen
tw
atch
ing
tele
visi
on
All-
caus
em
ort
ality
;54
/672
6.6
y;43
%A
ge,
sex,
smo
king
stat
us,
educ
atio
n,to
tale
nerg
yin
take
,al
coho
luse
,die
tqua
lity,
wai
stci
rcum
fere
nce,
hyp
erte
nsio
n,to
talp
lasm
ach
ole
ster
ol,
lipid
-low
erin
gm
edic
atio
nus
e,g
luco
seto
lera
nce
stat
us,a
ndex
erci
setim
e
Con
tinue
don
follo
win
gp
age
www.annals.org Annals of Internal Medicine • Vol. 162 No. 2 • 20 January 2015

Ap
pen
dix
Tabl
e—C
ont
inue
d
Au
tho
r,Y
ear
(Ref
eren
ce)
Stu
dy
Des
ign
Co
un
try;
Par
tici
pan
tC
har
acte
rist
ics
Sed
enta
ryB
ehav
ior
Defi
nit
ion
Met
ho
do
fSe
den
tary
Beh
avio
rA
sses
smen
t;C
rite
ria
Pri
mar
yO
utc
om
e;P
arti
cip
ants
,n/N
Follo
w-u
pD
ura
tio
n;
Co
mp
lete
nes
s
Ad
just
edC
ova
riat
es
Ino
ueet
al,2
008
(26)
Pro
spec
tive
Jap
an;J
apan
Pub
licH
ealth
Cen
ter–
bas
edPr
osp
ectiv
eSt
udy;
men
and
wo
men
;45
–74
y
Sed
enta
ryac
tiviti
esSe
lf-re
po
rtq
uest
ionn
aire
;<
3,3–
8,o
r>
8h/
dsp
ent
inse
den
tary
activ
ity
All-
caus
em
ort
ality
;m
en:3
22/3
918
3,w
om
en:1
14/
4385
1
5y;
97.3
%A
ge,
area
,occ
upat
ion,
occ
upat
ion,
dia
bet
eshi
sto
ry,s
mo
king
stat
us,
alco
holu
se,B
MI,
tota
lene
rgy
inta
ke,a
ndle
isur
etim
ep
hysi
cal
exer
cise
Stam
atak
iset
al,
2011
(38)
Pro
spec
tive
Sco
tland
;200
3Sc
ott
ish
Hea
lthSu
rvey
;men
and
wo
men
;≥
35y
Scre
entim
eSe
lf-re
po
rtq
uest
ionn
aire
;“H
ow
muc
htim
eo
nan
aver
age
day
do
you
spen
dw
atch
ing
tele
visi
on
or
ano
ther
typ
eo
fscr
een,
such
asa
com
put
ero
rvi
deo
gam
e?Pl
ease
do
not
incl
ude
any
time
spen
tin
fro
nto
fasc
reen
whi
leat
scho
ol,
colle
ge,
or
wo
rk.”
(wee
kday
scre
entim
e:<
2,2
to<
4,≥
4h/
d)
All-
caus
em
ort
ality
;11
5/12
044.
3y;
71%
Ag
e,se
x,B
MI,
smo
king
stat
us,
mar
itals
tatu
s,ra
ce,s
oci
alcl
ass,
long
-sta
ndin
gill
ness
,o
ccup
atio
nalp
hysi
cala
ctiv
ity,
dia
bet
esd
iag
nosi
s/hy
per
tens
ion,
and
mo
der
ate
tovi
go
rous
phy
sica
lact
ivity
Ko
ster
etal
,201
2(2
8)Pr
osp
ectiv
eU
nite
dSt
ates
;Nat
iona
lHea
lthan
dN
utri
tion
Exam
inat
ion
Surv
ey;m
enan
dw
om
en;
≥50
y
Sed
enta
rytim
e7-
dac
cele
rom
etry
;se
den
tary
time
defi
ned
asm
ove
men
ts<
100
coun
ts/m
in
All-
caus
em
ort
ality
;53
/476
2.8
y;98
.2%
Ag
e,se
x,ra
ce,e
duc
atio
n,sm
oki
ngst
atus
,alc
oho
luse
,BM
I,d
iab
etes
,CH
D,C
HF,
canc
er,
stro
ke,m
ob
ility
limita
tion,
and
mo
der
ate
tovi
go
rous
phy
sica
lac
tivity
Kim
etal
,201
3(3
6)Pr
osp
ectiv
eU
nite
dSt
ates
;Mul
tieth
nic
Co
hort
Stud
y;m
enan
dw
om
en;4
5–75
y
Tota
lsitt
ing
time
Self-
rep
ort
que
stio
nnai
re;
tota
lsitt
ing
time
assu
mo
fmid
po
ints
(0,<
1,1–
2,3–
4,5–
6,7–
10,o
r≥
11h)
All-
caus
em
ort
ality
;m
en:3
116/
6139
5,w
om
en:
2960
/73
201
13.7
y;62
.6%
Ag
e,ed
ucat
ion,
ethn
icity
,sm
oki
nghi
sto
ry,h
isto
ryo
fhyp
erte
nsio
n/d
iab
etes
,alc
oho
luse
,ene
rgy
inta
ke,a
ndp
hysi
cala
ctiv
ityva
nd
erPl
oeg
etal
,20
12(3
4)Pr
osp
ectiv
eA
ustr
alia
;45
and
Up
Stud
y;m
enan
dw
om
en;≥
45y
Sitt
ing
time
Self-
rep
ort
que
stio
nnai
re;
“Ab
out
how
man
yho
urs
inea
ch24
-ho
urd
ayd
oyo
uus
ually
spen
dsi
ttin
g?”
(0to
<4,
4to
<8,
8to
<11
,or
≥11
h/d
)
All-
caus
em
ort
ality
;b
oth
:649
/22
249
7,m
en:
401/
105
855,
wo
men
:248
/11
664
2
4y;
98.7
%A
ge,
sex,
educ
atio
n,m
arita
lsta
tus,
urb
ano
rru
ralr
esid
ence
,p
hysi
cala
ctiv
ity,B
MI,
smo
king
stat
us,s
elf-
rate
dhe
alth
,and
rece
ivin
ghe
lpw
ithd
aily
task
s
Con
tinue
don
follo
win
gp
age
Annals of Internal Medicine • Vol. 162 No. 2 • 20 January 2015 www.annals.org
Ap
pen
dix
Tabl
e—C
ont
inue
d
Au
tho
r,Y
ear
(Ref
eren
ce)
Stu
dy
Des
ign
Co
un
try;
Par
tici
pan
tC
har
acte
rist
ics
Sed
enta
ryB
ehav
ior
Defi
nit
ion
Met
ho
do
fSe
den
tary
Beh
avio
rA
sses
smen
t;C
rite
ria
Pri
mar
yO
utc
om
e;P
arti
cip
ants
,n/N
Follo
w-u
pD
ura
tio
n;
Co
mp
lete
nes
s
Ad
just
edC
ova
riat
es
Leo
n-M
uno
zet
al,
2013
(35)
Pro
spec
tive
Spai
n;m
enan
dw
om
en;≥
60y
Sitt
ing
time
Self-
rep
ort
que
stio
nnai
re;
“Ab
out
how
muc
htim
ed
oyo
usp
end
sitt
ing
do
wn
on
wee
kday
s?"
(co
nsis
tent
lyse
den
tary
,ne
wly
sed
enta
ry,
form
erly
sed
enta
ry,
cons
iste
ntly
nons
eden
tary
)
All-
caus
em
ort
ality
;20
3/56
72
y;80
.9%
Sex,
age,
educ
atio
n,sm
oki
ngst
atus
,alc
oho
luse
,hea
rtd
isea
se,s
tro
ke,d
iab
etes
,o
steo
mus
cula
rd
isea
se,c
ance
r,p
hysi
calf
unct
ion,
phy
sica
lac
tivity
,chr
oni
clu
ngd
isea
se,
and
limita
tions
inm
ob
ility
and
agili
ty
Typ
e2
dia
bet
esD
unst
anet
al,2
005
(5)
Cro
ss-
sect
iona
lA
ustr
alia
;Aus
tral
ian
Dia
bet
es,
Ob
esity
and
Life
styl
eSt
udy;
men
and
wo
men
;≥25
y
Tele
visi
on
wat
chin
gtim
eSe
lf-re
po
rtq
uest
ionn
aire
;0–
7,7.
01–1
4,o
r>
14h/
wk
wat
chin
gte
levi
sio
n
Typ
e2
dia
bet
es;
1103
/20
187
1y;
55%
Ag
e,ed
ucat
ion,
dia
bet
eshi
sto
ry,
smo
king
stat
us,d
iet,
and
phy
sica
lact
ivity
Hu
etal
,200
3(4
8)Pr
osp
ectiv
eU
nite
dSt
ates
;Nur
ses'
Hea
lthSt
udy;
wo
men
;35–
55y
Tele
visi
on
wat
chin
gtim
eSe
lf-re
po
rtq
uest
ionn
aire
;0–
1,2–
5,6–
29,2
1–40
,or
>40
h/w
kw
atch
ing
tele
visi
on
Typ
e2
dia
bet
es;
51/1
464
6y;
56.3
%A
ge,
horm
one
use,
alco
holu
se,
smo
king
,dia
bet
eshi
sto
ry,a
ndp
hysi
cala
ctiv
ity
Kri
shna
net
al,
2009
(49)
Pro
spec
tive
Uni
ted
Stat
es;B
lack
Wo
men
'sH
ealth
Stud
y;b
lack
wo
men
;21
–69
y
Tele
visi
on
wat
chin
gtim
eSe
lf-re
po
rtq
uest
ionn
aire
;0,
<1,
1–2,
3–4,
or
>5
h/d
wat
chin
gte
levi
sio
n
Typ
e2
dia
bet
es;
712/
2928
10y;
80%
Ag
e,tim
ep
erio
d,d
iab
etes
hist
ory
,ed
ucat
ion,
fam
ilyin
com
e,m
arita
lsta
tus,
smo
king
stat
us,
ener
gy
inta
ke,c
offe
ein
take
,vi
go
rous
activ
ity,t
elev
isio
nw
atch
ing
,and
wal
king
Ford
etal
,201
0(5
0)Pr
osp
ectiv
eG
erm
any;
Euro
pea
nPr
osp
ectiv
eIn
vest
igat
ion
inC
ance
ran
dN
utri
tion–
Pots
dam
Stud
y;m
en:
35–6
5y,
wo
men
:40–
65y
Tele
visi
on
wat
chin
gtim
eSe
lf-re
po
rtq
uest
ionn
aire
;“O
nav
erag
e,ho
wm
any
hour
s/d
ayd
idyo
uw
atch
tele
visi
on
dur
ing
the
last
12m
ont
hs?”
(<1,
1to
<2,
2to
<3,
3to
<4,
or
≥4
h/d
)
Typ
e2
dia
bet
es;
bo
th:1
31/1
935
7.8
y;90
%A
ge,
sex,
educ
atio
n,o
ccup
atio
nal
activ
ity,s
mo
king
stat
us,a
lco
hol
inta
ke,a
ndp
hysi
cala
ctiv
ity
Hu
etal
,200
1(6
)Pr
osp
ectiv
eU
nite
dSt
ates
;Hea
lthPr
ofe
ssio
nals
Follo
w-u
pSt
udy;
men
;45–
75y
Tele
visi
on
wat
chin
gtim
eSe
lf-re
po
rtq
uest
ionn
aire
;0–
1,2–
5,6–
29,2
1–40
,or
>40
h/w
kw
atch
ing
tele
visi
on
Typ
e2
dia
bet
es;
12/1
8610
y;73
.6%
Ag
e,sm
oki
ngst
atus
,dia
bet
es,
dia
bet
eshi
sto
ry,a
lco
holi
ntak
e,d
iet,
and
phy
sica
lact
ivity
Con
tinue
don
follo
win
gp
age
www.annals.org Annals of Internal Medicine • Vol. 162 No. 2 • 20 January 2015

Ap
pen
dix
Tabl
e—C
ont
inue
d
Au
tho
r,Y
ear
(Ref
eren
ce)
Stu
dy
Des
ign
Co
un
try;
Par
tici
pan
tC
har
acte
rist
ics
Sed
enta
ryB
ehav
ior
Defi
nit
ion
Met
ho
do
fSe
den
tary
Beh
avio
rA
sses
smen
t;C
rite
ria
Pri
mar
yO
utc
om
e;P
arti
cip
ants
,n/N
Follo
w-u
pD
ura
tio
n;
Co
mp
lete
nes
s
Ad
just
edC
ova
riat
es
Car
dio
vasc
ula
rd
isea
sein
cid
ence
and
mo
rtal
ity
Seg
uin
etal
,201
4(3
2)Pr
osp
ectiv
eU
nite
dSt
ates
;Wo
men
'sH
ealth
Initi
ativ
eO
bse
rvat
iona
lSt
udy;
wo
men
;50–
79y
Sed
enta
rytim
eSe
lf-re
po
rtq
uest
ionn
aire
;≤
4,>
4-8,
>8–
11,o
r≥
11h/
dsp
ents
ittin
g
CV
Dm
ort
ality
;89
5/20
187
CH
Dm
ort
ality
;41
8/20
187
12y;
98.5
%A
ge,
sex,
phy
sica
lact
iviti
es,a
ndp
hysi
calf
unct
ion
Kat
zmar
zyk,
2009
(29)
Pro
spec
tive
Can
ada;
1981
Can
ada
Fitn
ess
Surv
ey;b
oth
sexe
s,m
enan
dw
om
en;1
8–90
y
"Sed
enta
ryal
mo
stal
lthe
time"
Self-
rep
ort
que
stio
nnai
re;
time
spen
tsitt
ing
dur
ing
wo
rk,s
cho
ol,
and
hous
ewo
rk(a
lmo
stno
neo
fthe
time,
app
roxi
mat
ely
25%
of
the
time,
app
roxi
mat
ely
50%
oft
hetim
e,ap
pro
xim
atel
y75
%o
fth
etim
e,o
ral
mo
stal
lof
the
time)
CV
Dm
ort
ality
;b
oth
:67/
822,
men
:34/
370,
wo
men
:33/
452
12y;
not
spec
ified
Ag
e,se
x,sm
oki
ng,a
lco
holu
se,
leis
ure
time
phy
sica
lact
ivity
,and
phy
sica
lact
ivity
read
ines
s
Mat
thew
set
al,
2012
(29)
Pro
spec
tive
Uni
ted
Stat
es;N
IH-A
AR
PD
iet
and
Hea
lthSt
udy;
men
and
wo
men
;50–
71y
Ove
rall
sitt
ing
time
Self-
rep
ort
que
stio
nnai
re;
<3,
3–4,
5–6,
7–8,
or
≥9
h/d
spen
tsitt
ing
CV
Dm
ort
ality
;21
2/24
081
98.
5y;
59%
Ag
e,se
x,ra
ce,e
duc
atio
n,sm
oki
ngst
atus
,die
tqua
lity,
and
mo
der
ate
tovi
go
rous
phy
sica
lac
tivity
Pate
leta
l,20
10(3
0)Pr
osp
ectiv
eU
nite
dSt
ates
;CPS
-IIN
utri
tion
Co
hort
;men
and
wo
men
;50
–74
y
Sitt
ing
time
Self-
rep
ort
que
stio
nnai
re;
0,<
3,3–
5,6–
8,o
r>
8h/
dsp
ents
ittin
g
CV
Dm
ort
ality
;m
en:6
85/5
344
0,w
om
en:3
31/
6977
6
14y;
67%
Ag
e,ra
ce,m
arita
lsta
tus,
educ
atio
n,sm
oki
ngst
atus
,BM
I,al
coho
luse
,to
talc
alo
ric
inta
ke,
com
orb
idco
nditi
ons
sco
re,a
ndp
hysi
cala
ctiv
ityD
unst
anet
al,
2010
(24)
Pro
spec
tive
Aus
tral
ia;A
ustr
alia
nD
iab
etes
,O
bes
ityan
dLi
fest
yle
Stud
y;m
enan
dw
om
en;≥
25y
Tele
visi
on
view
ing
time
Self-
rep
ort
que
stio
nnai
re;
<2,
2–4,
or
>4
h/d
spen
tte
levi
sio
n
CV
Dm
ort
ality
;22
/672
6.6
y;43
%A
ge,
sex,
smo
king
stat
us,
educ
atio
n,to
tale
nerg
yin
take
,al
coho
luse
,die
tqua
lity,
wai
stci
rcum
fere
nce,
med
icat
ion,
glu
cose
tole
ranc
est
atus
,and
exer
cise
time
Stam
atak
iset
al,
2011
(33)
Pro
spec
tive
Sco
tland
;200
3Sc
ott
ish
Hea
lthSu
rvey
;men
and
wo
men
;≥
35y
Scre
entim
eSe
lf-re
po
rtq
uest
ionn
aire
;“H
ow
muc
htim
eo
nan
aver
age
day
do
you
spen
dw
atch
ing
tele
visi
on
or
ano
ther
typ
eo
fscr
een,
such
asa
com
put
ero
rvi
deo
gam
e?Pl
ease
do
not
incl
ude
any
time
spen
tin
fro
nto
fasc
reen
whi
leat
scho
ol,
colle
ge,
or
wo
rk.”
(<2,
2to
<4,
or
≥4
h/d
)
CV
Dev
ent;
65/1
072
4.3
y;71
%A
ge,
sex,
BM
I,sm
oki
ngst
atus
,m
arita
lsta
tus,
race
,so
cial
clas
s,lo
ng-s
tand
ing
illne
ss,
occ
upat
iona
lphy
sica
lact
ivity
,d
iab
etes
dia
gno
sis/
hyp
erte
nsio
n,an
dm
od
erat
eto
vig
oro
usp
hysi
cala
ctiv
ity
Con
tinue
don
follo
win
gp
age
Annals of Internal Medicine • Vol. 162 No. 2 • 20 January 2015 www.annals.org
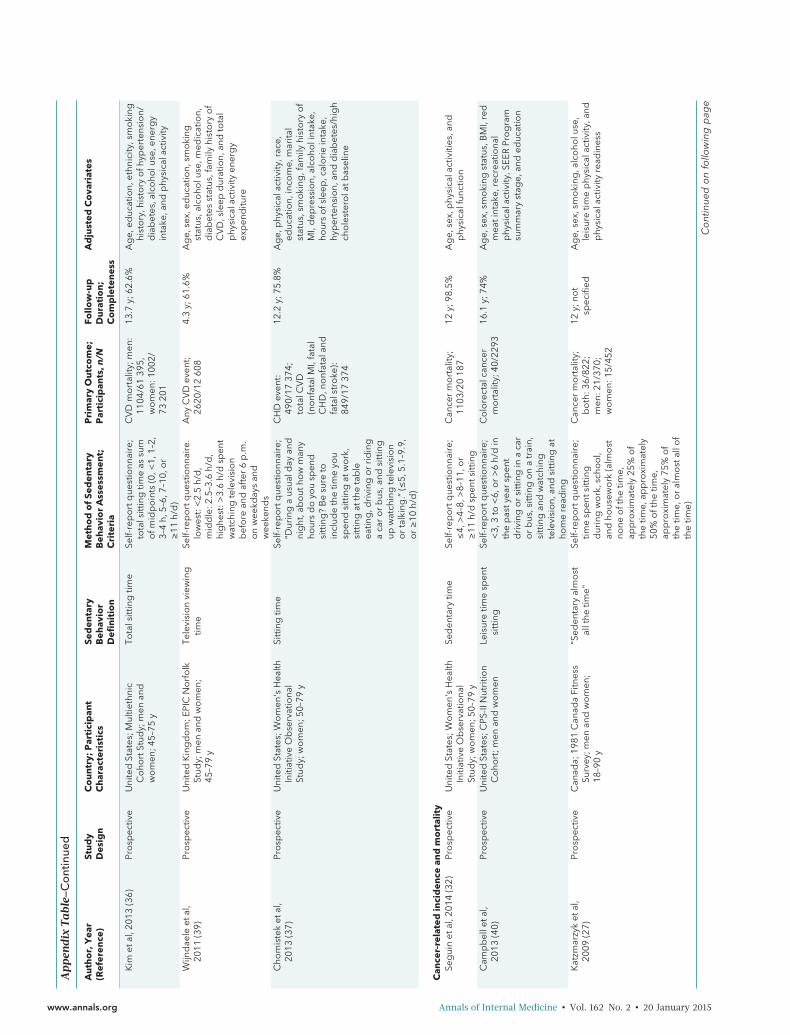
Ap
pen
dix
Tabl
e—C
ont
inue
d
Au
tho
r,Y
ear
(Ref
eren
ce)
Stu
dy
Des
ign
Co
un
try;
Par
tici
pan
tC
har
acte
rist
ics
Sed
enta
ryB
ehav
ior
Defi
nit
ion
Met
ho
do
fSe
den
tary
Beh
avio
rA
sses
smen
t;C
rite
ria
Pri
mar
yO
utc
om
e;P
arti
cip
ants
,n/N
Follo
w-u
pD
ura
tio
n;
Co
mp
lete
nes
s
Ad
just
edC
ova
riat
es
Kim
etal
,201
3(3
6)Pr
osp
ectiv
eU
nite
dSt
ates
;Mul
tieth
nic
Co
hort
Stud
y;m
enan
dw
om
en;4
5–75
y
Tota
lsitt
ing
time
Self-
rep
ort
que
stio
nnai
re;
tota
lsitt
ing
time
assu
mo
fmid
po
ints
(0,<
1,1–
2,3–
4h,
5–6,
7–10
,or
≥11
h/d
)
CV
Dm
ort
ality
;men
:11
04/6
139
5,w
om
en:1
002/
7320
1
13.7
y;62
.6%
Ag
e,ed
ucat
ion,
ethn
icity
,sm
oki
nghi
sto
ry,h
isto
ryo
fhyp
erte
nsio
n/d
iab
etes
,alc
oho
luse
,ene
rgy
inta
ke,a
ndp
hysi
cala
ctiv
ity
Wijn
dae
leet
al,
2011
(39)
Pro
spec
tive
Uni
ted
Kin
gd
om
;EPI
CN
orf
olk
Stud
y;m
enan
dw
om
en;
45–7
9y
Tele
visi
on
view
ing
time
Self-
rep
ort
que
stio
nnai
re.
low
est:
<2.
5h/
d,
mid
dle
:2.5
–3.6
h/d
,hi
ghe
st:>
3.6
h/d
spen
tw
atch
ing
tele
visi
on
bef
ore
and
afte
r6
p.m
.o
nw
eekd
ays
and
wee
kend
s
Any
CV
Dev
ent;
2620
/12
608
4.3
y;61
.6%
Ag
e,se
x,ed
ucat
ion,
smo
king
stat
us,a
lco
holu
se,m
edic
atio
n,d
iab
etes
stat
us,f
amily
hist
ory
of
CV
D,s
leep
dur
atio
n,an
dto
tal
phy
sica
lact
ivity
ener
gy
exp
end
iture
Cho
mis
tek
etal
,20
13(3
7)Pr
osp
ectiv
eU
nite
dSt
ates
;Wo
men
'sH
ealth
Initi
ativ
eO
bse
rvat
iona
lSt
udy;
wo
men
;50–
79y
Sitt
ing
time
Self-
rep
ort
que
stio
nnai
re;
“Dur
ing
aus
uald
ayan
dni
ght
,ab
out
how
man
yho
urs
do
you
spen
dsi
ttin
g?
Be
sure
toin
clud
eth
etim
eyo
usp
end
sitt
ing
atw
ork
,si
ttin
gat
the
tab
leea
ting
,dri
ving
or
rid
ing
aca
ro
rb
us,a
ndsi
ttin
gup
wat
chin
gte
levi
sio
no
rta
lkin
g.”
(≤5,
5.1–
9.9,
or
≥10
h/d
)
CH
Dev
ent:
490/
1737
4;to
talC
VD
(no
nfat
alM
I,fa
tal
CH
D,n
onf
atal
and
fata
lstr
oke
):84
9/17
374
12.2
y;75
.8%
Ag
e,p
hysi
cala
ctiv
ity,r
ace,
educ
atio
n,in
com
e,m
arita
lst
atus
,sm
oki
ng,f
amily
hist
ory
of
MI,
dep
ress
ion,
alco
holi
ntak
e,ho
urs
ofs
leep
,cal
ori
ein
take
,hy
per
tens
ion,
and
dia
bet
es/h
igh
cho
lest
ero
latb
asel
ine
Can
cer-
rela
ted
inci
den
cean
dm
ort
alit
ySe
gui
net
al,2
014
(32)
Pro
spec
tive
Uni
ted
Stat
es;W
om
en's
Hea
lthIn
itiat
ive
Ob
serv
atio
nal
Stud
y;w
om
en;5
0–79
y
Sed
enta
rytim
eSe
lf-re
po
rtq
uest
ionn
aire
;≤
4,>
4–8,
>8–
11,o
r≥
11h/
dsp
ents
ittin
g
Can
cer
mo
rtal
ity;
1103
/20
187
12y;
98.5
%A
ge,
sex,
phy
sica
lact
iviti
es,a
ndp
hysi
calf
unct
ion
Cam
pb
elle
tal,
2013
(40)
Pro
spec
tive
Uni
ted
Stat
es;C
PS-II
Nut
ritio
nC
oho
rt;m
enan
dw
om
enLe
isur
etim
esp
ent
sitt
ing
Self-
rep
ort
que
stio
nnai
re;
<3,
3to
<6,
or
>6
h/d
inth
ep
asty
ear
spen
td
rivi
ngo
rsi
ttin
gin
aca
ro
rb
us,s
ittin
go
na
trai
n,si
ttin
gan
dw
atch
ing
tele
visi
on,
and
sitt
ing
atho
me
read
ing
Co
lore
ctal
canc
erm
ort
ality
;40/
2293
16.1
y;74
%A
ge,
sex,
smo
king
stat
us,B
MI,
red
mea
tint
ake,
recr
eatio
nal
phy
sica
lact
ivity
,SEE
RPr
og
ram
sum
mar
yst
age,
and
educ
atio
n
Kat
zmar
zyk
etal
,20
09(2
7)Pr
osp
ectiv
eC
anad
a;19
81C
anad
aFi
tnes
sSu
rvey
;men
and
wo
men
;18
–90
y
"Sed
enta
ryal
mo
stal
lthe
time"
Self-
rep
ort
que
stio
nnai
re;
time
spen
tsitt
ing
dur
ing
wo
rk,s
cho
ol,
and
hous
ewo
rk(a
lmo
stno
neo
fthe
time,
app
roxi
mat
ely
25%
of
the
time,
app
roxi
mat
ely
50%
oft
hetim
e,ap
pro
xim
atel
y75
%o
fth
etim
e,o
ral
mo
stal
lof
the
time)
Can
cer
mo
rtal
ity;
bo
th:3
6/82
2;m
en:2
1/37
0;w
om
en:1
5/45
2
12y;
not
spec
ified
Ag
e,se
x,sm
oki
ng,a
lco
holu
se,
leis
ure
time
phy
sica
lact
ivity
,and
phy
sica
lact
ivity
read
ines
s
Con
tinue
don
follo
win
gp
age
www.annals.org Annals of Internal Medicine • Vol. 162 No. 2 • 20 January 2015
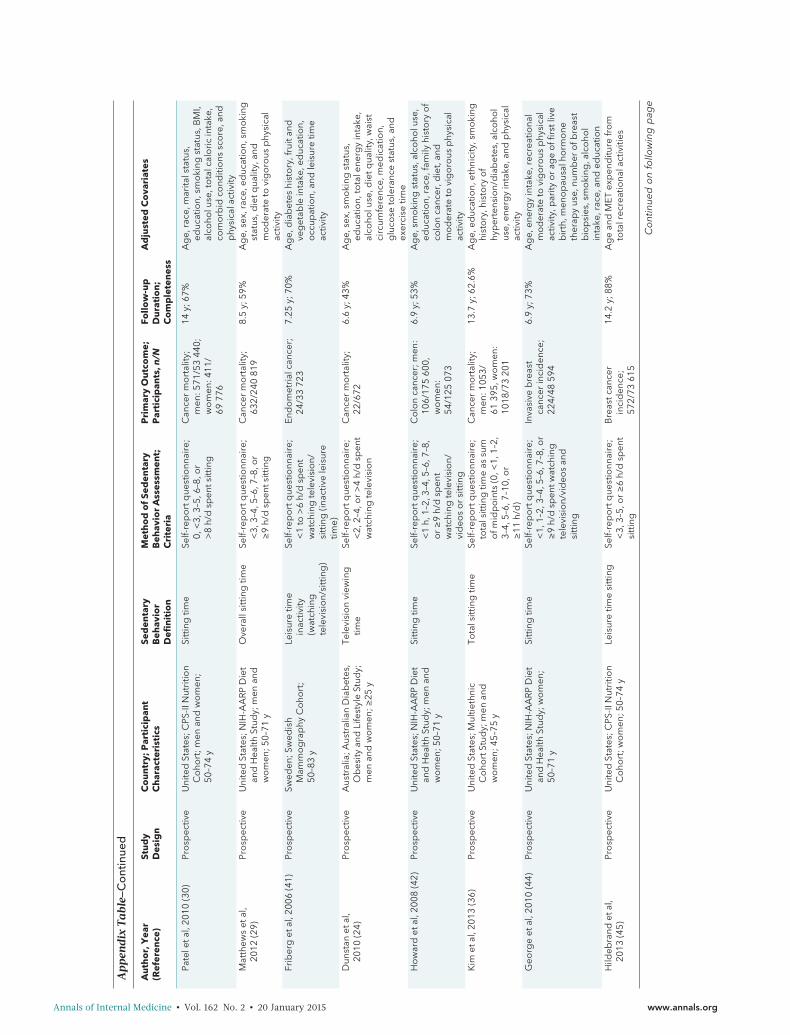
Ap
pen
dix
Tabl
e—C
ont
inue
d
Au
tho
r,Y
ear
(Ref
eren
ce)
Stu
dy
Des
ign
Co
un
try;
Par
tici
pan
tC
har
acte
rist
ics
Sed
enta
ryB
ehav
ior
Defi
nit
ion
Met
ho
do
fSe
den
tary
Beh
avio
rA
sses
smen
t;C
rite
ria
Pri
mar
yO
utc
om
e;P
arti
cip
ants
,n/N
Follo
w-u
pD
ura
tio
n;
Co
mp
lete
nes
s
Ad
just
edC
ova
riat
es
Pate
leta
l,20
10(3
0)Pr
osp
ectiv
eU
nite
dSt
ates
;CPS
-IIN
utri
tion
Co
hort
;men
and
wo
men
;50
–74
y
Sitt
ing
time
Self-
rep
ort
que
stio
nnai
re;
0,<
3,3–
5,6–
8,o
r>
8h/
dsp
ents
ittin
g
Can
cer
mo
rtal
ity;
men
:571
/53
440;
wo
men
:411
/69
776
14y;
67%
Ag
e,ra
ce,m
arita
lsta
tus,
educ
atio
n,sm
oki
ngst
atus
,BM
I,al
coho
luse
,to
talc
alo
ric
inta
ke,
com
orb
idco
nditi
ons
sco
re,a
ndp
hysi
cala
ctiv
ityM
atth
ews
etal
,20
12(2
9)Pr
osp
ectiv
eU
nite
dSt
ates
;NIH
-AA
RP
Die
tan
dH
ealth
Stud
y;m
enan
dw
om
en;5
0–71
y
Ove
rall
sitt
ing
time
Self-
rep
ort
que
stio
nnai
re;
<3,
3–4,
5–6,
7–8,
or
≥9
h/d
spen
tsitt
ing
Can
cer
mo
rtal
ity;
632/
240
819
8.5
y;59
%A
ge,
sex,
race
,ed
ucat
ion,
smo
king
stat
us,d
ietq
ualit
y,an
dm
od
erat
eto
vig
oro
usp
hysi
cal
activ
ityFr
iber
get
al,2
006
(41)
Pro
spec
tive
Swed
en;S
wed
ish
Mam
mo
gra
phy
Co
hort
;50
–83
y
Leis
ure
time
inac
tivity
(wat
chin
gte
levi
sio
n/si
ttin
g)
Self-
rep
ort
que
stio
nnai
re;
<1
to>
6h/
dsp
ent
wat
chin
gte
levi
sio
n/si
ttin
g(in
activ
ele
isur
etim
e)
End
om
etri
alca
ncer
;24
/33
723
7.25
y;70
%A
ge,
dia
bet
eshi
sto
ry,f
ruit
and
veg
etab
lein
take
,ed
ucat
ion,
occ
upat
ion,
and
leis
ure
time
activ
ity
Dun
stan
etal
,20
10(2
4)Pr
osp
ectiv
eA
ustr
alia
;Aus
tral
ian
Dia
bet
es,
Ob
esity
and
Life
styl
eSt
udy;
men
and
wo
men
;≥25
y
Tele
visi
on
view
ing
time
Self-
rep
ort
que
stio
nnai
re;
<2,
2–4,
or
>4
h/d
spen
tw
atch
ing
tele
visi
on
Can
cer
mo
rtal
ity;
22/6
726.
6y;
43%
Ag
e,se
x,sm
oki
ngst
atus
,ed
ucat
ion,
tota
lene
rgy
inta
ke,
alco
holu
se,d
ietq
ualit
y,w
aist
circ
umfe
renc
e,m
edic
atio
n,g
luco
seto
lera
nce
stat
us,a
ndex
erci
setim
eH
ow
ard
etal
,200
8(4
2)Pr
osp
ectiv
eU
nite
dSt
ates
;NIH
-AA
RP
Die
tan
dH
ealth
Stud
y;m
enan
dw
om
en;5
0–71
y
Sitt
ing
time
Self-
rep
ort
que
stio
nnai
re;
<1
h,1–
2,3–
4,5–
6,7–
8,o
r≥
9h/
dsp
ent
wat
chin
gte
levi
sio
n/vi
deo
so
rsi
ttin
g
Co
lon
canc
er;m
en:
106/
175
600,
wo
men
:54
/125
073
6.9
y;53
%A
ge,
smo
king
stat
us,a
lco
holu
se,
educ
atio
n,ra
ce,f
amily
hist
ory
of
colo
nca
ncer
,die
t,an
dm
od
erat
eto
vig
oro
usp
hysi
cal
activ
ityK
imet
al,2
013
(36)
Pro
spec
tive
Uni
ted
Stat
es;M
ultie
thni
cC
oho
rtSt
udy;
men
and
wo
men
;45–
75y
Tota
lsitt
ing
time
Self-
rep
ort
que
stio
nnai
re;
tota
lsitt
ing
time
assu
mo
fmid
po
ints
(0,<
1,1–
2,3–
4,5–
6,7–
10,o
r≥
11h/
d)
Can
cer
mo
rtal
ity;
men
:105
3/61
395,
wo
men
:10
18/7
320
1
13.7
y;62
.6%
Ag
e,ed
ucat
ion,
ethn
icity
,sm
oki
nghi
sto
ry,h
isto
ryo
fhy
per
tens
ion/
dia
bet
es,a
lco
hol
use,
ener
gy
inta
ke,a
ndp
hysi
cal
activ
ityG
eorg
eet
al,2
010
(44)
Pro
spec
tive
Uni
ted
Stat
es;N
IH-A
AR
PD
iet
and
Hea
lthSt
udy;
wo
men
;50
–71
y
Sitt
ing
time
Self-
rep
ort
que
stio
nnai
re;
<1,
1–2,
3–4,
5–6,
7–8,
or
≥9
h/d
spen
twat
chin
gte
levi
sio
n/vi
deo
san
dsi
ttin
g
Inva
sive
bre
ast
canc
erin
cid
ence
;22
4/48
594
6.9
y;73
%A
ge,
ener
gy
inta
ke,r
ecre
atio
nal
mo
der
ate
tovi
go
rous
phy
sica
lac
tivity
,par
ityo
rag
eo
ffirs
tliv
eb
irth
,men
op
ausa
lho
rmo
neth
erap
yus
e,nu
mb
ero
fbre
ast
bio
psi
es,s
mo
king
,alc
oho
lin
take
,rac
e,an
ded
ucat
ion
Hild
ebra
ndet
al,
2013
(45)
Pro
spec
tive
Uni
ted
Stat
es;C
PS-II
Nut
ritio
nC
oho
rt;w
om
en;5
0–74
yLe
isur
etim
esi
ttin
gSe
lf-re
po
rtq
uest
ionn
aire
;<
3,3–
5,o
r≥
6h/
dsp
ent
sitt
ing
Bre
astc
ance
rin
cid
ence
;57
2/73
615
14.2
y;88
%A
ge
and
MET
exp
end
iture
fro
mto
talr
ecre
atio
nala
ctiv
ities
Con
tinue
don
follo
win
gp
age
Annals of Internal Medicine • Vol. 162 No. 2 • 20 January 2015 www.annals.org

Ap
pen
dix
Tabl
e—C
ont
inue
d
Au
tho
r,Y
ear
(Ref
eren
ce)
Stu
dy
Des
ign
Co
un
try;
Par
tici
pan
tC
har
acte
rist
ics
Sed
enta
ryB
ehav
ior
Defi
nit
ion
Met
ho
do
fSe
den
tary
Beh
avio
rA
sses
smen
t;C
rite
ria
Pri
mar
yO
utc
om
e;P
arti
cip
ants
,n/N
Follo
w-u
pD
ura
tio
n;
Co
mp
lete
nes
s
Ad
just
edC
ova
riat
es
Tera
set
al,2
012
(46)
Pro
spec
tive
Uni
ted
Stat
es;C
PS-II
Nut
ritio
nC
oho
rt;m
enan
dw
om
en;
50–7
4y
Sitt
ing
time
Self-
rep
ort
que
stio
nnai
re;
<3,
3–5,
or
≥6
h/d
spen
tsi
ttin
g
No
n-H
od
gki
nly
mp
hoid
neo
pla
smin
cid
ence
;men
:15
1/69
849,
wo
men
:99
/77
001
14.2
y;80
%A
ge,
fam
ilyhi
sto
ryo
fhe
mat
op
oie
ticca
ncer
,ed
ucat
ion,
smo
king
stat
us,
alco
holi
ntak
e,B
MI,
heig
ht,a
ndp
hysi
cala
ctiv
ity
Pep
lons
kaet
al,
2008
(47)
Cas
e–co
ntro
lPo
land
;wo
men
;20–
74y
Sitin
gtim
eSe
lf-re
po
rtq
uest
ionn
aire
;ho
urs
spen
tsitt
ing
per
day
conv
erte
dto
MET
h/w
ko
flife
time:
<11
.3,
11.3
–29.
7,>
29.7
–47.
8,o
r>
47.8
MET
h/w
k
Bre
astc
ance
rin
cid
ence
NA
;NA
Ag
e,st
udy
site
,ed
ucat
ion,
BM
I,ag
eat
men
arch
e,m
eno
pau
sal
stat
us,a
ge
atm
eno
pau
se,
num
ber
/ag
eat
full-
term
bir
th,
bre
astf
eed
ing
,fam
ilyhi
sto
ryo
fb
reas
tcan
cer,
pre
vio
ussc
reen
ing
mam
mo
gra
phy
,and
tota
llife
time
recr
eatio
nala
ndto
talo
ccup
atio
nalp
hysi
cal
activ
ityZh
ang
etal
,200
4(4
3)C
ase–
cont
rol
Chi
na;h
osp
ital-b
ased
;wo
men
;<
75y
Tota
lsitt
ing
dur
atio
nSe
lf-re
po
rtq
uest
ionn
aire
;5
yag
o,<
4,4–
10,o
r>
10h/
dsp
ents
ittin
gat
wo
rk,w
hile
wat
chin
gte
levi
sio
n,in
car
or
bus
,at
mea
ls,a
ndin
oth
erac
tiviti
es(s
uch
asre
adin
g,p
layi
ngca
rds,
and
sew
ing
)
Epith
elia
lova
rian
canc
er;7
5/20
5N
A;N
AA
ge,
loca
lity,
educ
atio
n,fa
mily
inco
me,
BM
I,to
bac
cosm
oki
ng,
alco
holu
se,t
ead
rink
ing
,p
hysi
cala
ctiv
ity,m
arita
lsta
tus,
men
op
ausa
lsta
tus,
par
ity,o
ral
cont
race
ptiv
eus
e,tu
bal
ligat
ion,
horm
one
rep
lace
men
tthe
rap
y,o
vari
anca
ncer
infir
st-d
egre
ere
lativ
es,a
ndto
tale
nerg
yin
take
BM
I=b
od
ym
ass
ind
ex;C
HD
=co
rona
ryhe
artd
isea
se;C
HF
=co
rona
ryhe
artf
ailu
re;C
PS-II
=C
ance
rPr
even
tion
Stud
yII;
CV
D=
card
iova
scul
ard
isea
se;E
PIC
=Eu
rop
ean
Pro
spec
tive
Inve
stig
atio
nIn
toC
ance
ran
dN
utri
tion;
MET
=m
etab
olic
equi
vale
nt;
MI
=m
yoca
rdia
lin
farc
tion;
NA
=no
tap
plic
able
;N
IH-A
AR
P=
Nat
iona
lIn
stitu
tes
of
Hea
lth–A
mer
ican
Ass
oci
atio
no
fR
etir
edPe
rso
ns;
SEER
=Su
rvei
llanc
e,Ep
idem
iolo
gy,
and
End
Res
ults
.*
Rat
ing
crite
ria
for
risk
of
bia
s:lo
w,m
od
erat
e,an
dhi
gh.
www.annals.org Annals of Internal Medicine • Vol. 162 No. 2 • 20 January 2015
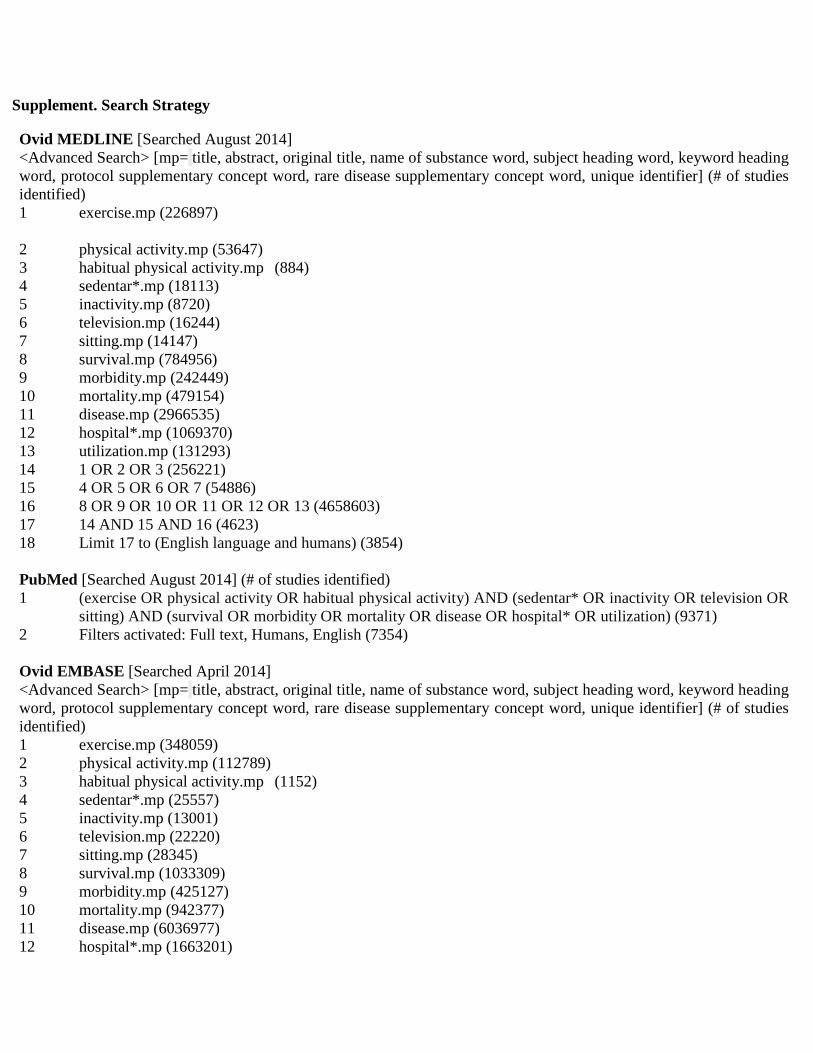
Supplement. Search Strategy
Ovid MEDLINE [Searched August 2014] <Advanced Search> [mp= title, abstract, original title, name of substance word, subject heading word, keyword heading word, protocol supplementary concept word, rare disease supplementary concept word, unique identifier] (# of studies identified) 1 exercise.mp (226897)
2 physical activity.mp (53647) 3 habitual physical activity.mp (884) 4 sedentar*.mp (18113) 5 inactivity.mp (8720) 6 television.mp (16244) 7 sitting.mp (14147) 8 survival.mp (784956) 9 morbidity.mp (242449) 10 mortality.mp (479154) 11 disease.mp (2966535) 12 hospital*.mp (1069370) 13 utilization.mp (131293) 14 1 OR 2 OR 3 (256221) 15 4 OR 5 OR 6 OR 7 (54886) 16 8 OR 9 OR 10 OR 11 OR 12 OR 13 (4658603) 17 14 AND 15 AND 16 (4623) 18 Limit 17 to (English language and humans) (3854) PubMed [Searched August 2014] (# of studies identified) 1 (exercise OR physical activity OR habitual physical activity) AND (sedentar* OR inactivity OR television OR
sitting) AND (survival OR morbidity OR mortality OR disease OR hospital* OR utilization) (9371) 2 Filters activated: Full text, Humans, English (7354) Ovid EMBASE [Searched April 2014] <Advanced Search> [mp= title, abstract, original title, name of substance word, subject heading word, keyword heading word, protocol supplementary concept word, rare disease supplementary concept word, unique identifier] (# of studies identified) 1 exercise.mp (348059) 2 physical activity.mp (112789) 3 habitual physical activity.mp (1152) 4 sedentar*.mp (25557) 5 inactivity.mp (13001) 6 television.mp (22220) 7 sitting.mp (28345) 8 survival.mp (1033309) 9 morbidity.mp (425127) 10 mortality.mp (942377) 11 disease.mp (6036977) 12 hospital*.mp (1663201)
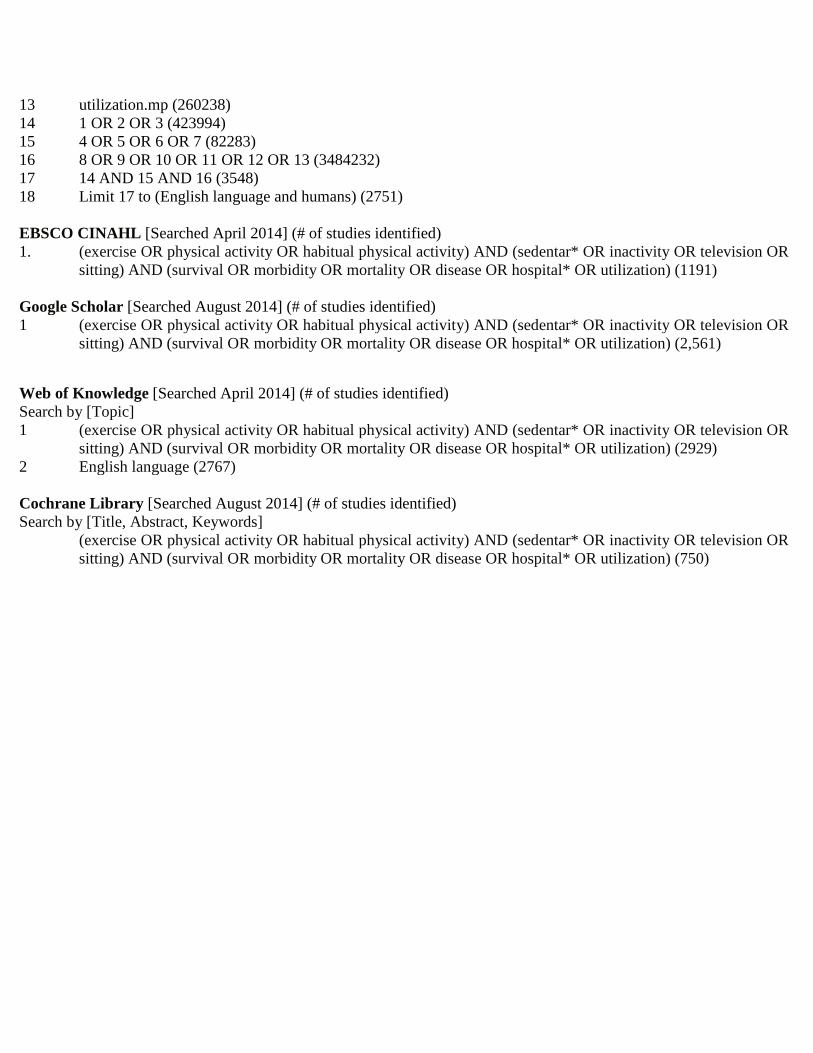
13 utilization.mp (260238) 14 1 OR 2 OR 3 (423994) 15 4 OR 5 OR 6 OR 7 (82283) 16 8 OR 9 OR 10 OR 11 OR 12 OR 13 (3484232) 17 14 AND 15 AND 16 (3548) 18 Limit 17 to (English language and humans) (2751) EBSCO CINAHL [Searched April 2014] (# of studies identified) 1. (exercise OR physical activity OR habitual physical activity) AND (sedentar* OR inactivity OR television OR
sitting) AND (survival OR morbidity OR mortality OR disease OR hospital* OR utilization) (1191) Google Scholar [Searched August 2014] (# of studies identified) 1
(exercise OR physical activity OR habitual physical activity) AND (sedentar* OR inactivity OR television OR sitting) AND (survival OR morbidity OR mortality OR disease OR hospital* OR utilization) (2,561)
Web of Knowledge [Searched April 2014] (# of studies identified) Search by [Topic] 1 (exercise OR physical activity OR habitual physical activity) AND (sedentar* OR inactivity OR television OR
sitting) AND (survival OR morbidity OR mortality OR disease OR hospital* OR utilization) (2929) 2 English language (2767) Cochrane Library [Searched August 2014] (# of studies identified) Search by [Title, Abstract, Keywords] (exercise OR physical activity OR habitual physical activity) AND (sedentar* OR inactivity OR television OR
sitting) AND (survival OR morbidity OR mortality OR disease OR hospital* OR utilization) (750)

Copyright © American College of Physicians 2015.


![META [DADOS] / META [DATA]](https://cdn.vdocuments.us/doc/165x107/5790780b1a28ab6874c09b8f/meta-dados-meta-data.jpg)


