
Sectoral Mitigation Potentials Bottom Up and Top Down Comparison
Monique Hoogwijk: (Ecofys), Detlef van Vuuren (PBL), Stefan Boeters (CPB),Kornelis Blok (Ecofys), Eliane Blomen (Ecofys), Terry Barker (4CMR),
Jean Chateau (OECD), Arnulf Grübler (Yale University), Toshihiko Masui (NIES), Gert-Jan Nabuurs (ALTERRA),Aleksandra Novikova (CEU), Diana Urge-Vorsatz (CEU). Keywan Riahi (IIASA),
Stephane de la Rue du Can (LBNL), Jayant Sathaye (LBNL), Serban Scrieciu (4CMR).
This study has been performed within the framework of the Netherlands Research Programme on Scientific Assessment and Policy Analysis for Climate Change (WAB). The study results in three products for further reading: a background report describing the bottom-up approach, two workshop reports on the comparison of the bottom –up and top-down approaches for respectively the energy sector and the forestry sector, and an executive summary with main results
and conclusions. All products can be downloaded from the WAB website at www.pbl.nl.
Sectoral Mitigation Potentials, Bottom Up and Top Down Comparison Project August 2008
Scientific Assessment and Policy Analysis (WAB) Climate ChangeThe Netherlands Programme on Scientific Assessment and Policy Analysis Climate Change (WAB) has the
following objectives: Collection and evaluation of relevant scientific information for policy development and decision–making in the
field of climate change;Analysis of resolutions and decisions in the framework of international climate negotiations and their
implications. WAB conducts analyses and assessments intended for a balanced evaluation of the state-of-the-art for
underpinning policy choices. These analyses and assessment activities are carried out in periods of several months to a maximum of one year, depending on the complexity and the urgency of the policy issue. Assessment teams organised to handle the various topics consist of the best Dutch experts in their fields. Teams work on incidental and additionally financed activities, as opposed to the regular, structurally financed activities of the climate research consortium. The work should reflect the current state of science on the relevant topic.
The main commissioning bodies are the National Environmental Policy Plan departments, with the Ministry of Housing, Spatial Planning and the Environment assuming a coordinating role. Work is also commissioned by organisations in society playing an important role in the decision-making process concerned with and the implementation of the climate policy. A consortium consisting of the Netherlands Environmental Assessment Agency (PBL), the Royal Dutch Meteorological Institute, the Climate Change and Biosphere Research Centre (CCB) of Wageningen University and Research Centre (WUR), the Energy research Centre of the Netherlands (ECN), the Netherlands Research Programme on Climate Change Centre at the VU University of Amsterdam (CCVUA), the International Centre for Integrative Studies of the University of Maastricht (UM/ICIS) and the Copernicus Institute at Utrecht University (UU) is responsible for the implementation. The Netherlands Environmental Assessment Agency (PBL), as the main contracting body, is chairing the Steering Committee.
For further information: Netherlands Environmental Assessment Agency MNP, WAB Secretariat (ipc 90), P.O. Box 303, 3720
AH Bilthoven, the Netherlands, tel. +31 30 274 3728 or email: [email protected].
This report in pdf-format is available at www.pbl.nl

Sectoral Mitigation Potentials, Bottom Up and Top Down Comparison Project August 2008
1. Research Question and Context

Sectoral Mitigation Potentials, Bottom Up and Top Down Comparison Project August 2008
Sectoral Mitigation Potential
Key question in climate policy:“How much GHG emissions and energy can be
reduced and at what costs?”
Two approaches:• Bottom Up: focus on separate technologies, aggregating
measures, sectors, regions
• Top Down: focus on economies as a whole, historical behaviour, response to prices (elasticity), structural changes
Both approaches: reductions compared to a baseline

Sectoral Mitigation Potentials, Bottom Up and Top Down Comparison Project August 2008
IPCC WGIII AR4• Emission reduction potentials short term, 2030• Bottom Up and Top Down approach used• Reinforcing message on the potential
Sectoral Mitigation Potentials, Bottom Up and Top Down Comparison Project August 2008
This project: Aim
• Understand difference between bottom up and top
down approaches.
• Derive robust numbers on the sectoral and regional
emission reduction potentials at cost levels.
– How can the studies be compared?
– For what sectors are differences small, for what large?
– Can we explain the differences or the similarities between the
approaches?
– What can we learn for the coming Fifth Assessment Report?

Sectoral Mitigation Potentials, Bottom Up and Top Down Comparison Project August 2008
This project: Team
Team:
Ecofys (PM); ALTERRA; Cambridge University, 4 CMR;
CPB; CEU; PBL; IIASA; LBNL; NIES; OECD.
Commissioned by:
Ministry of Housing Spatial Planning and Environment
(VROM) as part of WAB funding: Wetenschappelijk
Assessment Beleidsanalyse (policy assessment)

Sectoral Mitigation Potentials, Bottom Up and Top Down Comparison Project August 2008
2. Bottom Up and Top Down Methodologies

Sectoral Mitigation Potentials, Bottom Up and Top Down Comparison Project August 2008
Characterising methods
Top-down model Bottom-up model
Technologies By use of production function
Explicit
Calibration Historic behaviour(assumed to continue)
Estimates of future/present technologydetail
Economic feedback
Central Mostly not included
From Detlef van Vuuren, 27 March 2008

Sectoral Mitigation Potentials, Bottom Up and Top Down Comparison Project August 2008
Pros TD
• Detailed technology description and data
• Possible link to variety of policies
• Easy verifiable, transparent. Direct link with actual data possible.
• Modelling total economy, including interactions
• Based on historic behaviour if economic inter-relationships are being explicitly estimated
• Inclusion of different feedbacks and spillover effects.
Pros BU

Sectoral Mitigation Potentials, Bottom Up and Top Down Comparison Project August 2008
Cons TD
• No interactions between economic sectors
• Future costs of technologies in isolation
• No incorporation of market barriers
• Various options already in baseline
• No feedbacks on e.g. energy prices
• Based on historic trends, extrapolation of trends to future
• Mostly based on monetary values rather than physical indicators
• Technology data representation is poor
Cons BU

Sectoral Mitigation Potentials, Bottom Up and Top Down Comparison Project August 2008
Bottom up Top Down• Sectoral assessment per chapter
• Integrated in Chapter 11• Different baselines• Not all options included
•35 studies that reported c-tax and reductions
•Statistical analysis to derive“responses”
•Black boxAt sectoral level no good comparison possible

Sectoral Mitigation Potentials, Bottom Up and Top Down Comparison Project August 2008
3. Activities Within the Project

Sectoral Mitigation Potentials, Bottom Up and Top Down Comparison Project August 2008
This project: Tasks
• TD models 7 runs one baseline and 6 experiments• BU assessment extension to IPCC AR4 work• Workshop energy sectors• Additional runs and information• Analyses and hypothesis• Further discussions• Workshop forestry• Final report, scientific publications

Sectoral Mitigation Potentials, Bottom Up and Top Down Comparison Project August 2008
Bottom Up Approach
• Individual sectoral estimates• WEO baseline (except buildings)• Baseline constructed for activity indicators• Reductions compared to activity indicators (energy savings)
• Substitution to carbon free technologies• Correct for double counting power supply and end use sectors
• For a detailed description: Hoogwijk et al., 2008

Sectoral Mitigation Potentials, Bottom Up and Top Down Comparison Project August 2008
Updates Compared to AR4 per Sector
• Energy Supply–The ranges were extended
• Transport–HDV and MDV were included and biofuels included at regional
scale
• Residential and Service–Frozen efficiencies were excluded from the baseline
–Energy baseline and savings included
• Industry–Figures updated with new literature
–Split between electricity and fuel savings
–Energy baseline and savings included

Sectoral Mitigation Potentials, Bottom Up and Top Down Comparison Project August 2008
Top Down Models Included
Worldscan: Muliti-region, multi-sector CGE model
MESSAGE –MACRO: Dynamic systems engineering optimization model MACRO is a macroeconomic model to reflect the energy demand response
E3MG: macro-econometric simulation hybrid (TD-BU) model of the global energy environment-economy system
AIM/GCE: Global CGE with recursive dynamics
IMAGE: IAM with. TIMER is a dynamic systems engineering simulation model
Env Linkage: Muliti-region, multi-sector recursive dynamic neo-classical general equilibrium model with vintage capital stocks.
Sectoral Mitigation Potentials, Bottom Up and Top Down Comparison Project August 2008
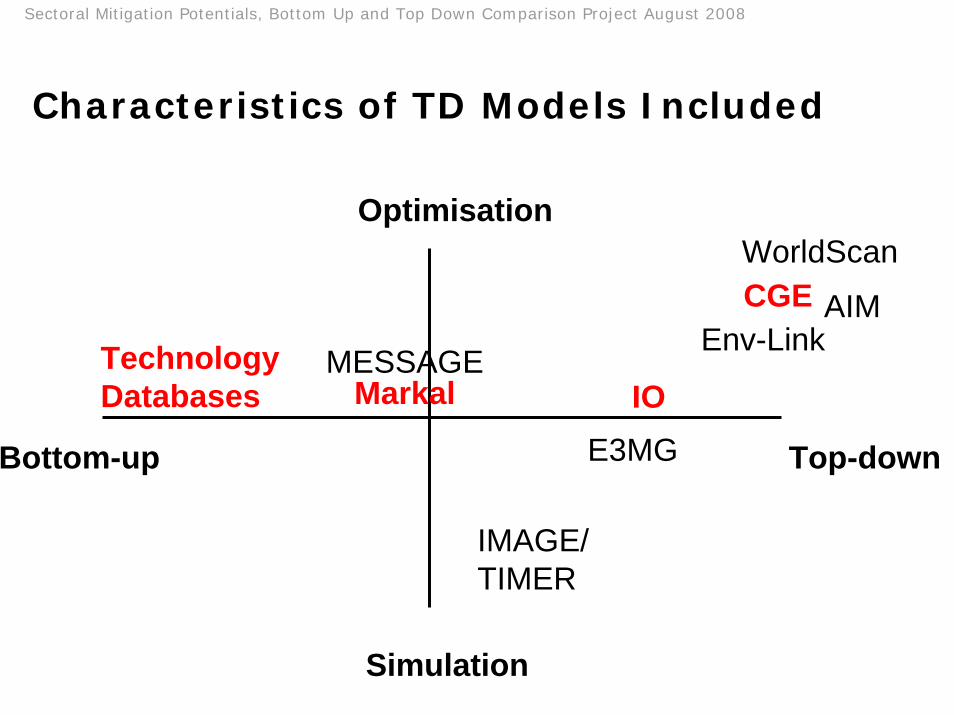
Characteristics of TD Models Included
Top-downBottom-up
Simulation
Optimisation
CGE
IOMarkalTechnologyDatabases
MESSAGE
AIMEnv-Link
WorldScan
IMAGE/TIMER
E3MG

Sectoral Mitigation Potentials, Bottom Up and Top Down Comparison Project August 2008
Top Down Experiments
Baseline SRES B2, 6 experiments
0
20
40
60
80
100
120
2000 2005 2010 2015 2020 2025 2030
Car
bon
cost
s (U
S$/
tCO2
)
Block20 Block 50Block 100 EXPO20EXPO 50 EXPO 100

Sectoral Mitigation Potentials, Bottom Up and Top Down Comparison Project August 2008
Starting Points for Comparison
• Baseline, B2 and WEO• Sectoral definition
– refineries
– district heating
– extraction and distribution
– sectors included
• Emission allocation– Point of emissions (TD)
– End use sectors (BU)
– This project we use point of emission.
• Comparison first only for the energy related sectors
Sectoral Mitigation Potentials, Bottom Up and Top Down Comparison Project August 2008
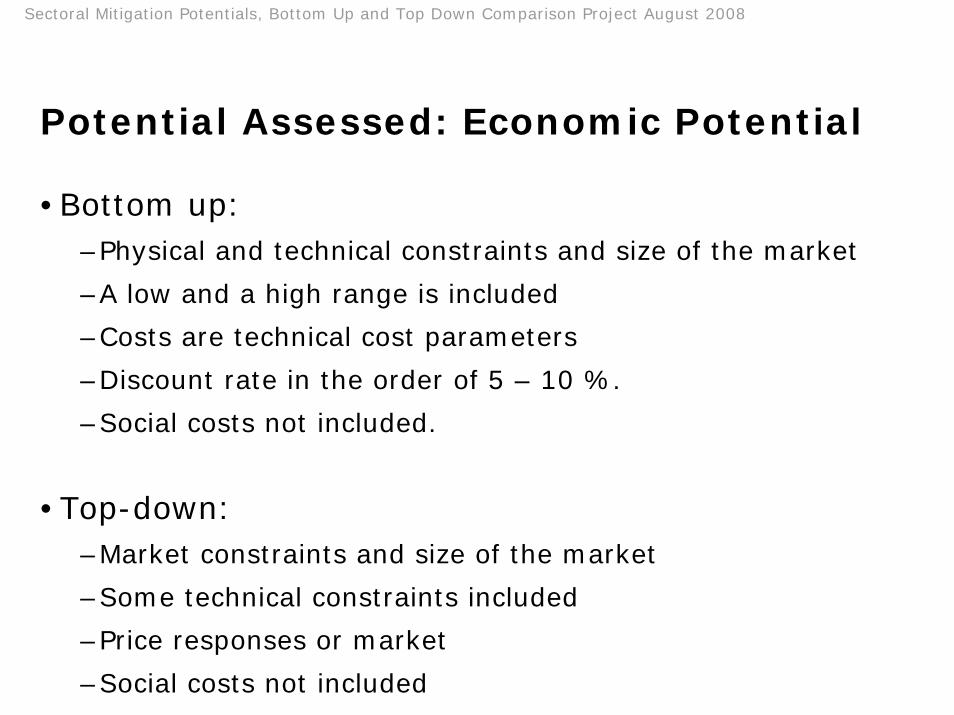
Potential Assessed: Economic Potential
•Bottom up: –Physical and technical constraints and size of the market
–A low and a high range is included
–Costs are technical cost parameters
–Discount rate in the order of 5 – 10 %.
–Social costs not included.
•Top-down: –Market constraints and size of the market
–Some technical constraints included
–Price responses or market
–Social costs not included

Sectoral Mitigation Potentials, Bottom Up and Top Down Comparison Project August 2008
4. Results

Sectoral Mitigation Potentials, Bottom Up and Top Down Comparison Project August 2008
Baseline Emissions per sector (2000)
2030
0.0
10.0
20.0
30.0
40.0
50.0
60.0
70.0
80.0
WorldScan MESSAGE-MACRO E3MG AIM/CGE IMAGE ENV-Linkage
Gto
nne
CO
2eq
Energy Supply Transportation (demand) Buildings (demand)
Industry Agriculture Forestry
Waste Management (landfills)
Sectoral Mitigation Potentials, Bottom Up and Top Down Comparison Project August 2008
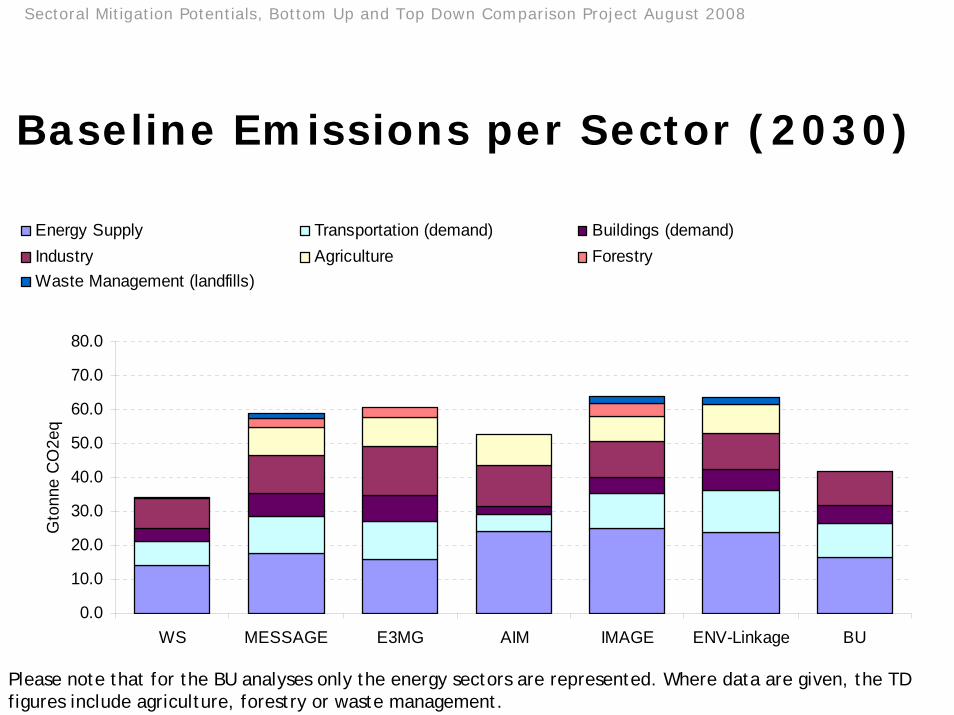
Baseline Emissions per Sector (2030)
2030
0.0
10.0
20.0
30.0
40.0
50.0
60.0
70.0
80.0
WS MESSAGE E3MG AIM IMAGE ENV-Linkage BU
Gto
nne
CO
2eq
Energy Supply Transportation (demand) Buildings (demand)Industry Agriculture ForestryWaste Management (landfills)
Please note that for the BU analyses only the energy sectors are represented. Where data are given, the TD figures include agriculture, forestry or waste management.

Sectoral Mitigation Potentials, Bottom Up and Top Down Comparison Project August 2008
Baseline Emissions per emission type (2030)
0
10
20
30
40
50
60
70
80
WorldScan MESSAGE-MACRO
E3MG AIM/CGE IMAGE ENV-Linkage
Bas
elin
e E
mis
sion
s G
tCO
2-eq
CO2 non CO2

Sectoral Mitigation Potentials, Bottom Up and Top Down Comparison Project August 2008
Baseline Energy Use per Fuel
Note that for ENV Linkage only fossil fuels are reported
0100200300400500600700800900
2000 2030 2000 2030 2000 2030 2000 2030 2000 2030 2000 2030
worldscan MESSAGE-MACRO
E3MG AIM IMAGE ENV Linkage
Tota
l prim
ary
ener
gy (E
J/y)
Oil Coal Gas Biomass Other

Sectoral Mitigation Potentials, Bottom Up and Top Down Comparison Project August 2008
Responses to Increased Carbon Cost
Different responses to increased carbon costs
• Fuel switch to low(er) carbon technologies (ALL)• Energy efficiency improvement (ALL)• Reduction of output (TD except IMAGE)• Structural changes (TD except IMAGE)
Sectoral Mitigation Potentials, Bottom Up and Top Down Comparison Project August 2008
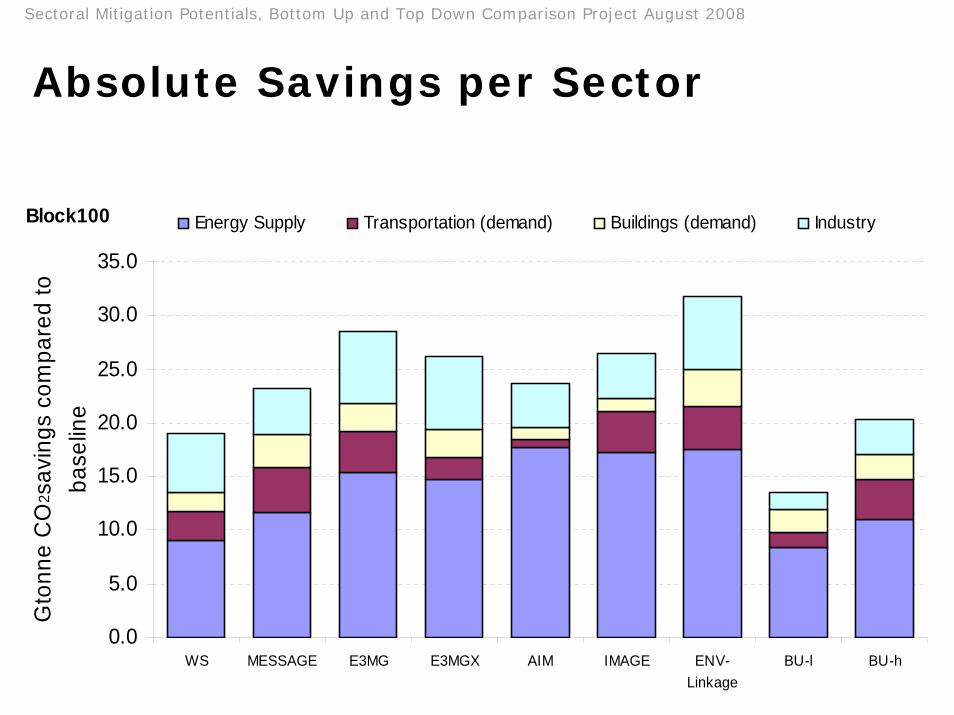
Absolute Savings per Sector
Block100
0.0
5.0
10.0
15.0
20.0
25.0
30.0
35.0
WS MESSAGE E3MG E3MGX AIM IMAGE ENV-Linkage
BU-l BU-h
Gto
nne
CO
2 sav
ings
com
pare
d to
ba
selin
e
Energy Supply Transportation (demand) Buildings (demand) Industry

Sectoral Mitigation Potentials, Bottom Up and Top Down Comparison Project August 2008
Savings Bottom Up Compared to IPCC AR4
0
2
4
6
8
10
12
Low High Low High Low High Low High
IPCC This study IPCC This study
Point of emission Point of end use
GH
G e
mis
sion
sav
ings
BU
app
roac
h (G
ton
CO 2
e)
Energy supply Transport Residential and Services Industry

Sectoral Mitigation Potentials, Bottom Up and Top Down Comparison Project August 2008
Savings Top Down Compared to IPCC AR4
1 10 1000
5
10
15
20
25
30
35
40
45
50
Red
uctio
ns (G
tCO
2-eq)
Carbon tax ($/tC)
IPCC IPCC-IAM IPCC-CGE IPCC-linear corr
This study WorldScan MESSAGE E3MG AIM/CGE IMAGE ENV-Linkages bottom-up (low/high)

Sectoral Mitigation Potentials, Bottom Up and Top Down Comparison Project August 2008
Relative Emission Reduction in 2030 (1)
Total Energy Sectors
0%
10%
20%
30%
40%
50%
60%
70%
80%
90%
100%
WS MESSAGE E3MG E3MGX AIM IMAGE ENV-Linkage
BU-l BU-h
Em
issi
on re
duct
ion
com
pare
d to
bas
elin
e (%
)
<0 <20 <50 <100

Sectoral Mitigation Potentials, Bottom Up and Top Down Comparison Project August 2008
Relative Emission Reduction in 2030 (2)
0%
10%
20%
30%
40%
50%
60%
70%
0 10 20 30 40 50 60 70 80 90 100
Carbon costs (US$/tCO2)
Rel
ativ
e em
issi
on re
duct
ion
pote
ntia
l (%
)
Worldscan MESSAGE E3MGAIM IMAGE Env LinkageBU-l BU-h
BU-h and BU-l are low and high range of the BU estimates. The TD estimates indicated include the Block experiments with a continued carbon cost

Sectoral Mitigation Potentials, Bottom Up and Top Down Comparison Project August 2008
Relative Emission Reduction per Sector
0%
10%
20%
30%
40%
50%
60%
70%
80%
90%
100%
WS Message E3MG AIM IMAGE Env-Linkage
BU-l BU-h
Em
issi
on re
duct
ion
pote
ntia
l com
pare
d to
bas
elin
e (%
) Energy Supply Transportation (demand) Buildings (demand) Industry Total

Sectoral Mitigation Potentials, Bottom Up and Top Down Comparison Project August 2008
Block versus EXPO experiment (1)Worldscan
0.0
5.0
10.0
15.0
20.0
25.0
30.0
35.0
40.0
20 50 100Carbon costs (US$/tCO2)
Block
Expo
MESSAGE-MACRO
0.0
5.0
10.0
15.0
20.0
25.0
30.0
35.0
40.0
20 50 100Carbon costs (US$/tCO2)
Block
Expo
AIM
0.0
5.0
10.0
15.0
20.0
25.0
30.0
35.0
40.0
20 50 100Carbon costs (US$/tCO2)
Block
Expo
IMAGE
0.0
5.0
10.0
15.0
20.0
25.0
30.0
35.0
40.0
20 50 100Carbon costs (US$/tCO2)
Block
Expo

Sectoral Mitigation Potentials, Bottom Up and Top Down Comparison Project August 2008
E3MG-X
0.0
5.0
10.0
15.0
20.0
25.0
30.0
35.0
40.0
20 50 100Carbon costs (US$/tCO2)
Block
Expo
Block versus EXPO experiment (2)ENV-Linakge
0.0
5.0
10.0
15.0
20.0
25.0
30.0
35.0
40.0
20 50 100Carbon costs (US$/tCO2)
Block
Expo
E3MG
0.0
5.0
10.0
15.0
20.0
25.0
30.0
35.0
40.0
20 50 100Carbon costs (US$/tCO2)
Block
Expo

Sectoral Mitigation Potentials, Bottom Up and Top Down Comparison Project August 2008
Sector: Energy Supply
Energy Supply
0%
10%
20%
30%
40%
50%
60%
70%
80%
90%
100%
WS MESSAGE E3MG E3MGX AIM IMAGE ENV-Linkage
BU-l BU-h
Emis
sion
redu
ctio
n co
mpa
red
to b
asel
ine <0 <20 <50 <100
Large reductions both models and BU and TD
• Sector with centralised and rationale decision making
• Mostly reduction emission factor (fuel Switch) and electricity savings

Sectoral Mitigation Potentials, Bottom Up and Top Down Comparison Project August 2008
Transport
0%
10%
20%
30%
40%
50%
60%
70%
80%
90%
100%
WS MESSAGE E3MG E3MGX AIM IMAGE ENV-Linkage
BU-l BU-h
Emis
sion
redu
ctio
n co
mpa
red
to b
asel
ine <0 <20 <50 <100
Comparable results among models and BU and TD
• Sector with relatively low (technical) potential and slow response on prices
Sector: Transport

Sectoral Mitigation Potentials, Bottom Up and Top Down Comparison Project August 2008
Buildings
0%
10%
20%
30%
40%
50%
60%
70%
80%
90%
100%
WS MESSAGE E3MG E3MGX AIM IMAGE ENV-Linkage
BU-l BU-h
Emis
sion
redu
ctio
n co
mpa
red
to b
asel
ine
<0 <20 <50 <100
Sector: Residential and Services
Comparable results among models but NOT for BU
• Large uncertainties mainly in non OECD region (also baseline)
• Top down more options are included.

Sectoral Mitigation Potentials, Bottom Up and Top Down Comparison Project August 2008
Sector: Industry
Comparable results among models but NOT for BU
• Data are uncertain: elasticity not available, BU data not always available
• BU mainly efficiency improvement.
• Top down models do include more options than BU: recycling, dematerialisation.
Industry
0%
10%
20%
30%
40%
50%
60%
70%
80%
90%
100%
WS MESSAGE E3MG E3MGX AIM IMAGE ENV-Linkage
BU-l BU-h
Emis
sion
redu
ctio
n co
mpa
red
to b
asel
ine
<0 <20 <50 <100
Sectoral Mitigation Potentials, Bottom Up and Top Down Comparison Project August 2008
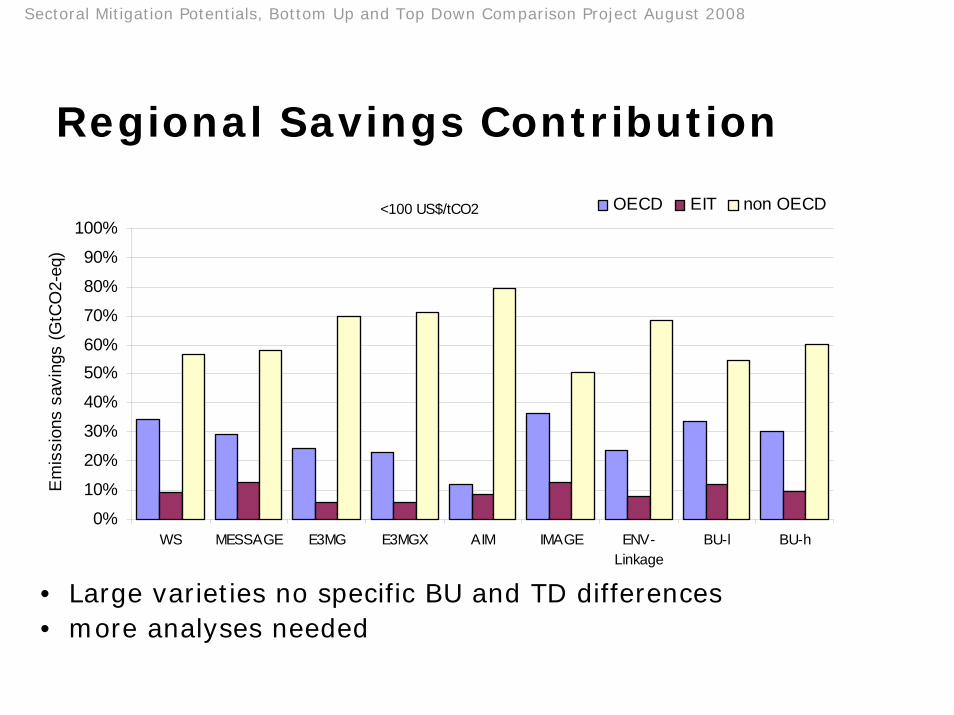
Regional Savings Contribution
<100 US$/tCO2
0%
10%
20%
30%
40%
50%60%
70%
80%
90%
100%
WS MESSAGE E3MG E3MGX AIM IMAGE ENV-Linkage
BU-l BU-h
Em
issi
ons
savi
ngs
(GtC
O2-
eq)
OECD EIT non OECD
• Large varieties no specific BU and TD differences• more analyses needed

Sectoral Mitigation Potentials, Bottom Up and Top Down Comparison Project August 2008
Regional Savings Relative to Baseline
0%
10%
20%
30%
40%
50%
60%
70%
80%
90%
100%
WS MESSAGE E3MG E3MGX AIM IMAGE ENV-Linkage
BU-l BU-h
Em
issi
ons
savi
ngs
(GtC
O 2-e
q)
OECD EIT non OECD

Sectoral Mitigation Potentials, Bottom Up and Top Down Comparison Project August 2008
Comparison Energy and Emission Savings
0%10%20%30%40%50%60%70%80%90%
100%
Wor
ldsc
an
MES
SAG
E
E3M
G
AIM
IMAG
E
Env
Link
age
Wor
ldsc
an
MES
SAG
E
E3M
G
AIM
IMAG
E
Env
Link
age
Wor
ldsc
an
MES
SAG
E
E3M
G
AIM
IMAG
E
Env
Link
age
Block 20 Block 50 Block 100
Tota
l ene
rgy
savi
ngs
com
pare
d to
bas
elin
e (%
)
Total primary energy savingsTotal CO2 emisison savings

Sectoral Mitigation Potentials, Bottom Up and Top Down Comparison Project August 2008
Global Differences in Fuel Consumption
-100%
-50%
0%
50%
100%
150%
200%
Wor
ldsc
an
ME
SS
AG
E
E3M
G
AIM
IMA
GE
Env
Link
age
Wor
ldsc
an
ME
SS
AG
E
E3M
G
AIM
IMA
GE
Env
Link
age
Wor
ldsc
an
ME
SS
AG
E
E3M
G
AIM
IMA
GE
Env
Link
age
Block 20 Block 50 Block 100Rel
ativ
e us
e of
ene
rgy
feed
stoc
k co
mpa
red
to b
asel
ine
(%)
Oil Coal Gas Biomass Other

Sectoral Mitigation Potentials, Bottom Up and Top Down Comparison Project August 2008
Forestry Sector• Uncertainties of the mitigation potential from forestry sector
are large, complicating the comparison between different modelling approaches.
• Rather than a difference between BU and TD, a difference was found between sectoral and cross sectoral modelling approaches.
• Main differences between modelling output originate from differences in system boundaries, in basic modelling approach (economic versus engineering) and treatment of reference situation.
• Comparison should be made on the cumulative level, whether currently most data are presented on the annual level.
• Bottom up analyses for REDD are not possible and there should always be modelling analyses.

Sectoral Mitigation Potentials, Bottom Up and Top Down Comparison Project August 2008
Agricultural Sector
• Many emission models do not include the non CO2
emissions and reductions from the agricultural sector. • There is a large problem with the baseline scenario when
comparing between TD models and with BU assessment.• Specific agricultural models are needed to compare the
mitigation potentials. In this study this was not possible due to time constraints.
• Specific runs under standardised conditions and references are required for further investigation. Both with emission and agricultural models.

Sectoral Mitigation Potentials, Bottom Up and Top Down Comparison Project August 2008
5. Discussion and Conclusion
Sectoral Mitigation Potentials, Bottom Up and Top Down Comparison Project August 2008
Fundamental Differences Between BU and TD
Bottom up and top down approach are completely different approaches making it difficult to compare results:
• Most bottom up approaches do not quantify barriers to overcome negative costs.
• For bottom up, the baseline is mostly used as reference for activity data and emissions, no consistent analyses is done with the baseline.
• Most top down approaches include macro economic feedbacks.• Because of the inclusion of macro economic feedbacks, in most top
down studies output reduction and structural changes are included in the mitigation potential.
• The bottom up approach allocates emissions and reductions to enduse sectors. Top down models use an allocation to point of emission.
Sectoral Mitigation Potentials, Bottom Up and Top Down Comparison Project August 2008
Main Findings on BU and TD• Significant work is needed for AR5 to improve the
mitigation potentials and comparison • Guiding is required to compare the different approaches,
even between TD• The energy and transport sector have the most comparable
results between BU and TD• The buildings and industry sector show comparable results
among TD models but NOT for BU. • The data for energy efficiency improvements are most
uncertain. • TD models include more options than BU for the industry
sector for instance recycling and use of different materials

Sectoral Mitigation Potentials, Bottom Up and Top Down Comparison Project August 2008
Mitigation Potential – Robust Findings
• The ranges between the results at sectoral and regional scale are large.
• The results reinforce the message from the IPCC AR4 • Reductions compared to baseline in 2030: 40 – 55%• Reductions compared to baseline in 2000: 60 – 100% • Most reduction originate from the energy supply sector• Transport sector low potential• Building sector has the reductions at the lowest costs• Largest uncertainties:
–building sector
–non OECD region
– low carbon costs

Sectoral Mitigation Potentials, Bottom Up and Top Down Comparison Project August 2008
Guidance For Using Sectoral Mitigation Potentials
• Only consider ranges, never one single number or study for policy decisions.
• Ensure the consistency in allocation of emissions and the definition of sectors when comparing data.
• Only use relative numbers when comparing mitigation potentials.

Sectoral Mitigation Potentials, Bottom Up and Top Down Comparison Project August 2008
Further work needed for AR5 (1)
• Develop guidelines on reporting bottom up and top down studies regarding:–Baseline
–Sectoral definitions
–Emission and energy allocation principles
– Inclusion of mitigation options
• Disaggregated baselines for bottom up analyses • Improve BU estimates by:
–harmonizing the methodology of the residential and service sector
– identifying reduction measures that have not been included in AR4 (Combined Heat and Power (CHP), use of recycling material in theindustry sector, non CO2)
–better representing developing countries
Sectoral Mitigation Potentials, Bottom Up and Top Down Comparison Project August 2008
Further work needed for AR5 (2)
• Conduct studies specifically on behavioural changes• Improve the representation of top down models by:
– Conduct additional studies to improve data in top down models
– Check differences in original databases (GTAP and IEA)
– Include physical parameters in economic models to improve comparability
• Improve the consistency on modelling and reporting forestry sector


