Second quarter results 2001
16 August, 2001

Broad mix of clients and products proves its value
Strategy continuous dynamic process
Overriding objective Top 5;
annual performance targets published at full year results 2001
Changes in Managing Board
Second quarter results 2001
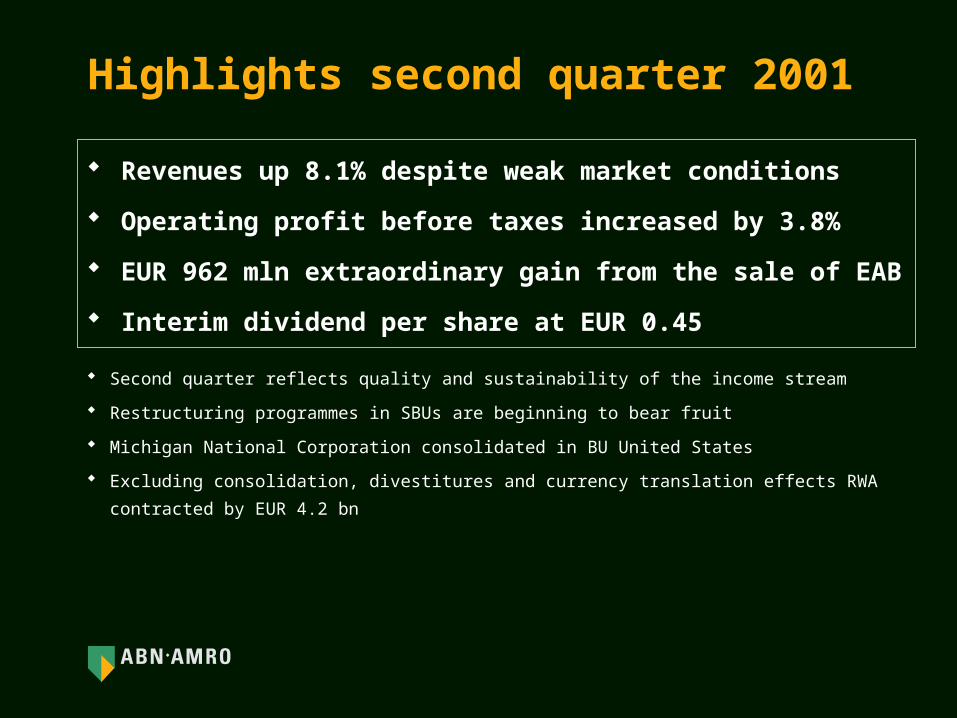
Highlights second quarter 2001
Second quarter reflects quality and sustainability of the income stream
Restructuring programmes in SBUs are beginning to bear fruit
Michigan National Corporation consolidated in BU United States
Excluding consolidation, divestitures and currency translation effects RWA contracted by EUR 4.2 bn
Revenues up 8.1% despite weak market conditions
Operating profit before taxes increased by 3.8%
EUR 962 mln extraordinary gain from the sale of EAB
Interim dividend per share at EUR 0.45

Status report on strategic initiatives:Strategy Wholesale Clients SBU
Revenue enhancement– strong focus on European client base – emphasis on financial institutions and large/medium cap
corporate clients– emphasis on annuity products and selective investment banking
products
Cost control
– decrease in headcount from TOPS, equity business and
disposal of certain international operations
Capital allocated will be reduced

Status report on strategic initiatives
Restructuring programme BU Netherlands– new service concept: 10 pilots launched– agreement with staff council and the trade unions– general programme to stimulate natural attrition
Closure of countries and disposal of retail businesses– Morocco, Panama and Sri Lanka announced in second quarter– rationalisation/disposal of another 8 countries in the pipeline
Integration of MNC, Alleghany and ING Barings business in US– integration (systems, back office and closure/sale of branches) of
MNC expected to be completed in October– integration Alleghany and ING Barings US on track; cost
synergies expected in second half

RevenuesOperating expensesOperating resultProvisioning for loan lossesOperating profit before taxTaxesExtraordinary resultNet profitNet profit excl. sale EAB
EPS (x EUR)
(EUR m)
Key figures: profit and loss account
Q2 01
4,9013,6151,286
2531,039
296962
1,633671
0.44
Q1 01
4,5333,2531,280
2671,001
247-
683683
0.45
Q2 01/Q1 01
8.111.1
0.5(5.2)
3.819.8
-139.1(1.8)
(2.2)
8.714.4(4.8)78.2
(15.9)(1.0)
-91.9
(21.2)
(22.8)
% change
Q2 01/Q2 00
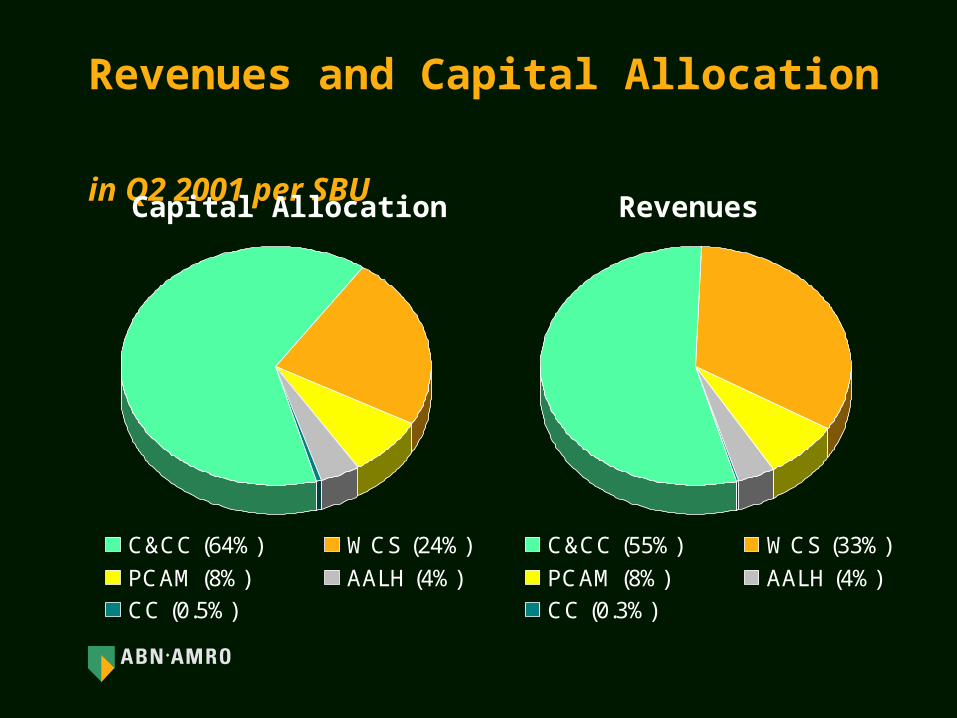
C&CC (64%) WCS (24%)
PCAM (8%) AALH (4%)
CC (0.5%)
Revenues and Capital Allocation in Q2 2001 per SBU
C&CC (55%) WCS (33%)
PCAM (8%) AALH (4%)
CC (0.3%)
Capital Allocation Revenues
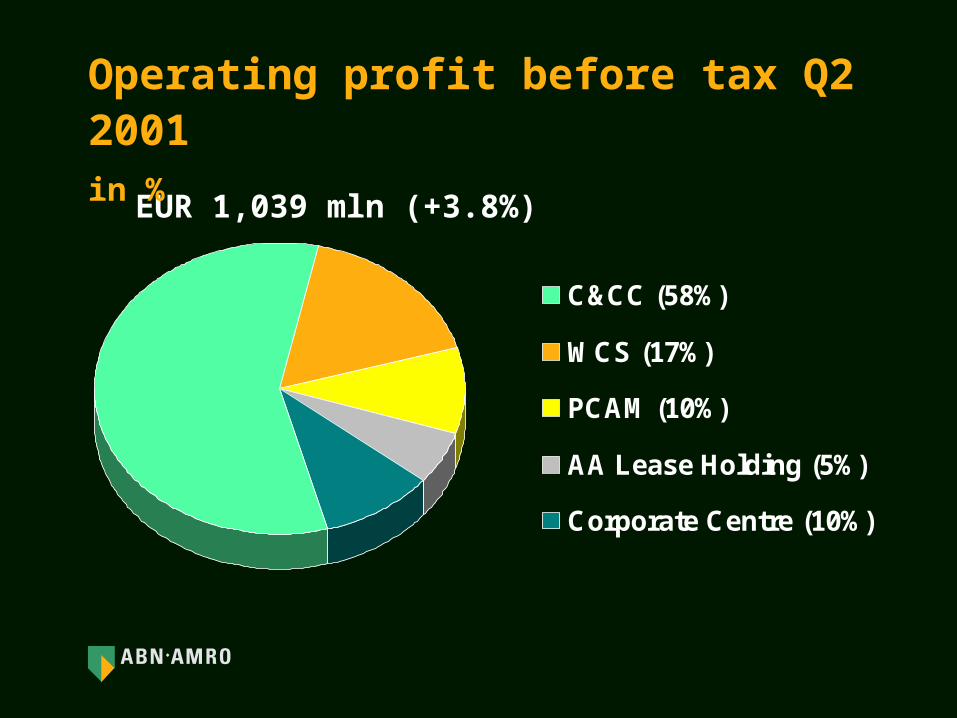
C&CC (58%)
WCS (17%)
PCAM (10%)
AA Lease Holding (5%)
Corporate Centre (10%)
EUR 1,039 mln (+3.8%)
Operating profit before tax Q2 2001in %

Provisioning second quarter 2001
- specific bad debt provisioning- cross-border risks provisioning
Provisioning for loan lossesAddition to FARTotal
262(9)
253-
253
160(36)
12418
142
Q2 01(EUR m)
280(13)
267-
267
Q1 01 Q2 00
Consumer & Commercial ClientsWholesale ClientsPrivate Clients & Asset ManagementAA Lease HoldingCorporate Centre
22040(1)
5(11)
809010
4(42)
Q2 01(EUR m)
17692
34
(8)
Q1 01 Q2 00
0
50
100
150
200
250
300
92 93 94 95 96 97 98 99 '00 01*
0
10
20
30
40
50
60EUR bn
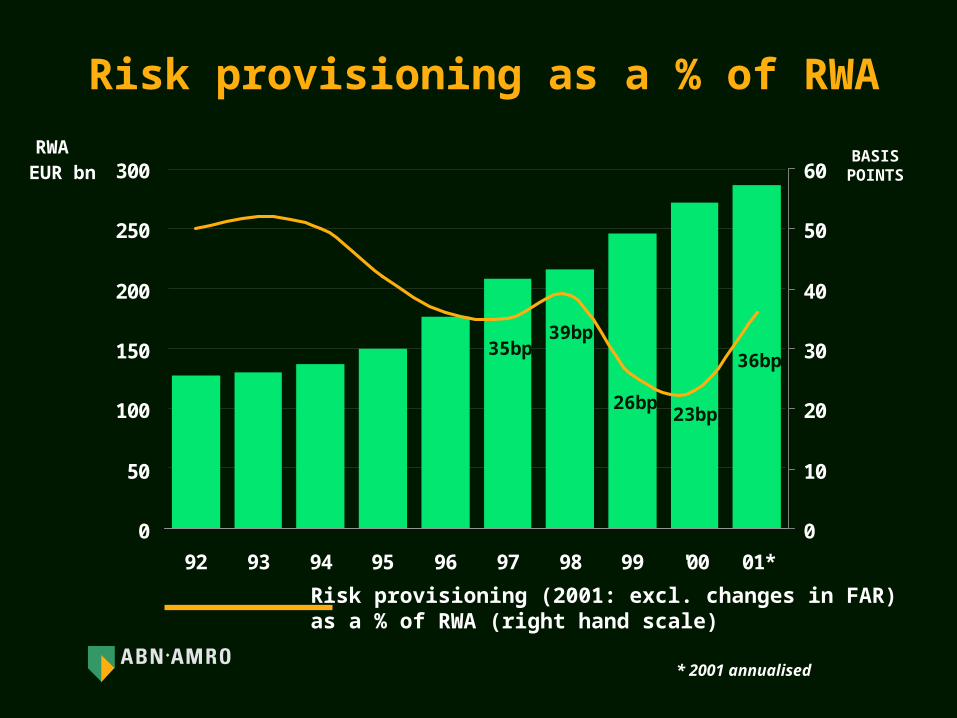
Risk provisioning (2001: excl. changes in FAR)as a % of RWA (right hand scale)
Risk provisioning as a % of RWA
RWA
26bp
39bp35bp
BASISPOINTS
* 2001 annualised
23bp
36bp

Key figures: balance sheet
* -1.5% adjusted for impact of acquisitions and exchange rates
Total assetsShareholders’ EquityGroup capitalRisk-weighted assets*
Total capital ratioTier 1 ratio
(EUR bn) 30 06 01
614.611.634.7
286.1
10.19%6.55%
31 03 01
601.712.233.7
278.4
10.19%6.82%
30 06 01/ 31 03 01
2.1(5.1)
2.92.8
13.2(7.6)
6.68.4
% change
30 06 01/31 12 00

Operating result
Provisioning
Pre-tax profit
RWA* (EUR bn)
Revenues Q2 2001
Interest
Other
Commissions
Diversified, stable and consistent income stream
Costs are strictly monitored and under control
Higher provisioning levels, but overall quality of the portfolio remains strong
Performance BU Netherlands stabilising, US and Brazil perform well
Trading
(EUR m) Q2 01 Q1 01
Consumer & Commercial Clients
* RWA June 2001 compared to March 2001
% change
818
220
598
166.4
847
176
671
163.3
(3.4)
25.0
(10.9)
1.9
10.4
175.0
(9.5)
Q2 01/Q1 01
Q2 01/Q2 00
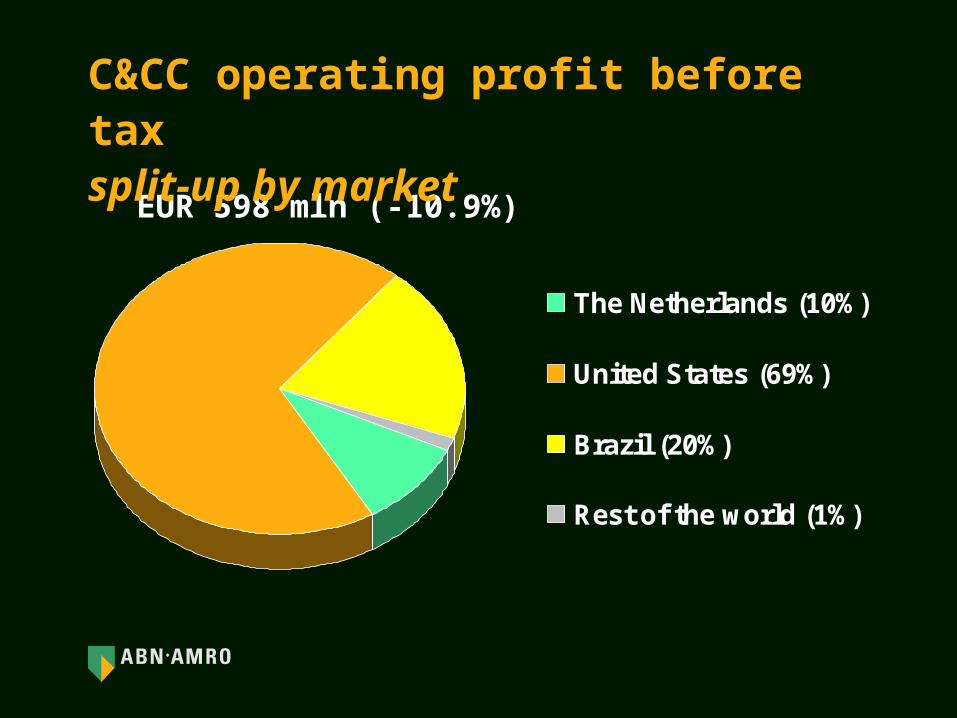
The Netherlands (10%)
United States (69%)
Brazil (20%)
Rest of the world (1%)
EUR 598 mln (-10.9%)
C&CC operating profit before tax split-up by market
Aligning clients with products has led to the choice of high margin products and better allocation of capital
Negative impact of depressed equity markets is partly offset by broad mix of clients and products in general and the performance of GFM in particular
Strong increase in interest income and lowering of provisioning drive profitability
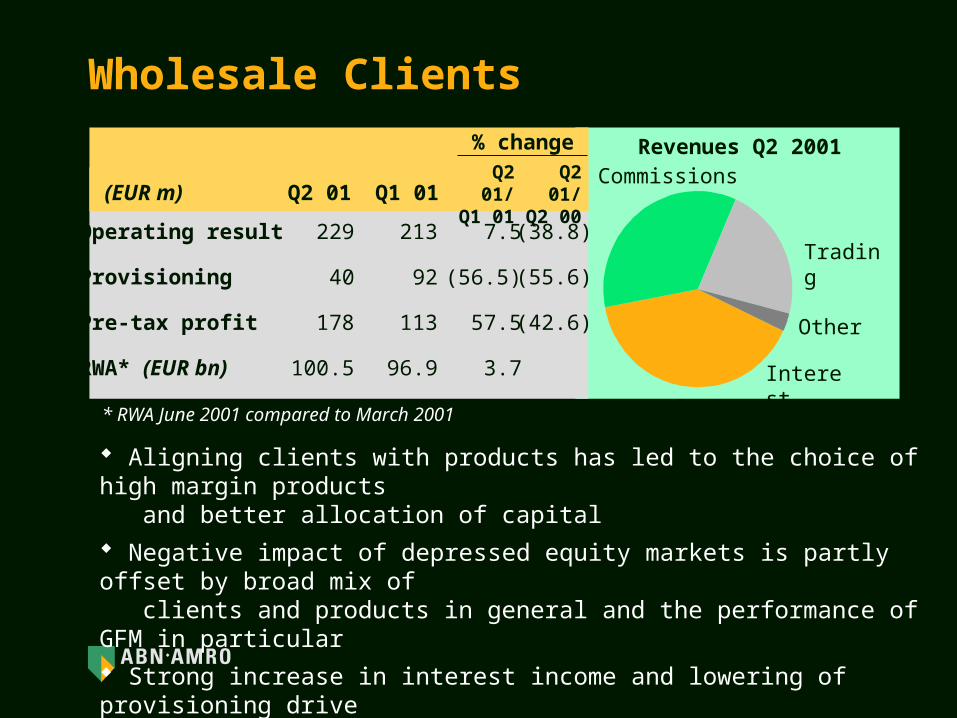
Wholesale Clients
Operating result
Provisioning
Pre-tax profit
RWA* (EUR bn)
Revenues Q2 2001
Interest
Other
Commissions
Trading
(EUR m) Q2 01 Q1 01
* RWA June 2001 compared to March 2001
% change
229
40
178
100.5
213
92
113
96.9
7.5
(56.5)
57.5
3.7
(38.8)
(55.6)
(42.6)
Q2 01/Q1 01
Q2 01/Q2 00

Healthy increase in revenues despite difficult market conditions
Integration of businesses within Private Clients and integration of Alleghany within Asset Management well under way
Assets under Management rose 4.5% to EUR 175.8 bn
Assets under Administration remained stable at EUR 110 bn
Private Clients & Asset Management
Operating result
Provisioning
Pre-tax profit
RWA* (EUR bn)
Revenues Q2 2001
Interest
Other
Commissions
Trading
(EUR m) Q2 01 Q1 01
* RWA June 2001 compared to March 2001
% change
97
(1)
99
6.0
70
3
66
6.1
38.6
-
50.0
(1.6)
(41.6)
-
(36.5)
Q2 01/Q1 01
Q2 01/Q2 00

Wholesale limits by regionas per June 2001
Asia Pacific Advanced8% (8%)
North America27% (26%)
Africa1% (1%)
Europe 48% (50%)
Eastern Europe1% (2%)
Middle East
1% (1%)
Asia7% (6%)
Latin America6% (5%)
( ) December
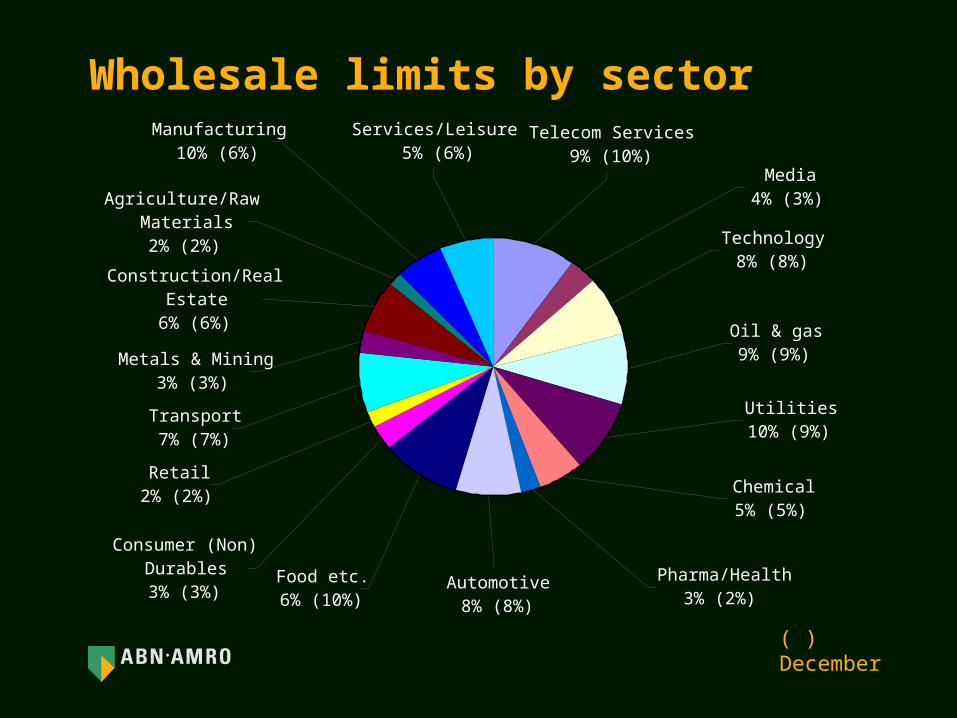
Wholesale limits by sectorTelecom Services
9% (10%)Media
4% (3%)
Technology8% (8%)
Oil & gas9% (9%)
Utilities10% (9%)
Pharma/Health3% (2%)
Chemical5% (5%)
Automotive8% (8%)
Food etc.6% (10%)
Services/Leisure 5% (6%)
Manufacturing10% (6%)
Agriculture/Raw Materials2% (2%)
Construction/Real Estate
6% (6%)
Retail2% (2%)
Consumer (Non) Durables3% (3%)
Transport7% (7%)
Metals & Mining3% (3%)
( ) December
Outlook full year 2001
The much hoped for improvements, in the economic and
market conditions, have not materialised in the first half
of the year and it is unlikely that there will be a significant
improvement in the remainder of the year.
Consequently, we expect our full year results to be
broadly in line with our performance in the first half of
this year.

ANNEXES
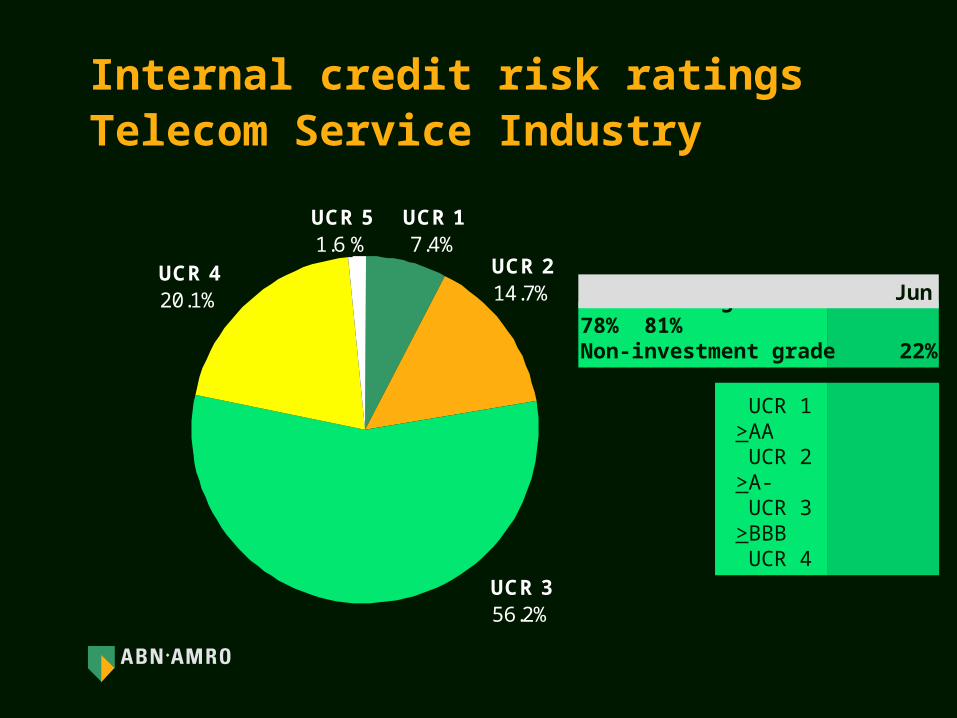
Internal credit risk ratingsTelecom Service Industry
UCR 51.6 %
UCR 420.1%
UCR 17.4%
UCR 214.7%
UCR 356.2%
UCR 1 >AA UCR 2 >A- UCR 3 >BBB UCR 4 >BB- UCR 5 >B- UCR 6 >CC UCR 7 <C
Investment grade 78% 81%Non-investment grade 22% 19%
Jun Dec

Internal credit risk ratingsAutomotive Industry
UCR 62%
UCR 51%
UCR 412%
UCR 16%
UCR 228%
UCR 351%
UCR 1 >AA UCR 2 >A- UCR 3 >BBB UCR 4 >BB- UCR 5 >B- UCR 6 >CC UCR 7 <C
Investment grade 85% 89%Non-investment grade 15% 11%
Jun Dec

UCR 61% (0%)
UCR 51% (1%)
UCR 4 12% (10%)
UCR 122% (22%)
UCR 226% (31%)
UCR 339% (36%)
Internal credit risk ratingsWholesale Clients
UCR 1 >AA UCR 2 >A- UCR 3 >BBB UCR 4 >BB- UCR 5 >B- UCR 6 >CC UCR 7 <C
( ) December
Investment grade 86% 89%Non-investment grade 14% 11%
Jun Dec
UCR 1-384% (86%)
UCR 412% (10%)
UCR 5-74% (4%)
( ) December
UCR 1 >AA UCR 2 >A- UCR 3 >BBB UCR 4 >BB- UCR 5 >B- UCR 6 >CC UCR 7 <C
Investment grade 84% 86%Non-investment grade 16% 14%
Jun Dec
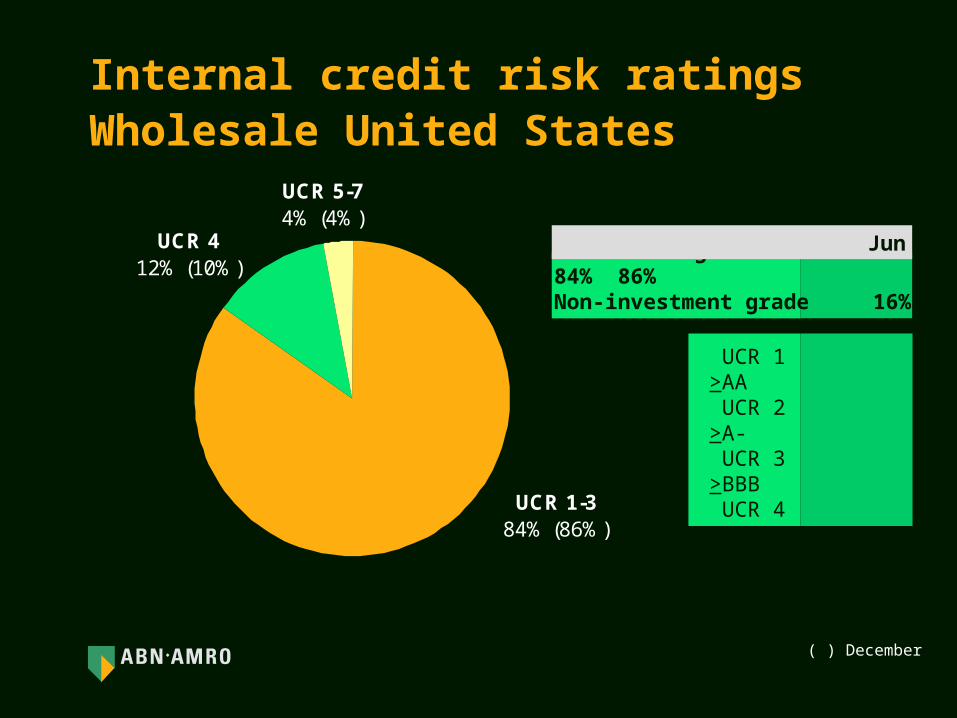
Internal credit risk ratings Wholesale United States

UCR 1-364% (66%)
UCR 425% (27%)
UCR 5-711% (7%)
( ) December
UCR 1 >AA UCR 2 >A- UCR 3 >BBB UCR 4 >BB- UCR 5 >B- UCR 6 >CC UCR 7 <C
Investment grade 64% 66%Non-investment grade 36% 34%
Jun Dec
Internal credit risk ratings C&CC BU United States
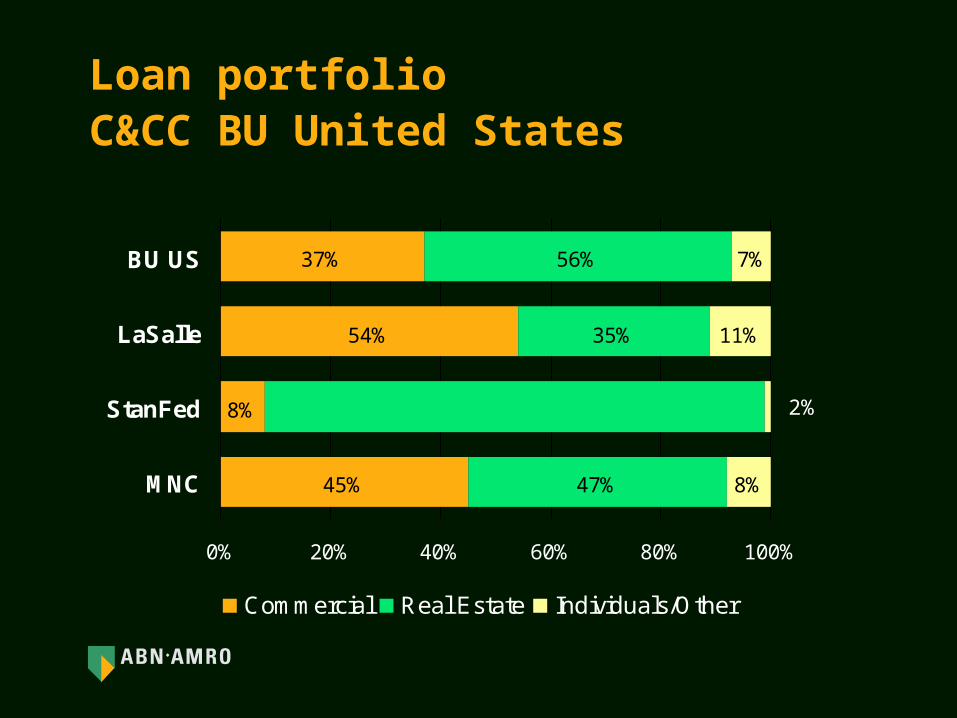
Loan portfolio C&CC BU United States
45%
8%
54%
37%
47%
35%
56%
8%
11%
7%
0% 20% 40% 60% 80% 100%
MNC
StanFed
LaSalle
BU US
Commercial Real Estate Individuals/Other
2%

Internal credit risk ratings C&CC BU United States
59%
98%
51%
26%
37%
15%
12%
0% 20% 40% 60% 80% 100%
MNC
StanFed
LaSalle
UCR 1-3 UCR 4 UCR 5-7
2%
0%
25%
50%
75%
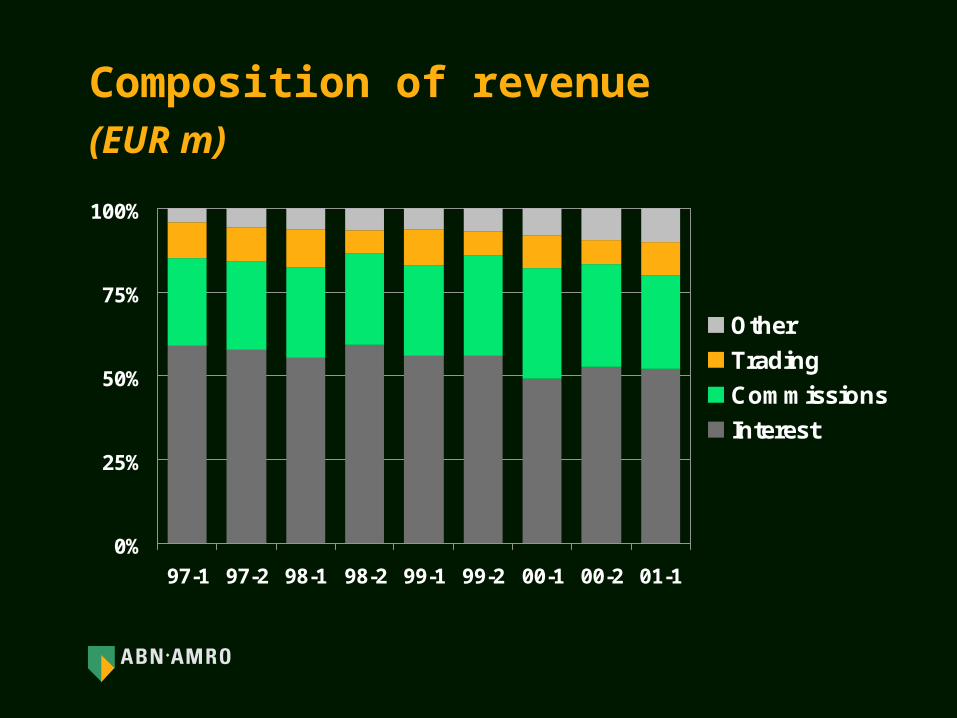
100%
97-1 97-2 98-1 98-2 99-1 99-2 00-1 00-2 01-1
Other
Trading
Commissions
Interest
Composition of revenue(EUR m)
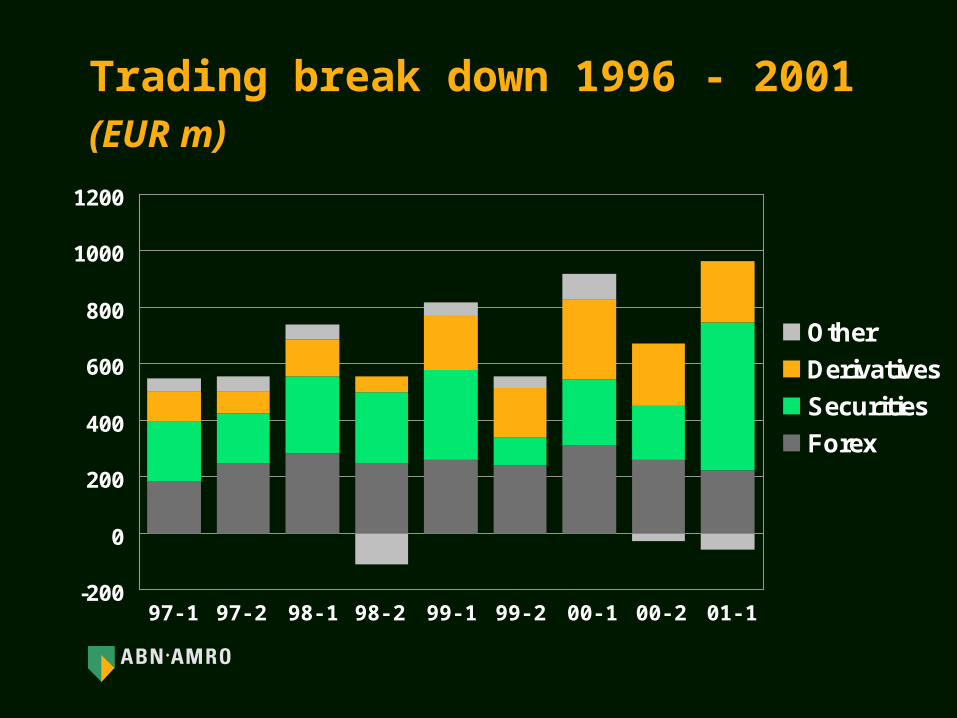
Trading break down 1996 - 2001(EUR m)
-200
0
200
400
600
800
1000
1200
Other
Derivatives
Securities
Forex
97-1 97-2 98-1 98-2 99-1 99-2 00-1 00-2 01-1


Cautionary Statement regarding Forward-Looking Statements
This announcement contains forward-looking statements. Forward-looking statements arestatements that are not historical facts, including statements about our beliefs and expectations.Any statement in this announcement that expresses or implies our intentions, beliefs,expectations or predictions (and the assumptions underlying them) is a forward-lookingstatement. These statements are based on plans, estimates and projections, as they are currentlyavailable to the management of ABN AMRO. Forward-looking statements therefore speak only asof the date they are made, and we take no obligation to update publicly any of them in light ofnew information or future events.
Forward-looking statements involve inherent risks and uncertainties. A number of importantfactors could therefore cause actual future results to differ materially from those expressed orimplied in any forward-looking statement. Such factors include, without limitation, the conditions inthe financial markets in Europe, the United States, Brazil and elsewhere from which we derive asubstantial portion of our trading revenues; potential defaults of borrowers or tradingcounterparties; the implementation of our restructuring including the envisaged reduction inheadcount; the reliability of our risk management policies, procedures and methods; and otherrisks referenced in our filings with the U.S. Securities and Exchange Commission. For moreinformation on these and other factors, please refer to our Annual Report on Form 20-F filed withthe U.S. Securities and Exchange Commission and to any subsequent reports furnished or filedby us with the U.S. Securities and Exchange Commission.
The forward-looking statements contained in this announcement are made as of the date hereof,and the companies assume no obligation to update any of the forward-looking statementscontained in this announcement.


