
Arkansas Tech UniversityOnline Research Commons @ ATU
Theses and Dissertations from 2018 Student Research and Publications
Spring 5-15-2018
School Culture and Student Achievement: AnExamination of Two High-Achieving, High-Poverty Arkansas SchoolsTammi Hasty DavisArkansas Tech University
Follow this and additional works at: https://orc.library.atu.edu/etds_2018
Part of the Educational Assessment, Evaluation, and Research Commons, and the EducationEconomics Commons
This Dissertation is brought to you for free and open access by the Student Research and Publications at Online Research Commons @ ATU. It hasbeen accepted for inclusion in Theses and Dissertations from 2018 by an authorized administrator of Online Research Commons @ ATU. For moreinformation, please contact [email protected].
Recommended CitationDavis, Tammi Hasty, "School Culture and Student Achievement: An Examination of Two High-Achieving, High-Poverty ArkansasSchools" (2018). Theses and Dissertations from 2018. 2.https://orc.library.atu.edu/etds_2018/2


SCHOOL CULTURE AND STUDENT ACHIEVEMENT: AN EXAMINATION OF
TWO HIGH-ACHIEVING, HIGH-POVERTY ARKANSAS SCHOOLS
A Dissertation Submitted
to the Graduate College
Arkansas Tech University
in partial fulfillment of requirements
for the degree of
DOCTOR OF EDUCATION
in School Leadership
in the Center for Leadership and Learning
of the College of Education
May 2018
Tammi Hasty Davis
Educational Specialist, Arkansas State University, 2016
Master of Teaching, Arkansas Tech University, 2008
Bachelor of Arts, University of Arkansas, 1996

ii
Dissertation Approval
This dissertation, “School Culture and Student Achievement: An Examination of Two
High-Achieving, High-Poverty Arkansas Schools,” by Tammi Hasty Davis, is approved
by:
Dissertation Chair: ____________________________________
Christopher Trombly
Assistant Professor
Center for Leadership and Learning
Dissertation Committee: ____________________________________
Nancy Anderson
Superintendent
Cutter Morning Star School District
____________________________________
Ellen Treadway
Assistant Professor
Center for Leadership and Learning
Program Director: ____________________________________
John Freeman
Professor
Center for Leadership and Learning
Interim Graduate College Dean: ____________________________________
Jeff Robertson
Professor, Department of Physical Sciences
Dean, College of Natural & Health Sciences

iii
Permission
Title: School Culture and Student Achievement: An Examination of Two High-
Achieving, High-Poverty Arkansas Schools
Program: School Leadership
Degree: Doctor of Education
In presenting this dissertation in partial fulfillment for a graduate degree from Arkansas
Tech University, I agree the library of the university shall make it freely available for
inspection. I further agree that permission for extensive copying for scholarly purposes
may be granted by my dissertation chair, or, in that professor’s absence, by the Head of
the Department or the Dean of the Graduate College. To the extent that the usage of the
dissertation is under control of Arkansas Tech University, it is understood that due
recognition shall be given to me and to Arkansas Tech University in any scholarly use
which may be made of any material in my dissertation.
Signature
Date

iv
© 2018 Tammi Hasty Davis

v
Acknowledgements
I would like to begin by expressing my appreciation to the wonderful and
supportive individuals who have been there with me as I have traveled the dissertation
path. To my two beautiful, strong daughters, Lindsay and Cortney, and my husband,
Mark, who all know beyond a shadow of a doubt that I am always looking for the next
challenge. I found it. Thank you for your unwavering support and encouragement
throughout this process. I also want to thank the rest of my family (mom and brother) for
supporting my “never ending” collegiate experiences. This should be the last.
To Dr. Christopher Trombly, my chair, who provided guidance, advice, humor,
and many hours of his life to ensure that I made it to the finish line. I could have never
done this without you, Dr. Trombly. You are amazing! To my committee members, Dr.
Ellen Treadway and Dr. Nancy Anderson, for the feedback, support, insight, and
suggestions along the way. I appreciate everything this team of educational leaders and
experts poured into me and this work. Thank you.
To the Second Doctoral Cohort at Arkansas Tech University: We started this
journey together as strangers. We end it together as friends and trusted colleagues.
Thank you all for the conversations, the disagreements, the hard truths, the laughter, and
the learning. Most of all, thank you for being dedicated educators to the students of our
great state. I am blessed to know each of you.
Last, but never least, to my superintendent (the boss), dissertation partner, and
friend, Clint Jones. Thank you for the constant encouragement and for pushing me every
single day. Thank you for the advice, the patience, and the faith you have had in me from
day one. I could not have done this without you, Dr. Jones.

vi
Dedication
This dissertation dedication is two-fold. First, I dedicate this dissertation study to
my late father, Lawrence Ray Hasty. Thank you, dad, for telling me I could accomplish
anything and everything, and making sure I believed it. Thank you for saying, “I am
proud of you,” and “You can do it.” Your late night calls would often end with, “There is
nothing you can’t do.” Thank you for the encouragement, the strength you gave me, and
for your never-ending positive voice. Your words have carried me through life.
I also dedicate this work to every student I have had the honor of teaching,
knowing, and serving as an educator. To all of you who have ever doubted your ability
to achieve great things, and to all students, who deserve to be welcomed each day into a
healthy and positive school environment that empowers you to become successful in spite
of circumstances you cannot change, this study was for you. As long as I have breath, I
will continue to fight for your education.

vii
Abstract
This study was developed to produce qualitative data about the cultures of two high-
poverty, high-achieving elementary schools in Arkansas. The research was intended to
contribute to the existing information regarding professional collaboration, collegiality,
and self-determination/efficacy as related to student assessment data. The focus of this
study was provided by a single research question: What features characterize the cultures
of low socio-economic schools in Arkansas that enjoy high student achievement? The
assessment data was collected and analyzed by reviewing the ACT Aspire scores of third,
fourth, and fifth grade students as reported on the My School Info website. This
information is drawn from the Arkansas Department of Education. The population of this
study was comprised of licensed personnel employed at the two chosen schools in
Arkansas. Based on the research findings, it was determined that both schools share
similar cultural trends that have led to increased student achievement among high-
poverty student populations.

viii
Table of Contents
Page
ABSTRACT ...................................................................................................................... vii
LIST OF FIGURES ........................................................................................................... xi
CHAPTER I: INTRODUCTION .........................................................................................1
Problem Statement ...................................................................................................2
Significance..............................................................................................................3
Research Question ...................................................................................................4
Assumptions .............................................................................................................4
Limitations ...............................................................................................................5
Definition of Terms..................................................................................................6
Summary ..................................................................................................................8
CHAPTER II: LITERATURE REVIEW ............................................................................9
Introduction ..............................................................................................................9
School Culture .........................................................................................................9
Measuring School Culture .....................................................................................14
CHAPTER III: METHODOLOGY ...................................................................................17
Research Question .................................................................................................17
Population ..............................................................................................................17
Research Design.....................................................................................................18
Instrumentation ......................................................................................................19
Data Collection ......................................................................................................20
Data Analysis .........................................................................................................23

ix
Summary ................................................................................................................23
CHAPTER IV: ANALYSIS OF DATA ............................................................................25
Participants .............................................................................................................25
Data Collection ......................................................................................................26
Study Results .........................................................................................................27
Beard Elementary School ..........................................................................27
Jackson Elementary School .......................................................................31
School Culture Comparison Results ......................................................................33
Open Response Data Themes ................................................................................37
Summary ................................................................................................................37
CHAPTER V: CONCLUSIONS .......................................................................................38
Summary of Findings .............................................................................................38
Interpretation of Findings ......................................................................................41
Recommendations ..................................................................................................42
Limitations .............................................................................................................43
Suggestions for Future Research ............................................................................44
Conclusion ..............................................................................................................44
REFERENCES ..................................................................................................................46
APPENDICES ...................................................................................................................49
Appendix A. Letter to Participating Schools ........................................................49
Appendix B. School Culture Triage Survey & Open-ended Questions................51
Appendix C. Research Approval Letter ................................................................55
Appendix D. School Culture Triage Survey Permission ......................................56

x
Appendix E. School Culture Data Tally Sheet .....................................................57
Appendix F. School Culture Scoring Information ................................................58
Appendix G. School Culture Survey Scoring Example ........................................59
Appendix H. My School Info (Website Screenshot) ............................................60
Appendix I. Performance Level Descriptor Example (3rd Grade Reading) .........61

xi
List of Figures
Figure 1. Beard Elementary and Jackson Elementary Poverty Rates ..............................20
Figure 2. Beard Elementary School Assessment Data 2016-2017 ...................................21
Figure 3. Jackson Elementary School Assessment Data 2016-2017 ................................22
Figure 4. Beard Elementary and Jackson Elementary School Culture Themes ...............33

1
Chapter I: Introduction
It has long been apparent that school culture is something employees, students,
parents, and communities experience in school buildings; however, it is the precise
impact of culture that has remained a topic of study among scholars. Schools have
stories, symbols, values, mission statements, and ways of doing things that identify them.
These items create the culture of the building. Often, the terms “school climate” and
“school culture” are used interchangeably, but there is a difference between the two.
Climate is how people feel each day and can be easily changed. Culture is rooted deep in
the environment and involves the beliefs that make up the persona of the school. Culture
is “the way we do things around here” and climate is “the way we feel around here”
(Gruenert & Whitaker, 2015).
Culture develops over time. Student and employee success stories serve as
inspiration for others and positively reinforce the kinds of accomplishments the
organization would like all students and staff to strive toward (Deal & Kennedy, 1999).
Symbols are powerful indicators of culture. They include objects, artwork, and events
within the school. Deal and Peterson (1999) identify several symbolic artifacts in high-
achieving schools: (a) mission statement; (b) student work; (c) banners to help convey
values; (d) display of past achievements through trophies or student accomplishment
awards; (e) historical collections, such as yearbooks; (f) school mascot to represent spirit,
teamwork, and community. Deal and Peterson (1999) explain that symbols reinforce
culture by signaling what is important in schools, providing a message of purpose,
signaling what is valued, and establishing pride.

2
Schools and districts are realizing the importance of culture more and more. The
new Every Student Succeeds Act (ESSA) was passed into law in December of 2015 and
has shifted policymakers’ attention from test scores exclusively to also measuring social-
emotional learning and school culture. The Every Student Succeeds Act (ESSA)
reauthorized the Elementary and Secondary Education Act of 1965. Under ESSA, states
are offered the flexibility to establish indicators of student success that may include
school culture. Since 2009, more studies have validated the importance of school culture
in student performance; most notably is the work of John Hattie and his Visible Learning
research in 2012 (Muhammad, 2017). For years, we did not consider how the varied and
diverse human elements from stakeholders students, parents, and educators impacted
our schools, but now we do (Muhammad, 2017).
Dr. Ivy Pfeffer, Deputy State Education Commissioner of Arkansas, stated the
following in personal correspondence:
Arkansas’ new ESSA state plan moves away from singular measure of
accountability to a multiple-measured approach for determining quality schools.
The plan is also centered on a theory that recognizes how adult actions impact
students’ achievement and growth, and is guided by a cycle of inquiry, focused on
continuous improvement (personal communication, August 29, 2017).
Problem Statement
Every school has a culture. It may be collaborative and healthy, or it may be
toxic; but it does exist. A school develops its unique personality over time. The culture
dictates the way things are done and the way people are “supposed” to act (Gruenert,
2005). School leaders should be concerned about school culture if increased achievement

3
is the goal. If they are not concerned about this topic, they may not be able to lead
effectively, as research indicates that school culture directly impacts student learning
(Whitaker, 2017). The purpose of this study is to examine the cultures of two high-
poverty, high-achieving schools in Arkansas and to determine if the cultures within them
are creating environments for students to succeed.
The specific focus of this study is to determine what trends, if any, exist between
the cultures of two selected schools with high student achievement as measured by the
percentage of students scoring at least proficient on state assessments. The two schools
are similar in demographics, both having at least a 90% poverty rate. Although the
required state assessment has changed three times in the recent past, the current
assessment, the ACT Aspire, is being used as the source of student data for this study.
This exam is given to students in grades three through ten each year in the areas of
literacy, math, and science. District leaders need research studies, such as this one, to
inform them so that they may understand and enrich school culture and, as a result,
increase achievement for all students.
Significance
Educational leaders must acknowledge the impact school culture has on student
learning if student success is the goal. Researchers conclude that a relationship exists
between school culture and student achievement, as well as how students behave and feel
about school, themselves, and others. How students react to school increases their
chances of developing a lasting commitment to learning (Arter, 1989). This study is
beneficial to any educator wishing to assess and improve school culture. It also provides
school districts information they can use to analyze student data and examine it in light of

4
the culture in their buildings. Moreover, findings from this study will enable higher
education programs to include the importance of school culture in teacher and
administrator preparation programs. That this study identifies specific cultural themes
within schools that serve students from low socio-economic backgrounds, but which
nevertheless have high student achievement, is of particular significance in states such as
Arkansas, which have many districts and schools that serve large populations of students
from low socio-economic backgrounds. Typically, students living in poverty score lower
on standardized assessments than their wealthier peers; however, this is not always the
case. “The relationship between poverty and education shows in the students' levels of
cognitive readiness. The physical and social-emotional factors of living in poverty have a
detrimental effect on students' cognitive performance” (Flannery, 2016). Students who
live in poverty come to school every day without the proper tools for success. As a
result, they are commonly behind their classmates physically, socially, emotionally or
cognitively ( (LSU Online, 2010). This study is significant because it encompasses the
idea that students living in poverty can and sometimes do succeed in spite of their
circumstances.
Research Question
The research question that guided this qualitative study was: What features
characterize the cultures of low socio-economic schools in Arkansas that enjoy high
student achievement?
Assumptions
The specific assumptions of this study are that the participants responded honestly
to the survey questions and provided accurate data regarding the cultures of their schools.
5
Likewise, it is assumed that the survey instrument that was used was appropriate in
gathering the kind and amount of information needed to measure schools’ cultures.
The School Culture Triage Survey was the instrument that was employed to
assess the cultures of the two schools in this study. The development of the survey began
in 1996, when the instrument contained 122 items. Over time, the survey creators,
Phillips and Wagner (2009), pared the survey down based on feedback from elementary,
middle, and high school teachers. The researchers identified trends in the data and
ultimately three paths became apparent. Those three school culture markers are used in
today’s version of the survey. For the present study, the School Culture Triage Survey
was slightly modified to include five additional open-response questions to enrich the
qualitative data.
Limitations
This study was limited to responses from teachers in two high poverty, high-
achieving elementary schools in the state of Arkansas during the 2016-2017 school year.
Responses were obtained via an online survey instrument that educators and stakeholders
accessed and completed electronically. Although safeguards were in place, participants
could have potentially completed the survey more than once. In addition, while personal
follow-up interviews were not conducted, such conversations could have added depth to
this study. Additionally, personal discussions with individual outliers, if they had been
willing to come forward, would further have enriched this study. A clear understanding
of the negative comments recorded on the survey and the issues that led to those
particular feelings were not analyzed in this study but would have added great value.
Nevertheless, the responses to open-ended questions do add to the value of this study, in
6
spite of the identified limitations. The implications of this study, however limited in
scope, are important to the ongoing research on school culture.
Definition of Terms
The following terms are included to clarify information in this study:
Accountability: Arkansas has an accountability system for school districts that
includes multiple measures. Accountability concerns the obligation of comprehensive
school improvement planning, reporting, explaining, or justifying standards, making
these components responsible, explicable and answerable (Arkansas Department of
Education, n.d.).
ACT Aspire: The state assessment used in Arkansas by which student data is
collected, analyzed, and publicly reported. Schools are measured by the data indicated on
ACT Aspire assessments. This assessment was adopted by Arkansas to measure student
achievement. Arkansas law requires that all public school students shall participate in a
statewide program of educational assessments per Ark. Code Ann. §§ 6-15-419, 6-15-
433, 6-15-2009 (Arkansas Department of Education, n.d.).
Collaboration: Working together to for a common education purpose such as
aligning curriculum, analyzing student data, or establishing school goals (Dufour,
Dufour, & Eaker, 2008).
Efficacy: The belief teachers hold about the influence they have over how all
students learn. Teachers’ confidence in their ability to promote students’ learning (Hoy,
Smith, & Sweetland, 2003).
English Language Learner (ELL): A national-origin-minority student who is
limited-English-proficient (Arkansas Department of Education, n.d.).
7
ESSA: Every Student Succeeds Act. This act was passed into law in December of
2015 and allows states the flexibility to determine measureable accountability indicators.
The accountability indicators may include school climate, assessment scores, and school
safety (Arkansas Department of Education, n.d.).
Professional Learning Community (PLC): A PLC is a group of educators that
gather often to analyze student work and data. During this time, teachers identify
strengths and weaknesses in data and in teaching strategies. Collaboration and student
focused discussions are an integral part of an effective PLC (Dufour et al., 2008).
Proficiency: The percentage of students scoring a level 3 or above on the ACT
Aspire (Arkansas Department of Education, n.d.).
School Culture: The beliefs, behaviors, and attitudes that determine how
individuals treat others and feel included and appreciated. Culture refers to the traditions,
rituals, ceremonies, and feelings individuals have about one another and the environment
in which they work. Culture is basically the “way we do things around here” (Barth,
2002).
Socio-Economic Status (SES): Socioeconomic status (SES) encompasses not just
income but also educational attainment, financial security, and subjective perceptions of
social status and social class (American Psychological Association, 2017).
Standards: Standards refers to the Arkansas State Standards. Standards are
learning targets for students at each grade level and content area (Arkansas Department
of Education, n.d.).
Student Achievement: Arkansas has four levels of measurement in terms of the
ACT Aspire: Needs Support (1), Close (2), Ready (3), and Exceeding (4). These

8
indicators are used to determine individual proficiency and growth as well as to
determine grade level and special population data (Arkansas Department of Education,
n.d.).
Summary
A school’s culture must value students above all else in order for educational
initiatives to be successful and for student-centered learning and decision making to
occur (Muhammad, 2017). A first step in creating a desirable culture is to identify the
current cultural status and have honest conversations regarding strengths and weaknesses.
Schools that want to produce a healthy learning environment must first and foremost be
clear about their collective purpose (Muhammad, 2017). A school’s culture touches on
the emotional longing in human beings to be part of something bigger than themselves
and enables them to perform work for the greater good (Lassiter, 2012). A positive
environment may be the driving force that propels students to achieve and educators to be
passionate in their work. Educators must understand the depth of their work and school
leaders need to believe the following in order to create circumstances for a successful
learning environment:
If people are involved in meaningful work, and if they feel capable, and if they
are helped to make even small progress, they become more motivated and ready
for the next challenges. Effective organizations foster conditions for these
positive progress loops to prevail. (Fullan, 2013, p. 22)

9
Chapter II: Literature Review
Introduction
Every school has a culture that develops over time. It may be a collaborative,
affirming culture, or it may be a toxic, dispiriting one; but one certainly exists. The
optimal setting toward which school faculties should aspire is the collaborative culture
(Gruenert & Whitaker, 2015). School culture is not a function of such demographics as
race or socio-economic status, or of geographical features (Phillips & Wagner, 2009).
The culture dictates the way things are done and the way people are supposed to act
(Gruenert, 2005). School leaders should be concerned about school culture if increased
achievement is the goal. If they are not concerned about this topic, they typically will not
be able to lead effectively, as research indicates that school culture directly impacts
student learning (Whitaker, 2017. The purpose of this study is to examine what features
characterize the cultures of schools in Arkansas that serve large proportions of students
from low socio-economic backgrounds, yet yield high student achievement.
School Culture
Studying organizational behavior has been of interest to educators and the
business world since the 1970s. Being conscious of the symbolic aspect of the school
environment, or the school’s culture, is essential for educators (Wren, 1999). Having a
strong grasp on school culture assists principals in leading their buildings effectively and
improving achievement. Culture is defined as the symbols and stories that communicate
core values, reinforce the mission statement, instill a shared vision, and build a sense of
commitment among staff, students, and parents (Peterson, 2002). As Harvard educator
Roland Barth (2002) once observed, “A school's culture has far more influence on life
10
and learning in the schoolhouse than the state department of education, the
superintendent, the school board, or even the principal can ever have” (p. 47). Barth
(2002) characterized school culture as a “complex pattern of norms, attitudes, beliefs,
behaviors, values, ceremonies, traditions, and myths that are deeply ingrained in the very
core of the organization” (p. 7).
Wagner and Masden-Copas (2002) described culture as the brace for a bridge,
linking previous to future achievement. According to their work, in order for
improvement changes to occur, the braces must be firm and strong. Schools must
identify their existing cultures and work to optimize them before attempting to implement
systemic changes that could increase student achievement. Mission is at the heart of
school culture. Shared missions and goals motivate leaders to lead, teachers to teach, and
students to learn (Deal & Peterson, 2009).
As culture has an effect on every single aspect of the educational environment, a
school leader must be aware of the norms associated with any given culture he or she is
attempting to lead. Hoy and Miskel (2001) explained that “understanding culture is a
prerequisite to making schools more effective” (p. 220). In a work that has stood the test
of time, Deal and Peterson (1999) enumerated the following characteristics as being
included in schools that contain positive school cultures:
1. An awareness of the school’s history and goals;
2. A mission that focuses on learning for both students and teachers;
3. Values and beliefs that focus on collegiality, performance, and improvement;
4. Rituals and ceremonies that reinforce these values;

11
5. A professional community that utilizes knowledge and research to improve
school practices;
6. Shared leadership that balances stability and progress;
7. Stories that celebrate the success of others; and
8. A mutual sense of respect and caring for all.
Symbolism is an important aspect in schools with positive cultures. Symbols
include artwork, events, mascots, or anything else that conveys meaning or represents
something in the school (Fairholm, 1994). Deal and Peterson (2009) listed specific
artifacts that they had found in successful schools: (a) mission statement; (b) student
work; (c) banners to help convey values; (d) display of past achievements through
trophies or student accomplishment awards; (e) historical items; (f) school mascot to
represent spirit. Deal and Peterson (2009) indicated that those symbols represent the
culture in four ways: signaling what is important, providing a message of deeper purpose,
indicating values, and forged school pride.
Fullan and Hargreaves (1996) described four types of school cultures.
Balkanization was the term given to schools in which teachers are the rulers of their
individual classrooms, and in which each teacher works in isolation. This type of culture
promotes competition among its players. Next on the continuum lay cultures marked by
comfortable collaboration. In such cultures, collaboration is superficial as teachers share
lesson plans and materials, but avoid curricular discussions and long term planning, and
dismiss conversations related to student achievement. The third type of culture described
by Fullan and Hargreaves (1996) was termed collegiality. This environment is based on
explicit policies and procedures through formal structures but does not require

12
collaboration to adhere to expectations. At the optimal end of the spectrum was the
collaborative culture, where career learning occurred. Teachers in this type of
environment seek professional development opportunities, demonstrate confidence in
their professional abilities, welcome student data analysis, encourage team teaching and
open honest discussions where shared decisions are made.
Schools with unhealthy cultures are more likely to produce students who are at-
risk of failing and often have teachers with negative attitudes and perceptions of those
around them, including the building leader. Schools are more successful when members
of the organization work together and are bonded by a set of commonly held beliefs and
values (Peterson, 2002). When a school is viewed as a community, the leader is able to
depend on others to help carry the load of the challenges associated with the
principalship. When there is an “us against them” mentality, in regards to teacher-
administrator relationships, the culture is not going to be a positive one.
A healthy organization with a thriving culture will prosper, and its goals will be
achieved. This is due to an environment that insists on high expectations for all
stakeholders. Hoy et al. (2003) explained the following about effective and positive
cultures:
Teachers like their colleagues, their school, their job, and their students and they
are driven by a quest for academic excellence. They believe in themselves and
their students; set high, but achievable goals. Students work hard and respect
others who do well academically. Principal behavior is also positive; that is,
friendly and supportive. Principals have high expectations for teachers and go out

13
of their way to help teachers. Healthy schools have good relationships with the
community. (p. 39)
The most important variables in school culture, according to Philips and Wagner
(2009), are collegiality and efficacy. “Collegiality is demonstrated through its two main
components, professional collaboration and affiliation. Professional collaboration is the
degree to which staff members work together to solve professional issues, and to
encourage and inspire each other” (Philips & Wagner, 2009, p. 5). The authors went on
to explain that affiliation, in terms of school culture, refers to when the “relationships
between all members of the school community demonstrate harmony, respect, mutual
support and enjoyment of each other’s company” (Philips & Wagner, 2009, p. 5). Both
professional collaboration and affiliation must be present for a healthy school culture to
thrive.
High-poverty schools that demonstrate success have caught the attention of
educational researchers for many years. The term “90/90/90” was originally coined in
1995 based on observations in Milwaukee, Wisconsin, where schools were identified as
having the following characteristics: 90% or more of the students were eligible for free or
reduced lunch, 90% or more of the students were members of ethnic minority groups, and
90% or more of the students met district or state academic standards in reading or another
area (Reeves, 2005). Since that time, the term has been applied to describe successful
academic performance in schools with high-poverty percentages and high minority
demographics. A common set of behaviors was identified in the extensive research of the
90/90/90 schools. These behaviors, or norms, exhibited by teachers and administrators,
established the cultures within those particular schools. The five characteristics were: a

14
focus on academic achievement; clear curriculum choices; frequent and ongoing
assessment and multiple opportunities for improvement; an emphasis on nonfiction
writing; and collaborative scoring of student work (Reeves, 2015). The 90/90/90
research suggests that high-poverty schools can deliver high student achievement if the
environment lends itself to the idea that all students, regardless of circumstances beyond
their control, can learn and succeed.
Measuring School Culture
Among the several tools that have emerged for measuring school culture is one
devised by Phillips and Wagner (2009) titled the “School Culture Triage Survey”
(SCTS). Those authors define school culture as “how people treat each other, and how
they work together in both a personal and professional sense” (Phillips & Wagner, 2009,
p. xi). This particular instrument originated in 1996 as a 122-item questionnaire. The
researchers were attempting to find a way to determine the health or toxicity of a school’s
culture. The first draft of the SCTS was based on the work of Barth (C. Wagner, personal
communication, September 2017). Edgar Shine’s organizational culture theory centering
on teams was analyzed along with the work of such cultural researchers as Michael
Fullan and Thomas Sergiovanni. Rick Dufour’s work with professional communities was
also reviewed during the development of the instrument (C. Wagner, personal
communication, September 2017). Almost every author/researcher whose work was
studied by the instrument’s creators identified professional collaboration,
affiliation/collegiality, and self-determination/efficacy in their work (C. Wagner, personal
communication, September 2017). From reviewing the literature, Phillips and Wagner
(2009), based the SCTS items on those three common cultural themes. The initial 122-
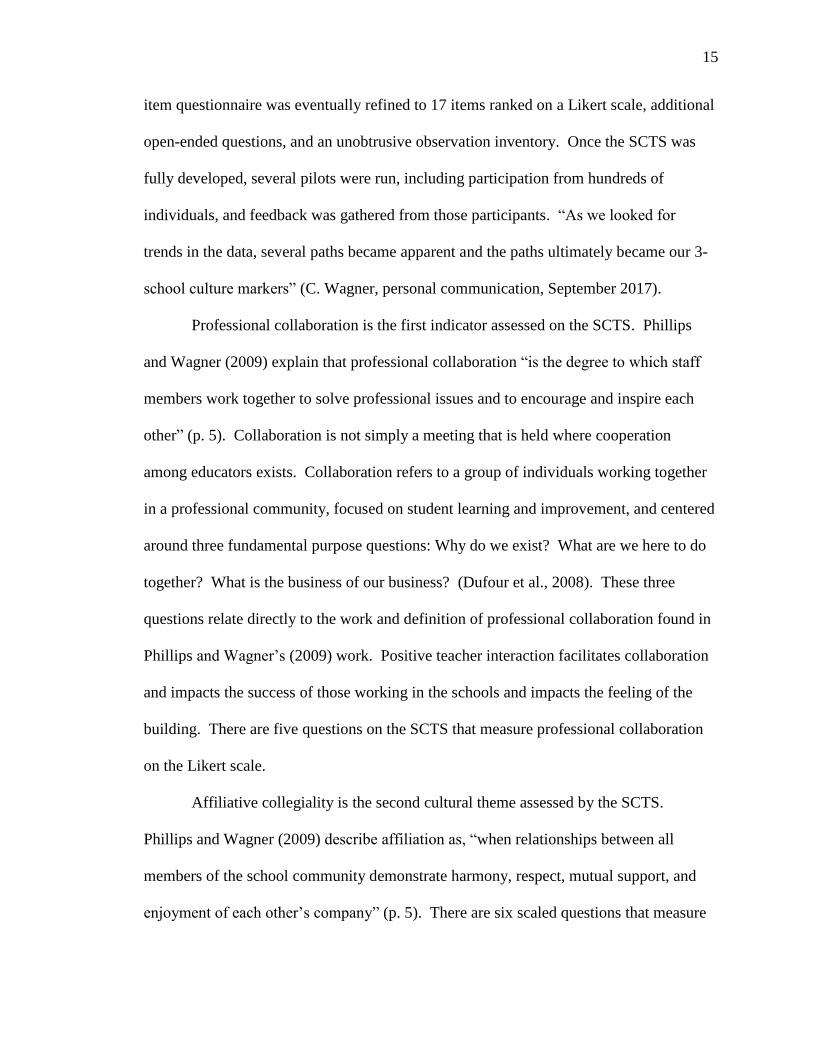
15
item questionnaire was eventually refined to 17 items ranked on a Likert scale, additional
open-ended questions, and an unobtrusive observation inventory. Once the SCTS was
fully developed, several pilots were run, including participation from hundreds of
individuals, and feedback was gathered from those participants. “As we looked for
trends in the data, several paths became apparent and the paths ultimately became our 3-
school culture markers” (C. Wagner, personal communication, September 2017).
Professional collaboration is the first indicator assessed on the SCTS. Phillips
and Wagner (2009) explain that professional collaboration “is the degree to which staff
members work together to solve professional issues and to encourage and inspire each
other” (p. 5). Collaboration is not simply a meeting that is held where cooperation
among educators exists. Collaboration refers to a group of individuals working together
in a professional community, focused on student learning and improvement, and centered
around three fundamental purpose questions: Why do we exist? What are we here to do
together? What is the business of our business? (Dufour et al., 2008). These three
questions relate directly to the work and definition of professional collaboration found in
Phillips and Wagner’s (2009) work. Positive teacher interaction facilitates collaboration
and impacts the success of those working in the schools and impacts the feeling of the
building. There are five questions on the SCTS that measure professional collaboration
on the Likert scale.
Affiliative collegiality is the second cultural theme assessed by the SCTS.
Phillips and Wagner (2009) describe affiliation as, “when relationships between all
members of the school community demonstrate harmony, respect, mutual support, and
enjoyment of each other’s company” (p. 5). There are six scaled questions that measure

16
this indicator of culture on the SCTS ranging from “school celebrations” to support of
new ideas by members of the learning community. “People in any healthy organization
must have agreement on how to do things and what is worth doing. Open and honest
communication, as well as an abundance of humor, ensures that collegiality is strong”
(Phillips & Wagner, 2009, pg. 5). Other well-known educator authorities explain
collegiality similarly. Dufour et al. (2008), for example, describe collegiality as the
collective responsibility that colleagues take for their work.
The third theme of the culture survey is a measurement of self-
determination/efficacy. The idea of self-determination and self-efficacy is important
when analyzing culture, because it deals with the way people problem solve and how
empowered they feel as decision makers within the school. “Efficacy or self-
determination is demonstrated when staff members work to improve their skills as true
professionals, not because they see themselves as helpless members of a large, uncaring
bureaucracy” (Phillips & Wagner, 2009, p. 7). Educators need to have a high sense of
efficacy because it can lead to gains in the classroom, teachers’ confidence, and the
ability to promote students’ learning (Protheroe, 2008). These individuals own their
learning and are committed to the community at large, take responsibility for their work,
and choose to stay. “People in this school are here because they want to be” (Phillips &
Wagner, 2009, p. 7). Efficacy determines the decision making power that staff members
believe they have within a building.

17
Chapter III: Methodology
The specific purpose of this study was to identify the characteristics of the
cultures of two selected Arkansas elementary schools whose student achievement,
notwithstanding the low socioeconomic status of nearly all of its students, has been high,
as measured by the percentage of students scoring proficient or above on the ACT Aspire
state assessment. District leaders need research studies, such as this one, to enable them
to select the most appropriate leaders to enrich school culture and to subsequently
increase achievement for all students. The results of this study, combined with the extant
research on the importance of school culture, provide valuable tools to researchers
interested in how culture impacts student learning. In addition, the results may be used to
improve university level teacher and leadership preparation programs.
Research Question
This study addresses the following research question: What features characterize
the cultures of low socio-economic schools in Arkansas that enjoy high student
achievement?
Population
The population who participated in the present study were faculty members and
administrators of two public elementary schools in Arkansas that have been specifically
selected because, while they predominantly serve students with low socioeconomic
status, their rates of student achievement have been high. For privacy purposes, the
elementary schools are referred to throughout as Beard Elementary and Jackson
Elementary.

18
Research Design
This study is qualitative in nature. The qualitative paradigm is appropriate for this
work because the researcher was seeking trends in data through the constant comparative
method. Data was collected using a 17-item school culture related questionnaire, the
School Culture Triage Survey, created by Phillips and Wagner (2009), which employed a
Likert scale. Permissions were granted by the authors to use the instrument (see
Appendix D). The development of the survey began in the late 1990s, when the
instrument contained 122 items. Over time, Phillips and Wagner (2009), reduced the
number of items based on feedback from elementary, middle, and high school teachers.
The researchers identified trends in the data and ultimately three paths became apparent.
Those three school culture markers are used in the current 17-item version of the survey.
This researcher created additional open response questions with comment boxes in order
to allow participants to include more information and add depth to the survey. According
to Creswell (2008), survey research has value because it allows the generalization of
findings from a representative sample population to the general target population. The
goal for this qualitative research was to determine variations within a topic of interest in a
given population (Jansen, 2010). For the purposes of this study, the subject of interest is
school culture and how it relates to student achievement. The survey instrument was
designed to assess the current culture of schools as perceived by the teachers and
administrators involved in them. The instrument was delivered via an online tool to
individuals of the selected schools. The questionnaire was also available in paper format;
however, there were no requests for the physical form.
19
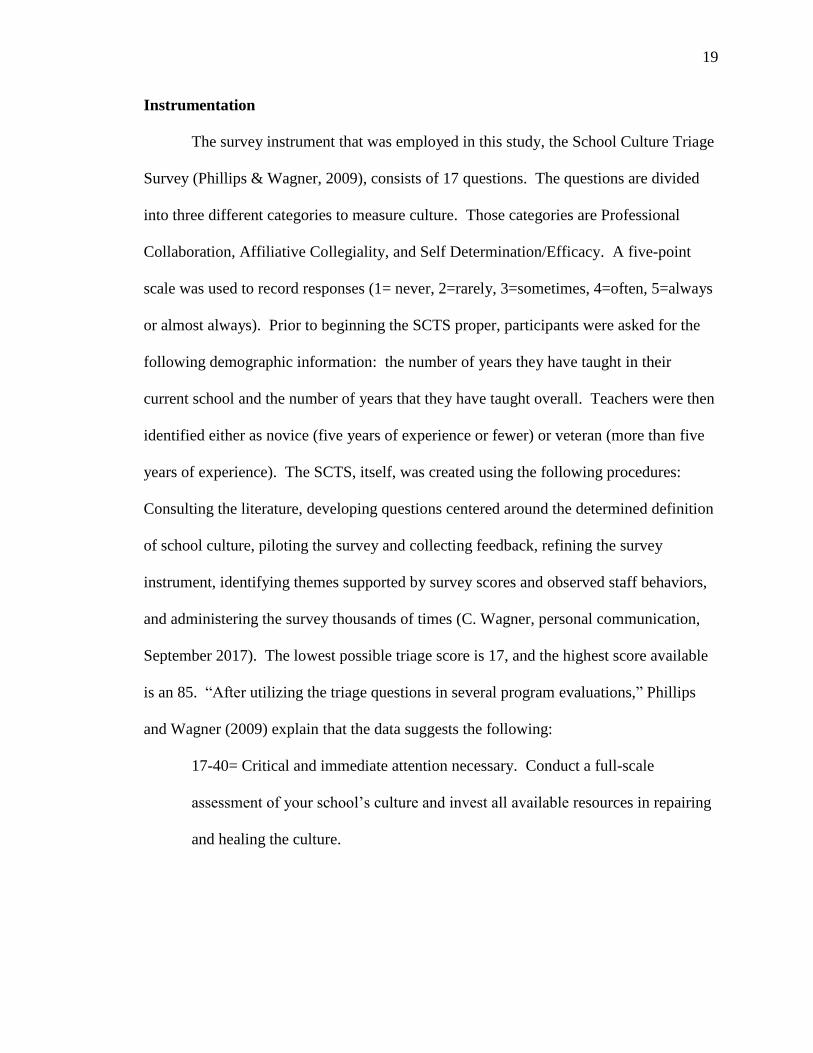
Instrumentation
The survey instrument that was employed in this study, the School Culture Triage
Survey (Phillips & Wagner, 2009), consists of 17 questions. The questions are divided
into three different categories to measure culture. Those categories are Professional
Collaboration, Affiliative Collegiality, and Self Determination/Efficacy. A five-point
scale was used to record responses (1= never, 2=rarely, 3=sometimes, 4=often, 5=always
or almost always). Prior to beginning the SCTS proper, participants were asked for the
following demographic information: the number of years they have taught in their
current school and the number of years that they have taught overall. Teachers were then
identified either as novice (five years of experience or fewer) or veteran (more than five
years of experience). The SCTS, itself, was created using the following procedures:
Consulting the literature, developing questions centered around the determined definition
of school culture, piloting the survey and collecting feedback, refining the survey
instrument, identifying themes supported by survey scores and observed staff behaviors,
and administering the survey thousands of times (C. Wagner, personal communication,
September 2017). The lowest possible triage score is 17, and the highest score available
is an 85. “After utilizing the triage questions in several program evaluations,” Phillips
and Wagner (2009) explain that the data suggests the following:
17-40= Critical and immediate attention necessary. Conduct a full-scale
assessment of your school’s culture and invest all available resources in repairing
and healing the culture.

20
41-59= Modifications and improvements are necessary. Begin with a more
intense assessment of your school’s culture to determine which area is in most
need of improvement.
60-75= Monitor and maintain making positive adjustments.
76-85= Amazing! A score of 75 was the highest ever recorded (p. 127).
Data Collection
The information gathered from the online instrument is reported in the pages that
follow using descriptive statistics, percentile ranks, and means scores for each variable.
All questionnaires were collected and separated by school, using a numerical code for
clear identification of each building.
School information and selection were determined by accessing the My School
Info website provided by the Arkansas Department of Education. First, schools serving
high populations of low socio-economic students were analyzed.
Figure 1. Beard Elementary and Jackson Elementary poverty rates.
Of those schools, the researcher sought two whose student achievement scores
were nevertheless good. Data for the 2016-2017 ACT Aspire state assessment were
97.78 97.78
10
30
50
70
90
Beard Elementary Jackson Elementary

21
reviewed for the highest performing elementary schools. As all of this information was
archived and publicly made available, no special permissions were required. The study
schools were selected based on proficiency scores and at least a 90% low socio-economic
status. The percentage of students scoring a 3 (proficient) in the areas of literacy and
math for grades three, four, and five were used in the analysis of the data. Additional
information pertaining to the elementary schools was also pulled directly from this
service which is managed by the Arkansas Division of Research and Technology. The
first school selected for this study, which will be referred to as Beard Elementary, has a
student population of 451 and a 98% low-income rate. Beard Elementary School is
within a district of approximately 14,000 students. The demographics of the area include
an average income of $32,000 with 15% of the residents living at or below the poverty
level. Ten languages are spoken in this community, and less than 20% of the population
holds a bachelor’s degree.
Proficiency rates for the 2016-2017 school year for Beard were as follows:
Figure 2. Beard Elementary School assessment data 2016-2017.
36.0729.41
52.5446.77
38.37
55.93
0
10
20
30
40
50
60
3rd 4th 5thLiteracy Math

22
The second school selected for this study will be referred to as Jackson
Elementary School. Jackson has a student population of 566 and also has a low-income
rate of 98%. Jackson Elementary shares somewhat similar statistics to that of Beard.
Jackson lies within a district of over 20,000 students with a city poverty rate of 39%.
Residents are 35% Hispanic and 64% Caucasian. Thirty-six different languages are
spoken in the community, and the average income is approximately $42,000. Only 20%
of the residents of this area hold a bachelor’s degree.
Proficiency rates for Jackson are found in the chart below:
Figure 3. Jackson Elementary School assessment data 2016-2017
While the scores reflected above are clearly not exemplary, the schools described
in this study were specifically chosen because their scores reflected higher achievement
(using this particular assessment) than other schools with similar demographics. As
explained above, both of these two schools have very high rates of student poverty, and
the ACT Aspire is only in its third year of implementation in the state of Arkansas.
29.87 29.41
62.34
45.5740.7
62.34
0
10
20
30
40
50
60
70
3rd 4th 5th
Literacy Math

23
Permission to conduct the research and collect data was obtained by the Institutional
Review Board (IRB) of Arkansas Tech University (Appendix A). Parent permissions
were not necessary due to student data being collected by grade level only. Individual
student assessment data was not collected or reviewed. Participation agreements at all
participating schools were signed by principals and district superintendents, as required.
Participation in the study was entirely voluntary, and no rewards or incentives were
provided.
Data Analysis
Analysis of the Research Question: What features characterize the cultures of low
socio-economic schools in Arkansas that enjoy high achievement?
Overall school data was analyzed for each survey item and mean scores were
obtained, thereby, providing a score for each school. Trends in data were observed and
noted in this analysis. Particular attention was given to the comments participants made
regarding each of the open response questions, and that information was analyzed
accordingly. These narrative comments created greater richness in the data. In the
analysis, references were made to the three categories as suggested by the authors of the
instrument. The researcher used the constant comparative method when reading and
making sense of participants’ narrative responses. This strategy is a process of
comparing newly collected data with data that have already been reviewed and analyzed,
then iteratively revisiting the data in order to derive full meaning from it (Patton, 2015).
Summary
This chapter outlined the methodology and procedures that were used to obtain
information about the overall cultures of two high performing schools in Arkansas that

24
predominantly serve populations with low socioeconomic status. The chapter also
explained that Archived 2016-2017 ACT Aspire assessment scores were used to identify
these schools for inclusion in this study. Qualitative research methods were appropriate
for this study about school culture, because the researcher was seeking to identify trends
as well as variations on a topic that might be applicable to similarly situated schools.

25
Chapter IV: Analysis of Data
This qualitative study was developed to gather information about the relationship
between school culture and student achievement in schools serving populations of
students who hail almost exclusively from families who have low socioeconomic status.
The intention was to add value to the existing knowledge base about collaboration,
collegiality, and self-determination/efficacy as it relates to student success. A single
research question provided the focus for this study; that question was: What features
characterize the cultures of low-SES schools in Arkansas that enjoy high student
achievement?
Demographic data was collected from participating educators in the way of two
questions: How many total years have you been in education? How many years have you
been working in this school? School culture was measured using the School Culture
Triage Survey, which was designed by Phillips and Wagner (2009) of The Center for
Improving School Culture. Student achievement was measured using the percentage of
students in grades three through five scoring at the proficiency level on the literacy and
math portions of the 2016-2017 ACT Aspire assessment. This chapter contains an
outline of the process of data collection for this study.
Participants
The School Culture Triage Survey (Phillips & Wagner, 2009), along with several
supplemental questions, was sent electronically to faculty members in two elementary
schools in Arkansas. The schools were selected based on their high student achievement,
as demonstrated on the 2016-2017 ACT Aspire assessment. All licensed employees were
invited to participate in the online survey, which was delivered via Survey Monkey©.
26
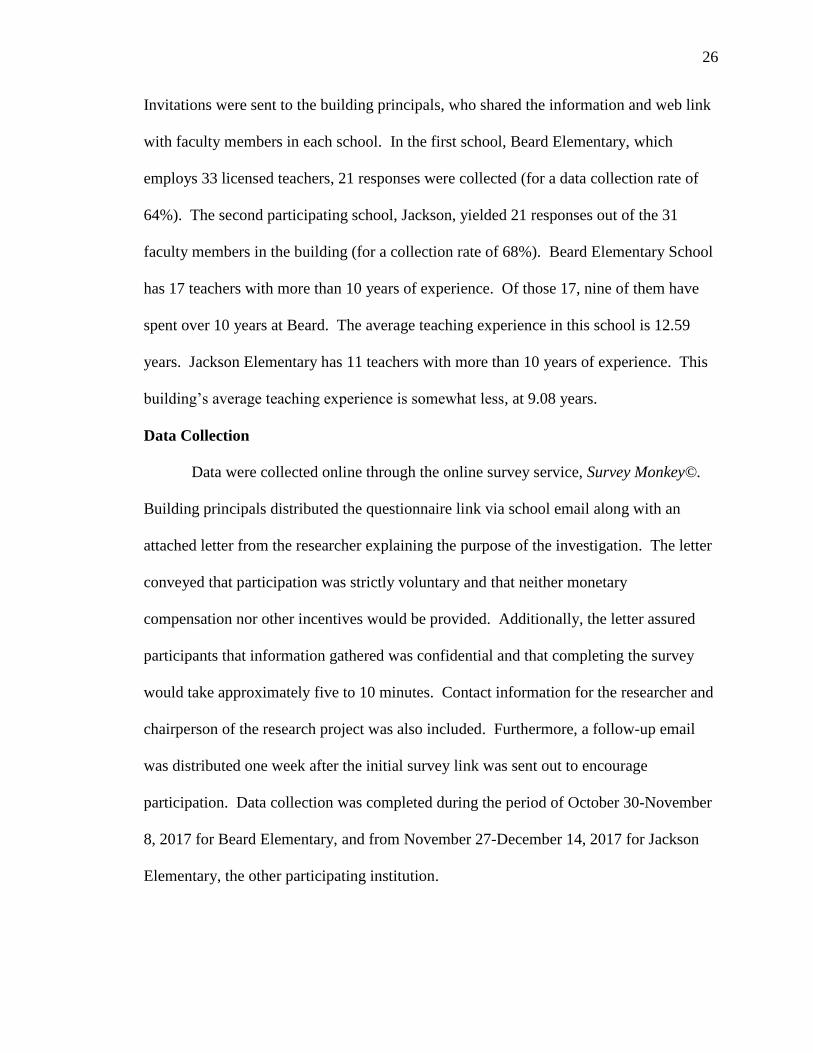
Invitations were sent to the building principals, who shared the information and web link
with faculty members in each school. In the first school, Beard Elementary, which
employs 33 licensed teachers, 21 responses were collected (for a data collection rate of
64%). The second participating school, Jackson, yielded 21 responses out of the 31
faculty members in the building (for a collection rate of 68%). Beard Elementary School
has 17 teachers with more than 10 years of experience. Of those 17, nine of them have
spent over 10 years at Beard. The average teaching experience in this school is 12.59
years. Jackson Elementary has 11 teachers with more than 10 years of experience. This
building’s average teaching experience is somewhat less, at 9.08 years.
Data Collection
Data were collected online through the online survey service, Survey Monkey©.
Building principals distributed the questionnaire link via school email along with an
attached letter from the researcher explaining the purpose of the investigation. The letter
conveyed that participation was strictly voluntary and that neither monetary
compensation nor other incentives would be provided. Additionally, the letter assured
participants that information gathered was confidential and that completing the survey
would take approximately five to 10 minutes. Contact information for the researcher and
chairperson of the research project was also included. Furthermore, a follow-up email
was distributed one week after the initial survey link was sent out to encourage
participation. Data collection was completed during the period of October 30-November
8, 2017 for Beard Elementary, and from November 27-December 14, 2017 for Jackson
Elementary, the other participating institution.

27
Study Results
The sample consisted of 42 total participants between the two schools with 21
teachers responding from each institution. Questions one through five of the survey
instrument focused on Professional Collaboration. The second set of questions centered
on the theme of Affiliative Collegiality. The third and final topic was Self-
Determination/Efficacy.
The authors of the School Culture Triage Survey, Phillips and Wagner (2009),
recommend that a tally form be used to determine average scores for each question. For
this study, the online survey resource Survey Monkey© was used to collect data. Survey
Monkey© features an automatic averaging mechanism that collects the responses and
immediately provides the researcher with mean data. This feature was used in lieu of a
manual tally form.
Beard Elementary School. Beard Elementary had an average score of 19.24 on
Professional Collaboration, a 20.97 on Affiliative Collegiality, and a 23.67 in the focus
area of Efficacy/Self-Determination. Each question had a Likert scale with a range of 1
(low) to 5 (high). The first statement concerning collaboration was “teachers and staff
discuss instructional strategies and curriculum issues.” This statement had the strongest
overall score of 4.48 out of 5 on the Likert scale. The second statement read, “teachers
and staff work together to develop a school schedule.” A score of 4.00 was indicated on
the data. “ Teachers, staff, and community members are involved in the decision making
process at this school,” received a rating of 3.76. Next, “the student behavior code is a
result of collaboration and consensus among teachers, staff, and families,” received the
lowest recorded score on the survey of 2.95. The last collaborative oriented statement

28
was “the planning and organizational time allotted to teachers and staff is used to plan as
collective units/teams, rather than as separate individuals.” This score was a 4.05.
When measuring affiliative collegiality, the data results were as follows:
“Teachers, staff, and community members tell stories of celebrations that support the
school’s values.” This scored an average of 3.90. “ Teachers, staff, and community
member’s visit/talk/meet outside of the school to enjoy each other’s company.” This
statement resulted in an average of 2.95 and was one of the lowest scores recorded. “
Our school reflects a true sense of community,” scored a 3.81 on the scale. “Our school
schedule reflects frequent communication opportunities for teachers, staff, and
community.” This statement rated a 3.43. “Our school supports and appreciates the
sharing of new ideas by stakeholders of our school,” indicated a score of 3.48. “There is
a rich and robust tradition of rituals and celebrations including holidays, special events,
and goal attainment at this school.” This final statement regarding affiliative collegiality
scored an average 3.40.
The next results were collected for the area of efficacy/self-determination.
Results are as follows: “When something is not working in our school, the faculty, staff,
and community work in unison to find solutions.” This first statement scored a 3.62. “
School members are interdependent and value each other here.” This efficacy statement
received a score of 4.24. “ Members of our school community seek alternatives to
problems/issues rather than repeating what we have always done.” This score was a 3.76.
Scoring a 4.29 was statement four, which read, “Members of our school community seek
to define the problem/issue rather than blame others.” “The school staff is empowered to
make instructional decisions rather than waiting on their supervisors to tell them what to

29
do.” A score of 3.48 was recorded for this statement regarding school culture. “ People
work here and send their children to this school because they enjoy it and choose to be
here.” The average for this statement was 3.40.
Supplemental open response questions were offered at the end of the
questionnaire. The questions were: (1) Did we fail to ask a question that you feel is
important in terms of the culture at this school? (2) Is there anything especially positive
that you would like to share about this school? (3) Has anything happened recently that
impacted the way you feel about the school at this time? (For example, changes in
programs/services, a death, a conflict with a teacher or administrator, or any other event
that has led you to feel a particular way at this time?) (4) How do you feel about the
communication between yourself and administration? Is it consistent? Do you feel
informed about the events and activities within the school? (5) If you have a concern,
suggestion, or need information about a topic, do staff members and administration listen
to you? Please cite specifics if applicable.
On open response question number one, a respondent said, “We try to have
positive things to help with morale in the building. We have back to school t-shirts for
the staff, potluck meals, individual notes, and candy jars.” The other twenty participants
answered, “no.” When asked if anything positive was worth sharing about the school,
one individual stated, “[This school] is a true community. This school works hard as a
team to build students up, help families, and encourage each student to work hard so that
they can live the lives they dream.” Another employee explained, “We love our students
and go above and beyond to meet the needs of the whole child.” Yet another said, “There
30
is a lot of family support here.” The remaining participants did not have a positive
statement recorded on the survey.
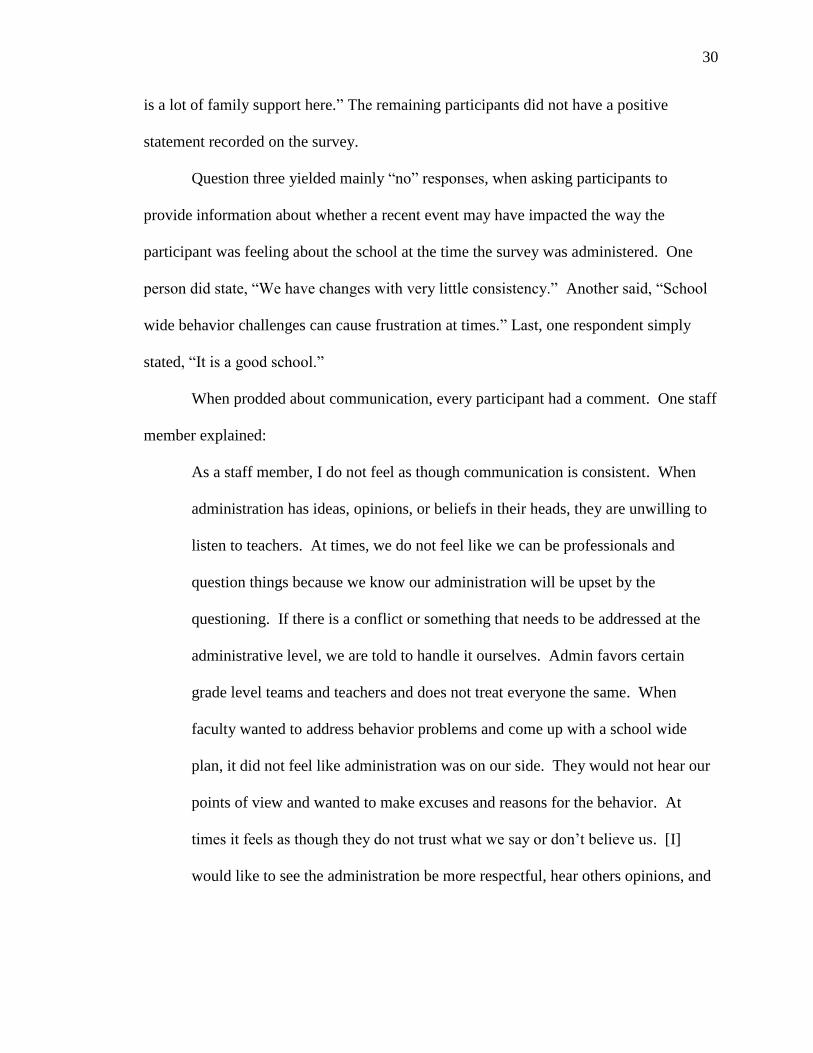
Question three yielded mainly “no” responses, when asking participants to
provide information about whether a recent event may have impacted the way the
participant was feeling about the school at the time the survey was administered. One
person did state, “We have changes with very little consistency.” Another said, “School
wide behavior challenges can cause frustration at times.” Last, one respondent simply
stated, “It is a good school.”
When prodded about communication, every participant had a comment. One staff
member explained:
As a staff member, I do not feel as though communication is consistent. When
administration has ideas, opinions, or beliefs in their heads, they are unwilling to
listen to teachers. At times, we do not feel like we can be professionals and
question things because we know our administration will be upset by the
questioning. If there is a conflict or something that needs to be addressed at the
administrative level, we are told to handle it ourselves. Admin favors certain
grade level teams and teachers and does not treat everyone the same. When
faculty wanted to address behavior problems and come up with a school wide
plan, it did not feel like administration was on our side. They would not hear our
points of view and wanted to make excuses and reasons for the behavior. At
times it feels as though they do not trust what we say or don’t believe us. [I]
would like to see the administration be more respectful, hear others opinions, and

31
treat everyone fairly. We are very informed about events and activities at our
school though.
Another participant echoed the same negative sentiment by stating,
“Communication is poor.” In contrast, other respondents were positive in nature when
commenting about communication within the school. One person wrote, “I feel very
informed and connected to the administration about activities and events in our school.”
Another said, “Communication is consistent and I generally feel informed.” The rest of
the participants conveyed positive feelings about communication by writing such one-
word comments as, “yes,” “good,” or “consistent.”
The final open-ended question regarding whether or not staff members felt as if
they were listened to when voicing a concern yielded mixed results from the educators at
Beard Elementary. Three members said, “yes”; two said, “mostly”; and four indicated
that they did not have any concerns about the school. One person suggested that
administration, “does not listen to us when there is a concern or suggestion. Often times
they suggest we are focusing too much on the problem instead of solutions.” Another
teacher commented about safety issues within the building, explaining, “ideas are
discussed and valued. Safety issues during a recent fire drill were addressed and
remedied immediately.” Other answers to this question were positive in nature.
Jackson Elementary School. Jackson Elementary had average scores of 19.2 on
Professional Collaboration, of 21.95 on Affiliative Collegiality, and of 23.86 in the focus
area of Efficacy/Self-Determination. Data on the cultural theme of Professional
Collaboration were determined by the following statements and subsequent scores: The
first statement concerning collaboration was “teachers and staff discuss instructional

32
strategies and curriculum issues.” This statement had an overall score of 4.29 out of 5 on
the Likert scale. The second statement, “teachers and staff work together to develop a
school schedule,” had a score of 3.48. “Teachers, staff, and community members are
involved in the decision making process at this school,” received an average of 3.29.
Next, “the student behavior code is a result of collaboration and consensus among
teachers, staff, and families,” received a 3.95. The last collaborative oriented statement
was “the planning and organizational time allotted to teachers and staff is used to plan as
collective units/teams, rather than as separate individuals.” This score was a 4.19.
In terms of affiliative collegiality, Jackson Elementary had consistent results with
the exception of one assessment item. When measuring affiliative collegiality, the data
results were as follows: “Teachers, staff, and community members tell stories of
celebrations that support the school’s values.” This scored a total of 3.57. “ Teachers,
staff, and community member’s visit/talk/meet outside of the school to enjoy each other’s
company.” This statement resulted in an average of 2.86, and was the lowest score
recorded for this school on this survey. “ Our school reflects a true sense of community,”
scored a 4.14 on the scale. “Our school schedule reflects frequent communication
opportunities for teachers, staff, and community.” This statement rated a 3.67. “Our
school supports and appreciates the sharing of new ideas by stakeholders of our school,”
yielded a score of 3.95. “There is a rich and robust tradition of rituals and celebrations
including holidays, special events, and goal attainment at this school.” This final
statement regarding affiliation scored an average 3.76.
Finally, responses were collected for the area of efficacy/self-determination.
Participants from Jackson Elementary had the following scores: “When something is not

33
working in our school, the faculty, staff, and community work in unison to find
solutions.” This first statement scored a 3.67. “School members are interdependent and
value each other here.” This efficacy statement demonstrated a score of 4.10. “Members
of our school community seek alternatives to problems/issues rather than repeating what
we have always done.” This score was a 4.30. Scoring a 4.19 was statement four, which
read, “Members of our school community seek to define the problem/issue rather than
blame others.” The statement, “The school staff is empowered to make instructional
decisions rather than waiting on their supervisors to tell them what to do,” averaged a
score of 3.9. “People work here and send their children to this school because they enjoy
it and choose to be here” had an average score of 3.7.
School Culture Comparison Results
Figure 4 depicts the data from both schools for comparison purposes.
Figure 4. Beard Elementary and Jackson Elementary School culture themes.
Professional
Collaboration
Affiliative
Collegiality
Efficacy/Self-
Determination
Beard 19.24 20.97 23.67
Jackson 19.2 21.95 23.86
19.2420.97
23.67
19.2
21.9523.86
0
5
10
15
20
25
30
Beard Jackson
34
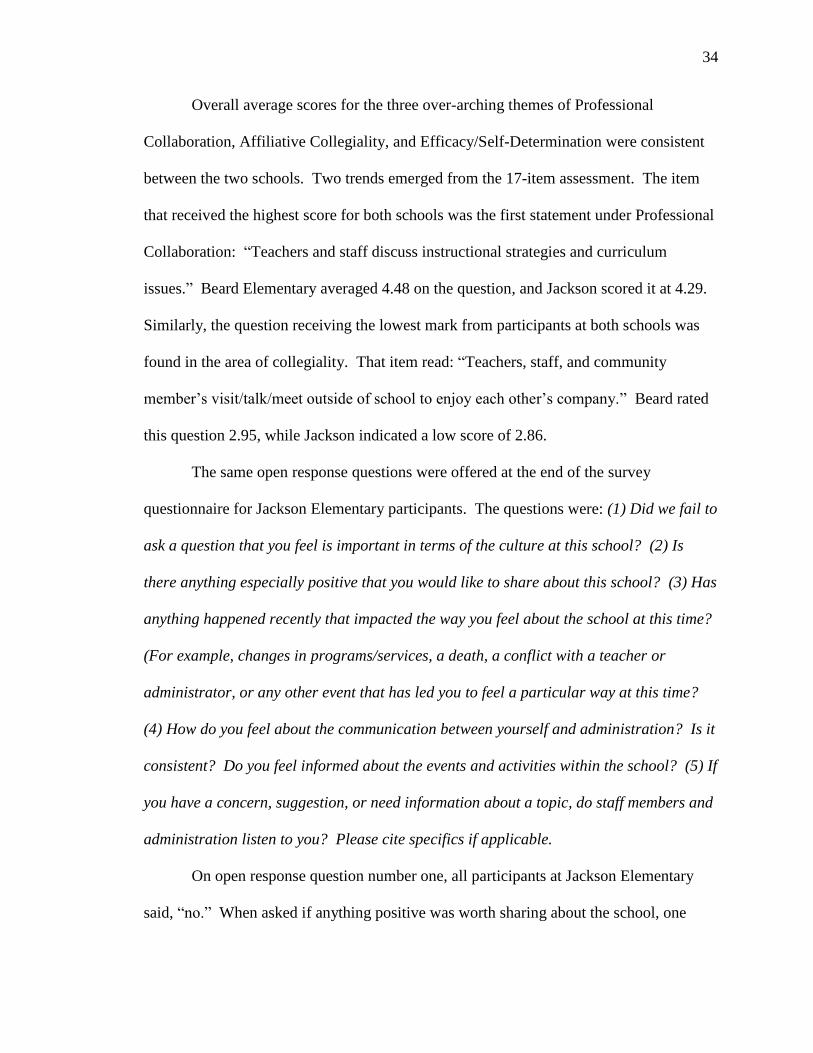
Overall average scores for the three over-arching themes of Professional
Collaboration, Affiliative Collegiality, and Efficacy/Self-Determination were consistent
between the two schools. Two trends emerged from the 17-item assessment. The item
that received the highest score for both schools was the first statement under Professional
Collaboration: “Teachers and staff discuss instructional strategies and curriculum
issues.” Beard Elementary averaged 4.48 on the question, and Jackson scored it at 4.29.
Similarly, the question receiving the lowest mark from participants at both schools was
found in the area of collegiality. That item read: “Teachers, staff, and community
member’s visit/talk/meet outside of school to enjoy each other’s company.” Beard rated
this question 2.95, while Jackson indicated a low score of 2.86.
The same open response questions were offered at the end of the survey
questionnaire for Jackson Elementary participants. The questions were: (1) Did we fail to
ask a question that you feel is important in terms of the culture at this school? (2) Is
there anything especially positive that you would like to share about this school? (3) Has
anything happened recently that impacted the way you feel about the school at this time?
(For example, changes in programs/services, a death, a conflict with a teacher or
administrator, or any other event that has led you to feel a particular way at this time?
(4) How do you feel about the communication between yourself and administration? Is it
consistent? Do you feel informed about the events and activities within the school? (5) If
you have a concern, suggestion, or need information about a topic, do staff members and
administration listen to you? Please cite specifics if applicable.
On open response question number one, all participants at Jackson Elementary
said, “no.” When asked if anything positive was worth sharing about the school, one

35
individual stated, “The needs of the kids come before anything else. My three kids each
come to this school with me and I’m comfortable knowing the staff will do their best to
ensure their success.” Another employee explained, “Our school is extremely
collaborative. We are heavily into the PLC (professional learning communities) process
and adhere to those components for collaboration, instruction, and assessments. Also, we
have recently developed a new mission and vision for our school.” The remaining
participants did not have additional statements recorded on the survey.
Question three yielded mainly answers of “no” from participants, who had been
asked to provide information about whether a recent event may have impacted the way
they were feeling about the school at the time the survey was administered. One person
did state, “We are currently in the PLC pilot. This is changing how we do a lot of things
around here! We have always had a good culture, but we are improving upon it every
day.” Another participant shared, “We are currently receiving on-site training to become
more effective at professional learning communities. As part of the guiding coalition, I
feel that I’ve been able to have a voice in our progression.”
When asked about communication, every participant had a comment. One
employee described school communication as follows:
Outstanding efforts are made by staff to communicate with parents,
coordinate events with community members and mentors, and staff have
open lines of communication with one another and school administrators.
Morning announcements are made to students, teacher/classroom
newsletters to parents, and weekly email newsletters to staff from the

36
principal are some excellent ways our school excels and helps our
students thrive.
Another participant echoed the same positive sentiment by stating:
Communication was part of my professional growth plan. I regularly have
students write grade reflections on the back of newsletters (English and
Spanish) that are sent home to parents each week. Occasionally, parents
write notes on the grade reflections. Any significant behavior issues are
resolved by the student calling the parent and self-reporting. This is the
first year I’ve had zero discipline referrals!
One person wrote, “There is rarely any communication between administration and
myself.” Another said, “For the most part.” The remaining comments were positive and
indicated “excellent” or “yes” in terms of whether there is healthy communication within
the school.
The final open-ended question regarding whether or not staff members feel as if
they are listened to when voicing a concern yielded mixed results. Only seven
participants answered this question. One said “none” to indicate no concerns, and one
wrote “N/A.” Furthermore, two respondents simply replied, “no,” while another tWO
answered only, “yes.” One individual had more to say about this particular item and
responded in the following manner:
Yes they listen and they respond as they feel appropriate. Example: I needed to
be able to collaborate with another math and science teacher during my planning
period, but I had [no] one else in my grade level. We (teachers and

37
administration) changed planning periods one day of the week to allow for
vertical alignment between 5th and 6th grade on the same subjects.
Open Response Data Themes
Participants’ answers to five open-response items were analyzed and common
themes were identified. The areas in which participants had the most to say in terms of
written responses centered on behavior and communication. All staff members submitted
a response on question five regarding communication within and outside of the schools.
Most answers were positive; however, a few were negative and the term “frustrated” was
used to describe some participants’ feelings about communication. Student behavior was
also identified as an area that needed to be addressed.
Summary
This chapter included ann analysis of the qualitative data obtained from the
respondent schools on the School Culture Triage Survey (modified with five additional
open-response items), which was administered between October and December of 2017.
Likewise, assessment data from the ACT Aspire for third through fifth graders in literacy
and math for the 2016-2017 reporting year for two high achieving, high-poverty
elementary schools were presented. Data results for each participating school have been
reported by individual questions and by overarching themes. Results for the three
cultural themes were displayed in Figure 4 for clarity.
A summary and discussion of these findings are presented in Chapter V.
Conclusions drawn from this research are presented, along with recommendations to be
drawn upon by educators of all levels for ongoing improvement and future research.

38
Chapter V: Conclusions
This qualitative study was conducted to answer the following research question
concerning school culture: What features characterize the cultures of low-socioeconomic
schools in Arkansas that enjoy high student achievement? The study used survey
research methods. A link to an electronic survey was emailed to the principals at two
selected high-poverty, yet high achieving, elementary schools in Arkansas. The
principals, in turn, sent the survey to all licensed employees in each school. The survey
included a 17-item questionnaire and five open response items. Demographic data
gathered on participants was limited to two questions regarding how many years each
respondent has been in education and how many of those years have been spent in the
current school. The survey contained a Likert scale to determine participants’
perceptions of school culture in three areas: Professional Collaboration, Affiliative
Collegiality, and Efficacy/Self-Determination. In addition, five open-response items
were administered to give participants an opportunity to provide more information about
school culture. There were 42 participants in this study with each school having 21
respondents. The overall response rate was 65%. Beard Elementary had a response rate
of 64% (21/33) and Jackson Elementary had a response rate of 68% (21/31).
Summary of Findings
In terms of education, culture sometimes goes unnoticed and unexamined. School
leaders and teachers need to understand the role school culture plays in achievement,
implementation of new initiatives, and in the overall environment students come to learn
in each day. The purpose of this study was to determine what school culture trends, if
any, exist at two Arkansas elementary schools with similar high-poverty rates and

39
comparably high student achievement. This qualitative study examined the schools’
cultures using the School Culture Triage Survey (Phillips & Wagner, 2009) and five
additional open-response items. Assessment data from the 2016-2017 school year was
accessed via My School Info, a website maintained by the Arkansas Department of
Education Data Center. The researcher analyzed data for elementary schools in Arkansas
by filtering through information regarding socio-economic percentages (poverty rates)
and cross referencing that data with high achievement scores. Both schools selected for
this study had poverty rates of 98% for the 2016-2017 school year. High achievement is
defined as students scoring a 3 or above as established by the Arkansas Department of
Education. Students scoring at least a 3 are deemed “Ready” or on grade level.
The researcher completed all analyses of the collected data. The survey data was
compiled via Survey Monkey©, and sorted according to respondents’ schools.
Responses for the 17-item questionnaire were translated into numerical scores using a
five-point Likert scale: 1=Never; 2=rarely; 3=Sometimes; 4=Often; and 5= Always.
Overall averages were automatically calculated online by totaling the respondents’ scores
for each item and dividing by the number of participants. This resulted in a mean score
for each school.
Beard Elementary had an average score of 19.24 on Professional Collaboration, a
20.97 on Affiliative Collegiality, and a 23.67 in the focus area of Efficacy/Self-
Determination. Jackson Elementary had an average score of 19.2 on Professional
Collaboration, a 21.95 on Affiliative Collegiality, and a 23.86 in the focus area of
Efficacy/Self-Determination. Overall average scores for the three over-arching themes of
Professional Collaboration, Affiliative Collegiality, and Efficacy/Self-Determination

40
were consistent between the two schools. Two trends emerged from the 17-item
assessment. The item that received the highest score for both schools was the first one
under Professional Collaboration: “Teachers and staff discuss instructional strategies and
curriculum issues.” Beard Elementary averaged 4.48 on the item, and Jackson scored it
at 4.29.
Teacher collaboration within professional learning communities (PLC) is a
current hot topic in the state of Arkansas. The Arkansas Department of Education is
stressing the importance of student-focused, data-driven, learning communities in all
schools, and funds are being allocated at the state level to ensure appropriate professional
development for teachers and administrators. The results from this study serve to affirm
the wisdom behind Arkansas’ renewed emphasis on ensuring that each school’s faculty
become an authentic professional learning community.
The question receiving the lowest mark from participants at both schools was
found in the area of collegiality. The item read: “Teachers, staff, and community
member’s visit/talk/meet outside of school to enjoy each other’s company.” Beard rated
this question 2.95, while Jackson scored it at 2.86. This score indicates the relative lack
of importance, and the minimal impact, that friendliness between teachers beyond the
school day has on professional practice, student achievement, and school culture, within
the two buildings. This finding emphasizes that principals’ efforts are better spent on
fostering professional community among their faculties, than on seeking to cultivate
conviviality between them.
Participants’ answers to five open-response items were analyzed and trends were
identified. The two areas about which participants had the most to say in the form of

41
written responses centered on behavior and communication. All staff members submitted
a response on question five regarding communication within and outside of the schools.
This was the only question that every participant answered. Most answers were positive;
however, a few were negative and the term “frustrated” was used to describe some
participants’ feelings about communication. Student behavior was also indicated as an
area of concern that needed to be addressed.
The findings from this study will be shared with faculty members from university
teacher education and leadership programs in order to help strengthen the abilities of
those individuals to have a positive impact on education. In addition, the results will be
shared with school leaders in Arkansas as requested and with the Arkansas Department of
Education to provide feedback for state leaders to use to understand current educational
needs within our schools. The information could also be used as a guide for academically
struggling schools that have challenging high-poverty percentages; the data from this
investigation could assist those schools as they create strategic improvement plans to
address low achievement issues.
Interpretation of Findings
The conclusions drawn from this study, based on the data collected from the
school culture survey instrument and assessment data, strongly suggest that student
achievement was related to the degree that a positive school culture was found in the
building. The two schools in this study had similar results on the school culture
assessment, with participants indicating that collaboration, discussions centering on
student data and instructional practices, and teaming were strong in their schools. Both
schools’ highest scores were in the category of efficacy/self-determination. This data

42
indicates that faculty members understand the importance of being solutions-oriented and
that they value others’ opinions. Likewise, efficacy scores indicate that both school
communities feel empowered to make instructional decisions, which points to a high
level of trust within each building. Scores were similar in the areas of feeling supported,
celebrating special events, and being involved in the decision making process. The only
weak area noted on the survey was the affiliative collegiality question, which asked if
teachers and staff visit/talk/meet outside of school. Both schools had the lowest average
on this particular question. The data on this question indicates that enjoying one
another’s company outside of the school walls is either of no importance to the
participating faculty members, or has no impact on achievement and culture. While
professional relationships within collaborative school communities are valuable,
according to the data, friendly interactions outside of the workplace do not appear to
impact school culture.
Recommendations
It is recommended that both undergraduate and graduate educator preparation
programs include the importance of school culture and how to build cultures of
collaboration, collegiality, and efficacy within each school. Teacher and educational
leadership preparation programs emphasize management, instructional methodologies,
and evaluation; however, few of them design coursework specifically related to school
culture. Emphasis should be placed on professional learning communities, teaming, and
true collaboration. Emerging school leaders should learn that meaningful activities
should be planned for faculty members to celebrate and promote positive developments,
and interactions during professional learning communities should be collaborative. In

43
turn, teachers’ senses of efficacy would be closely related to the degree to which they feel
valued and trusted to be involved in the decision making process. In schools where high
degrees of collaboration and efficacy exist, teachers would be more likely to work
together for the improvement of all students. It is recommended that more attention be
given to the monitoring of school culture and positive culture building strategies in order
for student achievement to increase during these times of uncertain funding and in a
political climate that is not always friendly toward public education. Fortunately,
Arkansas’ recently approved plan for meeting its obligations under the Every Student
Succeeds Act promises to do precisely this (I. Pfeffer, personal communication, August
29, 2017).
Universities should revisit educational preparation programs to ensure that proper
emphasis is given to school culture. Participants in this study clearly indicate that
professional collaboration, affiliative collegiality, and efficacy matter. They plainly state
in their open responses that feeling valued, respected, and trusted is important. They also
explain how professional learning communities have changed the way they work and
interact with other educators in a more positive manner. Collaborative planning time,
establishing a true sense of community, and reflection is also important in schools with
positive cultures.
Limitations
The population of this study was very small; therefore, the results are quite
limited in nature. Only 64% of faculty members participated at Beard Elementary, and
68% at Jackson, and those results stem from already small pools of employees.
Assessment data was limited to one school year only. Additional assessment data could

44
have made the study stronger by including historical data to determine if there were
trends of success in each school. Another way to improve results on a study such as this
one would be to conduct face to face interviews with teachers, parents, and community
members. This would add depth and richness to the qualitative study and provide a
closer look into the feelings and attitudes of participants as those things relate to school
culture.
Suggestions for Future Research
Additional research is still needed to gain better understanding of school culture
and how it impacts student achievement. For example, this study could be repeated using
a population of middle and high schools and a larger population of teachers and
administrators. In addition, further study could include historical assessment data along
with further demographic data. A comparison between the selected schools and other
elementary schools within the same district would provide more data for this study.
There are a variety of surveys available that could potentially be used to measure school
culture in future research. Conducting this same study in three years would be a strong
indicator of student achievement as more consistent assessment data would by then be
available to school culture researchers. Repeating this study with the addition of ACT
Aspire Science scores would also add value to future studies.
Conclusion
This qualitative study contributes important information to the research already
available concerning school culture and the impact it has on student achievement. The
results of this study suggest that a correlation exists between a school’s having a positive
collaborative culture and its students earning high achievement – even, importantly, when

45
that school serves mainly students from families with low socioeconomic status. Most
professional development opportunities and educator preparation programs fail to
recognize the importance a school’s culture can have on teaching and learning.
Therefore, curriculum adjustments should be made to include the study and relevance of
culture in all academic programs that are preparing new teachers to enter the field, or for
those seeking school leadership licensure. If the goal is increased student achievement
and student-focused education, it is imperative that the Arkansas Department of
Education, local schools and districts, professional organizations, and all higher
educational institutions realize – and act upon – the fact that culture drives achievement.

46
References
American Psychological Association. (2017, November). Education and socioeconomic
status. Retrieved from www.apa.org/pi/ses/resources/publications/education.aspx
Arkansas Department of Education. (n.d.). Topics. Retrieved from
www.arkansased.gov/topics#A
Arter, J.A. (1989). Assessing school and classroom climate: A consumer’s guide.
Portland, OR: Northwest Regional Educational Laboratory.
Barth, R.S. (2002). The culture builder. Educational Leadership, 59(8), 6-11.
Creswell, J. (2008). Educational research: Planning, conducting, and evaluation
quantitative and qualitative research. New Jersey: Pearson.
Deal, T.E., & Kennedy, A.A. (1999). The new corporate cultures: Revitalizing the
workplace after downsizing, mergers, and reengineering. New York, NY: Basic
Books.
Deal, T.E., & Peterson, K. (2009). Shaping school culture: Pitfalls, paradoxes, and
promises (2nd ed.). San Francisco, CA: Jossey-Bass.
Dufour, R., Dufour, R., & Eaker, R. (2008). Revisiting professional learning communities
at work: New insights for improving schools. Bloomington, IN: Solution Tree
Press.
Fairholm, G. (1994). Leadership and the culture of trust. Westport, CT: Praeger.
Flannery, M. E. (2016, September 29). Impact of poverty on students: All in their minds?
Retrieved from the National Education Association website: www.neatoday.org
Fullan, M. (2013). Stratosphere: Integrating technology, pedagogy, and change
knowledge. Toronto, ON: Pearson.

47
Fullan, M., & Hargreaves, A. (1996). What’s worth fighting for in your school? New
York, NY: Teachers College Press.
Gruenert, S. (2005). Correlations of collaborative school culture and student
achievement. NASSP Bulletin, 89(645), 43-55.
Gruenert, S., & Whitaker, T. (2015). School culture rewired. Alexandria, VA: ASCD.
Hoy, W. K., & Miskel, C. (2001). Educational administration: Theory, research, and
practice (6th ed.). Boston, MA: McGraw-Hill.
Hoy, W. K., Smith, P. A., & Sweetland, S. R. (2003, December). The
development of the organizational climate index for high schools: Its measures
and relationship to faculty trust. High School Journal, 86(2), 38-50.
Jansen, H. (2010). The logic of qualitative survey research and its position in the field of
social research methods. Forum: Qualtiative Social Research, 11(2).
Lassiter, C. J. (2012). The secrets and simple truths of high performing school cultures.
Greenwood Village, CO: Lead and Learn Press.
Muhammad, A. (2017). Transforming school culture (2nd ed.). Bloomington, IN: Solution
Tree Press.
Peterson, K. (2002). Positive or negative? Journal of Staff Development, 23(3), 10-15.
Phillips, G., & Wagner, C. (2009). School culture assessment: A manual for assessing
and transforming school classroom culture. Vancouver, BC: Eduserv, British
Columbia School of Trustee Publishing.
Protheroe, N. (2008). Teacher efficacy: What is it and does it matter? Principal, 87(5),
42-45.
Reeves, D. (2005). Accountability in action. Englewood, CO: Advanced Learning Press.

48
Reeves, D. (2015). High performance in high-poverty schools: 90/90/90 and beyond.
Denver, CO: Center for Performance Assessment.
Wagner, C. & Masden-Copas, P. (2002, Summer). An audit of the culture starts with two
handy tools. Journal of Staff Development, 23(3), 42-53.
Whitaker, S.G. (2017). School culture recharged: Strategies to energize your staff and
culture. Alexandria, VA: ASCD.
Wren, D. (1999). School culture: Exploring the hidden curriculum. Adolescence, 34(135),
593-96.
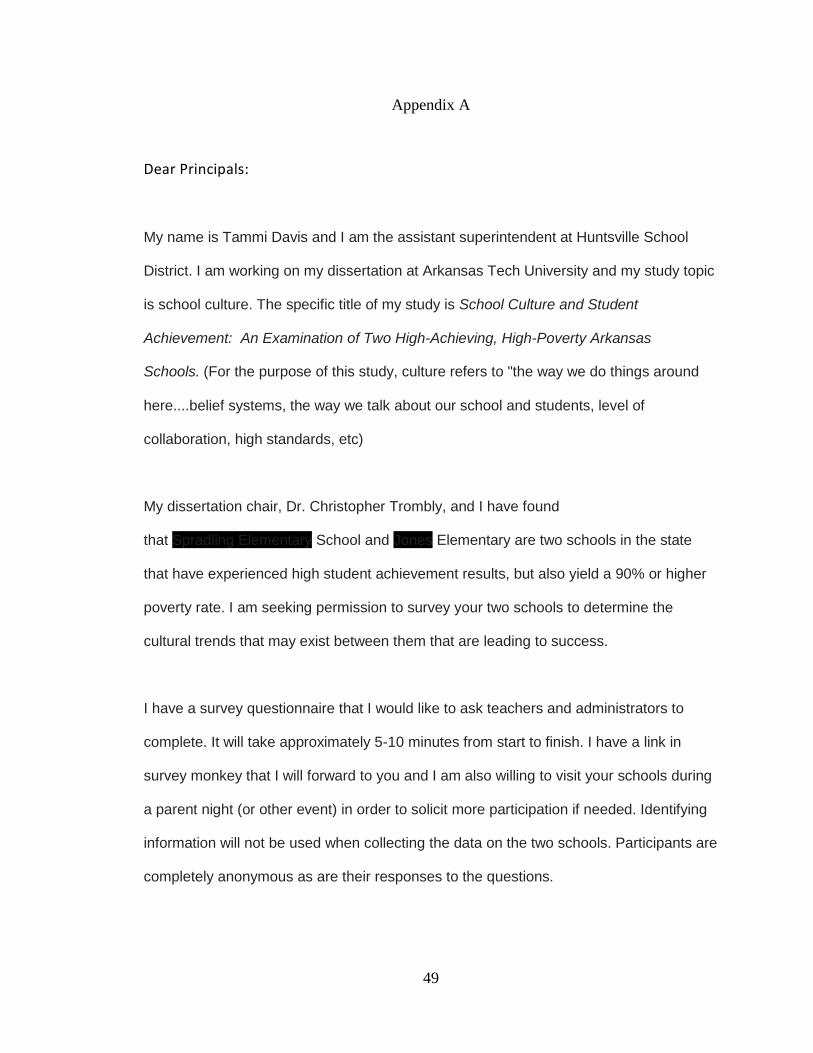
49
Appendix A
Dear Principals:
My name is Tammi Davis and I am the assistant superintendent at Huntsville School
District. I am working on my dissertation at Arkansas Tech University and my study topic
is school culture. The specific title of my study is School Culture and Student
Achievement: An Examination of Two High-Achieving, High-Poverty Arkansas
Schools. (For the purpose of this study, culture refers to "the way we do things around
here....belief systems, the way we talk about our school and students, level of
collaboration, high standards, etc)
My dissertation chair, Dr. Christopher Trombly, and I have found
that Spradling Elementary School and Jones Elementary are two schools in the state
that have experienced high student achievement results, but also yield a 90% or higher
poverty rate. I am seeking permission to survey your two schools to determine the
cultural trends that may exist between them that are leading to success.
I have a survey questionnaire that I would like to ask teachers and administrators to
complete. It will take approximately 5-10 minutes from start to finish. I have a link in
survey monkey that I will forward to you and I am also willing to visit your schools during
a parent night (or other event) in order to solicit more participation if needed. Identifying
information will not be used when collecting the data on the two schools. Participants are
completely anonymous as are their responses to the questions.

50
Please let me know if your schools are willing to participate in this research study. Thank
you for your time and consideration. I am looking forward to hearing back from each of
you.
Sincerely,
Tammi H Davis
4797387661
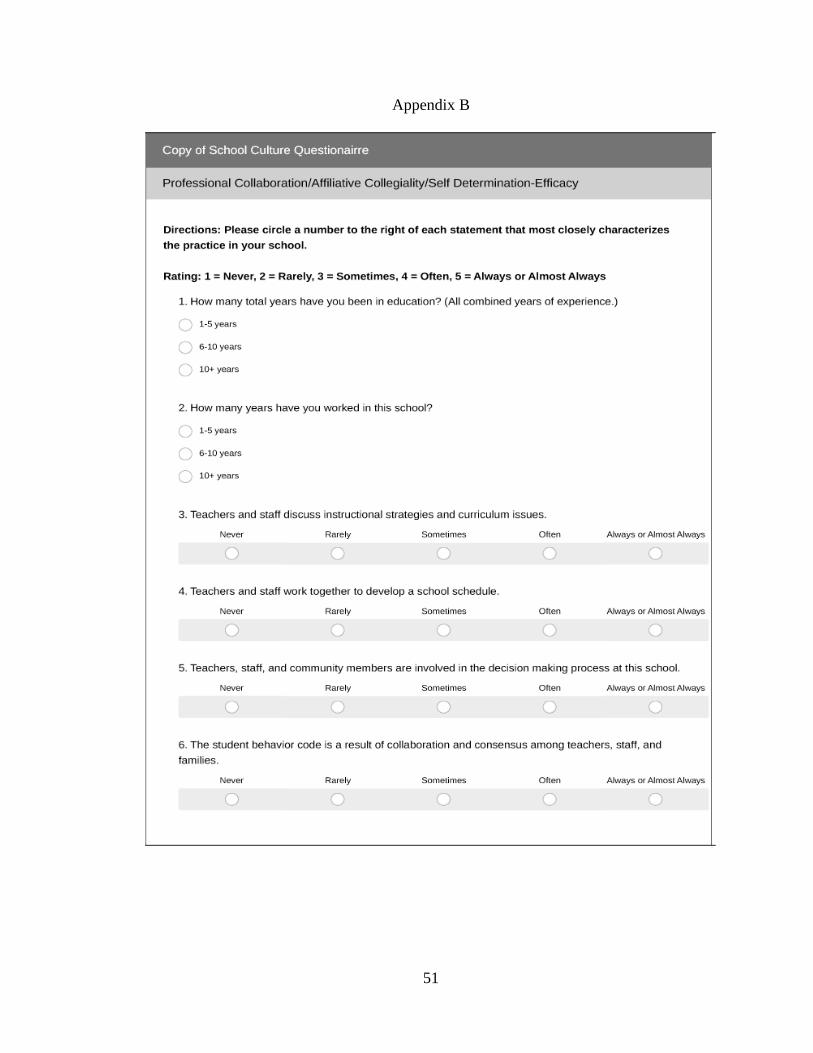
51
Appendix B

52

53
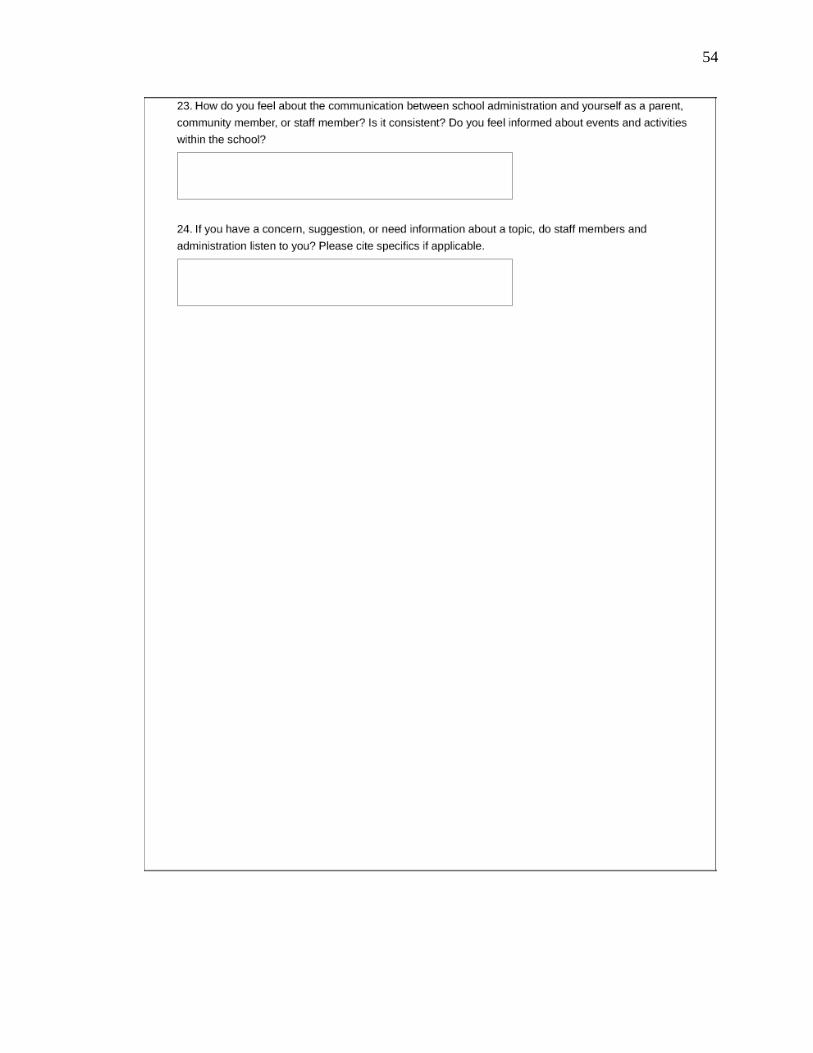
54

55
Appendix C

56
Appendix D

57
Appendix E
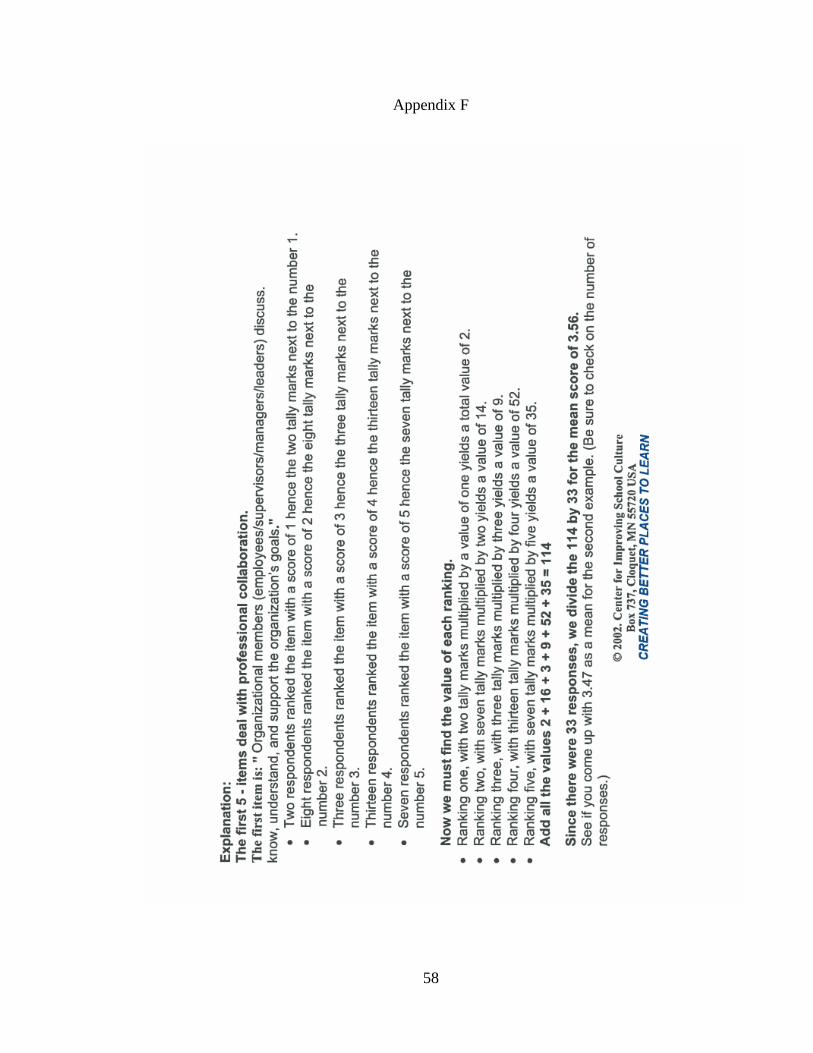
58
Appendix F

59
Appendix G

60
Appendix H

61
Appendix I


