
SAR TEST REPORT
Applicant ZTE Corporation
FCC ID SRQ-DL2XL
Product LTE/WCDMA/GSM(GPRS)
Multi-Mode Digital Mobile Phone
Model ZTE BLADE A602、ZTE Blade A602、
BLADE A602、Blade A602、DL2 XL、
Digicel DL2 XL、DIGICEL DL2 XL
Report No. RXA1710-0342SAR
Issue Date October 28, 2017
TA Technology (Shanghai) Co., Ltd. tested the above equipment in accordance with the requirements in IEEE
1528- 2013, ANSI/ IEEE C95.1-1992. The test results show that the equipment tested is capable of
demonstrating compliance with the requirements as documented in this report.
Performed by: Jiangpeng Lan
Approved by: Kai Xu
TA Technology (Shanghai) Co., Ltd. No.145, Jintang Rd, Tangzhen Industry Park, Pudong Shanghai, China
TEL: +86-021-50791141/2/3
FAX: +86-021-50791141/2/3-8000

FCC SAR Test Report Report No: RXA1710-0342SAR
TA Technology (Shanghai) Co., Ltd. TA-MB-04-003S Page 2 of 147 This report shall not be reproduced except in full, without the written approval of TA Technology (Shanghai) Co., Ltd.
Table of Contents
1 Test Laboratory ............................................................................................................................... 4
1.1 Notes of the Test Report ......................................................................................................... 4
1.2 Test facility .............................................................................................................................. 4
1.3 Testing Location ...................................................................................................................... 5
1.4 Laboratory Environment .......................................................................................................... 5
2 Statement of Compliance ............................................................................................................... 6
3 Description of Equipment under Test .............................................................................................. 7
4 Test Specification, Methods and Procedures ............................................................................... 10
5 Operational Conditions during Test ............................................................................................... 11
5.1 Test Positions ......................................................................................................................... 11
5.1.1 Against Phantom Head ············································································· 11
5.1.2 Body Worn Configuration ··········································································· 11
5.1.3 Phablet SAR test considerations ································································· 12
5.2 Measurement Variability ........................................................................................................ 13
5.3 Test Configuration ................................................................................................................. 13
5.3.1 GSM Test Configuration ············································································ 13
5.3.2 3G Test Configuration ··············································································· 14
5.3.2.1 WCDMA Test Configuration ······································································· 14
5.3.3 LTE Test Configuration ·············································································· 18
5.3.4 Wi-Fi Test Configuration ············································································ 20
6 SAR Measurements System Configuration .................................................................................. 22
6.1 SAR Measurement Set-up .................................................................................................... 22
6.2 DASY5 E-field Probe System ................................................................................................ 23
6.3 SAR Measurement Procedure .............................................................................................. 24
7 Main Test Equipment .................................................................................................................... 26
8 Tissue Dielectric Parameter Measurements & System Verification .............................................. 27
8.1 Tissue Verification ................................................................................................................. 27
8.2 System Performance Check .................................................................................................. 29
9 Normal and Maximum Output Power ........................................................................................... 32
9.1 GSM Mode ............................................................................................................................ 32
9.2 WCDMA Mode ...................................................................................................................... 34
9.3 LTE Mode .............................................................................................................................. 35
9.4 WLAN Mode .......................................................................................................................... 42
9.5 Bluetooth Mode ..................................................................................................................... 43
10 Measured and Reported (Scaled) SAR Results ........................................................................... 44
10.1 EUT Antenna Locations ........................................................................................................ 44
10.2 Standalone SAR test exclusion considerations ..................................................................... 45
10.3 Measured SAR Results ......................................................................................................... 46
10.4 Simultaneous Transmission Analysis .................................................................................... 56
11 Measurement Uncertainty ............................................................................................................ 59
ANNEX A: Test Layout ......................................................................................................................... 60

FCC SAR Test Report Report No: RXA1710-0342SAR
TA Technology (Shanghai) Co., Ltd. TA-MB-04-003S Page 3 of 147 This report shall not be reproduced except in full, without the written approval of TA Technology (Shanghai) Co., Ltd.
ANNEX B: System Check Results ....................................................................................................... 65
ANNEX C: Highest Graph Results....................................................................................................... 73
ANNEX D: Probe Calibration Certificate .............................................................................................. 95
ANNEX E: D750V3 Dipole Calibration Certificate.............................................................................. 106
ANNEX F: D835V2 Dipole Calibration Certificate ............................................................................... 114
ANNEX G: D1900V2 Dipole Calibration Certificate ........................................................................... 122
ANNEX H: D2450V2 Dipole Calibration Certificate ........................................................................... 130
ANNEX I: DAE4 Calibration Certificate .............................................................................................. 138
ANNEX J: The EUT Appearances and Test Configuration ................................................................. 141

FCC SAR Test Report Report No: RXA1710-0342SAR
TA Technology (Shanghai) Co., Ltd. TA-MB-04-003S Page 4 of 147 This report shall not be reproduced except in full, without the written approval of TA Technology (Shanghai) Co., Ltd.
1 Test Laboratory
1.1 Notes of the Test Report
This report shall not be reproduced in full or partial, without the written approval of TA technology
(shanghai) co., Ltd.The results documented in this report apply only to the tested sample, under the
conditions and modes of operation as described herein .Measurement Uncertainties were not taken
into account and are published for informational purposes only. This report is written to support
regulatory compliance of the applicable standards stated above. This report must not be used by the
client to claim product certification, approval, or endorsement by any government agencies.
1.2 Test facility
CNAS (accreditation number: L2264)
TA Technology (Shanghai) Co., Ltd. has obtained the accreditation of China National Accreditation
Service for Conformity Assessment (CNAS).
FCC (Designation number: CN1179, Test Firm Registration Number: 446626)
TA Technology (Shanghai) Co., Ltd. has been listed on the US Federal Communications Commission
list of test facilities recognized to perform electromagnetic emissions measurements.
IC (recognition number is 8510A)
TA Technology (Shanghai) Co., Ltd. has been listed by industry Canada to perform electromagnetic
emission measurement.
VCCI (recognition number is C-4595, T-2154, R-4113, G-10766)
TA Technology (Shanghai) Co., Ltd. has been listed by industry Japan to perform electromagnetic
emission measurement.
A2LA (Certificate Number: 3857.01)
TA Technology (Shanghai) Co., Ltd. has been listed by American Association for Laboratory
Accreditation to perform electromagnetic emission measurement.
FCC SAR Test Report Report No: RXA1710-0342SAR
TA Technology (Shanghai) Co., Ltd. TA-MB-04-003S Page 5 of 147 This report shall not be reproduced except in full, without the written approval of TA Technology (Shanghai) Co., Ltd.
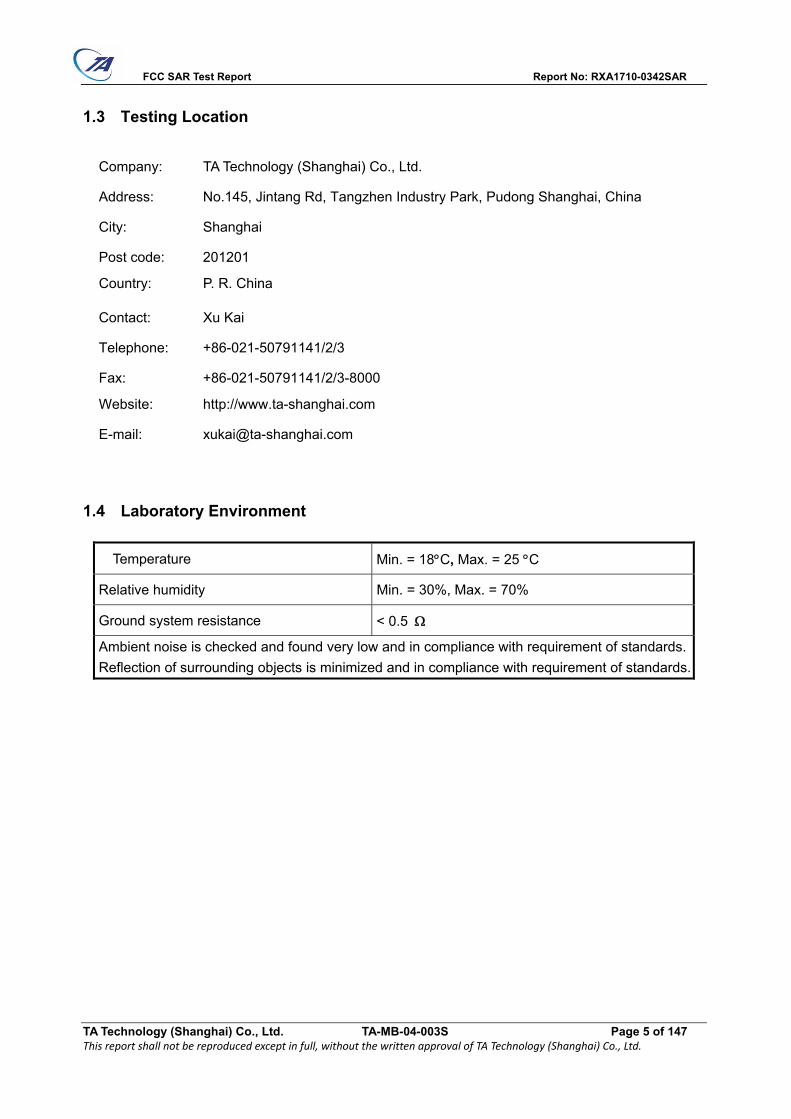
1.3 Testing Location
Company: TA Technology (Shanghai) Co., Ltd.
Address: No.145, Jintang Rd, Tangzhen Industry Park, Pudong Shanghai, China
City: Shanghai
Post code: 201201
Country: P. R. China
Contact: Xu Kai
Telephone: +86-021-50791141/2/3
Fax: +86-021-50791141/2/3-8000
Website: http://www.ta-shanghai.com
E-mail: [email protected]
1.4 Laboratory Environment
Temperature Min. = 18C, Max. = 25 C
Relative humidity Min. = 30%, Max. = 70%
Ground system resistance < 0.5
Ambient noise is checked and found very low and in compliance with requirement of standards.
Reflection of surrounding objects is minimized and in compliance with requirement of standards.

FCC SAR Test Report Report No: RXA1710-0342SAR
TA Technology (Shanghai) Co., Ltd. TA-MB-04-003S Page 6 of 147 This report shall not be reproduced except in full, without the written approval of TA Technology (Shanghai) Co., Ltd.
2 Statement of Compliance
The maximum results of Specific Absorption Rate (SAR) found during testing for the EUT are as follows:
Table 2.1: Highest Reported SAR
Mode
Highest Reported SAR (W/kg)
1g SAR
Head
1g SAR
Body-worn
(Separation 10mm)
1g SAR
Hotspot
(Separation 10mm)
Product Specific
10-g SAR
(Separation 0mm)
GSM 850 0.232 0.513 0.515 NA
GSM 1900 0.098 0.399 0.624 NA
WCDMA Band II 0.169 0.571 0.728 NA
WCDMA Band V 0.239 0.362 0.362 NA
LTE FDD 2 0.152 0.546 0.856 NA
LTE FDD 5 0.224 0.299 0.299 NA
LTE FDD 13 0.214 0.338 0.338 NA
LTE FDD 17 0.169 0.314 0.314 NA
Wi-Fi (2.4G) 0.573 0.136 0.136 NA
Bluetooth NA NA NA NA
Date of Testing: October 18, 2017 ~ October 23, 2017
Note: The device is in compliance with SAR for Uncontrolled Environment /General Population
exposure limits (1.6 W/kg and 4.0 W/kg) specified in ANSI/IEEE C95.1-1992, and had been tested in
accordance with the measurement methods and procedures specified in IEEE 1528-2013.
Table 2.2: Highest Simultaneous Transmission SAR
Exposure
Configuration
1g SAR
Head
1g SAR
Body-worn
(Separation 10mm)
1g SAR
Hotspot
(Separation 10mm)
Product Specific
10-g SAR
(Separation 0mm)
Highest
Simultaneous
Transmission SAR
(W/kg)
0.782 0.695 0.856 NA
Note: 1. The detail for simultaneous transmission consideration is described in chapter 10.3.

FCC SAR Test Report Report No: RXA1710-0342SAR
TA Technology (Shanghai) Co., Ltd. TA-MB-04-003S Page 7 of 147 This report shall not be reproduced except in full, without the written approval of TA Technology (Shanghai) Co., Ltd.
3 Description of Equipment under Test
Client Information
Applicant ZTE Corporation
Applicant address ZTE Plaza, Keji Road South, Hi-Tech, Industrial Park, Nanshan
District, Shenzhen, Guangdong, 518057, P.R.China
Manufacturer ZTE Corporation
Manufacturer address ZTE Plaza, Keji Road South, Hi-Tech, Industrial Park, Nanshan
District, Shenzhen, Guangdong, 518057, P.R.China

FCC SAR Test Report Report No: RXA1710-0342SAR
TA Technology (Shanghai) Co., Ltd. TA-MB-04-003S Page 8 of 147 This report shall not be reproduced except in full, without the written approval of TA Technology (Shanghai) Co., Ltd.
General Technologies
Application Purpose: Variant Grant
EUT Stage Identical Prototype
Model: ZTE BLADE A602、ZTE Blade A602、BLADE A602、Blade A602、
DL2 XL、Digicel DL2 XL、DIGICEL DL2 XL
IMEI: 866112030002287
Hardware Version: MB V1.0
Software Version: DIG_JM_DL2XL_V1.0
Antenna Type: Internal Antenna
Device Class: B
Wi-Fi Hotspot Wi-Fi 2.4G
Power Class:
GSM 850:4
GSM 1900:1
UMTS Band II/ V:3
LTE FDD 2/5/13/17:3
Power Level
GSM 850:level 5
GSM 1900:level 0
UMTS Band II/V:all up bits
LTE FDD 2/5/13/17:max power
EUT Accessory
Battery Manufacturer: BAK
Model: Li3830T43P6h856337
Adapter Manufacturer: DOKOCOM
Model: LPL-A008050150Z
Earphone Manufacturer: FDC
Model: DEM-93
USB Extend Cable 70cm Cable, Shielded

FCC SAR Test Report Report No: RXA1710-0342SAR
TA Technology (Shanghai) Co., Ltd. TA-MB-04-003S Page 9 of 147 This report shall not be reproduced except in full, without the written approval of TA Technology (Shanghai) Co., Ltd.
Wireless Technology and Frequency Range
Wireless
Technology Modulation Operating mode Tx (MHz)
GSM
850 Voice(GMSK)
GPRS(GMSK)
EGPRS(GMSK,8PSK)
Multi-slot Class:8-1UP
Multi-slot Class:10-2UP
Multi-slot Class:12-4UP
Multi-slot Class:33-4UP
824 ~ 849
1900 1850 ~ 1910
Does this device support DTM (Dual Transfer Mode)? Yes No
UMTS
Band II
QPSK HSDPA UE Category:24
HSUPA UE Category:7
1850 ~ 1910
Band V 824 ~ 849
LTE
FDD 2
QPSK, 16QAM Rel.9
1850 ~ 1910
FDD 5 824 ~ 849
FDD 13 777 ~ 787
FDD 17 704 ~ 716
Does this device support Carrier Aggregation (CA) Yes No
Does this device support SV-LTE (1xRTT-LTE)? Yes No
BT 2.4G Version 4.1 LE 2402 ~2480
Wi-Fi 2.4G DSSS, OFDM 802.11b/g/n (HT20/HT40) 2402 ~2472
Does this device support MIMO Yes No

FCC SAR Test Report Report No: RXA1710-0342SAR
TA Technology (Shanghai) Co., Ltd. TA-MB-04-003S Page 10 of 147 This report shall not be reproduced except in full, without the written approval of TA Technology (Shanghai) Co., Ltd.
4 Test Specification, Methods and Procedures
The tests documented in this report were performed in accordance with FCC 47 CFR § 2.1093, IEEE
1528- 2013, ANSI/IEEE C95.1-1992, the following FCC Published RF exposure KDB procedures:
248227 D01 802.11 Wi-Fi SAR v02r02
447498 D01 General RF Exposure Guidance v06
648474 D04 Handset SAR v01r03
865664 D01 SAR measurement 100 MHz to 6 GHz v01r04
865664 D02 RF Exposure Reporting v01r02
941225 D01 3G SAR Procedures v03r01
941225 D05 SAR for LTE Devices v02r05
941225 D06 Hotspot Mode v02r01

FCC SAR Test Report Report No: RXA1710-0342SAR
TA Technology (Shanghai) Co., Ltd. TA-MB-04-003S Page 11 of 147 This report shall not be reproduced except in full, without the written approval of TA Technology (Shanghai) Co., Ltd.
5 Operational Conditions during Test
5.1 Test Positions
5.1.1 Against Phantom Head
Measurements were made in “cheek” and “tilt” positions on both the left hand and right hand sides of
the phantom.
The positions used in the measurements were according to IEEE 1528 - 2013 "IEEE Recommended
Practice for Determining the Peak Spatial-Average Specific Absorption Rate (SAR) in the Human
Head from Wireless Communications Devices: Measurement Techniques".
5.1.2 Body Worn Configuration
Body-worn operating configurations should be tested with the belt-clips and holsters attached to the
device and positioned against a flat phantom in normal use configurations.
Body-worn operating configurations are tested with the belt-clips and holsters attached to the device
and positioned against a flat phantom in a normal use configuration. Per FCC KDB Publication
648474 D04, Body-worn accessory exposure is typically related to voice mode operations when
handsets are carried in body-worn accessories. The body-worn accessory procedures in FCC KDB
Publication 447498 D01 should be used to test for body-worn accessory SAR compliance, without a
headset connected to it. This enables the test results for such configuration to be compatible with
that required for hotspot mode when the body-worn accessory test separation distance is greater
than or equal to that required for hotspot mode, when applicable. When the reported SAR for a
body-worn accessory, measured without a headset connected to the handset, is > 1.2 W/kg, the
highest reported SAR configuration for that wireless mode and frequency band should be repeated
for that body-worn accessory with a headset attached to the handset.
Accessories for Body-worn operation configurations are divided into two categories: those that do not
contain metallic components and those that do contain metallic components. When multiple
accessories that do not contain metallic components are supplied with the device, the device is tested
with only the accessory that dictates the closest spacing to the body. Then multiple accessories that
contain metallic components are tested with the device with each accessory. If multiple accessories
share an identical metallic component (i.e. the same metallic belt-clip used with different holsters with
no other metallic components) only the accessory that dictates the closest spacing to the body is
tested.
Body-worn accessories may not always be supplied or available as options for some devices
intended to be authorized for body-worn use. In this case, a test configuration with a separation
distance between the back of the device and the flat phantom is used. Test position spacing was
documented. Transmitters that are designed to operate in front of a person’s face, as in push-to-talk
configurations, are tested for SAR compliance with the front of the device positioned to face the flat
phantom in head fluid. For devices that are carried next to the body such as a shoulder, waist or
chest-worn transmitters, SAR compliance is tested with the accessories, including headsets and
microphones, attached to the device and positioned against a flat phantom in a normal use
configuration.

FCC SAR Test Report Report No: RXA1710-0342SAR
TA Technology (Shanghai) Co., Ltd. TA-MB-04-003S Page 12 of 147 This report shall not be reproduced except in full, without the written approval of TA Technology (Shanghai) Co., Ltd.
5.1.3 Phablet SAR test considerations
For smart phones, with a display diagonal dimension > 15.0 cm or an overall diagonal dimension >
16.0 cm, that can provide similar mobile web access and multimedia support found in mini-tablets or
UMPC mini-tablets and support voice calls next to the ear, unless it is confirmed otherwise through
KDB inquiries, the following phablet procedures should be applied to evaluate SAR compliance for
each applicable wireless modes and frequency band. Devices marketed as phablets, regardless of
form factors and operating characteristics must be tested as a phablet to determine SAR compliance.
a) The normally required head and body-worn accessory SAR test procedures for handsets, including
hotspot mode, must be applied.
b) The UMPC mini-tablet procedures must also be applied to test the SAR of all surfaces and edges
with an antenna located at ≤ 25 mm from that surface or edge, in direct contact with a flat phantom,
for product specific 10-g SAR according to the body-equivalent tissue dielectric parameters in KDB
Publication 865664 D01 to address interactive hand use exposure conditions. The 1-g SAR at 5 mm
for UMPC mini-tablets is not required. When hotspot mode applies, 10-g extremity SAR is required
only for the surfaces and edges with hotspot mode 1-g reported SAR > 1.2 W/kg; however, when
power reduction applies to hotspot mode the measured SAR must be scaled to the maximum output
power, including tolerance, allowed for phablet modes to compare with the 1.2 W/kg SAR test
reduction threshold. The normal tablet procedures in KDB Publication 616217 are required when the
overall diagonal dimension of the device is > 20.0 cm. Hotspot mode SAR is not required when
normal tablet procedures are applied. Extremity 10-g SAR is also not required for the front (top)
surface of larger form factor full size tablets. The more conservative normal tablet SAR results can be
used to support phablet mode product specific 10-g SAR.
c) The simultaneous transmission operating configurations applicable to voice and data
transmissions for both phone and mini-tablet modes must be taken into consideration separately for
1-g and 10-g SAR to determine the simultaneous transmission SAR test exclusion and measurement
requirements for the relevant wireless modes and exposure conditions.

FCC SAR Test Report Report No: RXA1710-0342SAR
TA Technology (Shanghai) Co., Ltd. TA-MB-04-003S Page 13 of 147 This report shall not be reproduced except in full, without the written approval of TA Technology (Shanghai) Co., Ltd.
5.2 Measurement Variability
Per FCC KDB Publication 865664 D01, SAR measurement variability was assessed for each
frequency band, which was determined by the SAR probe calibration point and tissue-equivalent
medium used for the device measurements. When both head and body tissue-equivalent media were
required for SAR measurements in a frequency band, the variability measurement procedures were
applied to the tissue medium with the highest measured SAR, using the highest measured SAR
configuration for that tissue-equivalent medium. These additional measurements were repeated after
the completion of all measurements requiring the same head or body tissue-equivalent medium in a
frequency band. The test device was returned to ambient conditions (normal room temperature) with
the battery fully charged before it was re-mounted on the device holder for the repeated
measurement(s) to minimize any unexpected variations in the repeated results.
SAR Measurement Variability was assessed using the following procedures for each frequency band:
1) When the original highest measured SAR is ≥ 0.80 W/kg, the measurement was repeated once.
2) A second repeated measurement was preformed only if the ratio of largest to smallest SAR for the
original and first repeated measurements was > 1.20 or when the original or repeated measurement
was ≥ 1.45 W/kg (~ 10% from the 1-g SAR limit).
3) A third repeated measurement was performed only if the original, first or second repeated
measurement was ≥ 1.5 W/kg and the ratio of largest to smallest SAR for the original, first and
second repeated measurements is > 1.20.
4) Repeated measurements are not required when the original highest measured SAR is < 0.80 W/kg
The same procedures should be adapted for measurements according to extremity and occupational
exposure limits by applying a factor of 2.5 for extremity exposure and a factor of 5 for occupational
exposure to the corresponding SAR thresholds.
5.3 Test Configuration
5.3.1 GSM Test Configuration
According to specification 3GPP TS 51.010, the maximum power of the GSM can do the power
reduction for the multi-slot. The allowed power reduction in the multi-slot configuration is as following:
Output power of reductions:
Table 5.1: The allowed power reduction in the multi-slot configuration
Number of timeslots in uplink
assignment
Permissible nominal reduction of maximum
output power,(dB)
1 0
2 0 to 3,0
3 1,8 to 4,8
4 3,0 to 6,0

FCC SAR Test Report Report No: RXA1710-0342SAR
TA Technology (Shanghai) Co., Ltd. TA-MB-04-003S Page 14 of 147 This report shall not be reproduced except in full, without the written approval of TA Technology (Shanghai) Co., Ltd.
5.3.2 3G Test Configuration
3G SAR Test Reduction Procedure
In the following procedures, the mode tested for SAR is referred to as the primary mode. The
equivalent modes considered for SAR test reduction are denoted as secondary modes. Both primary
and secondary modes must be in the same frequency band. When the maximum output power and
tune-up tolerance specified for production units in a secondary mode is ≤ ¼ dB higher than the
primary mode or when the highest reported SAR of the primary mode is scaled by the ratio of
specified maximum output power and tune-up tolerance of secondary to primary mode and the
adjusted SAR is ≤ 1.2 W/kg, SAR measurement is not required for the secondary mode.3 This is
referred to as the 3G SAR test reduction procedure in the following SAR test guidance, where the
primary mode is identified in the applicable wireless mode test procedures and the secondary mode
is wireless mode being considered for SAR test reduction by that procedure. When the 3G SAR test
reduction procedure is not satisfied, it is identified as “otherwise” in the applicable procedures; SAR
measurement is required for the secondary mode.
5.3.2.1 WCDMA Test Configuration
Output power Verification
Maximum output power is verified on the high, middle and low channels according to procedures
described in section 5.2 of 3GPP TS 34.121, using the appropriate RMC or AMR with TPC (transmit
power control) set to all “1’s” for WCDMA/HSDPA or by applying the required inner loop power control
procedures to maintain maximum output power while HSUPA is active. Results for all applicable
physical channel configurations (DPCCH, DPDCHn and spreading codes, HSDPA, HSPA) are
requied in the SAR report. All configurations that are not supported by the handset or cannot be
measured due to technical or equipment limitations must be clearly identified.
Head SAR
SAR for next to the ear head exposure is measured using a 12.2 kbps RMC with TPC bits configured
to all “1’s”. The 3G SAR test reduction procedure is applied to AMR configurations with 12.2 kbps
RMC as the primary mode. Otherwise, SAR is measured for 12.2 kbps AMR in 3.4 kbps SRB
(signaling radio bearer) using the highest reported SAR configuration in 12.2 kbps RMC for head
exposure.
Body-Worn Accessory SAR
SAR for body-worn accessory configurations is measured using a 12.2 kbps RMC with TPC bits
configured to all “1’s”. The 3G SAR test reduction procedure is applied to other spreading codes and
multiple DPDCHn configurations supported by the handset with 12.2 kbps RMC as the primary mode.
Otherwise, SAR is measured using an applicable RMC configuration with the corresponding spreaing
code or DPDCHn, for the highest reported body-worn accessory exposure SAR configuration in 12.2
kbps RMC. When more than 2 DPDCHn are supported by the handset, it may be necessary to
configure additional DPDCHn using FTM (Factory Test Mode) or other chipset based test
approaches with parameters similar to those used in 384 kbps and 768 kbps RMC.

FCC SAR Test Report Report No: RXA1710-0342SAR
TA Technology (Shanghai) Co., Ltd. TA-MB-04-003S Page 15 of 147 This report shall not be reproduced except in full, without the written approval of TA Technology (Shanghai) Co., Ltd.
Handsets with Release 5 HSDPA
The 3G SAR test reduction procedure is applied to HSDPA body-worn accessory configurations with
12.2 kbps RMC as the primary mode. Otherwise, SAR is measured for HSDPA using the HSDPA
body SAR procedures in the “Release 5 HSDPA Data Devices” section of this document, for the
highest reported SAR body-worn accessory exposure configuration in 12.2 kbps RMC. Handsets with
both HSDPA and HSUPA are tested according to Release 6 HSPA test procedures.
HSDPA should be configured according to the UE category of a test device.The number of HSDSCH/
HS-PDSCHs, HARQ processes, minimum inter-TTI interval, transport block sizes and RV coding
sequence are defined by the H-set. To maintain a consistent test configuration and stable
transmission conditions, QPSK is used in the H-set for SAR testing. HS-DPCCH should be
configured with a CQI feedback cycle of 4 ms with a CQI repetition factor of 2 to maintain a constant
rate of active CQI slots. DPCCH and DPDCH gain factors(βc, βd), and HS-DPCCH power offset
parameters (ΔACK, ΔNACK, ΔCQI) should be set according to values indicated in the Table below.
The CQI value is determined by the UE category, transport block size, number of HS-PDSCHs and
modulation used in the H-set.
Table 5.2: Subtests for UMTS Release 5 HSDPA
Sub-set βc βd βd
(SF) βc/βd
βhs
(note 1, note 2)
CM(dB)
(note 3) MPR(dB)
1 2/15 15/15 64 2/15 4/15 0.0 0.0
2 12/15
(note 4)
15/15
(note 4) 64
12/15
(note 4) 24/15 1.0 0.0
3 15/15 8/15 64 15/8 30/15 1.5 0.5
4 15/15 4/15 64 15/4 30/15 1.5 0.5
Note1: ΔACK, ΔNACK and ΔCQI= 8⇔Ahs = βhs/βc=30/15 ⇔ βhs=30/15*βc
Note2: CM=1 for βc/βd =12/15, βhs/βc=24/15.
Note3: For subtest 2 the βcβd ratio of 12/15 for the TFC during the measurement period(TF1,TF0) is
achieved by setting the signaled gain factors for the reference TFC (TFC1,TF1) to βc=11/15 and
βd=15/15.
HSUPA Test Configuration
The 3G SAR test reduction procedure is applied to HSPA (HSUPA/HSDPA with RMC) body-worn
accessory configurations with 12.2 kbps RMC as the primary mode. Otherwise, SAR is measured for
HSPA using the HSPA body SAR procedures in the “Release 6 HSPA Data Devices” section of this
document, for the highest reported body-worn accessory exposure SAR configuration in 12.2 kbps
RMC. When VOIP is applicable for next to the ear head exposure in HSPA, the 3G SAR test
reduction procedure is applied to HSPA with 12.2 kbps RMC as the primary mode; otherwise, the
same HSPA configuration used for body-worn accessory measurements is tested for next to the ear
head exposure.
Due to inner loop power control requirements in HSPA, a communication test set is required for
output power and SAR tests. The 12.2 kbps RMC, FRC H-set 1 and E-DCH configurations for HSPA
are configured according to the β values indicated in Table 2 and other applicable procedures
described in the ‘WCDMA Handset’ and ‘Release 5 HSDPA Data Devices’ sections of this document

FCC SAR Test Report Report No: RXA1710-0342SAR
TA Technology (Shanghai) Co., Ltd. TA-MB-04-003S Page 16 of 147 This report shall not be reproduced except in full, without the written approval of TA Technology (Shanghai) Co., Ltd.
Table 5.3:Sub-Test 5 Setup for Release 6 HSUPA
Sub-
set βc βd
βd
(SF) βc/βd βhs
(1) βec βed βed
(SF)
βed
(codes)
CM
(2)
(dB)
MPR
(dB)
AG(4)
IndexE-TFCI
1 11/15(3) 15/15(3) 64 11/15(3) 22/15 209/225 1039/225 4 1 1.0 0.0 20 75
2 6/15 15/15 64 6/15 12/15 12/15 94/75 4 1 3.0 2.0 12 67
3 15/15 9/15 64 15/9 30/15 30/15 βed1
:47/15
βed2:47/15
4 2 2.0 1.0 15 92
4 2/15 15/15 64 2/15 4/15 2/15 56/75 4 1 3.0 2.0 17 71
5 15/15(4) 15/15(4) 64 15/15(4) 30/15 24/15 134/15 4 1 1.0 0.0 21 81
Note 1: ∆ACK, ∆NACK and ∆CQI = 8 ⇔ Ahs = βhs/βc = 30/15 ⇔ βhs= 30/15 *βc. Note 2: CM = 1 for βc/βd =12/15, βhs/βc =24/15. For all other combinations of DPDCH, DPCCH, HS- DPCCH,
E-DPDCH and E-DPCCH the MPR is based on the relative CM difference.
Note 3: For subtest 1 the βc/βd ratio of 11/15 for the TFC during the measurement period (TF1, TF0) is achieved by
setting the signaled gain factors for the reference TFC (TF1, TF1) to βc = 10/15 and βd = 15/15.
Note 4: For subtest 5 the βc/βd ratio of 15/15 for the TFC during the measurement period (TF1, TF0) is achieved by
setting the signaled gain factors for the reference TFC (TF1, TF1) to βc = 14/15 and βd = 15/15.
Note 5: Testing UE using E-DPDCH Physical Layer category 1 Sub-test 3 is not required according to TS 25.306
Figure 5.1g.
Note 6: βed can not be set directly; it is set by Absolute Grant Value.
Table 5.4: HSUPA UE category
UE E-DCH
Category
Maximum E-DCH Codes
Transmitted
Number of HARQ
Processes
E- DCH TTI
(ms)
Minimum
Spreading Factor
Maximum E-DCH
Transport Block Bits
Max Rate
(Mbps)
1 1 4 10 4 7110 0.7296
2 2 8 2 4 2798
1.4592 2 4 10 4 14484
3 2 4 10 4 14484 1.4592
4 2 8 2 2 5772 2.9185 2 4 10 2 20000 2.00
5 2 4 10 2 20000 2.00
6 (No DPDCH)
4 8 2 2 SF2 & 2 SF4
11484 5.76
4 4 10 20000 2.00
7 (No DPDCH)
4 8 2 2 SF2 & 2 SF4 22996 ?
4 4 10 20000 ?
NOTE: When 4 codes are transmitted in parallel, two codes shall be transmitted with SF2 and two with SF4.
UE Categories 1 to 6 supports QPSK only. UE Category 7 supports QPSK and 16QAM. (TS25.306-7.3.0)

FCC SAR Test Report Report No: RXA1710-0342SAR
TA Technology (Shanghai) Co., Ltd. TA-MB-04-003S Page 17 of 147 This report shall not be reproduced except in full, without the written approval of TA Technology (Shanghai) Co., Ltd.
HSPA, HSPA+ and DC-HSDPA Test Configuration
Measurement is required for HSPA, HSPA+ or DC-HSDPA, a KDB inquiry is required to confirm that
the wireless mode configurations in the test setup have remained stable throughout the SAR
measurements.35 Without prior KDB confirmation to determine the SAR results are acceptable, a
PBA is required for TCB approval.
SAR test exclusion for HSPA, HSPA+ and DC-HSDPA is determined according to the following:
1) The HSPA procedures are applied to configure 3GPP Rel. 6 HSPA devices in the required sub-test
mode(s) to determine SAR test exclusion.
2) SAR is required for Rel. 7 HSPA+ when SAR is required for Rel. 6 HSPA; otherwise, the 3G SAR
test reduction procedure is applied to (uplink) HSPA+ with 12.2 kbps RMC as the primary mode.36
Power is measured for HSPA+ that supports uplink 16 QAM according to configurations in Table
C.11.1.4 of 3GPP TS 34.121-1 to determine SAR test reduction.
3) SAR is required for Rel. 8 DC-HSDPA when SAR is required for Rel. 5 HSDPA; otherwise, the 3G
SAR test reduction procedure is applied to DC-HSDPA with 12.2 kbps RMC as the primary mode.
Power is measured for DC-HSDPA according to the H-Set 12, FRC configuration in Table C.8.1.12 of
3GPP TS 34.121-1 to determine SAR test reduction. A primary and a secondary serving HS-DSCH
Cell are required to perform the power measurement and for the results to be acceptable.
4) Regardless of whether a PBA is required, the following information must be verified and included in
the SAR report for devices supporting HSPA, HSPA+ or DC-HSDPA: a) The output power
measurement results and applicable release version(s) of 3GPP TS 34.121.
i) Power measurement difficulties due to test equipment setup or availability must be resolved
between the grantee and its test lab.
b) The power measurement results are in agreement with the individual device implementation and
specifications. When Enhanced MPR (E-MPR) applies, the normal MPR targets may be modified
according to the Cubic Metric (CM) measured by the device, which must be taken into consideration.
c) The UE category, operating parameters, such as the β and Δ values used to configure the device
for testing, power setback procedures described in 3GGPP TS 34.121 for the power measurements,
and HSPA/HSPA+ channel conditions (active and stable) for the entire duration of the measurement
according to the required E-TFCI and AG index values.
5) When SAR measurement is required, the test configurations, procedures and power measurement
results must be clearly described to confirm that the required test parameters are used, including
E-TFCI and AG index stability and output power conditions.

FCC SAR Test Report Report No: RXA1710-0342SAR
TA Technology (Shanghai) Co., Ltd. TA-MB-04-003S Page 18 of 147 This report shall not be reproduced except in full, without the written approval of TA Technology (Shanghai) Co., Ltd.
Table 5.5: HS-DSCH UE category
5.3.3 LTE Test Configuration
LTE modes were tested according to FCC KDB 941225 D05 publication. Please see notes after the
tabulated SAR data for required test configurations. Establishing connections with base station
simulators ensure a consistent means for testing SAR and are recommended for evaluating SAR [4].
The R&S CMW500 was used for LTE output power measurements and SAR testing. Max power
control was used so the UE transmits with maximum output power during SAR testing. SAR must be
measured with the maximum TTI (transmit time interval) supported by the device in each LTE
configuration.
A) Spectrum Plots for RB Configurations
A properly configured base station simulator was used for SAR tests and power measurements.
Therefore, spectrum plots for RB configurations were not required to be included in this report.

FCC SAR Test Report Report No: RXA1710-0342SAR
TA Technology (Shanghai) Co., Ltd. TA-MB-04-003S Page 19 of 147 This report shall not be reproduced except in full, without the written approval of TA Technology (Shanghai) Co., Ltd.
B) MPR
MPR is permanently implemented for this device by the manufacturer. The specific manufacturer
target MPR is indicated alongside the SAR results. MPR is enabled for this device, according to
3GPP TS36.101 Section 6.2.3 – 6.2.5 under Table 6.2.3-1.
C) A-MPR
A-MPR (Additional MPR) has been disabled for all SAR tests by setting NS=01 on the base station
simulator.
D) Largest channel bandwidth standalone SAR test requirements
1) QPSK with 1 RB allocation
Start with the largest channel bandwidth and measure SAR for QPSK with 1 RB allocation, using the
RB offset and required test channel combination with the highest maximum output power for RB
offsets at the upper edge, middle and lower edge of each required test channel. When the reported
SAR is ≤ 0.8 W/kg, testing of the remaining RB offset configurations and required test channels is not
required for 1 RB allocation; otherwise, SAR is required for the remaining required test channels and
only for the RB offset configuration with the highest output power for that channel. When the reported
SAR of a required test channel is > 1.45 W/kg, SAR is required for all three RB offset configurations
for that required test channel.
2) QPSK with 50% RB allocation
The procedures required for 1 RB allocation in 1) are applied to measure the SAR for QPSK with 50%
RB allocation.
3) QPSK with 100% RB allocation
For QPSK with 100% RB allocation, SAR is not required when the highest maximum output power for
100 % RB allocation is less than the highest maximum output power in 50% and 1 RB allocations and
the highest reported SAR for 1 RB and 50% RB allocation in 1) and 2) are ≤ 0.8 W/kg. Otherwise,
SAR is measured for the highest output power channel and if the reported SAR is > 1.45 W/kg, the
remaining required test channels must also be tested.
4) Higher order modulations
For each modulation besides QPSK; e.g., 16-QAM, 64-QAM, apply the QPSK procedures in above
sections to determine the QAM configurations that may need SAR measurement. For each
configuration identified as required for testing, SAR is required only when the highest maximum
output power for the configuration in the higher order modulation is > ½ dB higher than the same
configuration in QPSK or when the reported SAR for the QPSK configuration is > 1.45 W/kg.
E) Other channel bandwidth standalone SAR test requirements
For the other channel bandwidths used by the device in a frequency band, apply all the procedures
required for the largest channel bandwidth in section A) to determine the channels and RB
configurations that need SAR testing and only measure SAR when the highest maximum output
power of a configuration requiring testing in the smaller channel bandwidth is > ½ dB higher than the
equivalent channel configurations in the largest channel bandwidth configuration or the reported SAR
of a configuration for the largest channel bandwidth is > 1.45 W/kg.

FCC SAR Test Report Report No: RXA1710-0342SAR
TA Technology (Shanghai) Co., Ltd. TA-MB-04-003S Page 20 of 147 This report shall not be reproduced except in full, without the written approval of TA Technology (Shanghai) Co., Ltd.
5.3.4 Wi-Fi Test Configuration
SAR test reduction for 802.11 Wi-Fi transmission mode configurations are considered separately for
DSSS and OFDM. An initial test position is determined to reduce the number of tests required for
certain exposure configurations with multiple test positions. An initial test configuration is determined
for each frequency band and aggregated band according to maximum output power, channel
bandwidth, wireless mode configurations and other operating parameters to streamline the
measurement requirements. For 2.4 GHz DSSS, either the initial test position or DSSS procedure is
applied to reduce the number of SAR tests; these are mutually exclusive. For OFDM, an initial test
position is only applicable to next to the ear, UMPC mini-tablet and hotspot mode configurations,
which is tested using the initial test configuration to facilitate test reduction. For other exposure
conditions with a fixed test position, SAR test reduction is determined using only the initial test
configuration.
The multiple test positions require SAR measurements in head, hotspot mode or UMPC
mini-tablet configurations may be reduced according to the highest reported SAR determined using
the initial test position(s) by applying the DSSS or OFDM SAR measurement procedures in the
required wireless mode test configuration(s). The initial test position(s) is measured using the highest
measured maximum output power channel in the required wireless mode test configuration(s). When
the reported SAR for the initial test position is:
≤ 0.4 W/kg, further SAR measurement is not required for the other test positions in that
exposure configuration and wireless mode combination within the frequency band or
aggregated band. DSSS and OFDM configurations are considered separately according to
the required SAR procedures.
0.4 W/kg, SAR is repeated using the same wireless mode test configuration tested in the
initial test position to measure the subsequent next closet/smallest test separation distance
and maximum coupling test position, on the highest maximum output power channel, until
the reported SAR is ≤ 0.8 W/kg or all required test positions are tested.
For subsequent test positions with equivalent test separation distance or when
exposure is dominated by coupling conditions, the position for maximum coupling
condition should be tested.
When it is unclear, all equivalent conditions must be tested.
For all positions/configurations tested using the initial test position and subsequent test
positions, when the reported SAR is > 0.8 W/kg, measure the SAR for these
positions/configurations on the subsequent next highest measured output power channel(s)
until the reported SAR is ≤ 1.2 W/kg or all required test channels are considered.
The additional power measurements required for this step should be limited to
those necessary for identifying subsequent highest output power channels to apply
the test reduction.
To determine the initial test position, Area Scans were performed to determine the position with the
Maximum Value of SAR (measured). The position that produced the highest Maximum Value of SAR
is considered the worst case position; thus used as the initial test position.

FCC SAR Test Report Report No: RXA1710-0342SAR
TA Technology (Shanghai) Co., Ltd. TA-MB-04-003S Page 21 of 147 This report shall not be reproduced except in full, without the written approval of TA Technology (Shanghai) Co., Ltd.
A Wi-Fi device must be configured to transmit continuously at the required data rate, channel
bandwidth and signal modulation, using the highest transmission duty factor supported by the test
mode tools for SAR measurement. This RF signal utilized in SAR measurement has almost
100% duty cycle and its crest factor is 1.

FCC SAR Test Report Report No: RXA1710-0342SAR
TA Technology (Shanghai) Co., Ltd. TA-MB-04-003S Page 22 of 147 This report shall not be reproduced except in full, without the written approval of TA Technology (Shanghai) Co., Ltd.
6 SAR Measurements System Configuration
6.1 SAR Measurement Set-up
The DASY system for performing compliance tests consists of the following items:
A standard high precision 6-axis robot with controller, teach pendant and software. An arm
extension for accommodating the data acquisition electronics (DAE).
An isotropic Field probe optimized and calibrated for the targeted measurement.
A data acquisition electronics (DAE) which performs the signal amplification, signal
multiplexing, AD-conversion, offset measurements, mechanical surface detection, collision
detection, etc. The unit is battery powered with standard or rechargeable batteries. The
signal is optically transmitted to the EOC.
The Electro-optical converter (EOC) performs the conversion from optical to electrical signals
for the digital communication to the DAE. To use optical surface detection, a special version
of the EOC is required. The EOC signal is transmitted to the measurement server.
The function of the measurement server is to perform the time critical tasks such as signal
filtering, control of the robot operation and fast movement interrupts.
The Light Beam used is for probe alignment. This improves the (absolute) accuracy of the
probe positioning.
A computer running WinXP or Win7 and the DASY software.
Remote control and teach pendant as well as additional circuitry for robot safety such as
warning lamps, etc.
The phantom, the device holder and other accessories according to the targeted
measurement.

FCC SAR Test Report Report No: RXA1710-0342SAR
TA Technology (Shanghai) Co., Ltd. TA-MB-04-003S Page 23 of 147 This report shall not be reproduced except in full, without the written approval of TA Technology (Shanghai) Co., Ltd.
6.2 DASY5 E-field Probe System
The SAR measurements were conducted with the dosimetric probe EX3DV4 (manufactured by
SPEAG), designed in the classical triangular configuration and optimized for dosimetric
evaluation.
EX3DV4 Probe Specification
Construction Symmetrical design with triangular core
Built-in shielding against static charges
PEEK enclosure material (resistant to
organic solvents, e.g., DGBE)
Calibration ISO/IEC 17025 calibration
service available
Frequency 10 MHz to > 6 GHz
Linearity: ± 0.2 dB
(30 MHz to 6 GHz)
Directivity ± 0.3 dB in HSL (rotation around probe
axis) ± 0.5 dB in tissue material (rotation
normal to probe axis)
Dynamic
Range
10 µW/g to > 100 mW/g Linearity:
± 0.2dB (noise: typically < 1 µW/g)
Dimensions Overall length: 330 mm (Tip: 20 mm) Tip
diameter: 2.5 mm (Body: 12 mm)
Typical distance from probe tip to dipole
centers: 1 mm
Application High precision dosimetric
measurements in any exposure
Scenario (e.g., very strong gradient
fields). Only probe which enables
compliance testing for frequencies up to
6 GHz with precision of better 30%.
E-field Probe Calibration
Each probe is calibrated according to a dosimetric assessment procedure with accuracy better than ±
10%. The spherical isotropy was evaluated and found to be better than ± 0.25dB. The sensitivity
parameters (NormX, NormY, NormZ), the diode compression parameter (DCP) and the conversion
factor (ConvF) of the probe are tested.
The free space E-field from amplified probe outputs is determined in a test chamber. This is
performed in a TEM cell for frequencies bellow 1 GHz, and in a wave guide above 1 GHz for free
space. For the free space calibration, the probe is placed in the volumetric center of the cavity and at
the proper orientation with the field. The probe is then rotated 360 degrees.
E-field temperature correlation calibration is performed in a flat phantom filled with the appropriate
simulated brain tissue. The measured free space E-field in the medium correlates to temperature rise
in a dielectric medium. For temperature correlation calibration a RF transparent thermistor-based

FCC SAR Test Report Report No: RXA1710-0342SAR
TA Technology (Shanghai) Co., Ltd. TA-MB-04-003S Page 24 of 147 This report shall not be reproduced except in full, without the written approval of TA Technology (Shanghai) Co., Ltd.
temperature probe is used in conjunction with the E-field probe.
SAR=C∆T/∆t
Where: ∆t = Exposure time (30 seconds),
C = Heat capacity of tissue (brain or muscle),
∆T = Temperature increase due to RF exposure.
Or
SAR=IEI2σ/ρ
Where: σ = Simulated tissue conductivity,
ρ = Tissue density (kg/m3).
6.3 SAR Measurement Procedure
Power Reference Measurement
The Power Reference Measurement and Power Drift Measurements are for monitoring the power drift
of the device under test in the batch process. The minimum distance of probe sensors to surface
determines the closest measurement point to phantom surface. This distance cannot be smaller than
the distance of sensor calibration points to probe tip as defined in the probe properties.
Area Scan
The area scan is used as a fast scan in two dimensions to find the area of high field values, before
doing a fine measurement around the hot spot. The sophisticated interpolation routines implemented
in DASY software can find the maximum found in the scanned area, within a range of the global
maximum. The range (in dB) is specified in the standards for compliance testing. For example, a 2 dB
range is required in IEEE standard 1528 and IEC 62209 standards, whereby 3 dB is a requirement
when compliance is assessed in accordance with the ARIB standard (Japan), if only one zoom scan
follows the area scan, then only the absolute maximum will be taken as reference. For cases where
multiple maximums are detected, the number of zoom scans has to be increased accordingly.
Area scan parameters extracted from FCC KDB 865664 D01 SAR measurement 100 MHz to 6 GHz.
≤3 GHz > 3 GHz
Maximum distance from closest
measurement point (geometric center of
probe sensors) to phantom surface
5 ± 1 mm ½·δ·ln(2) ± 0.5 mm
Maximum probe angle from probe axis to
phantom surface normal at the
measurement location
30° ± 1° 20° ± 1°
Maximum area scan spatial resolution:
ΔxArea, ΔyArea
≤ 2 GHz: ≤ 15 mm
2 – 3 GHz: ≤ 12 mm
3 – 4 GHz: ≤ 12 mm
4 – 6 GHz: ≤ 10 mm
When the x or y dimension of the test device, in
the measurement plane orientation, is smaller
than the above, the measurement resolution
must be ≤ the corresponding x or y dimension of
the test device with at least one measurement
point on the test device.

FCC SAR Test Report Report No: RXA1710-0342SAR
TA Technology (Shanghai) Co., Ltd. TA-MB-04-003S Page 25 of 147 This report shall not be reproduced except in full, without the written approval of TA Technology (Shanghai) Co., Ltd.
Zoom Scan
Zoom scans are used assess the peak spatial SAR values within a cubic averaging volume
containing 1 gram and 10 gram of simulated tissue. The zoom scan measures points (refer to table
below) within a cube shoes base faces are centered on the maxima found in a preceding area scan
job within the same procedure. When the measurement is done, the zoom scan evaluates the
averaged SAR for 1 gram and 10 gram and displays these values next to the job’s label.
Zoom scan parameters extracted from FCC KDB 865664 D01 SAR measurement 100 MHz to 6 GHz.
≤3GHz > 3 GHz
Maximum zoom scan spatial resolution:xzoom
yzoom
≤2GHz: ≤8mm
2 – 3GHz: ≤5mm*
3 – 4GHz: ≤5mm*
4 – 6GHz: ≤4mm*
Maximum
zoom scan
spatial
resolution,
normal to
phantom
surface
Uniform grid: zzoom(n) ≤5mm
3 – 4GHz: ≤4mm
4 – 5GHz: ≤3mm
5 – 6GHz: ≤2mm
Graded
grid
zzoom(1): between 1st two
points closest to phantom
surface
≤4mm
3 – 4GHz: ≤3mm
4 – 5GHz: ≤2.5mm
5 – 6GHz: ≤2mm
zzoom(n>1): between
subsequent points ≤1.5•zzoom(n-1)
Minimum
zoom scan
volume
X, y, z ≥30mm
3 – 4GHz: ≥28mm
4 – 5GHz: ≥25mm
5 – 6GHz: ≥22mm
Note: δ is the penetration depth of a plane-wave at normal incidence to the tissue medium; see
draft standard IEEE P1528-2011 for details.
* When zoom scan is required and the reported SAR from the area scan based 1-g SAR
estimation procedures of KDB 447498 is ≤ 1.4W/kg, ≤8mm, ≤7mm and ≤5mm zoom scan
resolution may be applied, respectively, for 2GHz to 3GHz, 3GHz to 4GHz and 4GHz to 6GHz.
Volume Scan Procedures
The volume scan is used for assess overlapping SAR distributions for antennas transmitting in
different frequency bands. It is equivalent to an oversized zoom scan used in standalone
measurements. The measurement volume will be used to enclose all the simultaneous transmitting
antennas. For antennas transmitting simultaneously in different frequency bands, the volume scan is
measured separately in each frequency band. In order to sum correctly to compute the 1g aggregate
SAR, the EUT remain in the same test position for all measurements and all volume scan use the
same spatial resolution and grid spacing. When all volume scan were completed, the software,
SEMCAD postprocessor can combine and subsequently superpose these measurement data to
calculating the multiband SAR.
Power Drift Monitoring
All SAR testing is under the EUT install full charged battery and transmit maximum output power. In
DASY measurement software, the power reference measurement and power drift measurement
procedures are used for monitoring the power drift of EUT during SAR test. Both these procedures
measure the field at a specified reference position before and after the SAR testing. The software will
calculate the field difference in dB. If the power drifts more than 5%, the SAR will be retested.
FCC SAR Test Report Report No: RXA1710-0342SAR
TA Technology (Shanghai) Co., Ltd. TA-MB-04-003S Page 26 of 147 This report shall not be reproduced except in full, without the written approval of TA Technology (Shanghai) Co., Ltd.
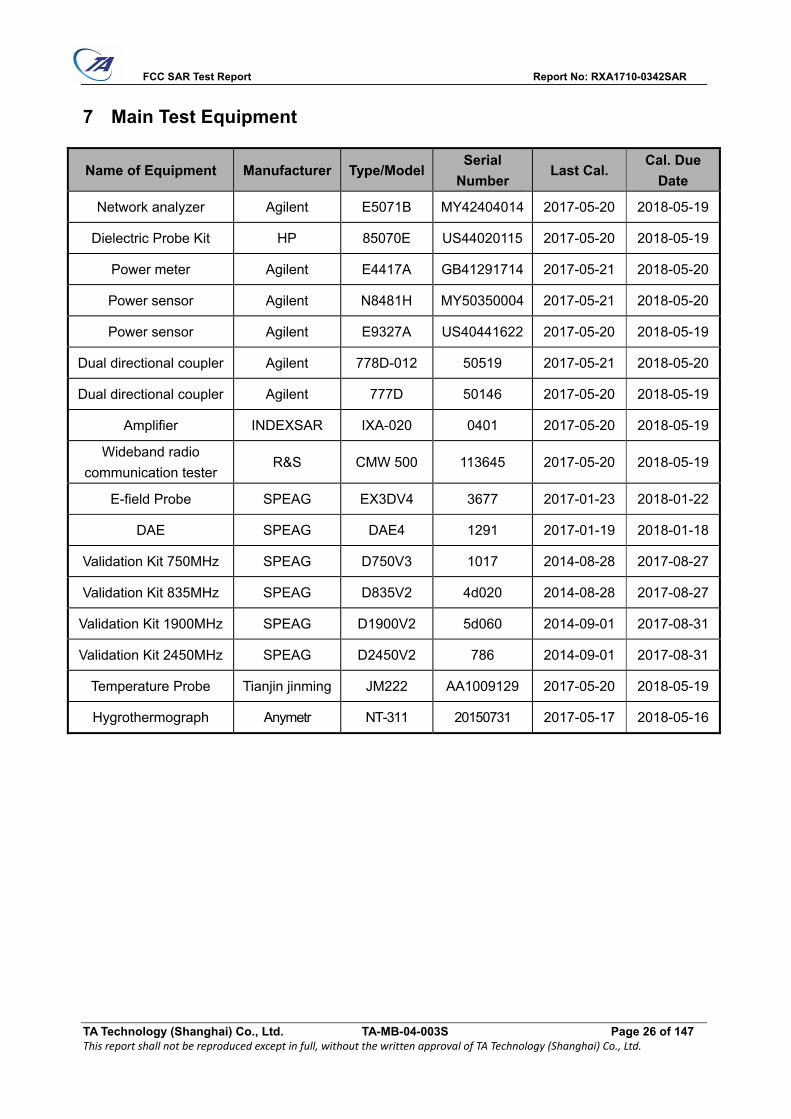
7 Main Test Equipment
Name of Equipment Manufacturer Type/ModelSerial
Number Last Cal.
Cal. Due
Date
Network analyzer Agilent E5071B MY42404014 2017-05-20 2018-05-19
Dielectric Probe Kit HP 85070E US44020115 2017-05-20 2018-05-19
Power meter Agilent E4417A GB41291714 2017-05-21 2018-05-20
Power sensor Agilent N8481H MY50350004 2017-05-21 2018-05-20
Power sensor Agilent E9327A US40441622 2017-05-20 2018-05-19
Dual directional coupler Agilent 778D-012 50519 2017-05-21 2018-05-20
Dual directional coupler Agilent 777D 50146 2017-05-20 2018-05-19
Amplifier INDEXSAR IXA-020 0401 2017-05-20 2018-05-19
Wideband radio
communication tester R&S CMW 500 113645 2017-05-20 2018-05-19
E-field Probe SPEAG EX3DV4 3677 2017-01-23 2018-01-22
DAE SPEAG DAE4 1291 2017-01-19 2018-01-18
Validation Kit 750MHz SPEAG D750V3 1017 2014-08-28 2017-08-27
Validation Kit 835MHz SPEAG D835V2 4d020 2014-08-28 2017-08-27
Validation Kit 1900MHz SPEAG D1900V2 5d060 2014-09-01 2017-08-31
Validation Kit 2450MHz SPEAG D2450V2 786 2014-09-01 2017-08-31
Temperature Probe Tianjin jinming JM222 AA1009129 2017-05-20 2018-05-19
Hygrothermograph Anymetr NT-311 20150731 2017-05-17 2018-05-16
FCC SAR Test Report Report No: RXA1710-0342SAR
TA Technology (Shanghai) Co., Ltd. TA-MB-04-003S Page 27 of 147 This report shall not be reproduced except in full, without the written approval of TA Technology (Shanghai) Co., Ltd.
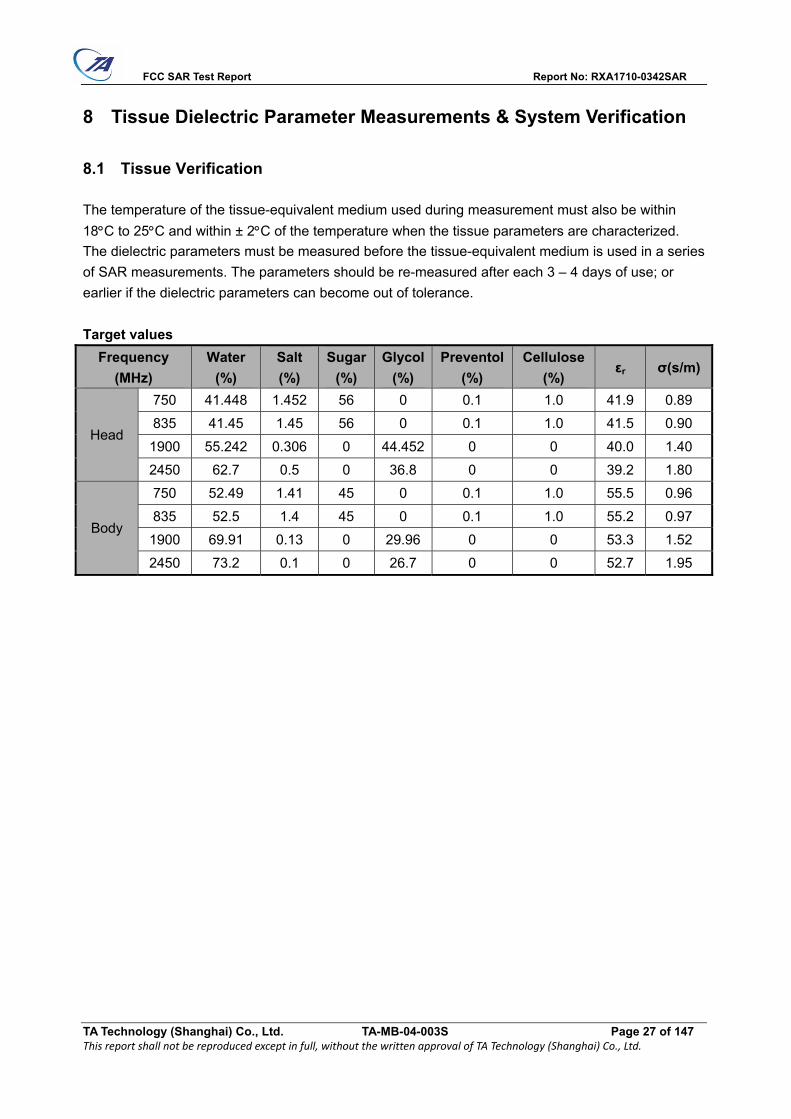
8 Tissue Dielectric Parameter Measurements & System Verification
8.1 Tissue Verification
The temperature of the tissue-equivalent medium used during measurement must also be within
18C to 25C and within ± 2C of the temperature when the tissue parameters are characterized.
The dielectric parameters must be measured before the tissue-equivalent medium is used in a series
of SAR measurements. The parameters should be re-measured after each 3 – 4 days of use; or
earlier if the dielectric parameters can become out of tolerance.
Target values
Frequency
(MHz)
Water
(%)
Salt
(%)
Sugar
(%)
Glycol
(%)
Preventol
(%)
Cellulose
(%) εr σ(s/m)
Head
750 41.448 1.452 56 0 0.1 1.0 41.9 0.89
835 41.45 1.45 56 0 0.1 1.0 41.5 0.90
1900 55.242 0.306 0 44.452 0 0 40.0 1.40
2450 62.7 0.5 0 36.8 0 0 39.2 1.80
Body
750 52.49 1.41 45 0 0.1 1.0 55.5 0.96
835 52.5 1.4 45 0 0.1 1.0 55.2 0.97
1900 69.91 0.13 0 29.96 0 0 53.3 1.52
2450 73.2 0.1 0 26.7 0 0 52.7 1.95

FCC SAR Test Report Report No: RXA1710-0342SAR
TA Technology (Shanghai) Co., Ltd. TA-MB-04-003S Page 28 of 147 This report shall not be reproduced except in full, without the written approval of TA Technology (Shanghai) Co., Ltd.
Measurements results
Frequency
(MHz) Test Date
Tem
p
Measured Dielectric
Parameters
Target Dielectric
Parameters
Limit
(Within ±5%)
εr σ(s/m) εr σ(s/m) Dev
εr(%)
Dev
σ(%)
750 Head 10/18/2017 21.5 41.1 0.90 41.9 0.89 -1.91 1.12
Body 10/18/2017 21.5 57.0 0.95 55.5 0.96 2.70 -1.04
835 Head 10/19/2017 21.5 42.5 0.94 41.5 0.90 2.41 4.44
Body 10/20/2017 21.5 55.4 0.97 55.2 0.97 0.36 0.00
1900 Head 10/21/2017 21.5 39.0 1.38 40.0 1.40 -2.50 -1.43
Body 10/22/2017 21.5 51.6 1.49 53.3 1.52 -3.19 -1.97
2450 Head 10/23/2017 21.5 40.6 1.82 39.2 1.80 3.57 1.11
Body 10/23/2017 21.5 51.1 1.95 52.7 1.95 -3.04 0.00
Note: The depth of tissue-equivalent liquid in a phantom must be ≥ 15.0 cm for SAR measurements ≤
3 GHz and ≥ 10.0 cm for measurements > 3 GHz.

FCC SAR Test Report Report No: RXA1710-0342SAR
TA Technology (Shanghai) Co., Ltd. TA-MB-04-003S Page 29 of 147 This report shall not be reproduced except in full, without the written approval of TA Technology (Shanghai) Co., Ltd.
8.2 System Performance Check
The manufacturer calibrates the probes annually. Dielectric parameters of the tissue simulates were
measured using the dielectric probe kit and the network analyzer. A system check measurement for
every day was made following the determination of the dielectric parameters of the Tissue simulates,
using the dipole validation kit. The dipole antenna was placed under the flat section of the twin SAM
phantom.
System check is performed regularly on all frequency bands where tests are performed with the
DASY system.
Picture 1 System Performance Check setup
Picture 2 Setup Photo

FCC SAR Test Report Report No: RXA1710-0342SAR
TA Technology (Shanghai) Co., Ltd. TA-MB-04-003S Page 30 of 147 This report shall not be reproduced except in full, without the written approval of TA Technology (Shanghai) Co., Ltd.
Justification for Extended SAR Dipole Calibrations Usage of SAR dipoles calibrated less than 3 years ago but more than 1 year ago were confirmed in
maintaining return loss (< - 20 dB, within 20% of prior calibration) and impedance (within 5 ohm from
prior calibration) requirements per extended calibrations in KDB 865664 D01:
Dipole Date of Measurement Return Loss(dB) Δ % Impedance (Ω) ΔΩ
Dipole
D750V3
SN: 1017
Head
Liquid
8/28/2014 -30.1 / 53.2 /
8/27/2015 -30.0 0.3% 52.7 0.5Ω
8/26/2016 -29.7 1.0% 52.4 0.3Ω
Body
Liquid
8/28/2014 -28.9 / 48.0 /
8/27/2015 -29.3 1.4% 48.6 0.6Ω
8/26/2016 -29.2 0.3% 48.7 0.1Ω
Dipole
D835V2
SN: 4d020
Head
Liquid
8/28/2014 -30.1 / 48.6 /
8/27/2015 -31.1 3.3% 49.7 1.1Ω
8/26/2016 -32.2 -3.4% 49.8 0.1Ω
Body
Liquid
8/28/2014 -23.3 / 54.0 /
8/27/2015 -23.9 2.6% 53.5 0.5Ω
8/26/2016 -24.2 -1.2% 53.1 0.4Ω
Dipole
D1900V2
SN: 5d060
Head
Liquid
9/1/2014 -22.8 / 54.1 /
8/31/2015 -23.7 3.8% 55.4 1.3Ω
8/30/2016 -23.2 2.2% 56.7 1.3Ω
Body
Liquid
9/1/2014 -21.6 / 57.6 /
8/31/2015 -20.8 3.8% 57.3 0.3Ω
8/30/2016 -20.8 3.5% 57.0 0.3Ω
Dipole
D2450V2
SN: 786
Head
Liquid
9/1/2014 -23.6 / 57.1 /
8/31/2015 -23.9 1.3% 57.4 0.3Ω
8/30/2016 -23.3 2.6% 57.7 0.3Ω
Body
Liquid
9/1/2014 -23.7 / 56.0 /
8/31/2015 -24.0 1.3% 55.8 0.2Ω
8/30/2016 -24.4 -1.6% 55.1 0.7Ω

FCC SAR Test Report Report No: RXA1710-0342SAR
TA Technology (Shanghai) Co., Ltd. TA-MB-04-003S Page 31 of 147 This report shall not be reproduced except in full, without the written approval of TA Technology (Shanghai) Co., Ltd.
System Check results
Frequency
(MHz) Test Date
Temp
250mW
Measured
SAR1g
(W/kg)
1W
Normalized
SAR1g
(W/kg)
1W
Target
SAR1g
(W/kg)
Δ %
(Limit
±10%)
Plot No.
750 Head 10/18/2017 21.5 2.13 8.52 8.31 2.53 1
Body 10/18/2017 21.5 2.22 8.88 8.75 1.49 2
835 Head 10/19/2017 21.5 2.44 9.76 9.54 2.31 3
Body 10/20/2017 21.5 2.41 9.64 9.54 1.05 4
1900 Head 10/21/2017 21.5 9.48 37.92 39.20 -3.27 5
Body 10/22/2017 21.5 9.93 39.72 40.00 -0.70 6
2450 Head 10/23/2017 21.5 13.70 54.80 52.50 4.38 7
Body 10/23/2017 21.5 12.50 50.00 52.40 -4.58 8
Note:Target Values used derive from the calibration certificate Data Storage and Evaluation.

FCC SAR Test Report Report No: RXA1710-0342SAR
TA Technology (Shanghai) Co., Ltd. TA-MB-04-003S Page 32 of 147 This report shall not be reproduced except in full, without the written approval of TA Technology (Shanghai) Co., Ltd.
9 Normal and Maximum Output Power
KDB 447498 D01 at the maximum rated output power and within the tune-up tolerance range
specified for the product, but not more than 2 dB lower than the maximum tune-up tolerance limit.
9.1 GSM Mode
GSM 850 Burst Average
Division
Factors
(dB)
Frame-Average Burst
Tune-up
Limit
(dBm)
Power(dBm) Power(dBm)
Tx Channel 128 190 251 128 190 251
Frequency(MHz) 824.2 836.6 848.8 824.2 836.6 848.8
GSM(GMSK) 32.61 32.57 32.50 9.03 23.58 23.54 23.47 33.50
GPRS
(GMSK)
1Txslot 32.60 32.55 32.47 9.03 23.57 23.52 23.44 33.50
2Txslots 31.96 31.89 31.82 6.02 25.94 25.87 25.80 32.50
3Txslots 30.38 30.28 30.19 4.26 26.12 26.02 25.93 31.00
4Txslots 29.41 29.29 29.15 3.01 26.40 26.28 26.14 30.50
EGPRS
(GMSK)
1Txslot 32.53 32.52 32.46 9.03 23.50 23.49 23.43 33.50
2Txslots 31.89 31.89 31.82 6.02 25.87 25.87 25.80 32.50
3Txslots 30.34 30.28 30.18 4.26 26.08 26.02 25.92 31.00
4Txslots 29.38 29.28 29.14 3.01 26.37 26.27 26.13 30.50
EGPRS
(8PSK)
1Txslot 27.11 27.45 27.24 9.03 18.08 18.42 18.21 28.00
2Txslots 26.39 26.56 26.54 6.02 20.37 20.54 20.52 27.50
3Txslots 24.79 25.00 25.01 4.26 20.53 20.74 20.75 25.50
4Txslots 23.84 23.99 23.90 3.01 20.83 20.98 20.89 24.50
GSM 1900 Power(dBm) Division
Factors
(dB)
Power(dBm) Burst
Tune-up
Limit
(dBm)
Tx Channel 512 661 810 512 661 810
Frequency(MHz) 1850.2 1880 1909.8 1850.2 1880 1909.8
GSM(GMSK) 29.74 29.46 29.41 9.03 20.71 20.43 20.38 30.50
GPRS
(GMSK)
1Txslot 29.70 29.49 29.41 9.03 20.67 20.46 20.38 30.50
2Txslots 28.97 28.79 28.71 6.02 22.95 22.77 22.69 29.50
3Txslots 27.17 27.02 26.98 4.26 22.91 22.76 22.72 27.50
4Txslots 26.10 25.96 25.92 3.01 23.09 22.95 22.91 26.50
EGPRS
(GMSK)
1Txslot 29.70 29.41 29.40 9.03 20.67 20.38 20.37 30.50
2Txslots 28.96 28.73 28.70 6.02 22.94 22.71 22.68 29.50
3Txslots 27.15 27.00 26.96 4.26 22.89 22.74 22.70 27.50
4Txslots 26.08 25.95 25.90 3.01 23.07 22.94 22.89 26.50
EGPRS
(8PSK)
1Txslot 26.53 26.23 26.36 9.03 17.50 17.20 17.33 27.50
2Txslots 25.92 25.66 25.54 6.02 19.90 19.64 19.52 26.50

FCC SAR Test Report Report No: RXA1710-0342SAR
TA Technology (Shanghai) Co., Ltd. TA-MB-04-003S Page 33 of 147 This report shall not be reproduced except in full, without the written approval of TA Technology (Shanghai) Co., Ltd.
3Txslots 24.11 23.96 23.86 4.26 19.85 19.70 19.60 24.50
4Txslots 22.96 22.90 22.83 3.01 19.95 19.89 19.82 23.50
Notes: The worst-case configuration and mode for SAR testing is determined to be as follows:
1. Standalone: GSM 850 GMSK (GPRS) mode with 4 time slots for Max power, GSM 1900
GMSK (GPRS) mode with 4 time slots for Max power, based on the output power
measurements above.
2. SAR is not required for EGPRS (8PSK) mode because its output power is less than that
of GPRS Mode.

FCC SAR Test Report Report No: RXA1710-0342SAR
TA Technology (Shanghai) Co., Ltd. TA-MB-04-003S Page 34 of 147 This report shall not be reproduced except in full, without the written approval of TA Technology (Shanghai) Co., Ltd.
9.2 WCDMA Mode
The following tests were completed according to the test requirements outlined in the 3GPP
TS34.121 specification.
WCDMA Band II(dBm) Band V(dBm)
Tx Channel 9262 9400 9538 Tune-up
Limit
(dBm)
4132 4183 4233 Tune-up
Limit
(dBm)Frequency(MHz) 1852.4 1880 1907.6 826.4 836.6 846.6
RMC
12.2kbps 22.05 22.13 22.09 22.50 22.26 22.31 22.50 23.00
64kbps 21.89 21.73 21.95 22.50 22.19 22.17 22.44 23.00
144kbps 21.99 21.81 22.03 22.50 22.18 22.16 22.34 23.00
384kbps 21.98 21.83 22.02 22.50 22.17 22.15 22.33 23.00
HSDPA
Sub 1 21.97 21.82 22.01 22.50 22.16 22.14 22.34 23.00
Sub 2 21.96 21.81 22.00 22.50 22.10 22.15 22.33 23.00
Sub 3 21.45 21.30 21.49 22.00 21.59 21.75 21.91 22.50
Sub 4 21.44 21.29 21.48 22.00 21.60 21.74 21.93 22.50
HSUPA
Sub 1 21.93 21.78 21.97 22.50 22.09 22.23 22.42 23.00
Sub 2 20.12 19.97 20.16 20.50 20.34 20.39 20.58 21.00
Sub 3 20.90 20.76 20.95 21.50 21.16 21.21 21.40 22.00
Sub 4 20.09 19.95 20.14 20.50 20.35 20.40 20.59 21.00
Sub 5 21.88 21.74 21.93 22.50 22.14 22.19 22.38 23.00
DC-
HSDPA
Sub 1 21.89 21.76 21.93 22.50 22.13 22.18 22.37 23.00
Sub 2 21.88 21.75 21.92 22.50 22.22 22.16 22.36 23.00
Sub 3 21.46 21.24 21.43 22.00 21.71 21.65 21.85 22.50
Sub 4 21.45 21.23 21.42 22.00 21.70 21.64 21.84 22.50
HSPA+ 16QAM 21.72 21.56 21.75 22.50 21.88 22.01 22.19 23.00
Note: 1.Per KDB 941225 D01, SAR for Head / Hotspot / Body-worn exposure is measured using a
12.2 kbps AMR with TPC bits configured to all “1’s”.
2. When the maximum output power and tune-up tolerance specified for production units in a
secondary mode is ≤ ¼ dB higher than the primary mode or when the highest reported SAR
of the primary mode is scaled by the ratio of specified maximum output power and tune-up
tolerance of secondary to primary mode and the adjusted SAR is ≤ 1.2 W/kg, SAR
measurement is not required for the secondary mode.

FCC SAR Test Report Report No: RXA1710-0342SAR
TA Technology (Shanghai) Co., Ltd. TA-MB-04-003S Page 35 of 147 This report shall not be reproduced except in full, without the written approval of TA Technology (Shanghai) Co., Ltd.
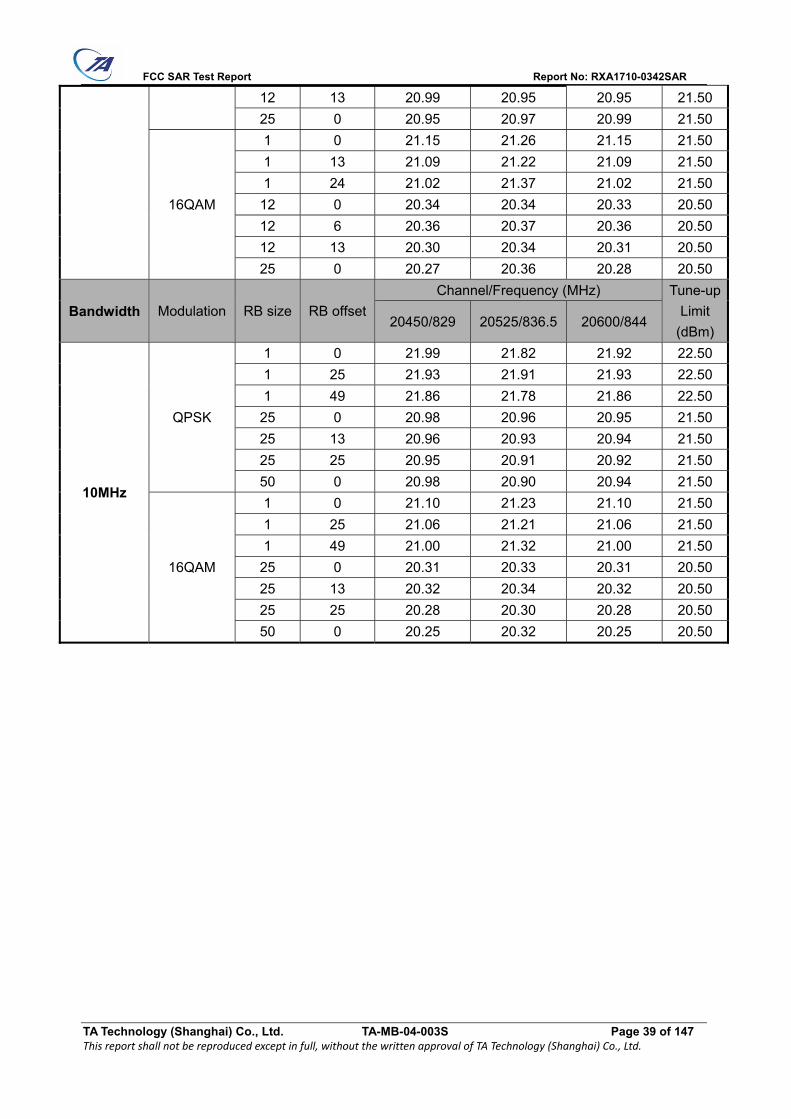
9.3 LTE Mode
UE Power Class: 3 (23 +/- 2dBm). The allowed Maximum Power Reduction (MPR) for the
maximum output power due to higher order modulation and transmit bandwidth configuration
(resource blocks) is specified in Table 6.2.3-1 of the 3GPP TS36.101.
LTE FDD Band 2 Conducted Power(dBm) Tune-up
Limit
(dBm) Bandwidth Modulation RB size RB offset
Channel/Frequency (MHz)
18607/1850.7 18900/1880 19193/1909.3
1.4MHz
QPSK
1 0 22.07 22.13 22.12 22.50
1 2 22.01 22.05 22.16 22.50
1 5 22.04 22.04 22.18 22.50
3 0 22.07 22.08 22.11 22.50
3 2 21.98 22.11 22.12 22.50
3 3 22.03 22.09 22.17 22.50
6 0 21.02 21.14 21.15 21.50
16QAM
1 0 21.18 21.16 21.26 21.50
1 2 21.22 21.05 21.15 21.50
1 5 21.04 21.15 21.16 21.50
3 0 21.05 21.09 21.13 21.50
3 2 21.10 21.08 21.14 21.50
3 3 21.00 21.11 21.11 21.50
6 0 20.06 20.23 20.18 20.50
Bandwidth Modulation RB size RB offset
Channel/Frequency (MHz) Tune-up
Limit
(dBm) 18615/1851.5 18900/1880 19185/1908.5
3MHz
QPSK
1 0 22.09 22.17 22.15 22.50
1 7 22.04 22.10 22.20 22.50
1 14 22.07 22.09 22.22 22.50
8 0 21.17 21.20 21.24 21.50
8 4 21.10 21.21 21.24 21.50
8 7 21.13 21.20 21.27 21.50
15 0 21.05 21.18 21.18 21.50
16QAM 1 0 21.21 21.18 21.29 21.50
1 7 21.25 21.10 21.19 21.50

FCC SAR Test Report Report No: RXA1710-0342SAR
TA Technology (Shanghai) Co., Ltd. TA-MB-04-003S Page 36 of 147 This report shall not be reproduced except in full, without the written approval of TA Technology (Shanghai) Co., Ltd.
1 14 21.06 21.19 21.19 21.50
8 0 20.16 20.22 20.25 20.50
8 4 20.21 20.21 20.26 20.50
8 7 20.10 20.23 20.24 20.50
15 0 20.09 20.27 20.21 20.50
Bandwidth Modulation RB size RB offset
Channel/Frequency (MHz) Tune-up
Limit
(dBm) 18625/1852.5 18900/1880 19175/1907.5
5MHz
QPSK
1 0 22.06 22.15 22.11 22.50
1 13 22.02 22.06 22.17 22.50
1 24 22.04 22.04 22.18 22.50
12 0 21.14 21.15 21.20 21.50
12 6 21.08 21.17 21.19 21.50
12 13 21.11 21.18 21.23 21.50
25 0 21.03 21.17 21.16 21.50
16QAM
1 0 21.18 21.14 21.26 21.50
1 13 21.22 21.08 21.16 21.50
1 24 21.03 21.17 21.15 21.50
12 0 20.14 20.18 20.22 20.50
12 6 20.18 20.16 20.22 20.50
12 13 20.07 20.18 20.20 20.50
25 0 20.07 20.23 20.16 20.50
Bandwidth Modulation RB size RB offset
Channel/Frequency (MHz) Tune-up
Limit
(dBm) 18650/1855 18900/1880 19150/1905
10MHz
QPSK
1 0 22.08 22.16 22.14 22.50
1 25 22.05 22.11 22.21 22.50
1 49 22.06 22.08 22.21 22.50
25 0 21.17 21.20 21.24 21.50
25 13 21.11 21.22 21.23 21.50
25 25 21.13 21.22 21.28 21.50
50 0 21.11 21.19 21.20 21.50
16QAM
1 0 21.20 21.17 21.28 21.50
1 25 21.25 21.12 21.19 21.50
1 49 21.06 21.19 21.18 21.50
25 0 20.17 20.23 20.26 20.50
25 13 20.20 20.20 20.25 20.50
25 25 20.10 20.23 20.24 20.50
50 0 20.10 20.28 20.20 20.50
Bandwidth Modulation RB size RB offset
Channel/Frequency (MHz) Tune-up
Limit
(dBm) 18675/1857.5 18900/1880 19125/1902.5
15MHz QPSK 1 0 22.07 22.12 22.12 22.50

FCC SAR Test Report Report No: RXA1710-0342SAR
TA Technology (Shanghai) Co., Ltd. TA-MB-04-003S Page 37 of 147 This report shall not be reproduced except in full, without the written approval of TA Technology (Shanghai) Co., Ltd.
1 38 22.03 22.10 22.18 22.50
1 74 22.03 22.03 22.17 22.50
36 0 21.15 21.16 21.21 21.50
36 18 21.08 21.17 21.19 21.50
36 39 21.10 21.19 21.24 21.50
75 0 21.09 21.15 21.15 21.50
16QAM
1 0 21.15 21.15 21.26 21.50
1 38 21.23 21.09 21.17 21.50
1 74 21.03 21.15 21.15 21.50
36 0 20.14 20.21 20.23 20.50
36 18 20.17 20.15 20.21 20.50
36 39 20.08 20.19 20.21 20.50
75 0 20.07 20.23 20.16 20.50
Bandwidth Modulation RB size RB offset
Channel/Frequency (MHz) Tune-up
Limit
(dBm) 18700/1860 18900/1880 19100/1900
20MHz
QPSK
1 0 22.04 22.08 22.09 22.50
1 50 22.02 22.06 22.16 22.50
1 99 22.01 22.02 22.14 22.50
50 0 21.12 21.11 21.17 21.50
50 25 21.06 21.13 21.16 21.50
50 50 21.07 21.14 21.20 21.50
100 0 21.06 21.10 21.11 21.50
16QAM
1 0 21.13 21.11 21.21 21.50
1 50 21.19 21.07 21.13 21.50
1 99 21.01 21.12 21.13 21.50
50 0 20.11 20.17 20.20 20.50
50 25 20.14 20.13 20.18 20.50
50 50 20.05 20.14 20.17 20.50
100 0 20.05 20.19 20.13 20.50

FCC SAR Test Report Report No: RXA1710-0342SAR
TA Technology (Shanghai) Co., Ltd. TA-MB-04-003S Page 38 of 147 This report shall not be reproduced except in full, without the written approval of TA Technology (Shanghai) Co., Ltd.
LTE FDD Band 5 Conducted Power(dBm) Tune-up
Limit
(dBm) Bandwidth Modulation RB size RB offset
Channel/Frequency (MHz)
20407/824.7 20525/836.5 20643/848.3
1.4MHz
QPSK
1 0 22.02 21.87 21.95 22.50
1 2 21.92 21.90 21.93 22.50
1 5 21.89 21.80 21.90 22.50
3 0 21.93 21.93 21.89 22.50
3 2 21.88 21.91 21.90 22.50
3 3 21.91 21.86 21.89 22.50
6 0 20.94 20.94 20.98 21.50
16QAM
1 0 21.15 21.28 21.15 21.50
1 2 21.09 21.19 21.08 21.50
1 5 21.03 21.35 21.03 21.50
3 0 21.25 21.25 21.24 21.50
3 2 21.28 21.29 21.28 21.50
3 3 21.23 21.27 21.22 21.50
6 0 20.26 20.36 20.30 20.50
Bandwidth Modulation RB size RB offset
Channel/Frequency (MHz) Tune-up
Limit
(dBm) 20415/825.5 20525/836.5 20635/847.5
3MHz
QPSK
1 0 22.04 21.91 21.98 22.50
1 7 21.95 21.95 21.97 22.50
1 14 21.92 21.85 21.94 22.50
8 0 21.03 21.05 21.02 21.50
8 4 21.00 21.01 21.02 21.50
8 7 21.01 20.97 20.99 21.50
15 0 20.97 20.98 21.01 21.50
16QAM
1 0 21.18 21.30 21.18 21.50
1 7 21.12 21.24 21.12 21.50
1 14 21.05 21.39 21.06 21.50
8 0 20.36 20.38 20.36 20.50
8 4 20.39 20.42 20.40 20.50
8 7 20.33 20.39 20.35 20.50
15 0 20.29 20.40 20.33 20.50
Bandwidth Modulation RB size RB offset
Channel/Frequency (MHz) Tune-up
Limit
(dBm) 20425/826.5 20525/836.5 20625/846.5
5MHz QPSK
1 0 22.01 21.89 21.94 22.50
1 13 21.93 21.91 21.94 22.50
1 24 21.89 21.80 21.90 22.50
12 0 21.00 21.00 20.98 21.50
12 6 20.98 20.97 20.97 21.50
FCC SAR Test Report Report No: RXA1710-0342SAR
TA Technology (Shanghai) Co., Ltd. TA-MB-04-003S Page 39 of 147 This report shall not be reproduced except in full, without the written approval of TA Technology (Shanghai) Co., Ltd.
12 13 20.99 20.95 20.95 21.50
25 0 20.95 20.97 20.99 21.50
16QAM
1 0 21.15 21.26 21.15 21.50
1 13 21.09 21.22 21.09 21.50
1 24 21.02 21.37 21.02 21.50
12 0 20.34 20.34 20.33 20.50
12 6 20.36 20.37 20.36 20.50
12 13 20.30 20.34 20.31 20.50
25 0 20.27 20.36 20.28 20.50
Bandwidth Modulation RB size RB offset
Channel/Frequency (MHz) Tune-up
Limit
(dBm) 20450/829 20525/836.5 20600/844
10MHz
QPSK
1 0 21.99 21.82 21.92 22.50
1 25 21.93 21.91 21.93 22.50
1 49 21.86 21.78 21.86 22.50
25 0 20.98 20.96 20.95 21.50
25 13 20.96 20.93 20.94 21.50
25 25 20.95 20.91 20.92 21.50
50 0 20.98 20.90 20.94 21.50
16QAM
1 0 21.10 21.23 21.10 21.50
1 25 21.06 21.21 21.06 21.50
1 49 21.00 21.32 21.00 21.50
25 0 20.31 20.33 20.31 20.50
25 13 20.32 20.34 20.32 20.50
25 25 20.28 20.30 20.28 20.50
50 0 20.25 20.32 20.25 20.50

FCC SAR Test Report Report No: RXA1710-0342SAR
TA Technology (Shanghai) Co., Ltd. TA-MB-04-003S Page 40 of 147 This report shall not be reproduced except in full, without the written approval of TA Technology (Shanghai) Co., Ltd.
LTE FDD Band 13 Conducted Power(dBm) Tune-up
Limit
(dBm) Bandwidth Modulation RB size RB offset
Channel/Frequency (MHz)
23205/779.5 23230/782 23255/784.5
5MHz
QPSK
1 0 21.67 21.62 21.76 22.00
1 13 21.71 21.71 21.73 22.00
1 24 21.63 21.66 21.59 22.00
12 0 20.75 20.64 20.76 21.00
12 6 20.72 20.72 20.75 21.00
12 13 20.71 20.73 20.73 21.00
25 0 20.70 20.67 20.67 21.00
16QAM
1 0 20.80 20.94 20.73 21.00
1 13 20.92 20.91 20.91 21.00
1 24 20.81 20.90 20.69 21.00
12 0 19.73 19.71 19.72 20.00
12 6 19.79 19.73 19.77 20.00
12 13 19.77 19.71 19.68 20.00
25 0 19.72 19.73 19.64 20.00
Bandwidth Modulation RB size RB offset
Channel/Frequency (MHz) Tune-up
Limit
(dBm) / 23230/782 /
10MHz
QPSK
1 0 / 21.63 / 22.00
1 25 / 21.69 / 22.00
1 49 / 21.68 / 22.00
25 0 / 20.73 / 21.00
25 13 / 20.72 / 21.00
25 25 / 20.75 / 21.00
50 0 / 20.72 / 21.00
16QAM
1 0 / 20.72 / 21.00
1 25 / 20.78 / 21.00
1 49 / 20.71 / 21.00
25 0 / 19.74 / 20.00
25 13 / 19.75 / 20.00
25 25 / 19.76 / 20.00
50 0 / 19.71 / 20.00

FCC SAR Test Report Report No: RXA1710-0342SAR
TA Technology (Shanghai) Co., Ltd. TA-MB-04-003S Page 41 of 147 This report shall not be reproduced except in full, without the written approval of TA Technology (Shanghai) Co., Ltd.
LTE FDD Band 17 Conducted Power(dBm) Tune-up
Limit
(dBm) Bandwidth Modulation RB size RB offset
Channel/Frequency (MHz)
23755/706.5 23790/710 23825/713.5
5MHz
QPSK
1 0 22.14 22.19 22.10 22.50
1 13 22.18 22.03 22.02 22.50
1 24 22.22 22.22 22.16 22.50
12 0 21.24 21.24 21.26 21.50
12 6 21.24 21.27 21.23 21.50
12 13 21.18 21.30 21.27 21.50
25 0 21.26 21.29 21.29 21.50
16QAM
1 0 21.20 21.26 21.35 21.50
1 13 21.22 21.26 21.12 21.50
1 24 21.08 21.22 21.23 21.50
12 0 20.22 20.22 20.15 20.50
12 6 20.24 20.19 20.19 20.50
12 13 20.23 20.21 20.25 20.50
25 0 20.26 20.30 20.25 20.50
Bandwidth Modulation RB size RB offset
Channel/Frequency (MHz) Tune-up
Limit
(dBm) 23780/709 23790/710 23800/711
10MHz
QPSK
1 0 22.12 22.12 22.08 22.50
1 25 22.18 22.03 22.01 22.50
1 49 22.19 22.20 22.12 22.50
25 0 21.22 21.20 21.23 21.50
25 13 21.22 21.23 21.20 21.50
25 25 21.14 21.26 21.24 21.50
50 0 21.29 21.22 21.24 21.50
16QAM
1 0 21.15 21.23 21.30 21.50
1 25 21.19 21.25 21.09 21.50
1 49 21.06 21.17 21.21 21.50
25 0 20.19 20.21 20.13 20.50
25 13 20.20 20.16 20.15 20.50
25 25 20.21 20.17 20.22 20.50
50 0 20.24 20.26 20.22 20.50

FCC SAR Test Report Report No: RXA1710-0342SAR
TA Technology (Shanghai) Co., Ltd. TA-MB-04-003S Page 42 of 147 This report shall not be reproduced except in full, without the written approval of TA Technology (Shanghai) Co., Ltd.
9.4 WLAN Mode
Wi-Fi
2.4G Channel Frequency
(MHz)
Average Conducted Power (dBm)
for Data Rates (bps) Tune-up
Limit (dBm)
TX Power
Setting levelMode 1M
802.11b
1 2412 13.55 14.00
16 6 2437 13.52 14.00
11 2462 13.40 14.00
Mode Channel Frequency
(MHz) 6M
Tune-up
Limit (dBm)
TX Power
Setting level
802.11g
1 2412 10.93 11.50
13.5 6 2437 11.09 11.50
11 2462 10.87 11.50
Mode Channel Frequency
(MHz) 6.5M
Tune-up
Limit (dBm)
TX Power
Setting level
802.11n
(HT20)
1 2412 10.40 11.00
12.5 6 2437 10.49 11.00
11 2462 10.02 11.00
Mode Channel Frequency
(MHz) 13.5M
Tune-up
Limit (dBm)
TX Power
Setting level
802.11n
(HT40)
3 2422 10.24 11.00
12.5 6 2437 10.66 11.00
9 2452 9.72 11.00
Note. 1. SAR is not required for OFDM when the highest reported SAR for DSSS is adjusted by the ratio of
OFDM to DSSS specified maximum output power and the adjusted SAR is ≤ 1.2 W/kg.

FCC SAR Test Report Report No: RXA1710-0342SAR
TA Technology (Shanghai) Co., Ltd. TA-MB-04-003S Page 43 of 147 This report shall not be reproduced except in full, without the written approval of TA Technology (Shanghai) Co., Ltd.
9.5 Bluetooth Mode
BT
Conducted Power(dBm) Tune-up
Limit (dBm) Channel/Frequency(MHz)
Ch 0/2402 MHz Ch 39/2441 MHz Ch 78/2480 MHz
GFSK 5.42 5.37 5.38 6.00
π/4DQPSK 4.80 4.82 4.75 6.00
8DPSK 4.88 4.92 4.87 6.00
BLE Ch 0/2402 MHz Ch 19/2440 MHz Ch 39/2480 MHz Tune-up
Limit (dBm)
GFSK 5.01 4.74 4.62 6.00

FCC SAR Test Report Report No: RXA1710-0342SAR
TA Technology (Shanghai) Co., Ltd. TA-MB-04-003S Page 44 of 147 This report shall not be reproduced except in full, without the written approval of TA Technology (Shanghai) Co., Ltd.
10 Measured and Reported (Scaled) SAR Results
10.1 EUT Antenna Locations
Overall (Length x Width): 152 mm x 75 mm
Overall Diagonal: 163 mm/Display Diagonal: 141mm
Distance of the Antenna to the EUT surface/edge
Antenna Back Side Front side Left Edge Right Edge Top Edge Bottom Edge
Main-Antenna (Tx/Rx) 0 0 0 0 139 0
Diversity antenna (Rx) 0 0 27 0 0 130
BT/Wi-Fi Antenna 0 0 0 60 0 130
Hotspot mode, Positions for SAR tests
Mode Back Side Front side Left Edge Right Edge Top Edge Bottom Edge
GSM 850/1900 Yes Yes Yes Yes N/A Yes
UMTS Band II/IV/V Yes Yes Yes Yes N/A Yes
LTE 2/5/13/17 Yes Yes Yes Yes N/A Yes
WIFI 2.4G Yes Yes Yes N/A Yes N/A
Note: 1. Per KDB 941225 D06, when the overall device length and width are ≥ 9cm*5cm, the test distance is 10mm.
SAR must be measured for all sides and surfaces with a transmitting antenna located within 25mm from that surface
or edge.
2.For smart phones with an overall diagonal dimension is 163mm. Per KDB 648474 D04, for smart phones with a
display diagonal dimension > 15.0 cm or an overall diagonal dimension> 16.0 cm, 10-g extremity SAR must be
tested as a phablet to determine SAR compliance.

FCC SAR Test Report Report No: RXA1710-0342SAR
TA Technology (Shanghai) Co., Ltd. TA-MB-04-003S Page 45 of 147 This report shall not be reproduced except in full, without the written approval of TA Technology (Shanghai) Co., Ltd.
10.2 Standalone SAR test exclusion considerations
Per KDB 447498 D01, the 1-g and 10-g SAR test exclusion thresholds for 100 MHz to 6 GHz at test
separation distances ≤ 50 mm are determined by:
[(max. power of channel, including tune-up tolerance, mW)/(min. test separation distance,
mm)] ·[√f(GHz)] ≤ 3.0 for 1-g SAR and ≤ 7.5 for 10-g extremity SAR
f(GHz) is the RF channel transmit frequency in GHz
Power and distance are rounded to the nearest mW and mm before calculation
The result is rounded to one decimal place for comparison
Per KDB 447498 D01, when the minimum test separation distance is < 5 mm, a distance of 5 mm is
applied to determine SAR test exclusion.
Bluetooth Distance
(mm)
MAX Power
(dBm)
Frequency
(MHz) Ratio Evaluation
Head 5 6.00 2441 1.24 No
Body-worn 10 6.00 2441 0.62 No
Extremity 5 6.00 2441 1.24 No

FCC SAR Test Report Report No: RXA1710-0342SAR
TA Technology (Shanghai) Co., Ltd. TA-MB-04-003S Page 46 of 147 This report shall not be reproduced except in full, without the written approval of TA Technology (Shanghai) Co., Ltd.
10.3 Measured SAR Results
Table 1: GSM 850
Test
Position
Cover
Type
Channel/
Frequency
(MHz)
Time
slot
Duty
Cycle
Tune-up
limit
(dBm)
Conducted
Power (dBm)
Drift
(dB)
Measured
SAR1g
(W/kg)
Scaling
Factor
Reported
SAR1g
(W/kg)
Plot
No.
Head SAR
Left Cheek standard 190/836.6 GSM 1:8.3 33.50 32.57 -0.032 0.187 1.24 0.232 9
Left Tilt standard 190/836.6 GSM 1:8.3 33.50 32.57 0.040 0.111 1.24 0.138 /
Right Cheek standard 190/836.6 GSM 1:8.3 33.50 32.57 0.110 0.160 1.24 0.198 /
Right Tilt standard 190/836.6 GSM 1:8.3 33.50 32.57 0.120 0.120 1.24 0.149 /
Body-worn (Distance 10mm)
Back Side standard 190/836.6 GSM 1:8.3 33.50 32.57 0.02 0.414 1.24 0.513 10
Front Side standard 190/836.6 GSM 1:8.3 33.50 32.57 0.02 0.401 1.24 0.497 /
Hotspot (Distance 10mm)
Back Side standard 190/836.6 4Txslots 1:2.07 30.00 29.29 -0.040 0.437 1.18 0.515 11
Front Side standard 190/836.6 4Txslots 1:2.07 30.00 29.29 0.030 0.171 1.18 0.201 /
Left Edge standard 190/836.6 4Txslots 1:2.07 30.00 29.29 -0.040 0.245 1.18 0.289 /
Right Edge standard 190/836.6 4Txslots 1:2.07 30.00 29.29 0.030 0.112 1.18 0.132 /
Top Edge N/A N/A N/A N/A N/A N/A N/A N/A N/A N/A N/A
Bottom Edge standard 190/836.6 4Txslots 1:2.07 30.00 29.29 0.000 0.300 1.18 0.353 /
Note: 1.The value with blue color is the maximum SAR Value of each test band.
2. Per FCC KDB Publication 447498 D01, if the reported (scaled) SAR measured at the middle channel or highest output power
channel for each test configuration is ≤ 0.8 W/kg then testing at the other channels is not required for such test configuration(s).
3. When multiple slots are used, SAR should be tested to account for the maximum source-based time-averaged output power.
4. Per FCC KDB Publication 648474 D04, SAR was evaluated without a headset connected to the device. Since the reported SAR
was ≤ 1.2 W/kg, no additional SAR evaluations using a headset cable were required.
5. According to 648474 D04 Handset SAR v01r03,For Phablet, Since hotspot mode 1-g reported SAR < 1.2 W/kg, 10-g extremity
SAR is no required.

FCC SAR Test Report Report No: RXA1710-0342SAR
TA Technology (Shanghai) Co., Ltd. TA-MB-04-003S Page 47 of 147 This report shall not be reproduced except in full, without the written approval of TA Technology (Shanghai) Co., Ltd.
Table 2: GSM 1900
Test
Position
Cover
Type
Channel/
Frequency
(MHz)
Time
slot
Duty
Cycle
Tune-up
limit
(dBm)
Conducted
Power
(dBm)
Drift
(dB)
Measured
SAR1g
(W/kg)
Scaling
Factor
Reported
SAR1g
(W/kg)
Plot
No.
Head SAR
Left Cheek standard 661/1880 GSM 1:8.3 30.50 29.46 0.063 0.078 1.27 0.098 12
Left Tilt standard 661/1880 GSM 1:8.3 30.50 29.46 0.060 0.026 1.27 0.033 /
Right Cheek standard 661/1880 GSM 1:8.3 30.50 29.46 0.093 0.052 1.27 0.066 /
Right Tilt standard 661/1880 GSM 1:8.3 30.50 29.46 0.026 0.042 1.27 0.053 /
Body-worn (Distance 10mm)
Back Edge Standard 661/1880 GSM 1:8.3 30.50 29.46 -0.04 0.314 1.27 0.399 13
Front Edge Standard 661/1880 GSM 1:8.3 30.50 29.46 0.06 0.298 1.27 0.379 /
Hotspot (Distance 10mm)
Back Side standard 661/1880 4Txslots 1:2.07 26.50 25.96 0.11 0.402 1.13 0.455 /
Front Side standard 661/1880 4Txslots 1:2.07 26.50 25.96 -0.12 0.311 1.13 0.352 /
Left Edge standard 661/1880 4Txslots 1:2.07 26.50 25.96 0.03 0.057 1.13 0.065 /
Right Edge standard 661/1880 4Txslots 1:2.07 26.50 25.96 0.02 0.063 1.13 0.071 /
Top Edge N/A N/A N/A N/A N/A N/A N/A N/A N/A N/A N/A
Bottom Edge standard 661/1880 4Txslots 1:2.07 26.50 25.96 0.15 0.551 1.13 0.624 14
Note: 1.The value with blue color is the maximum SAR Value of each test band.
2. Per FCC KDB Publication 447498 D01, if the reported (scaled) SAR measured at the middle channel or highest output power
channel for each test configuration is ≤ 0.8 W/kg then testing at the other channels is not required for such test configuration(s).
3. When multiple slots are used, SAR should be tested to account for the maximum source-based time-averaged output power.
4. Per FCC KDB Publication 648474 D04, SAR was evaluated without a headset connected to the device. Since the reported SAR
was ≤ 1.2 W/kg, no additional SAR evaluations using a headset cable were required.
5. According to 648474 D04 Handset SAR v01r03,For Phablet, Since hotspot mode 1-g reported SAR < 1.2 W/kg, 10-g extremity
SAR is no required.

FCC SAR Test Report Report No: RXA1710-0342SAR
TA Technology (Shanghai) Co., Ltd. TA-MB-04-003S Page 48 of 147 This report shall not be reproduced except in full, without the written approval of TA Technology (Shanghai) Co., Ltd.
Table 3: UMTS Band II
Test
Position
Cover
Type
Channel/
Frequency
(MHz)
Channel
Type
Duty
Cycle
Tune-up
limit
(dBm)
Conducted
Power
(dBm)
Drift
(dB)
Measured
SAR1g
(W/kg)
Scaling
Factor
Reported
SAR1g
(W/kg)
Plot
No.
Head SAR
Left Cheek standard 9400/1880 RMC 12.2K 1:1 22.50 22.13 0.090 0.155 1.09 0.169 15
Left Tilt standard 9400/1880 RMC 12.2K 1:1 22.50 22.13 0.083 0.044 1.09 0.047 /
Right Cheek standard 9400/1880 RMC 12.2K 1:1 22.50 22.13 0.103 0.086 1.09 0.094 /
Right Tilt standard 9400/1880 RMC 12.2K 1:1 22.50 22.13 0.040 0.071 1.09 0.078 /
Body SAR (Distance 10mm)
Back Side standard 9400/1880 RMC 12.2K 1:1 22.50 22.13 0.020 0.524 1.09 0.571 16
Front Side standard 9400/1880 RMC 12.2K 1:1 22.50 22.13 -0.040 0.402 1.09 0.438 /
Left Edge standard 9400/1880 RMC 12.2K 1:1 22.50 22.13 0.032 0.077 1.09 0.084 /
Right Edge standard 9400/1880 RMC 12.2K 1:1 22.50 22.13 0.140 0.083 1.09 0.090 /
Top Edge N/A N/A N/A N/A N/A N/A N/A N/A N/A N/A N/A
Bottom Edge standard 9400/1880 RMC 12.2K 1:1 22.50 22.13 0.030 0.669 1.09 0.728 17
Note: 1.The value with blue color is the maximum SAR Value of each test band.
2. Per FCC KDB Publication 447498 D01, if the reported (scaled) SAR measured at the middle channel or highest output
power channel for each test configuration is ≤ 0.8 W/kg then testing at the other channels is not required for such test
configuration(s).
3. Per FCC KDB Publication 648474 D04, SAR was evaluated without a headset connected to the device. Since the
reported SAR was ≤ 1.2 W/kg, no additional SAR evaluations using a headset cable were required.
4. According to 648474 D04 Handset SAR v01r03,For Phablet, Since hotspot mode 1-g reported SAR < 1.2 W/kg, 10-g
extremity SAR is no required.

FCC SAR Test Report Report No: RXA1710-0342SAR
TA Technology (Shanghai) Co., Ltd. TA-MB-04-003S Page 49 of 147 This report shall not be reproduced except in full, without the written approval of TA Technology (Shanghai) Co., Ltd.
Table 4: UMTS Band V
Test
Position
Cover
Type
Channel/
Frequency
(MHz)
Channel
Type
Duty
Cycle
Tune-up
limit
(dBm)
Conducted
Power
(dBm)
Drift
(dB)
Measured
SAR1g
(W/kg)
Scaling
Factor
Reported
SAR1g
(W/kg)
Plot
No.
Head SAR
Left Cheek standard 4183/836.6 RMC 12.2K 1:1 23.00 22.31 -0.044 0.204 1.17 0.239 18
Left Tilt standard 4183/836.6 RMC 12.2K 1:1 23.00 22.31 0.080 0.115 1.17 0.135 /
Right Cheek standard 4183/836.6 RMC 12.2K 1:1 23.00 22.31 0.000 0.178 1.17 0.209 /
Right Tilt standard 4183/836.6 RMC 12.2K 1:1 23.00 22.31 0.080 0.127 1.17 0.149 /
Body SAR (Distance 10mm)
Back Side standard 4183/836.6 RMC 12.2K 1:1 23.00 22.31 0.060 0.309 1.17 0.362 19
Front Side standard 4183/836.6 RMC 12.2K 1:1 23.00 22.31 0.070 0.131 1.17 0.154 /
Left Edge standard 4183/836.6 RMC 12.2K 1:1 23.00 22.31 0.050 0.219 1.17 0.257 /
Right Edge standard 4183/836.6 RMC 12.2K 1:1 23.00 22.31 0.050 0.092 1.17 0.108 /
Top Edge N/A N/A N/A N/A N/A N/A N/A N/A N/A N/A N/A
Bottom Edge standard 4183/836.6 RMC 12.2K 1:1 23.00 22.31 0.070 0.301 1.17 0.353 /
Note: 1.The value with blue color is the maximum SAR Value of each test band.
2. Per FCC KDB Publication 447498 D01, if the reported (scaled) SAR measured at the middle channel or highest output
power channel for each test configuration is ≤ 0.8 W/kg then testing at the other channels is not required for such test
configuration(s).
3. Per FCC KDB Publication 648474 D04, SAR was evaluated without a headset connected to the device. Since the
reported SAR was ≤ 1.2 W/kg, no additional SAR evaluations using a headset cable were required.
4. According to 648474 D04 Handset SAR v01r03,For Phablet, Since hotspot mode 1-g reported SAR < 1.2 W/kg, 10-g
extremity SAR is no required.

FCC SAR Test Report Report No: RXA1710-0342SAR
TA Technology (Shanghai) Co., Ltd. TA-MB-04-003S Page 50 of 147 This report shall not be reproduced except in full, without the written approval of TA Technology (Shanghai) Co., Ltd.
Table 5: LTE Band 2 (20MHz)
Test
Position
Cover
Type
RB
size
RB
offset
Channel/
Frequency
(MHz)
Maximum
Allowed
Power(dBm)
Conducted
Power
(dBm)
Drift
(dB)
Measured
SAR1g
(W/kg)
Scaling
Factor
Reported
SAR1g
(W/kg)
Plot
No.
Head SAR (QPSK)
Left Cheek standard 1RB 50 19100/1900 22.50 22.16 0.175 0.141 1.08 0.152 20
Left Tilt standard 1RB 50 19100/1900 22.50 22.16 0.045 0.030 1.08 0.033 /
Right Cheek standard 1RB 50 19100/1900 22.50 22.16 0.117 0.080 1.08 0.087 /
Right Tilt standard 1RB 50 19100/1900 22.50 22.16 -0.033 0.075 1.08 0.081 /
Left Cheek standard 50%RB 50 19100/1900 21.50 21.20 0.184 0.101 1.07 0.108 /
Left Tilt standard 50%RB 50 19100/1900 21.50 21.20 0.092 0.029 1.07 0.031 /
Right Cheek standard 50%RB 50 19100/1900 21.50 21.20 0.110 0.072 1.07 0.077 /
Right Tilt standard 50%RB 50 19100/1900 21.50 21.20 0.051 0.068 1.07 0.073 /
Body SAR (Distance 10mm)
Back Side standard 1RB 50 19100/1900 22.50 22.16 -0.110 0.505 1.08 0.546 21
Front Side standard 1RB 50 19100/1900 22.50 22.16 -0.01 0.399 1.08 0.431 /
Left Edge standard 1RB 50 19100/1900 22.50 22.16 -0.023 0.079 1.08 0.085 /
Right Edge standard 1RB 50 19100/1900 22.50 22.16 0.150 0.066 1.08 0.072 /
Top Edge N/A N/A N/A N/A N/A N/A N/A N/A N/A N/A N/A
Bottom
Edge
standard 1RB 50 19100/1900 22.50 22.16 -0.028 0.717 1.08 0.775 /
standard 1RB 0 18900/1880 22.50 22.08 0.033 0.777 1.10 0.856 22
standard 1RB 0 18700/1860 22.50 22.04 0.037 0.547 1.11 0.608 /
Back Side standard 50%RB 50 19100/1900 21.50 21.20 0.140 0.498 1.07 0.534 /
Front Side standard 50%RB 50 19100/1900 21.50 21.20 0.100 0.393 1.07 0.421 /
Left Edge standard 50%RB 50 19100/1900 21.50 21.20 -0.160 0.071 1.07 0.077 /
Right Edge standard 50%RB 50 19100/1900 21.50 21.20 0.040 0.055 1.07 0.059 /
Top Edge N/A N/A N/A N/A N/A N/A N/A N/A N/A N/A N/A
Bottom
Edge
standard 50%RB 50 19100/1900 21.50 21.20 0.057 0.768 1.07 0.823 /
standard 50%RB 50 18900/1880 21.50 21.14 0.190 0.543 1.09 0.590 /
standard 50%RB 0 18700/1860 21.50 21.12 0.047 0.448 1.09 0.489 /
Bottom
Edge
standard 100%RB 0 19100/1900 21.50 21.11 0.063 0.754 1.09 0.825 /
standard 100%RB 0 18900/1880 21.50 21.10 0.047 0.649 1.10 0.712 /
standard 100%RB 0 18700/1860 21.50 21.06 -0.010 0.397 1.11 0.439 /
Note: 1.The value with blue color is the maximum SAR Value of each test band.
2. Per FCC KDB Publication 447498 D01, if the reported (scaled) SAR measured at the middle channel or highest output power
channel for each test configuration is ≤ 2 W/kg then testing at the other channels is not required for such test configuration(s).
3. For QPSK with 100% RB allocation, SAR is required when and the highest reported SAR for 1 RB and 50% RB allocation in are ≥
0.8 W/kg.
4. According to 648474 D04 Handset SAR v01r03,For Phablet, Since hotspot mode 1-g reported SAR < 1.2 W/kg, 10-g extremity
SAR is no required.

FCC SAR Test Report Report No: RXA1710-0342SAR
TA Technology (Shanghai) Co., Ltd. TA-MB-04-003S Page 51 of 147 This report shall not be reproduced except in full, without the written approval of TA Technology (Shanghai) Co., Ltd.
Table 6: LTE Band 5 (10MHz)
Test
Position
Cover
Type
RB
size
RB
offset
Channel/
Frequency
(MHz)
Maximum
Allowed
Power
(dBm)
Conducted
Power
(dBm)
Drift
(dB)
Measured
SAR1g
(W/kg)
Scaling
Factor
Reported
SAR1g
(W/kg)
Plot
No.
Head SAR (QPSK)
Left Cheek standard 1RB 0 20450/829 22.50 21.99 -0.034 0.199 1.12 0.224 23
Left Tilt standard 1RB 0 20450/829 22.50 21.99 0.110 0.104 1.12 0.117 /
Right Cheek standard 1RB 0 20450/829 22.50 21.99 0.060 0.134 1.12 0.151 /
Right Tilt standard 1RB 0 20450/829 22.50 21.99 0.080 0.114 1.12 0.128 /
Left Cheek standard 50%RB 0 20450/829 21.50 20.98 0.020 0.127 1.13 0.143 /
Left Tilt standard 50%RB 0 20450/829 21.50 20.98 0.150 0.083 1.13 0.093 /
Right Cheek standard 50%RB 0 20450/829 21.50 20.98 0.025 0.107 1.13 0.121 /
Right Tilt standard 50%RB 0 20450/829 21.50 20.98 0.130 0.091 1.13 0.103 /
Body SAR (Distance 10mm)
Back Side standard 1RB 0 20450/829 22.50 21.99 0.000 0.266 1.12 0.299 24
Front Side standard 1RB 0 20450/829 22.50 21.99 0.020 0.129 1.12 0.145 /
Left Edge standard 1RB 0 20450/829 22.50 21.99 -0.010 0.198 1.12 0.223 /
Right Edge standard 1RB 0 20450/829 22.50 21.99 0.080 0.083 1.12 0.093 /
Top Edge N/A N/A N/A N/A N/A N/A N/A N/A N/A N/A N/A
Bottom Edge standard 1RB 0 20450/829 22.50 21.99 0.060 0.209 1.12 0.235 /
Back Side standard 50%RB 0 20450/829 21.50 20.98 0.000 0.207 1.13 0.233 /
Front Side standard 50%RB 0 20450/829 21.50 20.98 0.030 0.102 1.13 0.115 /
Left Edge standard 50%RB 0 20450/829 21.50 20.98 0.030 0.157 1.13 0.177 /
Right Edge standard 50%RB 0 20450/829 21.50 20.98 0.080 0.065 1.13 0.073 /
Top Edge N/A N/A N/A N/A N/A N/A N/A N/A N/A N/A N/A
Bottom Edge standard 50%RB 0 20450/829 21.50 20.98 0.040 0.174 1.13 0.196 /
Note: 1.The value with blue color is the maximum SAR Value of each test band.
2. Per FCC KDB Publication 447498 D01, if the reported (scaled) SAR measured at the middle channel or highest output power
channel for each test configuration is ≤ 0.8 W/kg then testing at the other channels is not required for such test configuration(s).
3. For QPSK with 100% RB allocation, SAR is required when and the highest reported SAR for 1 RB and 50% RB allocation in are
≥ 0.8 W/kg.
4. According to 648474 D04 Handset SAR v01r03,For Phablet, Since hotspot mode 1-g reported SAR < 1.2 W/kg, 10-g extremity
SAR is no required.

FCC SAR Test Report Report No: RXA1710-0342SAR
TA Technology (Shanghai) Co., Ltd. TA-MB-04-003S Page 52 of 147 This report shall not be reproduced except in full, without the written approval of TA Technology (Shanghai) Co., Ltd.
Table 7: LTE Band 13 (10MHz)
Test
Position
Cover
Type
RB
size
RB
offset
Channel/
Frequency
(MHz)
Maximum
Allowed
Power
(dBm)
Conducted
Power
(dBm)
Drift
(dB)
Measured
SAR1g
(W/kg)
Scaling
Factor
Reported
SAR1g
(W/kg)
Plot
No.
Head SAR (QPSK)
Left Cheek standard 1RB 25 23230/782 22.00 21.69 0.022 0.199 1.07 0.214 25
Left Tilt standard 1RB 25 23230/782 22.00 21.69 0.160 0.098 1.07 0.105 /
Right Cheek standard 1RB 25 23230/782 22.00 21.69 0.052 0.128 1.07 0.137 /
Right Tilt standard 1RB 25 23230/782 22.00 21.69 0.090 0.084 1.07 0.090 /
Left Cheek standard 50%RB 25 23230/782 21.00 20.75 0.024 0.120 1.06 0.127 /
Left Tilt standard 50%RB 25 23230/782 21.00 20.75 0.022 0.078 1.06 0.082 /
Right Cheek standard 50%RB 25 23230/782 21.00 20.75 0.041 0.102 1.06 0.108 /
Right Tilt standard 50%RB 25 23230/782 21.00 20.75 0.180 0.067 1.06 0.071 /
Body SAR (Distance 10mm)
Back Side standard 1RB 25 23230/782 22.00 21.69 0.040 0.315 1.07 0.338 26
Front Side standard 1RB 25 23230/782 22.00 21.69 0.030 0.126 1.07 0.135 /
Left Edge standard 1RB 25 23230/782 22.00 21.69 0.060 0.162 1.07 0.174 /
Right Edge standard 1RB 25 23230/782 22.00 21.69 -0.020 0.102 1.07 0.110 /
Top Edge N/A N/A N/A N/A N/A N/A N/A N/A N/A N/A N/A
Bottom
Edge standard 1RB 25 23230/782 22.00 21.69 -0.020 0.112 1.07 0.120 /
Back Side standard 50%RB 25 23230/782 21.00 20.75 0.000 0.189 1.06 0.200 /
Front Side standard 50%RB 25 23230/782 21.00 20.75 0.020 0.099 1.06 0.105 /
Left Edge standard 50%RB 25 23230/782 21.00 20.75 0.020 0.128 1.06 0.136 /
Right Edge standard 50%RB 25 23230/782 21.00 20.75 0.020 0.081 1.06 0.086 /
Top Edge N/A N/A N/A N/A N/A N/A N/A N/A N/A N/A N/A
Bottom
Edge standard 50%RB 25 23230/782 21.00 20.75 -0.020 0.091 1.06 0.096 /
Note: 1.The value with blue color is the maximum SAR Value of each test band.
2. Per FCC KDB Publication 447498 D01, if the reported (scaled) SAR measured at the middle channel or highest output power
channel for each test configuration is ≤ 0.8 W/kg then testing at the other channels is not required for such test configuration(s).
3. For QPSK with 100% RB allocation, SAR is required when and the highest reported SAR for 1 RB and 50% RB allocation in
are ≥ 0.8 W/kg.
4. According to 648474 D04 Handset SAR v01r03,For Phablet, Since hotspot mode 1-g reported SAR < 1.2 W/kg, 10-g extremity
SAR is no required.

FCC SAR Test Report Report No: RXA1710-0342SAR
TA Technology (Shanghai) Co., Ltd. TA-MB-04-003S Page 53 of 147 This report shall not be reproduced except in full, without the written approval of TA Technology (Shanghai) Co., Ltd.
Table 8: LTE Band 17 (10MHz)
Test
Position
Cover
Type
RB
size
RB
offset
Channel/
Frequency
(MHz)
Maximum
Allowed
Power
(dBm)
Conducted
Power
(dBm)
Drift
(dB)
Measured
SAR1g
(W/kg)
Scaling
Factor
Reported
SAR1g
(W/kg)
Plot
No.
Head SAR (QPSK)
Left Cheek standard 1RB 49 23790/710 22.50 22.20 -0.028 0.158 1.07 0.169 27
Left Tilt standard 1RB 49 23790/710 22.50 22.20 0.033 0.129 1.07 0.138 /
Right Cheek standard 1RB 49 23790/710 22.50 22.20 0.180 0.080 1.07 0.086 /
Right Tilt standard 1RB 49 23790/710 22.50 22.20 0.034 0.115 1.07 0.123 /
Left Cheek standard 50%RB 25 23790/710 22.50 22.20 0.023 0.081 1.07 0.087 /
Left Tilt standard 50%RB 25 23790/710 21.50 21.26 -0.021 0.103 1.06 0.109 /
Right Cheek standard 50%RB 25 23790/710 21.50 21.26 0.170 0.064 1.06 0.068 /
Right Tilt standard 50%RB 25 23790/710 21.50 21.26 0.033 0.092 1.06 0.097 /
Body SAR (Distance 10mm)
Back Side standard 1RB 49 23790/710 22.50 22.20 0.000 0.293 1.07 0.314 28
Front Side standard 1RB 49 23790/710 22.50 22.20 0.030 0.145 1.07 0.155 /
Left Edge standard 1RB 49 23790/710 22.50 22.20 0.040 0.159 1.07 0.170 /
Right Edge standard 1RB 49 23790/710 22.50 22.20 -0.030 0.131 1.07 0.140 /
Top Edge N/A N/A N/A N/A N/A N/A N/A N/A N/A N/A N/A
Bottom Edge standard 1RB 49 23790/710 22.50 22.20 0.042 0.090 1.07 0.096 /
Back Side standard 50%RB 25 23790/710 21.50 21.26 0.150 0.213 1.06 0.225 /
Front Side standard 50%RB 25 23790/710 21.50 21.26 0.010 0.117 1.06 0.124 /
Left Edge standard 50%RB 25 23790/710 21.50 21.26 -0.040 0.126 1.06 0.133 /
Right Edge standard 50%RB 25 23790/710 21.50 21.26 -0.030 0.107 1.06 0.113 /
Top Edge N/A N/A N/A N/A N/A N/A N/A N/A N/A N/A N/A
Bottom Edge standard 50%RB 25 23790/710 21.50 21.26 0.080 0.071 1.06 0.075 /
Note: 1.The value with blue color is the maximum SAR Value of each test band.
2. Per FCC KDB Publication 447498 D01, if the reported (scaled) SAR measured at the middle channel or highest output power
channel for each test configuration is ≤ 0.8 W/kg then testing at the other channels is not required for such test configuration(s).
3. For QPSK with 100% RB allocation, SAR is required when and the highest reported SAR for 1 RB and 50% RB allocation in
are ≥ 0.8 W/kg.
4. According to 648474 D04 Handset SAR v01r03,For Phablet, Since hotspot mode 1-g reported SAR < 1.2 W/kg, 10-g extremity
SAR is no required.

FCC SAR Test Report Report No: RXA1710-0342SAR
TA Technology (Shanghai) Co., Ltd. TA-MB-04-003S Page 54 of 147 This report shall not be reproduced except in full, without the written approval of TA Technology (Shanghai) Co., Ltd.
Table 9: Wi-Fi (2.4G)
Test
Position
Cover
Type
Channel/
Frequency
(MHz)
Mode
802.11b
Duty
Cycle
(%)
Area
Scan
Max.SAR
(W/Kg)
Tune-up
limit
(dBm)
Conducted
Power
(dBm)
Drift
(dB)
Measured
SAR1g
(W/kg)
Scaling
Factor
Reported
SAR1g
(W/kg)
Plot
No.
Head SAR
Left Cheek standard 1/2412 DSSS 99.67 0.266 14.00 13.55 0.010 0.286 1.11 0.318 /
Left Tilt standard 1/2412 DSSS 99.67 0.181 14.00 13.55 -0.021 0.195 1.11 0.217 /
Right Cheek standard 1/2412 DSSS 99.67 0.439 14.00 13.55 0.130 0.515 1.11 0.573 29
Right Tilt standard 1/2412 DSSS 99.67 0.362 14.00 13.55 0.190 0.364 1.11 0.405 /
Hotspot (Distance 10mm)
Back Side standard 1/2412 DSSS 99.67 0.111 14.00 13.55 0.180 0.111 1.11 0.124 /
Front Side standard 1/2412 DSSS 99.67 0.120 14.00 13.55 -0.160 0.122 1.11 0.136 30
Left Edge standard 1/2412 DSSS 99.67 0.0882 14.00 13.55 0.090 0.095 1.11 0.105 /
Right Edge N/A N/A N/A N/A N/A N/A N/A N/A N/A N/A N/A N/A
Top Edge standard 1/2412 DSSS 99.67 0.058 14.00 13.55 -0.120 0.060 1.11 0.066 /
Bottom Edge N/A N/A N/A N/A N/A N/A N/A N/A N/A N/A N/A N/A
Note: 1. The value with blue color is the maximum SAR Value of each test band.
2. According to 648474 D04 Handset SAR v01r03,For Phablet, Since hotspot mode 1-g reported SAR < 1.2 W/kg, 10-g extremity
SAR is no required.

FCC SAR Test Report Report No: RXA1710-0342SAR
TA Technology (Shanghai) Co., Ltd. TA-MB-04-003S Page 55 of 147 This report shall not be reproduced except in full, without the written approval of TA Technology (Shanghai) Co., Ltd.
Table 10: BT
Band Configuration Frequency
(MHz)
Maximum
Power
(dBm)
Separation
Distance
(mm)
Estimated
SAR
(W/kg)
Bluetooth Body-worn 2441 6 10 0.083
For simultaneous transmission analysis, Bluetooth SAR is estimated per KDB 447498 D01 based on the formula
below.
(max. power of channel, including tune-up tolerance, mW)/(min. test separation distance, mm)]·[√f(GHz)/x] W/kg
for test separation distances ≤ 50 mm; where x = 7.5 for 1-g SAR, and x = 18.75 for 10-g SAR.

FCC SAR Test Report Report No: RXA1710-0342SAR
TA Technology (Shanghai) Co., Ltd. TA-MB-04-003S Page 56 of 147 This report shall not be reproduced except in full, without the written approval of TA Technology (Shanghai) Co., Ltd.
10.4 Simultaneous Transmission Analysis
Simultaneous Transmission Configurations Head Body-worn Hotspot
Product
Specific
10-g SAR
GSM(Voice) + Bluetooth(data) N/A Yes N/A N/A
GPRS/EDGE(Data) + Bluetooth(data) N/A Yes N/A N/A
WCDMA(Voice) + Bluetooth(data) N/A Yes N/A N/A
WCDMA(Data) + Bluetooth(data) N/A Yes N/A N/A
LTE(Data) + Bluetooth(data) N/A Yes N/A N/A
GSM(Voice) + Wi-Fi-2.4GHz(data) Yes Yes N/A N/A
GPRS/EDGE(Data) + Wi-Fi-2.4GHz(data) N/A Yes Yes N/A
WCDMA(Voice) + Wi-Fi-2.4GHz(data) Yes Yes N/A N/A
WCDMA(Data) + Wi-Fi-2.4GHz(data) N/A Yes Yes N/A
LTE(Data) + Wi-Fi-2.4GHz(data) Yes Yes Yes N/A
Wi-Fi-2.4GHz(data) + Bluetooth(data) N/A N/A N/A N/A
General Note:
1. The Scaled SAR summation is calculated based on the same configuration and test position.
2. Per KDB 447498 D01, simultaneous transmission SAR is compliant if,
i) Scalar SAR summation < 1.6W/kg, simultaneously transmission SAR measurement is not
necessary.
ii) SPLSR = (SAR1 + SAR2)^1.5 / (min. separation distance, mm), and the peak separation
distance is determined from the square root of [(x1-x2)2 + (y1-y2)2 + (z1-z2)2], where (x1, y1, z1)
and (x2, y2, z2) are the coordinates of the extrapolated peak SAR locations in the zoom scan.
iii) If SPLSR ≤ 0.04, simultaneously transmission SAR measurement is not necessary.
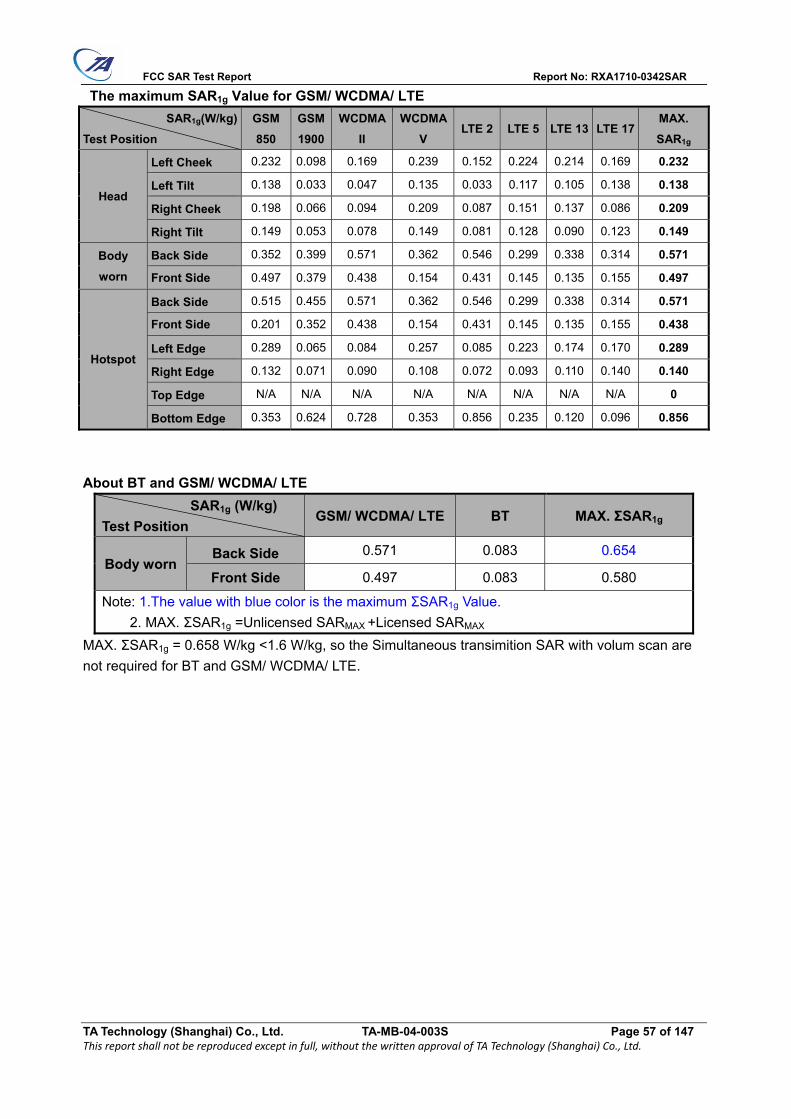
FCC SAR Test Report Report No: RXA1710-0342SAR
TA Technology (Shanghai) Co., Ltd. TA-MB-04-003S Page 57 of 147 This report shall not be reproduced except in full, without the written approval of TA Technology (Shanghai) Co., Ltd.
The maximum SAR1g Value for GSM/ WCDMA/ LTE
SAR1g(W/kg)
Test Position
GSM
850
GSM
1900
WCDMA
II
WCDMA
V LTE 2 LTE 5 LTE 13 LTE 17
MAX.
SAR1g
Head
Left Cheek 0.232 0.098 0.169 0.239 0.152 0.224 0.214 0.169 0.232
Left Tilt 0.138 0.033 0.047 0.135 0.033 0.117 0.105 0.138 0.138
Right Cheek 0.198 0.066 0.094 0.209 0.087 0.151 0.137 0.086 0.209
Right Tilt 0.149 0.053 0.078 0.149 0.081 0.128 0.090 0.123 0.149
Body
worn
Back Side 0.352 0.399 0.571 0.362 0.546 0.299 0.338 0.314 0.571
Front Side 0.497 0.379 0.438 0.154 0.431 0.145 0.135 0.155 0.497
Hotspot
Back Side 0.515 0.455 0.571 0.362 0.546 0.299 0.338 0.314 0.571
Front Side 0.201 0.352 0.438 0.154 0.431 0.145 0.135 0.155 0.438
Left Edge 0.289 0.065 0.084 0.257 0.085 0.223 0.174 0.170 0.289
Right Edge 0.132 0.071 0.090 0.108 0.072 0.093 0.110 0.140 0.140
Top Edge N/A N/A N/A N/A N/A N/A N/A N/A 0
Bottom Edge 0.353 0.624 0.728 0.353 0.856 0.235 0.120 0.096 0.856
About BT and GSM/ WCDMA/ LTE
SAR1g (W/kg)
Test Position GSM/ WCDMA/ LTE BT MAX. ΣSAR1g
Body worn Back Side 0.571 0.083 0.654
Front Side 0.497 0.083 0.580
Note: 1.The value with blue color is the maximum ΣSAR1g Value.
2. MAX. ΣSAR1g =Unlicensed SARMAX +Licensed SARMAX
MAX. ΣSAR1g = 0.658 W/kg <1.6 W/kg, so the Simultaneous transimition SAR with volum scan are
not required for BT and GSM/ WCDMA/ LTE.

FCC SAR Test Report Report No: RXA1710-0342SAR
TA Technology (Shanghai) Co., Ltd. TA-MB-04-003S Page 58 of 147 This report shall not be reproduced except in full, without the written approval of TA Technology (Shanghai) Co., Ltd.
About Wi-Fi and GSM/ WCDMA/ LTE
SAR1g/10g(W/kg)
Test Position GSM/ WCDMA/ LTE Wi-Fi 2.4G MAX. ΣSAR1g
Head
Left, Cheek 0.232 0.318 0.550
Left, Tilt 0.138 0.217 0.355
Right, Cheek 0.209 0.573 0.782
Right, Tilt 0.149 0.405 0.554
Body worn Back Side 0.571 0.124 0.695
Front Side 0.497 0.136 0.633
Hotspot
Back Side 0.571 0.124 0.695
Front Side 0.438 0.136 0.574
Left Edge 0.289 0.105 0.394
Right Edge 0.140 0 0.140
Top Edge 0 0.066 0.066
Bottom Edge 0.856 0 0.856
Note: 1.The value with blue color is the maximum ΣSAR1g Value.
2. MAX. ΣSAR1g=Unlicensed SARMAX +Licensed SARMAX
MAX. ΣSAR1g = 0.856 W/kg <1.6 W/kg, so the Simultaneous transimition SAR with volum scan are
not required for Wi-Fi and GSM/ WCDMA/ LTE

FCC SAR Test Report Report No: RXA1710-0342SAR
TA Technology (Shanghai) Co., Ltd. TA-MB-04-003S Page 59 of 147 This report shall not be reproduced except in full, without the written approval of TA Technology (Shanghai) Co., Ltd.
11 Measurement Uncertainty
Per KDB 865664 D01 SAR Measurement 100 MHz to 6 GHz, when the highest measured 1-g SAR
within a frequency band is < 1.5 W/kg, the extensive SAR measurement uncertainty analysis
described in IEEE Std 1528- 2013 is not required in SAR reports submitted for equipment approval.

FCC SAR Test Report Report No: RXA1710-0342SAR
TA Technology (Shanghai) Co., Ltd. TA-MB-04-003S Page 60 of 147 This report shall not be reproduced except in full, without the written approval of TA Technology (Shanghai) Co., Ltd.
ANNEX A: Test Layout

FCC SAR Test Report Report No: RXA1710-0342SAR
TA Technology (Shanghai) Co., Ltd. TA-MB-04-003S Page 61 of 147 This report shall not be reproduced except in full, without the written approval of TA Technology (Shanghai) Co., Ltd.
Picture 3: Liquid depth in the head Phantom (750MHz, 15.3cm depth)
Picture 4: Liquid depth in the flat Phantom (750MHz, 15.4cm depth)

FCC SAR Test Report Report No: RXA1710-0342SAR
TA Technology (Shanghai) Co., Ltd. TA-MB-04-003S Page 62 of 147 This report shall not be reproduced except in full, without the written approval of TA Technology (Shanghai) Co., Ltd.
Picture 5: Liquid depth in the head Phantom (835MHz, 15.3cm depth)
Picture 6: Liquid depth in the flat Phantom (835MHz, 15.4cm depth)

FCC SAR Test Report Report No: RXA1710-0342SAR
TA Technology (Shanghai) Co., Ltd. TA-MB-04-003S Page 63 of 147 This report shall not be reproduced except in full, without the written approval of TA Technology (Shanghai) Co., Ltd.
Picture 7: liquid depth in the head Phantom (1900 MHz, 15.3cm depth)
Picture 8: Liquid depth in the flat Phantom (1900 MHz, 15.2cm depth)

FCC SAR Test Report Report No: RXA1710-0342SAR
TA Technology (Shanghai) Co., Ltd. TA-MB-04-003S Page 64 of 147 This report shall not be reproduced except in full, without the written approval of TA Technology (Shanghai) Co., Ltd.
Picture 9: Liquid depth in the head Phantom (2450 MHz, 15.4cm depth)
Picture 10: Liquid depth in the flat Phantom (2450 MHz, 15.3cm depth)

FCC SAR Test Report Report No: RXA1710-0342SAR
TA Technology (Shanghai) Co., Ltd. TA-MB-04-003S Page 65 of 147 This report shall not be reproduced except in full, without the written approval of TA Technology (Shanghai) Co., Ltd.
ANNEX B: System Check Results
Plot 1 System Performance Check at 750 MHz Head TSL DUT: Dipole 750 MHz; Type: D750V3; Serial: D750V3 - SN: 1017
Date: 10/18/2017
Communication System: CW (0); Frequency: 750 MHz;Duty Cycle: 1:1
Medium parameters used: f = 750 MHz; σ = 0.90 S/m; εr = 41.1; ρ = 1000 kg/m3
Ambient Temperature:22.3 Liquid Temperature: 21.5
Phantom section: Flat Section
DASY5 Configuration:
Sensor-Surface: 4mm (Mechanical Surface Detection)
Probe: EX3DV4 - SN3677; ConvF(9.58, 9.58, 9.58); Calibrated: 1/23/2017;
Electronics: DAE4 Sn1291; Calibrated: 1/19/2017
Phantom: SAM1; Type: SAM; Serial: TP-1534
Measurement SW: DASY52, Version 52.8 (8); SEMCAD X Version 14.6.10 (7331)
d=15mm,Pin=250mW/Area Scan (41x121x1): Interpolated grid: dx=1.500 mm, dy=1.500 mm
Maximum value of SAR (interpolated) = 2.29 W/kg
d=15mm,Pin=250mW/Zoom Scan (5x5x7)/Cube 0: Measurement grid: dx=8mm, dy=8mm,
dz=5mm
Reference Value = 50.653 V/m; Power Drift = -0.08 dB
Peak SAR (extrapolated) = 3.16 W/kg
SAR(1 g) = 2.13 W/kg; SAR(10 g) = 1.41 W/kg
Maximum value of SAR (measured) = 2.29 W/kg
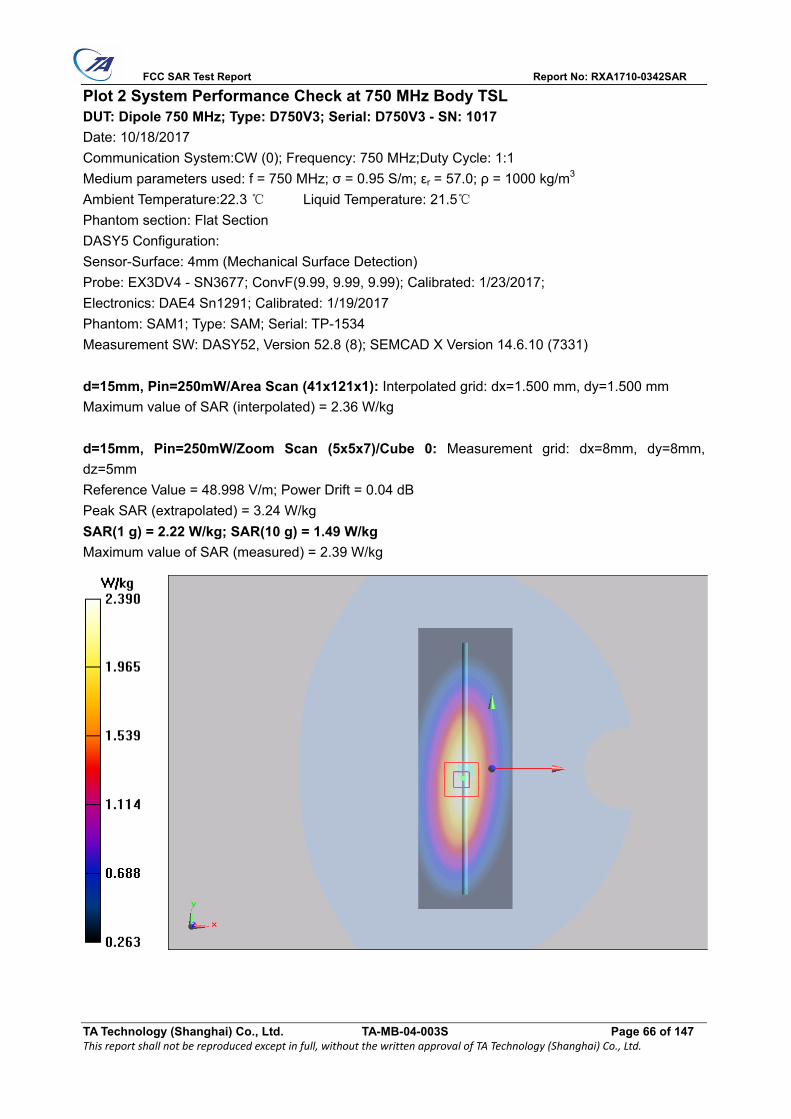
FCC SAR Test Report Report No: RXA1710-0342SAR
TA Technology (Shanghai) Co., Ltd. TA-MB-04-003S Page 66 of 147 This report shall not be reproduced except in full, without the written approval of TA Technology (Shanghai) Co., Ltd.
Plot 2 System Performance Check at 750 MHz Body TSL DUT: Dipole 750 MHz; Type: D750V3; Serial: D750V3 - SN: 1017
Date: 10/18/2017
Communication System:CW (0); Frequency: 750 MHz;Duty Cycle: 1:1
Medium parameters used: f = 750 MHz; σ = 0.95 S/m; εr = 57.0; ρ = 1000 kg/m3
Ambient Temperature:22.3 Liquid Temperature: 21.5
Phantom section: Flat Section
DASY5 Configuration:
Sensor-Surface: 4mm (Mechanical Surface Detection)
Probe: EX3DV4 - SN3677; ConvF(9.99, 9.99, 9.99); Calibrated: 1/23/2017;
Electronics: DAE4 Sn1291; Calibrated: 1/19/2017
Phantom: SAM1; Type: SAM; Serial: TP-1534
Measurement SW: DASY52, Version 52.8 (8); SEMCAD X Version 14.6.10 (7331)
d=15mm, Pin=250mW/Area Scan (41x121x1): Interpolated grid: dx=1.500 mm, dy=1.500 mm
Maximum value of SAR (interpolated) = 2.36 W/kg
d=15mm, Pin=250mW/Zoom Scan (5x5x7)/Cube 0: Measurement grid: dx=8mm, dy=8mm,
dz=5mm
Reference Value = 48.998 V/m; Power Drift = 0.04 dB
Peak SAR (extrapolated) = 3.24 W/kg
SAR(1 g) = 2.22 W/kg; SAR(10 g) = 1.49 W/kg
Maximum value of SAR (measured) = 2.39 W/kg

FCC SAR Test Report Report No: RXA1710-0342SAR
TA Technology (Shanghai) Co., Ltd. TA-MB-04-003S Page 67 of 147 This report shall not be reproduced except in full, without the written approval of TA Technology (Shanghai) Co., Ltd.
Plot 3 System Performance Check at 835 MHz Head TSL DUT: Dipole 835 MHz; Type: D835V2; Serial: D835V2 - SN: 4d020
Date: 10/19/2017
Communication System: CW; Frequency: 835 MHz;Duty Cycle: 1:1
Medium parameters used: f = 835 MHz; σ = 0.94 mho/m; εr = 42.5; ρ = 1000 kg/m3
Ambient Temperature:22.3 Liquid Temperature: 21.5
Phantom section: Flat Section
DASY5 Configuration:
Sensor-Surface: 4mm (Mechanical Surface Detection)
Probe: EX3DV4 - SN3677; ConvF(9.31, 9.31, 9.31); Calibrated: 1/23/2017;
Electronics: DAE4 Sn1291; Calibrated: 1/19/2017
Phantom: SAM1; Type: SAM; Serial: TP-1534
Measurement SW: DASY52, Version 52.8 (8); SEMCAD X Version 14.6.10 (7331)
d=15mm, Pin=250mW/Area Scan (41x121x1): Measurement grid: dx=1.500 mm, dy=1.500 mm
Maximum value of SAR (interpolated) = 2.64 mW/g
d=15mm, Pin=250mW/Zoom Scan (5x5x7)/Cube 0: Measurement grid: dx=8mm, dy=8mm,
dz=5mm
Reference Value = 54.4 V/m; Power Drift = -0.076 dB
Peak SAR (extrapolated) = 3.67 W/kg
SAR(1 g) = 2.44 mW/g; SAR(10 g) = 1.6 mW/g
Maximum value of SAR (measured) = 2.64 mW/g

FCC SAR Test Report Report No: RXA1710-0342SAR
TA Technology (Shanghai) Co., Ltd. TA-MB-04-003S Page 68 of 147 This report shall not be reproduced except in full, without the written approval of TA Technology (Shanghai) Co., Ltd.
Plot 4 System Performance Check at 835 MHz Body TSL DUT: Dipole 835 MHz; Type: D835V2; Serial: D835V2 - SN: 4d020
Date: 10/20/2017
Communication System: CW; Frequency: 835 MHz;Duty Cycle: 1:1
Medium parameters used: f = 835 MHz; σ = 0.97 mho/m; εr = 55.4; ρ = 1000 kg/m3
Ambient Temperature:22.3 Liquid Temperature: 21.5
Phantom section: Flat Section
DASY5 Configuration:
Sensor-Surface: 4mm (Mechanical Surface Detection)
Probe: EX3DV4 - SN3677; ConvF(9.74, 9.74, 9.74); Calibrated: 1/23/2017;
Electronics: DAE4 Sn1291; Calibrated: 1/19/2017
Phantom: SAM1; Type: SAM; Serial: TP-1534
Measurement SW: DASY52, Version 52.8 (8); SEMCAD X Version 14.6.10 (7331)
d=15mm, Pin=250mW/Area Scan (41x121x1): Measurement grid: dx=1.500 mm, dy=1.500 mm
Maximum value of SAR (interpolated) = 2.58 mW/g
d=15mm, Pin=250mW/Zoom Scan (5x5x7)/Cube 0: Measurement grid: dx=8mm, dy=8mm,
dz=5mm
Reference Value = 51.9 V/m; Power Drift = -0.058 dB
Peak SAR (extrapolated) = 3.5 W/kg
SAR(1 g) = 2.41 mW/g; SAR(10 g) = 1.6 mW/g
Maximum value of SAR (measured) = 2.6 mW/g

FCC SAR Test Report Report No: RXA1710-0342SAR
TA Technology (Shanghai) Co., Ltd. TA-MB-04-003S Page 69 of 147 This report shall not be reproduced except in full, without the written approval of TA Technology (Shanghai) Co., Ltd.
Plot 5 System Performance Check at 1900 MHz Head TSL DUT: Dipole 1900 MHz; Type: D1900V2; Serial: D1900V2 - SN: 5d060
Date: 10/21/2017
Communication System: CW; Frequency: 1900 MHz;Duty Cycle: 1:1
Medium parameters used: f = 1900 MHz; σ = 1.38 mho/m; εr = 39.0; ρ = 1000 kg/m3
Ambient Temperature:22.3 Liquid Temperature: 21.5
Phantom section: Flat Section
DASY5 Configuration:
Sensor-Surface: 4mm (Mechanical Surface Detection)
Probe: EX3DV4 - SN3677; ConvF(8.39, 8.39, 8.39); Calibrated: 1/23/2017;
Electronics: DAE4 Sn1291; Calibrated: 1/19/2017
Phantom: SAM1; Type: SAM; Serial: TP-1534
Measurement SW: DASY52, Version 52.8 (8); SEMCAD X Version 14.6.10 (7331)
d=10mm, Pin=250mW/Area Scan (41x71x1): Measurement grid: dx=1.500 mm, dy=1.500 mm
Maximum value of SAR (interpolated) = 11.3 mW/g
d=10mm, Pin=250mW/Zoom Scan (5x5x7)/Cube 0: Measurement grid: dx=8mm, dy=8mm,
dz=5mm
Reference Value = 85.5 V/m; Power Drift = 0.028 dB
Peak SAR (extrapolated) = 17.8 W/kg
SAR(1 g) = 9.48 mW/g; SAR(10 g) = 4.9 mW/g
Maximum value of SAR (measured) = 10.7 mW/g

FCC SAR Test Report Report No: RXA1710-0342SAR
TA Technology (Shanghai) Co., Ltd. TA-MB-04-003S Page 70 of 147 This report shall not be reproduced except in full, without the written approval of TA Technology (Shanghai) Co., Ltd.
Plot 6 System Performance Check at 1900 MHz Body TSL DUT: Dipole 1900 MHz; Type: D1900V2; Serial: D1900V2 - SN: 5d060
Date: 10/22/2017
Communication System: CW; Frequency: 1900 MHz;Duty Cycle: 1:1
Medium parameters used: f = 1900 MHz; σ = 1.49mho/m; εr = 51.6; ρ = 1000 kg/m3
Ambient Temperature:22.3 Liquid Temperature: 21.5
Phantom section: Flat Section
DASY5 Configuration:
Sensor-Surface: 4mm (Mechanical Surface Detection)
Probe: EX3DV4 - SN3677; ConvF(7.98, 7.98, 7.98); Calibrated: 1/23/2017;
Electronics: DAE4 Sn1291; Calibrated: 1/19/2017
Phantom: SAM1; Type: SAM; Serial: TP-1534
Measurement SW: DASY52, Version 52.8 (8); SEMCAD X Version 14.6.10 (7331)
d=10mm, Pin=250mW/Area Scan (41x71x1): Measurement grid: dx=1.500 mm, dy=1.500 mm
Maximum value of SAR (interpolated) = 12.2 mW/g
d=10mm, Pin=250mW/Zoom Scan (5x5x7)/Cube 0: Measurement grid: dx=8mm, dy=8mm,
dz=5mm
Reference Value = 82.3 V/m; Power Drift = 0.068 dB
Peak SAR (extrapolated) = 17.8 W/kg
SAR(1 g) = 9.93 mW/g; SAR(10 g) = 5.25 mW/g
Maximum value of SAR (measured) = 11.3 mW/g

FCC SAR Test Report Report No: RXA1710-0342SAR
TA Technology (Shanghai) Co., Ltd. TA-MB-04-003S Page 71 of 147 This report shall not be reproduced except in full, without the written approval of TA Technology (Shanghai) Co., Ltd.
Plot 7 System Performance Check at 2450 MHz Head TSL DUT: Dipole 2450 MHz; Type: D2450V2; Serial: D2450V2 - SN: 786
Date: 10/23/2017
Communication System: CW; Frequency: 2450 MHz;Duty Cycle: 1:1
Medium parameters used: f = 2450 MHz; σ = 1.82 mho/m; εr = 40.6; ρ = 1000 kg/m3
Ambient Temperature:22.3 Liquid Temperature: 21.5
Phantom section: Flat Section
DASY5 Configuration:
Sensor-Surface: 4mm (Mechanical Surface Detection)
Probe: EX3DV4 - SN3677; ConvF(7.90, 7.90, 7.90); Calibrated: 1/23/2017;
Electronics: DAE4 Sn1291; Calibrated: 1/19/2017
Phantom: SAM1; Type: SAM; Serial: TP-1534
Measurement SW: DASY52, Version 52.8 (8); SEMCAD X Version 14.6.10 (7331)
d=10mm, Pin=250mW/Area Scan (41x71x1): Measurement grid: dx=1.200 mm, dy=1.200 mm
Maximum value of SAR (interpolated) = 18.2 mW/g
d=10mm, Pin=250mW/Zoom Scan (7x7x7)/Cube 0: Measurement grid: dx=5mm, dy=5mm,
dz=5mm
Reference Value = 88.8 V/m; Power Drift = 0.075 dB
Peak SAR (extrapolated) = 30 W/kg
SAR(1 g) = 13.7 mW/g; SAR(10 g) = 6.22 mW/g
Maximum value of SAR (measured) = 15.9 mW/g

FCC SAR Test Report Report No: RXA1710-0342SAR
TA Technology (Shanghai) Co., Ltd. TA-MB-04-003S Page 72 of 147 This report shall not be reproduced except in full, without the written approval of TA Technology (Shanghai) Co., Ltd.
Plot 8 System Performance Check at 2450 MHz Body TSL DUT: Dipole 2450 MHz; Type: D2450V2; Serial: D2450V2 - SN: 786
Date: 10/23/2017
Communication System: CW; Frequency: 2450 MHz;Duty Cycle: 1:1
Medium parameters used: f = 2450 MHz; σ = 1.95 mho/m; εr = 51.1; ρ = 1000 kg/m3
Ambient Temperature:22.3 Liquid Temperature: 21.5
Phantom section: Flat Section
DASY5 Configuration:
Sensor-Surface: 4mm (Mechanical Surface Detection)
Probe: EX3DV4 - SN3677; ConvF(7.85, 7.85, 7.85); Calibrated: 1/23/2017;
Electronics: DAE4 Sn1291; Calibrated: 1/19/2017
Phantom: SAM1; Type: SAM; Serial: TP-1534
Measurement SW: DASY52, Version 52.8 (8); SEMCAD X Version 14.6.10 (7331)
d=10mm, Pin=250mW/Area Scan (41x71x1): Measurement grid: dx=1.200 mm, dy=1.200 mm
Maximum value of SAR (interpolated) = 16 mW/g
d=10mm, Pin=250mW/Zoom Scan (7x7x7)/Cube 0: Measurement grid: dx=5mm, dy=5mm,
dz=5mm
Reference Value = 81.2 V/m; Power Drift = 0.003 dB
Peak SAR (extrapolated) = 25.4 W/kg
SAR(1 g) = 12.5 mW/g; SAR(10 g) = 6.20 mW/g
Maximum value of SAR (measured) = 14.4 mW/g

FCC SAR Test Report Report No: RXA1710-0342SAR
TA Technology (Shanghai) Co., Ltd. TA-MB-04-003S Page 73 of 147 This report shall not be reproduced except in full, without the written approval of TA Technology (Shanghai) Co., Ltd.
ANNEX C: Highest Graph Results
Plot 9 GSM 850 Left Cheek Middle Date: 10/19/2017
Communication System: UID 0, GSM (0); Frequency: 836.6 MHz;Duty Cycle: 1:8.30042
Medium parameters used: f = 837 MHz; σ = 0.934 S/m; εr = 41.065; ρ = 1000 kg/m3
Ambient Temperature:22.3 Liquid Temperature: 21.5
Phantom section: Left Section
DASY5 Configuration:
Sensor-Surface: 4mm (Mechanical Surface Detection)
Probe: EX3DV4 - SN3677; ConvF(9.31, 9.31, 9.31); Calibrated: 1/23/2017;
Electronics: DAE4 Sn1291; Calibrated: 1/19/2017
Phantom: SAM1; Type: SAM; Serial: TP-1534
Measurement SW: DASY52, Version 52.8 (8); SEMCAD X Version 14.6.10 (7331)
Left Cheek Middle/Area Scan (71x121x1): Interpolated grid: dx=1.500 mm, dy=1.500 mm
Maximum value of SAR (interpolated) = 0.197 W/kg
Left Cheek Middle/Zoom Scan (5x5x7)/Cube 0: Measurement grid: dx=8mm, dy=8mm, dz=5mm
Reference Value = 5.378 V/m; Power Drift = -0.032 dB
Peak SAR (extrapolated) = 0.239 W/kg
SAR(1 g) = 0.187 W/kg; SAR(10 g) = 0.140 W/kg
Maximum value of SAR (measured) = 0.195 W/kg

FCC SAR Test Report Report No: RXA1710-0342SAR
TA Technology (Shanghai) Co., Ltd. TA-MB-04-003S Page 74 of 147 This report shall not be reproduced except in full, without the written approval of TA Technology (Shanghai) Co., Ltd.
Plot 10 GSM 850 Back Side Middle (Distance 10mm) Date: 10/20/2017
Communication System: UID 0, GSM (0); Frequency: 836.6 MHz;Duty Cycle: 1:8.30042
Medium parameters used: f = 837 MHz; σ = 1.001 S/m; εr = 54.375; ρ = 1000 kg/m3
Ambient Temperature:22.3 Liquid Temperature: 21.5
Phantom section: Flat Section
DASY5 Configuration:
Sensor-Surface: 4mm (Mechanical Surface Detection)
Probe: EX3DV4 - SN3677; ConvF(9.74, 9.74, 9.74); Calibrated: 1/23/2017;
Electronics: DAE4 Sn1291; Calibrated: 1/19/2017
Phantom: SAM1; Type: SAM; Serial: TP-1534
Measurement SW: DASY52, Version 52.8 (8); SEMCAD X Version 14.6.10 (7331)
Back Side Middle/Area Scan (71x121x1): Interpolated grid: dx=1.500 mm, dy=1.500 mm
Maximum value of SAR (interpolated) = 0.436 W/kg
Back Side Middle/Zoom Scan (5x5x7)/Cube 0: Measurement grid: dx=8mm, dy=8mm, dz=5mm
Reference Value = 14.02 V/m; Power Drift = 0.02 dB
Peak SAR (extrapolated) = 0.599 W/kg
SAR(1 g) = 0.414 W/kg; SAR(10 g) = 0.258 W/kg
Maximum value of SAR (measured) = 0.439 W/kg

FCC SAR Test Report Report No: RXA1710-0342SAR
TA Technology (Shanghai) Co., Ltd. TA-MB-04-003S Page 75 of 147 This report shall not be reproduced except in full, without the written approval of TA Technology (Shanghai) Co., Ltd.
Plot 11 GSM 850 GPRS (4Txslots) Back Side Middle (Distance 10mm) Date: 10/20/2017
Communication System: UID 0, 4 slot GPRS (0); Frequency: 836.6 MHz;Duty Cycle: 1:2.07491
Medium parameters used: f = 837 MHz; σ = 1.001 S/m; εr = 54.375; ρ = 1000 kg/m3
Ambient Temperature:22.3 Liquid Temperature: 21.5
Phantom section: Flat Section
DASY5 Configuration:
Sensor-Surface: 4mm (Mechanical Surface Detection)
Probe: EX3DV4 - SN3677; ConvF(9.74, 9.74, 9.74); Calibrated: 1/23/2017;
Electronics: DAE4 Sn1291; Calibrated: 1/19/2017
Phantom: SAM1; Type: SAM; Serial: TP-1534
Measurement SW: DASY52, Version 52.8 (8); SEMCAD X Version 14.6.10 (7331)
Back Side Middle/Area Scan (71x121x1): Interpolated grid: dx=1.500 mm, dy=1.500 mm
Maximum value of SAR (interpolated) = 0.460 W/kg
Back Side Middle/Zoom Scan (5x5x7)/Cube 0: Measurement grid: dx=8mm, dy=8mm, dz=5mm
Reference Value = 17.97 V/m; Power Drift = -0.04 dB
Peak SAR (extrapolated) = 0.752 W/kg
SAR(1 g) = 0.437 W/kg; SAR(10 g) = 0.244 W/kg
Maximum value of SAR (measured) = 0.490 W/kg

FCC SAR Test Report Report No: RXA1710-0342SAR
TA Technology (Shanghai) Co., Ltd. TA-MB-04-003S Page 76 of 147 This report shall not be reproduced except in full, without the written approval of TA Technology (Shanghai) Co., Ltd.
Plot 12 GSM 1900 Left Cheek Middle Date: 10/21/2017
Communication System: UID 0, GSM 1900 (0); Frequency: 1880 MHz;Duty Cycle: 1:8.30042
Medium parameters used: f = 1880 MHz; σ = 1.375 S/m; εr = 40.539; ρ = 1000 kg/m3
Ambient Temperature:22.3 Liquid Temperature: 21.5
Phantom section: Left Section
DASY5 Configuration:
Sensor-Surface: 4mm (Mechanical Surface Detection)
Probe: EX3DV4 - SN3677; ConvF(8.39, 8.39, 8.39); Calibrated: 1/23/2017;
Electronics: DAE4 Sn1291; Calibrated: 1/19/2017
Phantom: SAM 2; Type: SAM;
Measurement SW: DASY52, Version 52.8 (8); SEMCAD X Version 14.6.10 (7331)
Left Cheek Middle/Area Scan (71x121x1): Interpolated grid: dx=1.500 mm, dy=1.500 mm
Maximum value of SAR (interpolated) = 0.0888 W/kg
Left Cheek Middle/Zoom Scan (5x5x7)/Cube 0: Measurement grid: dx=8mm, dy=8mm, dz=5mm
Reference Value = 2.715 V/m; Power Drift = 0.063 dB
Peak SAR (extrapolated) = 0.117 W/kg
SAR(1 g) = 0.078 W/kg; SAR(10 g) = 0.048 W/kg
Maximum value of SAR (measured) = 0.084 W/kg

FCC SAR Test Report Report No: RXA1710-0342SAR
TA Technology (Shanghai) Co., Ltd. TA-MB-04-003S Page 77 of 147 This report shall not be reproduced except in full, without the written approval of TA Technology (Shanghai) Co., Ltd.
Plot 13 GSM 1900 Back Side Middle (Distance 10mm) Date: 10/22/2017
Communication System: UID 0, GSM 1900 (0); Frequency: 1880 MHz;Duty Cycle: 1:8.30042
Medium parameters used: f = 1880 MHz; σ = 1.498 S/m; εr = 54.067; ρ = 1000 kg/m3
Ambient Temperature:22.3 Liquid Temperature: 21.5
Phantom section: Flat Section
DASY5 Configuration:
Sensor-Surface: 4mm (Mechanical Surface Detection)
Probe: EX3DV4 - SN3677; ConvF(7.98, 7.98, 7.98); Calibrated: 1/23/2017;
Electronics: DAE4 Sn1291; Calibrated: 1/19/2017
Phantom: SAM 2; Type: SAM;
Measurement SW: DASY52, Version 52.8 (8); SEMCAD X Version 14.6.10 (7331)
Back Side Middle/Area Scan (71x121x1): Interpolated grid: dx=1.500 mm, dy=1.500 mm
Maximum value of SAR (interpolated) = 0.323 W/kg
Back Side Middle/Zoom Scan (5x5x7)/Cube 0: Measurement grid: dx=8mm, dy=8mm, dz=5mm
Reference Value = 6.058 V/m; Power Drift = -0.04 dB
Peak SAR (extrapolated) = 0.521 W/kg
SAR(1 g) = 0.314 W/kg; SAR(10 g) = 0.172 W/kg
Maximum value of SAR (measured) = 0.346 W/kg

FCC SAR Test Report Report No: RXA1710-0342SAR
TA Technology (Shanghai) Co., Ltd. TA-MB-04-003S Page 78 of 147 This report shall not be reproduced except in full, without the written approval of TA Technology (Shanghai) Co., Ltd.
Plot 14 GSM 1900 GPRS (4Txslots) Bottom Edge Middle (Distance 10mm) Date: 10/22/2017
Communication System: UID 0, GPRS 4TX (0); Frequency: 1880 MHz;Duty Cycle: 1:2.07491
Medium parameters used: f = 1880 MHz; σ = 1.498 S/m; εr = 54.067; ρ = 1000 kg/m3
Ambient Temperature:22.3 Liquid Temperature: 21.5
Phantom section: Flat Section
DASY5 Configuration:
Sensor-Surface: 4mm (Mechanical Surface Detection)
Probe: EX3DV4 - SN3677; ConvF(7.98, 7.98, 7.98); Calibrated: 1/23/2017;
Electronics: DAE4 Sn1291; Calibrated: 1/19/2017
Phantom: SAM 2; Type: SAM;
Measurement SW: DASY52, Version 52.8 (8); SEMCAD X Version 14.6.10 (7331)
Bottom Side Middle/Area Scan (31x71x1): Interpolated grid: dx=1.500 mm, dy=1.500 mm
Maximum value of SAR (interpolated) = 0.626 W/kg
Bottom Side Middle/Zoom Scan (5x5x7)/Cube 0: Measurement grid: dx=8mm, dy=8mm, dz=5mm
Reference Value = 16.12 V/m; Power Drift = 0.15 dB
Peak SAR (extrapolated) = 0.955 W/kg
SAR(1 g) = 0.551 W/kg; SAR(10 g) = 0.298 W/kg
Maximum value of SAR (measured) = 0.622 W/kg

FCC SAR Test Report Report No: RXA1710-0342SAR
TA Technology (Shanghai) Co., Ltd. TA-MB-04-003S Page 79 of 147 This report shall not be reproduced except in full, without the written approval of TA Technology (Shanghai) Co., Ltd.
Plot 15 UMTS Band II Left Cheek Middle Date: 10/21/2017
Communication System: UID 0, WCDMA II (0); Frequency: 1880 MHz;Duty Cycle: 1:1
Medium parameters used: f = 1880 MHz; σ = 1.375 S/m; εr = 40.539; ρ = 1000 kg/m3
Ambient Temperature:22.3 Liquid Temperature: 21.5
Phantom section: Left Section
DASY5 Configuration:
Sensor-Surface: 4mm (Mechanical Surface Detection)
Probe: EX3DV4 - SN3677; ConvF(8.39, 8.39, 8.39); Calibrated: 1/23/2017;
Electronics: DAE4 Sn1291; Calibrated: 1/19/2017
Phantom: SAM 2; Type: SAM;
Measurement SW: DASY52, Version 52.8 (8); SEMCAD X Version 14.6.10 (7331)
Left Cheek Middle/Area Scan (71x121x1): Interpolated grid: dx=1.500 mm, dy=1.500 mm
Maximum value of SAR (interpolated) = 0.174 W/kg
Left Cheek Middle/Zoom Scan (5x5x7)/Cube 0: Measurement grid: dx=8mm, dy=8mm, dz=5mm
Reference Value = 3.873 V/m; Power Drift = 0.09 dB
Peak SAR (extrapolated) = 0.232 W/kg
SAR(1 g) = 0.155 W/kg; SAR(10 g) = 0.096 W/kg
Maximum value of SAR (measured) = 0.165 W/kg

FCC SAR Test Report Report No: RXA1710-0342SAR
TA Technology (Shanghai) Co., Ltd. TA-MB-04-003S Page 80 of 147 This report shall not be reproduced except in full, without the written approval of TA Technology (Shanghai) Co., Ltd.
Plot 16 UMTS Band II Back Side Middle (Distance 10mm) Date: 10/22/2017
Communication System: UID 0, WCDMA (0); Frequency: 1880 MHz;Duty Cycle: 1:1
Medium parameters used: f = 1880 MHz; σ = 1.477 S/m; εr = 51.607; ρ = 1000 kg/m3
Ambient Temperature:22.3 Liquid Temperature: 21.5
Phantom section: Flat Section
DASY5 Configuration:
Sensor-Surface: 4mm (Mechanical Surface Detection)
Probe: EX3DV4 - SN3677; ConvF(7.98, 7.98, 7.98); Calibrated: 1/23/2017;
Electronics: DAE4 Sn1291; Calibrated: 1/19/2017
Phantom: SAM 1; Type: QD000P40CD; Serial: TP:1666
Measurement SW: DASY52, Version 52.8 (8); SEMCAD X Version 14.6.10 (7331)
Back Side Middle/Area Scan (71x121x1): Interpolated grid: dx=1.500 mm, dy=1.500 mm
Maximum value of SAR (interpolated) = 0.561 W/kg
Back Side Middle/Zoom Scan (5x5x7)/Cube 0: Measurement grid: dx=8mm, dy=8mm, dz=5mm
Reference Value = 7.191 V/m; Power Drift = 0.02 dB
Peak SAR (extrapolated) = 0.871 W/kg
SAR(1 g) = 0.524 W/kg; SAR(10 g) = 0.290 W/kg
Maximum value of SAR (measured) = 0.585 W/kg
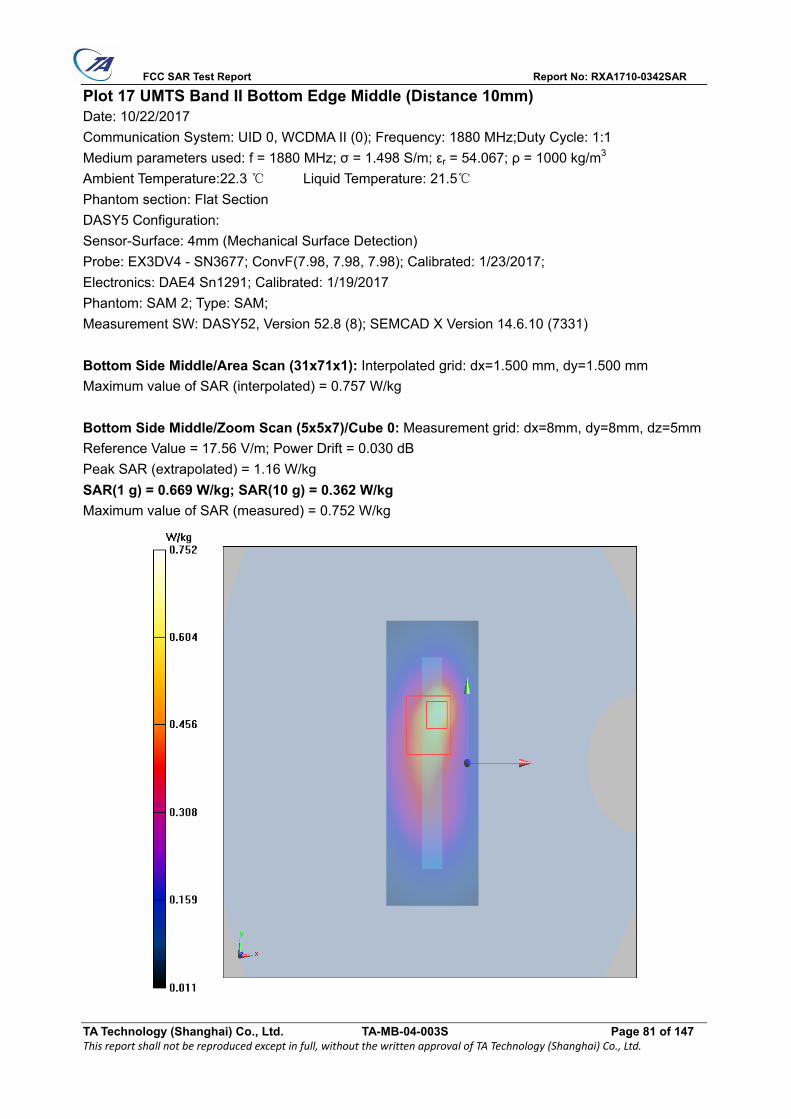
FCC SAR Test Report Report No: RXA1710-0342SAR
TA Technology (Shanghai) Co., Ltd. TA-MB-04-003S Page 81 of 147 This report shall not be reproduced except in full, without the written approval of TA Technology (Shanghai) Co., Ltd.
Plot 17 UMTS Band II Bottom Edge Middle (Distance 10mm) Date: 10/22/2017
Communication System: UID 0, WCDMA II (0); Frequency: 1880 MHz;Duty Cycle: 1:1
Medium parameters used: f = 1880 MHz; σ = 1.498 S/m; εr = 54.067; ρ = 1000 kg/m3
Ambient Temperature:22.3 Liquid Temperature: 21.5
Phantom section: Flat Section
DASY5 Configuration:
Sensor-Surface: 4mm (Mechanical Surface Detection)
Probe: EX3DV4 - SN3677; ConvF(7.98, 7.98, 7.98); Calibrated: 1/23/2017;
Electronics: DAE4 Sn1291; Calibrated: 1/19/2017
Phantom: SAM 2; Type: SAM;
Measurement SW: DASY52, Version 52.8 (8); SEMCAD X Version 14.6.10 (7331)
Bottom Side Middle/Area Scan (31x71x1): Interpolated grid: dx=1.500 mm, dy=1.500 mm
Maximum value of SAR (interpolated) = 0.757 W/kg
Bottom Side Middle/Zoom Scan (5x5x7)/Cube 0: Measurement grid: dx=8mm, dy=8mm, dz=5mm
Reference Value = 17.56 V/m; Power Drift = 0.030 dB
Peak SAR (extrapolated) = 1.16 W/kg
SAR(1 g) = 0.669 W/kg; SAR(10 g) = 0.362 W/kg
Maximum value of SAR (measured) = 0.752 W/kg

FCC SAR Test Report Report No: RXA1710-0342SAR
TA Technology (Shanghai) Co., Ltd. TA-MB-04-003S Page 82 of 147 This report shall not be reproduced except in full, without the written approval of TA Technology (Shanghai) Co., Ltd.
Plot 18 UMTS Band V Left Cheek Middle Date: 10/19/2017
Communication System: UID 0, WCDMA V (0); Frequency: 836.6 MHz;Duty Cycle: 1:1
Medium parameters used: f = 837 MHz; σ = 0.934 S/m; εr = 41.065; ρ = 1000 kg/m3
Ambient Temperature:22.3 Liquid Temperature: 21.5
Phantom section: Left Section
DASY5 Configuration:
Sensor-Surface: 4mm (Mechanical Surface Detection)
Probe: EX3DV4 - SN3677; ConvF(9.31, 9.31, 9.31); Calibrated: 1/23/2017;
Electronics: DAE4 Sn1291; Calibrated: 1/19/2017
Phantom: SAM1; Type: SAM; Serial: TP-1534
Measurement SW: DASY52, Version 52.8 (8); SEMCAD X Version 14.6.10 (7331)
Left Cheek Middle/Area Scan (71x121x1): Interpolated grid: dx=1.500 mm, dy=1.500 mm
Maximum value of SAR (interpolated) = 0.215 W/kg
Left Cheek Middle/Zoom Scan (5x5x7)/Cube 0: Measurement grid: dx=8mm, dy=8mm, dz=5mm
Reference Value = 5.879 V/m; Power Drift = -0.044 dB
Peak SAR (extrapolated) = 0.258 W/kg
SAR(1 g) = 0.204 W/kg; SAR(10 g) = 0.153 W/kg
Maximum value of SAR (measured) = 0.211 W/kg

FCC SAR Test Report Report No: RXA1710-0342SAR
TA Technology (Shanghai) Co., Ltd. TA-MB-04-003S Page 83 of 147 This report shall not be reproduced except in full, without the written approval of TA Technology (Shanghai) Co., Ltd.
Plot 19 UMTS Band V Back Side Middle (Distance 10mm) Date: 10/20/2017
Communication System: UID 0, WCDMA V (0); Frequency: 836.6 MHz;Duty Cycle: 1:1
Medium parameters used: f = 837 MHz; σ = 1.001 S/m; εr = 54.375; ρ = 1000 kg/m3
Ambient Temperature:22.3 Liquid Temperature: 21.5
Phantom section: Flat Section
DASY5 Configuration:
Sensor-Surface: 4mm (Mechanical Surface Detection)
Probe: EX3DV4 - SN3677; ConvF(9.74, 9.74, 9.74); Calibrated: 1/23/2017;
Electronics: DAE4 Sn1291; Calibrated: 1/19/2017
Phantom: SAM1; Type: SAM; Serial: TP-1534
Measurement SW: DASY52, Version 52.8 (8); SEMCAD X Version 14.6.10 (7331)
Back Side Middle/Area Scan (71x121x1): Interpolated grid: dx=1.500 mm, dy=1.500 mm
Maximum value of SAR (interpolated) = 0.316 W/kg
Back Side Middle/Zoom Scan (5x5x7)/Cube 0: Measurement grid: dx=8mm, dy=8mm, dz=5mm
Reference Value = 15.12 V/m; Power Drift = 0.06 dB
Peak SAR (extrapolated) = 0.533 W/kg
SAR(1 g) = 0.309 W/kg; SAR(10 g) = 0.173 W/kg
Maximum value of SAR (measured) = 0.345 W/kg

FCC SAR Test Report Report No: RXA1710-0342SAR
TA Technology (Shanghai) Co., Ltd. TA-MB-04-003S Page 84 of 147 This report shall not be reproduced except in full, without the written approval of TA Technology (Shanghai) Co., Ltd.
Plot 20 LTE Band 2 1RB Left Cheek High Date: 10/21/2017
Communication System: UID 0, LTE (0); Frequency: 1900 MHz;Duty Cycle: 1:1
Medium parameters used: f = 1900 MHz; σ = 1.393 S/m; εr = 40.461; ρ = 1000 kg/m3
Ambient Temperature:22.3 Liquid Temperature: 21.5
Phantom section: Left Section
DASY5 Configuration:
Sensor-Surface: 4mm (Mechanical Surface Detection)
Probe: EX3DV4 - SN3677; ConvF(8.39, 8.39, 8.39); Calibrated: 1/23/2017;
Electronics: DAE4 Sn1291; Calibrated: 1/19/2017
Phantom: SAM 2; Type: SAM;
Measurement SW: DASY52, Version 52.8 (8); SEMCAD X Version 14.6.10 (7331)
Left Cheek High/Area Scan (71x121x1): Interpolated grid: dx=1.500 mm, dy=1.500 mm
Maximum value of SAR (interpolated) = 0.165 W/kg
Left Cheek High/Zoom Scan (5x5x7)/Cube 0: Measurement grid: dx=8mm, dy=8mm, dz=5mm
Reference Value = 2.834 V/m; Power Drift = 0.175 dB
Peak SAR (extrapolated) = 0.214 W/kg
SAR(1 g) = 0.141 W/kg; SAR(10 g) = 0.087 W/kg
Maximum value of SAR (measured) = 0.152 W/kg

FCC SAR Test Report Report No: RXA1710-0342SAR
TA Technology (Shanghai) Co., Ltd. TA-MB-04-003S Page 85 of 147 This report shall not be reproduced except in full, without the written approval of TA Technology (Shanghai) Co., Ltd.
Plot 21 LTE Band 2 1RB Back Side High (Distance 10mm) Date: 10/22/2017
Communication System: UID 0, LTE_FDD (0); Frequency: 1900 MHz;Duty Cycle: 1:1
Medium parameters used: f = 1900 MHz; σ = 1.493 S/m; εr = 51.566; ρ = 1000 kg/m3
Ambient Temperature:22.3 Liquid Temperature: 21.5
Phantom section: Flat Section
DASY5 Configuration:
Sensor-Surface: 4mm (Mechanical Surface Detection)
Probe: EX3DV4 - SN3677; ConvF(7.98, 7.98, 7.98); Calibrated: 1/23/2017;
Electronics: DAE4 Sn1291; Calibrated: 1/19/2017
Phantom: SAM 1; Type: QD000P40CD; Serial: TP:1666
Measurement SW: DASY52, Version 52.8 (8); SEMCAD X Version 14.6.10 (7331)
Back Side High/Area Scan (71x121x1): Interpolated grid: dx=1.500 mm, dy=1.500 mm
Maximum value of SAR (interpolated) = 0.543 W/kg
Back Side High/Zoom Scan (5x5x7)/Cube 0: Measurement grid: dx=8mm, dy=8mm, dz=5mm
Reference Value = 6.622 V/m; Power Drift = -0.11 dB
Peak SAR (extrapolated) = 0.840 W/kg
SAR(1 g) = 0.505 W/kg; SAR(10 g) = 0.277 W/kg
Maximum value of SAR (measured) = 0.563 W/kg

FCC SAR Test Report Report No: RXA1710-0342SAR
TA Technology (Shanghai) Co., Ltd. TA-MB-04-003S Page 86 of 147 This report shall not be reproduced except in full, without the written approval of TA Technology (Shanghai) Co., Ltd.
Plot 22 LTE Band 2 1RB Bottom Edge Middle (Distance 10mm) Date: 10/22/2017
Communication System: UID 0, LTE_FDD (0); Frequency: 1880 MHz;Duty Cycle: 1:1
Medium parameters used: f = 1880 MHz; σ = 1.477 S/m; εr = 51.607; ρ = 1000 kg/m3
Ambient Temperature:22.3 Liquid Temperature: 21.5
Phantom section: Flat Section
DASY5 Configuration:
Sensor-Surface: 4mm (Mechanical Surface Detection)
Probe: EX3DV4 - SN3677; ConvF(7.98, 7.98, 7.98); Calibrated: 1/23/2017;
Electronics: DAE4 Sn1291; Calibrated: 1/19/2017
Phantom: SAM 1; Type: QD000P40CD; Serial: TP:1666
Measurement SW: DASY52, Version 52.8 (8); SEMCAD X Version 14.6.10 (7331)
Bottom Side Middle/Area Scan (31x71x1): Interpolated grid: dx=1.500 mm, dy=1.500 mm
Maximum value of SAR (interpolated) = 0.859 W/kg
Bottom Side Middle/Zoom Scan (5x5x7)/Cube 0: Measurement grid: dx=8mm, dy=8mm, dz=5mm
Reference Value = 20.49 V/m; Power Drift = 0.033 dB
Peak SAR (extrapolated) = 1.36 W/kg
SAR(1 g) = 0.777 W/kg; SAR(10 g) = 0.414 W/kg
Maximum value of SAR (measured) = 0.883 W/kg

FCC SAR Test Report Report No: RXA1710-0342SAR
TA Technology (Shanghai) Co., Ltd. TA-MB-04-003S Page 87 of 147 This report shall not be reproduced except in full, without the written approval of TA Technology (Shanghai) Co., Ltd.
Plot 23 LTE Band 5 1RB Left Cheek Low Date: 10/19/2017
Communication System: UID 0, LTE (0); Frequency: 829 MHz;Duty Cycle: 1:1
Medium parameters used: f = 829 MHz; σ = 0.926 S/m; εr = 41.144; ρ = 1000 kg/m3
Ambient Temperature:22.3 Liquid Temperature: 21.5
Phantom section: Left Section
DASY5 Configuration:
Sensor-Surface: 4mm (Mechanical Surface Detection)
Probe: EX3DV4 - SN3677; ConvF(9.31, 9.31, 9.31); Calibrated: 1/23/2017;
Electronics: DAE4 Sn1291; Calibrated: 1/19/2017
Phantom: SAM1; Type: SAM; Serial: TP-1534
Measurement SW: DASY52, Version 52.8 (8); SEMCAD X Version 14.6.10 (7331)
Left Cheek Low/Area Scan (71x121x1): Interpolated grid: dx=1.500 mm, dy=1.500 mm
Maximum value of SAR (interpolated) = 0.207 W/kg
Left Cheek Low/Zoom Scan (5x5x7)/Cube 0: Measurement grid: dx=8mm, dy=8mm, dz=5mm
Reference Value = 6.312 V/m; Power Drift = -0.034 dB
Peak SAR (extrapolated) = 0.254 W/kg
SAR(1 g) = 0.199 W/kg; SAR(10 g) = 0.149 W/kg
Maximum value of SAR (measured) = 0.206 W/kg

FCC SAR Test Report Report No: RXA1710-0342SAR
TA Technology (Shanghai) Co., Ltd. TA-MB-04-003S Page 88 of 147 This report shall not be reproduced except in full, without the written approval of TA Technology (Shanghai) Co., Ltd.
Plot 24 LTE Band 5 1RB Back Side Low (Distance 10mm) Date: 10/20/2017
Communication System: UID 0, LTE (0); Frequency: 829 MHz;Duty Cycle: 1:1
Medium parameters used: f = 829 MHz; σ = 0.994 S/m; εr = 54.367; ρ = 1000 kg/m3
Ambient Temperature:22.3 Liquid Temperature: 21.5
Phantom section: Flat Section
DASY5 Configuration:
Sensor-Surface: 4mm (Mechanical Surface Detection)
Probe: EX3DV4 - SN3677; ConvF(9.74, 9.74, 9.74); Calibrated: 1/23/2017;
Electronics: DAE4 Sn1291; Calibrated: 1/19/2017
Phantom: SAM1; Type: SAM; Serial: TP-1534
Measurement SW: DASY52, Version 52.8 (8); SEMCAD X Version 14.6.10 (7331)
Back Side Low/Area Scan (71x121x1): Interpolated grid: dx=1.500 mm, dy=1.500 mm
Maximum value of SAR (interpolated) = 0.276 W/kg
Back Side Low/Zoom Scan (5x5x7)/Cube 0: Measurement grid: dx=8mm, dy=8mm, dz=5mm
Reference Value = 16.29 V/m; Power Drift = 0.00 dB
Peak SAR (extrapolated) = 0.333 W/kg
SAR(1 g) = 0.266 W/kg; SAR(10 g) = 0.205 W/kg
Maximum value of SAR (measured) = 0.278 W/kg

FCC SAR Test Report Report No: RXA1710-0342SAR
TA Technology (Shanghai) Co., Ltd. TA-MB-04-003S Page 89 of 147 This report shall not be reproduced except in full, without the written approval of TA Technology (Shanghai) Co., Ltd.
Plot 25 LTE Band 13 1RB Left Cheek Middle Date: 10/18/2017
Communication System: UID 0, LTE (0); Frequency: 782 MHz;Duty Cycle: 1:1
Medium parameters used: f = 782 MHz; σ = 0.935 S/m; εr = 41.912; ρ = 1000 kg/m3
Ambient Temperature:22.3 Liquid Temperature: 21.5
Phantom section: Left Section
DASY5 Configuration:
Sensor-Surface: 4mm (Mechanical Surface Detection)
Probe: EX3DV4 - SN3677; ConvF(9.58, 9.58, 9.58); Calibrated: 1/23/2017;
Electronics: DAE4 Sn1291; Calibrated: 1/19/2017
Phantom: SAM1; Type: SAM; Serial: TP-1534
Measurement SW: DASY52, Version 52.8 (8); SEMCAD X Version 14.6.10 (7331)
Left Cheek Middle/Area Scan (71x121x1): Interpolated grid: dx=1.500 mm, dy=1.500 mm
Maximum value of SAR (interpolated) = 0.208 W/kg
Left Cheek Middle/Zoom Scan (5x5x7)/Cube 0: Measurement grid: dx=8mm, dy=8mm, dz=5mm
Reference Value = 6.008 V/m; Power Drift = 0.022 dB
Peak SAR (extrapolated) = 0.253 W/kg
SAR(1 g) = 0.199 W/kg; SAR(10 g) = 0.151 W/kg
Maximum value of SAR (measured) = 0.209 W/kg

FCC SAR Test Report Report No: RXA1710-0342SAR
TA Technology (Shanghai) Co., Ltd. TA-MB-04-003S Page 90 of 147 This report shall not be reproduced except in full, without the written approval of TA Technology (Shanghai) Co., Ltd.
Plot 26 LTE Band 13 1RB Back Side Middle (Distance 10mm) Date: 10/18/2017
Communication System: UID 0, LTE (0); Frequency: 782 MHz;Duty Cycle: 1:1
Medium parameters used: f = 782 MHz; σ = 0.992 S/m; εr = 54.593; ρ = 1000 kg/m3
Ambient Temperature:22.3 Liquid Temperature: 21.5
Phantom section: Flat Section
DASY5 Configuration:
Sensor-Surface: 4mm (Mechanical Surface Detection)
Probe: EX3DV4 - SN3677; ConvF(9.99, 9.99, 9.99); Calibrated: 1/23/2017;
Electronics: DAE4 Sn1291; Calibrated: 1/19/2017
Phantom: SAM1; Type: SAM; Serial: TP-1534
Measurement SW: DASY52, Version 52.8 (8); SEMCAD X Version 14.6.10 (7331)
Back Side Middle/Area Scan (71x121x1): Interpolated grid: dx=1.500 mm, dy=1.500 mm
Maximum value of SAR (interpolated) = 0.328 W/kg
Back Side Middle/Zoom Scan (5x5x7)/Cube 0: Measurement grid: dx=8mm, dy=8mm, dz=5mm
Reference Value = 17.86 V/m; Power Drift = 0.04 dB
Peak SAR (extrapolated) = 0.394 W/kg
SAR(1 g) = 0.315 W/kg; SAR(10 g) = 0.243 W/kg
Maximum value of SAR (measured) = 0.328 W/kg

FCC SAR Test Report Report No: RXA1710-0342SAR
TA Technology (Shanghai) Co., Ltd. TA-MB-04-003S Page 91 of 147 This report shall not be reproduced except in full, without the written approval of TA Technology (Shanghai) Co., Ltd.
Plot 27 LTE Band 17 1RB Left Cheek Middle Date: 10/18/2017
Communication System: UID 0, LTE (0); Frequency: 710 MHz;Duty Cycle: 1:1
Medium parameters used: f = 710 MHz; σ = 0.869 S/m; εr = 43.049; ρ = 1000 kg/m3
Ambient Temperature:22.3 Liquid Temperature: 21.5
Phantom section: Left Section
DASY5 Configuration:
Sensor-Surface: 4mm (Mechanical Surface Detection)
Probe: EX3DV4 - SN3677; ConvF(9.58, 9.58, 9.58); Calibrated: 1/23/2017;
Electronics: DAE4 Sn1291; Calibrated: 1/19/2017
Phantom: SAM1; Type: SAM; Serial: TP-1534
Measurement SW: DASY52, Version 52.8 (8); SEMCAD X Version 14.6.10 (7331)
Left Cheek Middle/Area Scan (71x121x1): Interpolated grid: dx=1.500 mm, dy=1.500 mm
Maximum value of SAR (interpolated) = 0.163 W/kg
Left Cheek Middle/Zoom Scan (5x5x7)/Cube 0: Measurement grid: dx=8mm, dy=8mm, dz=5mm
Reference Value = 5.938 V/m; Power Drift = -0.028 dB
Peak SAR (extrapolated) = 0.197 W/kg
SAR(1 g) = 0.158 W/kg; SAR(10 g) = 0.123 W/kg
Maximum value of SAR (measured) = 0.164 W/kg

FCC SAR Test Report Report No: RXA1710-0342SAR
TA Technology (Shanghai) Co., Ltd. TA-MB-04-003S Page 92 of 147 This report shall not be reproduced except in full, without the written approval of TA Technology (Shanghai) Co., Ltd.
Plot 28 LTE Band 17 1RB Back Side Middle (Distance 10mm) Date: 10/18/2017
Communication System: UID 0, LTE (0); Frequency: 710 MHz;Duty Cycle: 1:1
Medium parameters used: f = 710 MHz; σ = 0.926 S/m; εr = 55.383; ρ = 1000 kg/m3
Ambient Temperature:22.3 Liquid Temperature: 21.5
Phantom section: Flat Section
DASY5 Configuration:
Sensor-Surface: 4mm (Mechanical Surface Detection)
Probe: EX3DV4 - SN3677; ConvF(9.99, 9.99, 9.99); Calibrated: 1/23/2017;
Electronics: DAE4 Sn1291; Calibrated: 1/19/2017
Phantom: SAM1; Type: SAM; Serial: TP-1534
Measurement SW: DASY52, Version 52.8 (8); SEMCAD X Version 14.6.10 (7331)
Back Side Middle/Area Scan (71x121x1): Interpolated grid: dx=1.500 mm, dy=1.500 mm
Maximum value of SAR (interpolated) = 0.306 W/kg
Back Side Middle/Zoom Scan (5x5x7)/Cube 0: Measurement grid: dx=8mm, dy=8mm, dz=5mm
Reference Value = 18.13 V/m; Power Drift = -0.00 dB
Peak SAR (extrapolated) = 0.354 W/kg
SAR(1 g) = 0.293 W/kg; SAR(10 g) = 0.230 W/kg
Maximum value of SAR (measured) = 0.305 W/kg

FCC SAR Test Report Report No: RXA1710-0342SAR
TA Technology (Shanghai) Co., Ltd. TA-MB-04-003S Page 93 of 147 This report shall not be reproduced except in full, without the written approval of TA Technology (Shanghai) Co., Ltd.
Plot 29 802.11b Right Cheek Low Date: 10/23/2017
Communication System: UID 0, 802.11b (0); Frequency: 2412 MHz;Duty Cycle: 1:1
Medium parameters used: f = 2412 MHz; σ = 1.803 S/m; εr = 40.954; ρ = 1000 kg/m3
Ambient Temperature:22.3 Liquid Temperature: 21.5
Phantom section: Right Section
DASY5 Configuration:
Sensor-Surface: 4mm (Mechanical Surface Detection)
Probe: EX3DV4 - SN3677; ConvF(7.90, 7.90, 7.90); Calibrated: 1/23/2017;
Electronics: DAE4 Sn1291; Calibrated: 1/19/2017
Phantom: SAM 1; Type: QD000P40CD; Serial: TP:1666
Measurement SW: DASY52, Version 52.8 (8); SEMCAD X Version 14.6.10 (7331)
Right Cheek Low /Area Scan (91x151x1): Interpolated grid: dx=1.200 mm, dy=1.200 mm
Maximum value of SAR (interpolated) = 0.558 W/kg
Right Cheek Low /Zoom Scan (7x7x7)/Cube 0: Measurement grid: dx=5mm, dy=5mm, dz=5mm
Reference Value = 7.846 V/m; Power Drift = 0.13 dB
Peak SAR (extrapolated) = 1.14 W/kg
SAR(1 g) = 0.515 W/kg; SAR(10 g) = 0.232 W/kg
Maximum value of SAR (measured) = 0.552 W/kg

FCC SAR Test Report Report No: RXA1710-0342SAR
TA Technology (Shanghai) Co., Ltd. TA-MB-04-003S Page 94 of 147 This report shall not be reproduced except in full, without the written approval of TA Technology (Shanghai) Co., Ltd.
Plot 30 802.11b Front Cheek Low Date: 10/23/2017
Communication System: UID 0, 802.11b (0); Frequency: 2412 MHz;Duty Cycle: 1:1
Medium parameters used: f = 2412 MHz; σ = 1.914 S/m; εr = 51.764; ρ = 1000 kg/m3
Ambient Temperature:22.3 Liquid Temperature: 21.5
Phantom section: Flat Section
DASY5 Configuration:
Sensor-Surface: 4mm (Mechanical Surface Detection)
Probe: EX3DV4 - SN3677; ConvF(7.85, 7.85, 7.85); Calibrated: 1/23/2017;
Electronics: DAE4 Sn1291; Calibrated: 1/19/2017
Phantom: SAM 1; Type: QD000P40CD; Serial: TP:1666
Measurement SW: DASY52, Version 52.8 (8); SEMCAD X Version 14.6.10 (7331)
Front Side Low/Area Scan (91x151x1): Interpolated grid: dx=1.200 mm, dy=1.200 mm
Maximum value of SAR (interpolated) = 0.139 W/kg
Front Side Low /Zoom Scan (7x7x7)/Cube 0: Measurement grid: dx=5mm, dy=5mm, dz=5mm
Reference Value = 3.631 V/m; Power Drift = -0.17 dB
Peak SAR (extrapolated) = 0.237 W/kg
SAR(1 g) = 0.122 W/kg; SAR(10 g) = 0.061 W/kg
Maximum value of SAR (measured) = 0.135 W/kg

FCC SAR Test Report Report No: RXA1710-0342SAR
TA Technology (Shanghai) Co., Ltd. TA-MB-04-003S Page 95 of 147 This report shall not be reproduced except in full, without the written approval of TA Technology (Shanghai) Co., Ltd.
ANNEX D: Probe Calibration Certificate

FCC SAR Test Report Report No: RXA1710-0342SAR
TA Technology (Shanghai) Co., Ltd. TA-MB-04-003S Page 96 of 147 This report shall not be reproduced except in full, without the written approval of TA Technology (Shanghai) Co., Ltd.

FCC SAR Test Report Report No: RXA1710-0342SAR
TA Technology (Shanghai) Co., Ltd. TA-MB-04-003S Page 97 of 147 This report shall not be reproduced except in full, without the written approval of TA Technology (Shanghai) Co., Ltd.


