
Sahel, Africa, and the European Migration challenge: Now and to Come
G7 International Forum« Globalization, Inclusion and Sustainability in a Global Century »
Jaime de MeloFERDI
Rome, May 8th‐9th. 2017

Outline South‐North Migration is rising
• Migration Patterns • G5‐ inflow to Europe by country of origin• G5‐ inflow by destination country
Now: A Marshall Plan for the Sahel Sahel heading towards ‘failed state’ status?
• On the edge of conflict traps• On the edge of poverty traps• A Marshall plan to invest in security/development
Looking Ahead: Facing up to the Climate challenge SSA: Climate change victims now and victims to come
• CO2 emissions vs. Population shares• Projected damages by region (in 2050)
Increase funding (for both adaptation & mitigation)• Funding for adaptation + for cities and forest conservation
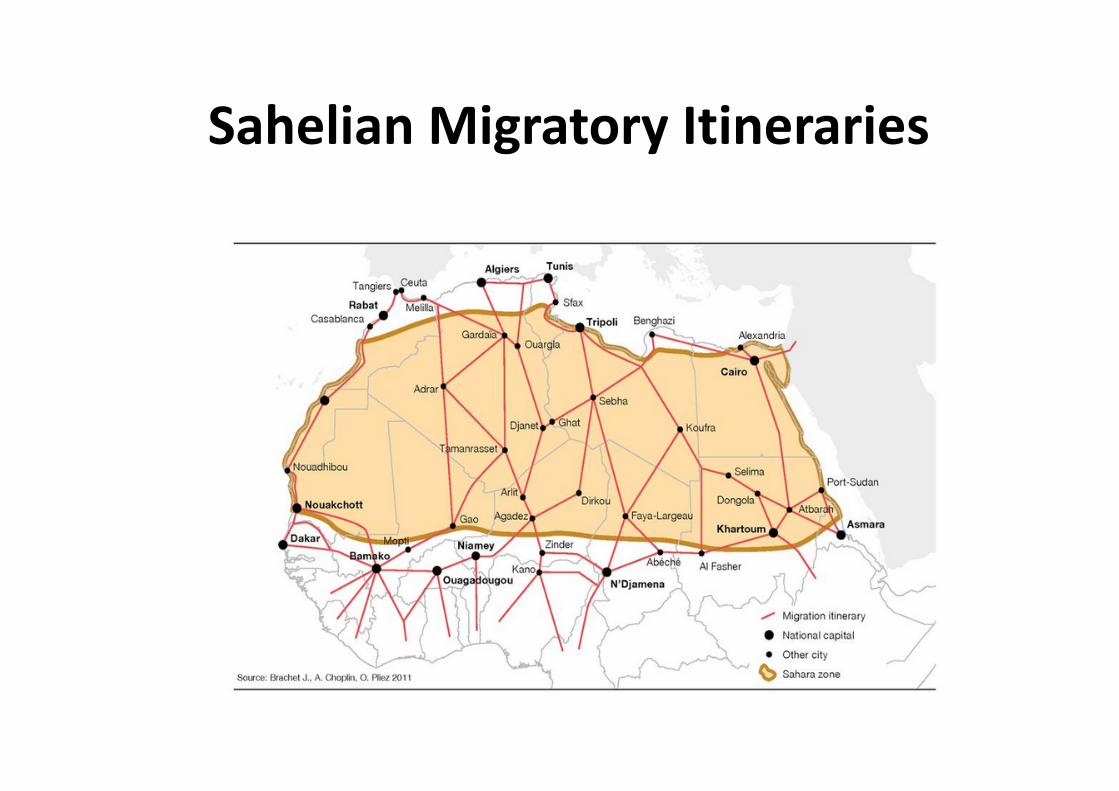
Sahelian Migratory Itineraries
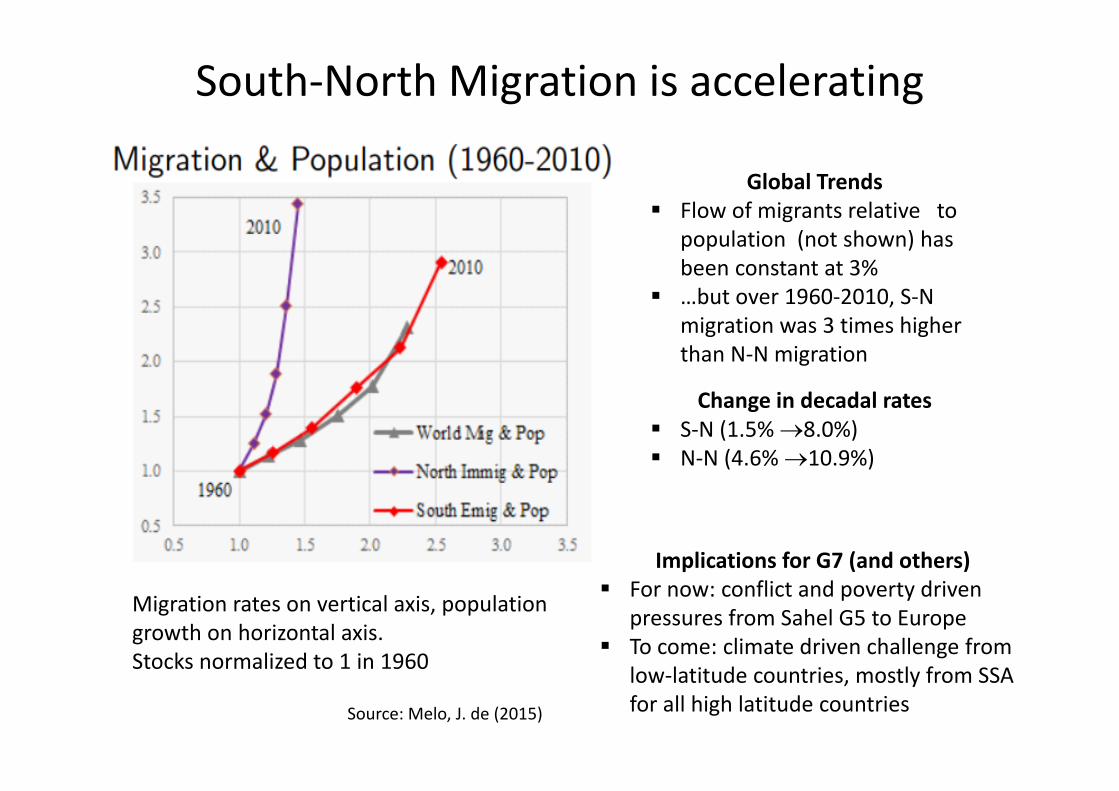
South‐North Migration is accelerating
Global Trends Flow of migrants relative to
population (not shown) has been constant at 3%
…but over 1960‐2010, S‐N migration was 3 times higher than N‐N migration
Change in decadal rates S‐N (1.5% 8.0%) N‐N (4.6% 10.9%)
Migration rates on vertical axis, population growth on horizontal axis.Stocks normalized to 1 in 1960
Implications for G7 (and others) For now: conflict and poverty driven
pressures from Sahel G5 to Europe To come: climate driven challenge from
low‐latitude countries, mostly from SSA for all high latitude countries Source: Melo, J. de (2015)

Sahelian Migration patterns in 2000
● 2/3 of migratory flows are intra‐African
● 82% of extra‐regional are towards Europe
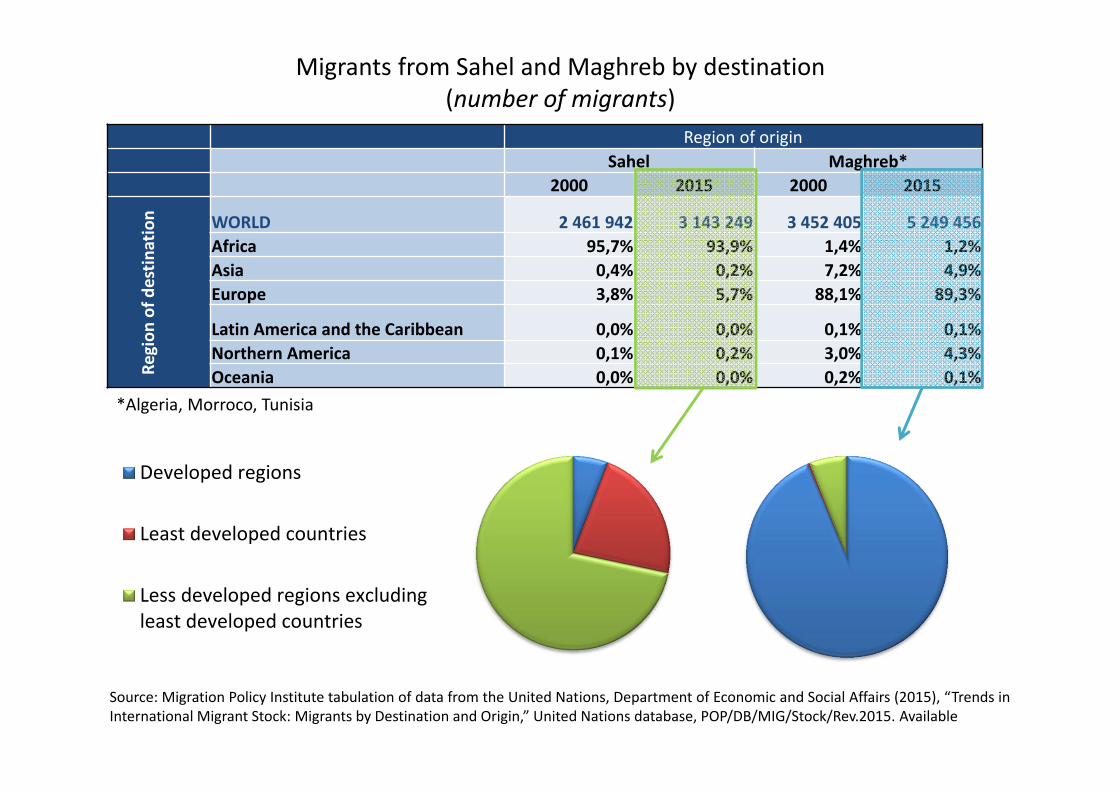
Migrants from Sahel and Maghreb by destination(number of migrants)
Region of originSahel Maghreb*
2000 2015 2000 2015
Region
of destin
ation WORLD 2 461 942 3 143 249 3 452 405 5 249 456
Africa 95,7% 93,9% 1,4% 1,2%Asia 0,4% 0,2% 7,2% 4,9%Europe 3,8% 5,7% 88,1% 89,3%
Latin America and the Caribbean 0,0% 0,0% 0,1% 0,1%Northern America 0,1% 0,2% 3,0% 4,3%Oceania 0,0% 0,0% 0,2% 0,1%
*Algeria, Morroco, Tunisia
Source: Migration Policy Institute tabulation of data from the United Nations, Department of Economic and Social Affairs (2015), “Trends inInternational Migrant Stock: Migrants by Destination and Origin,” United Nations database, POP/DB/MIG/Stock/Rev.2015. Available
Developed regions
Least developed countries
Less developed regions excludingleast developed countries

G5‐ Inflow to Europe by origin
0
2000
4000
6000
8000
10000
12000
14000
16000
2000 2001 2002 2003 2004 2005 2006 2007 2008 2009 2010 2011 2012 2013 2014
Inflow of Sahelian people to Europe by country
Burkina Faso Mali Mauritania Niger Chad TOTAL
Source : International Migration Database, OECD
• Sustained inflow increase from Mali starting around 2002
• Relatively constant flow from other countries

G5‐ Inflow by destination (period averages)
Others = Switzerland, Slovenia, Iceland, Slovak Republic, Hungary, Poland, Finland, Czech Republic, Denmark, Luxembourg, Norway, Sweden, Austria and Netherlands.
Shift of G5 migrants from Spain towardsItaly and France
Source : International Migration Database, OECD
Sahel heading towards ‘failed state’ status?

Sahel heading towards ‘failed state’ status?(1)
2015 per capita GDPb
(US$)
(2)FEW index rank c
(3)GDP
(10‐15)d
(4)Populationgrowth(15‐30)e
(5)CPA (05‐09)f
$ per capita
[educ / agri]g
(6)CPA (10‐14)f
$per capita
[educ / agri]g
Burkina Faso(18.1)a
613 139 5.5 2.6 59.2[2.0 / 4.8]
58.9[1.0 / 5.0]
Chad (14.4)a
776 145 6.4 2.8 22.6[0.3 / 1.3]
20.0[0.2 / 1.3]
Mali (17.6)a
744 133 6.1 2.8 59.5[4.8 / 7.3]
62.1[3.4 / 8.4]
Mauritania(4.1)a
1,371 118 8.7 2.1 83[0.9 / 9.5]
82.3[0.6 / 8.5]
Niger (19.9)a
359 146 4.2 3.8 29.5[0.3 / 2.9]
30.1[0.2 / 2.9]
LDCsh 943 - 4.1 2.3 41.3[3.4 / 1.8]
49.5[3.4 / 2.0]
Notes: a 2015 population (in millions), UN World population prospectb WDI 2015 GDP per capita in current US$ (2014 data for Mauritania)c Food‐Energy‐Water (FEW) composite index (148 countries: 1 is highest rank). http://www.prgs.edu/pardee‐initiative/food‐energy‐water/interactive‐index/guide.htmld Average yearly GDP growth rate (%)e UN World population prospect (medium fertility variant)f CPA: Country Programmable Aidg ODA Source: Creditor Reporting System (CRS) Aid Activities database, OECD. Expenditures in donor countries excludedh Least Developed Countries (LDCs)UN classification. Excludes Ethiopia and Bangladesh (694 million people)
Guillaumont‐Jeanneney et al. (2016)

Sahel on the edge of conflict traps Disengagement of the State during donor‐led Structural Adjustment
Programs in 1990s. State: Balance [generating surplus/protecting income] broken Extensive interviews among actors in G5 (Ferdi report):
No securityNo development Conflict‐related Factors: Internal (Tuaregs out of political process, high
population growth) External (Cocaine hub from 2005; AQIM out of Algeria; Return of armed men from Libya in 2013) ”conflict systems” & day‐to‐day insecurity. At edge of conflict trap/civil war, “failed state status”?
Delayed and imbalanced international response after 2013 has contained battle against terrorism but not day‐to‐day insecurity.
Military + health spending but neglect of aid for education agriculture
Estimates of costs of civil war from synthetic counterfactuals (average 10 years in a sample of 20 Civil wars across the world)
17% average annual loss in per capita income largely attributable to fall in inter‐ethnic trust above that backs the “war renewal” school, not the “neoclassical” school
Loss estimates from Costalli et al. (2016)

On the edge of poverty traps (1)Share of rural population on fragile isolated lands (▪), Low‐level coastal lands (), high infant mortality risk (●) high malnutrition (♦)
(regional averages)
Source: Corneille, A. and J. de Melo (2016)

On the edge of poverty traps (2)Gross and Net Savings (adjusted for depreciation of natural capital)
versus population growth(Regional averages 2000‐13)
Size of b
ubbles propo
rtiona
l to po
pulatio
n grow
th
Over 2000‐13, SSA savings barely sufficient to maintain current generation level of income !
Source: Corneille, A. and J. de Melo (2016)

A Marshall plan to invest in security/development(less costly than managing failed state status ex-post)
Country programmable aid and military expenses in G5 by donor (2013‐2015)(% of G‐5 GDP)
Military spending has not addressed day‐to‐day insecurity
ODA shares on health acceptable (communicable diseases are GPG)
Low shares of ODA to education/agriculture
Abandon “Do no harm” doctrine + non‐recognition of military/security spending in ODA
Source: Guillaumont‐Jeanneney et al. (2016)

Looking Ahead: Facing up to the Climate challenge

CO2 emissions vs. Population shares(regional averages)
• Bubbles proportional to total CO2 emissions (cement and fossil fuels). • Regions below the 45 line have below‐average per capita emissions.• If converging CO2 emissions per capita, effort from North America, Europe and East Asia
Corneille, A. and J. de Melo (2016)

Projected damages by region (in 2050)
Strongest damages in SSA and SA (above population shares) In absence of migration large redistribution of population across regions Strong migratory pressures is SA, SSA, EA if adaptation fails
Source: Corneille, A. and J. de Melo (2016)


Funding for adaptation (CBDR)Funding for mitigation (cities and forest conservation)
Other factors leading to increased migratory pressures
If SSA fails to converge in productivity towards US while EU does, then share of highly qualifies migrants from SSA is estimated to increase from 16% of population to 20% by 205 and 23% by 2050
Add IPPC climate change projections: with +3 deg. agricultural lands displaced by 1000 km. from equator + sea level rise of 1.20m.
Strong causal evidence that human conflict is positively correlated with sustained increases in temperature.
In coming decades, out‐migration is the solution to the climate change challenge With 72% of population and 90% of GDP on 10% of land across the world, plenty of room
to face up to climate change via migration (low‐latitude to high‐latitude countries). But if no migration is allowed polar regions would become twice as well of as equatorial
regions.…with increased funding from G7
• Funding to finance carbon‐sober cities in Africa (so the building and running cities does exceed one‐third of carbon budget for +2 deg.
• REDD+ funding for SSA (SSA is only region that has continued deforestation in past decade in spite of higher growth)

ReferencesBrachet, J. et al. (2009), Migrations trassahariennes, vers un désert cosmopolite morcelé (Niger), Editions du Croquant, Paris.
Corneille, A. and J. de Melo (2016) “Quelques défis de l’Afrique Sub‐saharienne face au changement climatique” BR#165, Ferdi
Costalli, S. L. Moretti, and C. Pischedda (2016) “The Economic Costs of Civil War: Synthetic Counterfactual Evidence and the Effects of Ethnic Fractionalization”, HICN #184, Sussex
Guillaumont Jeanneney S. avec C. Angely, A. Brachet, P. Collier, M. Garenne, P. Guillaumont, B. Joubert, C. Laville, J. de Melo, S. Michailof, B. Miribel, O. Ray et T. Zongo, Allier sécurité et développement Plaidoyer pour le Sahel, Ferdi 2016.http://www.ferdi.fr/fr/publication/ouv‐allier‐s%C3%A9curit%C3%A9‐et‐d%C3%A9veloppement‐plaidoyer‐pour‐le‐sahel
Guillaumont‐Jeanneney, S., C. Laville and J. de Melo (2016) ” « Sahel faces poverty and conflict traps : A call for international Action » http://www.ferdi.fr/en/publication/edito‐sahel‐faces‐poverty‐and‐conflict‐traps‐call‐international‐action
Melo, J. de (2015) “Climate Change and the Growing Challenge of Migration”http://www.brookings.edu/blogs/planetpolicy/posts/2015/08/24‐climate‐change‐migration‐challenges‐de‐melo
OECD (2017), "International migration database", OECD International Migration Statistics (database)http://www.oecd‐ilibrary.org/social‐issues‐migration‐health/data/oecd‐international‐migration‐statistics/international‐migration‐database_data‐00342‐en
United Nations, Department of Economic and Social Affairs, Population Division (2015).http://www.un.org/en/development/desa/population/migration/data/estimates2/estimates15.shtml


