
Safe Charge Rates for Lithium-Ion CellsEffects of Lithium Plating
M. C. Smart, L. D. Whitcanack and B. V. Ratnakumar
NASA Battery Workshop
Huntsville, AL November 27-29, 2007
(Supported by NESC Battery Working Group)
Electrochemical Technologies Group
NESC-Battery Working Group Review –NASA Battery workshop 2007
Safe Charge RatesObjective:
Establish a procedure to determine conditions that ensure safe charging of Li-ion batteries under extreme conditions of charge rate and temperature.
Approach:Various chemistries will be evaluated for their ability to support such charge rates without any adverse effects, e. g., Li plating at low temperature and enhanced solvent oxidation at warm temperatures.

Electrochemical Technologies Group
NESC-Battery Working Group Review –NASA Battery workshop 2007
Background• Li intercalation in graphite occurs ~100 mV, while Li deposition takes place
at < 0 v, vs. Li.• Conditions where Li intercalation kinetics are hindered, the anode potential
goes below Li plating potentials– High rate charge– Low temperature– Poor interfacial conditions unfavorable for Li intercalation.
• Factors influencing Li plating– Nature of electrolyte– Nature anode composite electrode– Cathode to anode ratio
• Cell designs are generally cathode limited. However, if anode is sufficiently in excess, it may polarize anode heavily.
• Cathode/anode ratio may change upon cycling/storage, due more degradation at the anode,
• Effects of Li plating– May be reintercalated given time-no serious impact.– Will impact the stability relative to electrolytes.– Cycle life and reliability may be severely compromised.
Electrochemical Technologies Group
NESC-Battery Working Group Review –NASA Battery workshop 2007
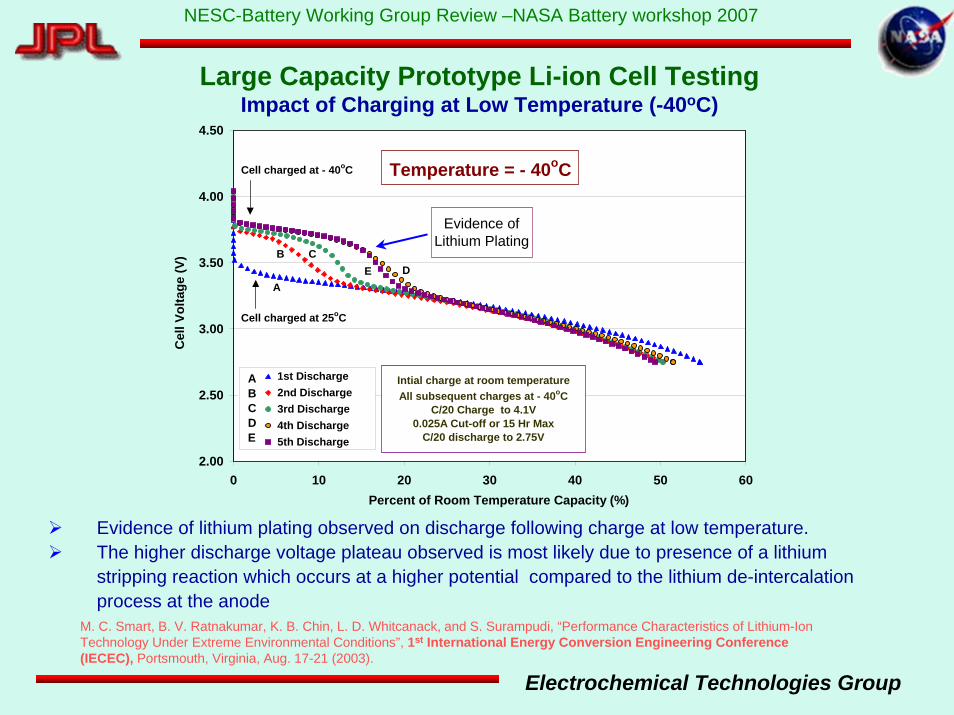
Large Capacity Prototype Li-ion Cell TestingImpact of Charging at Low Temperature (-40oC)
2.00
2.50
3.00
3.50
4.00
4.50
0 10 20 30 40 50 60Percent of Room Temperature Capacity (%)
Cel
l Vol
tage
(V)
1st Discharge 2nd Discharge 3rd Discharge 4th Discharge 5th Discharge
Temperature = - 40oC
Intial charge at room temperatureAll subsequent charges at - 40oC
C/20 Charge to 4.1V0.025A Cut-off or 15 Hr Max
C/20 discharge to 2.75V
Cell charged at 25oC
Cell charged at - 40oC
Evidence of Lithium Plating
ABCDE
A
B CE D
Evidence of lithium plating observed on discharge following charge at low temperature. The higher discharge voltage plateau observed is most likely due to presence of a lithium stripping reaction which occurs at a higher potential compared to the lithium de-intercalation process at the anode
M. C. Smart, B. V. Ratnakumar, K. B. Chin, L. D. Whitcanack, and S. Surampudi, “Performance Characteristics of Lithium-Ion Technology Under Extreme Environmental Conditions”, 1st International Energy Conversion Engineering Conference (IECEC), Portsmouth, Virginia, Aug. 17-21 (2003).
Electrochemical Technologies Group
NESC-Battery Working Group Review –NASA Battery workshop 2007
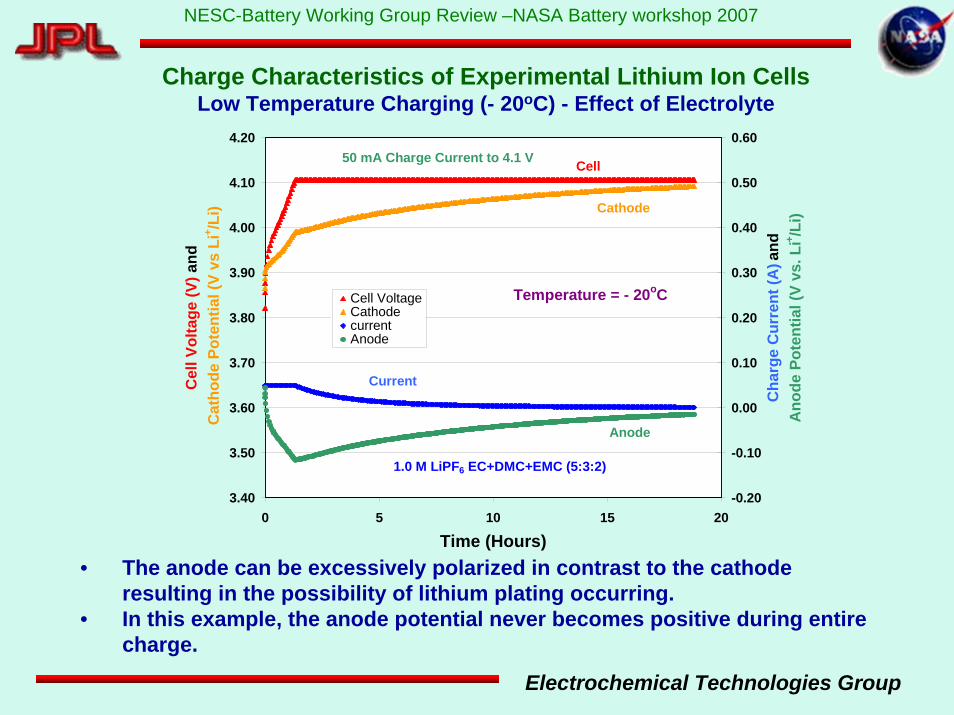
Charge Characteristics of Experimental Lithium Ion CellsLow Temperature Charging (- 20oC) - Effect of Electrolyte
3.40
3.50
3.60
3.70
3.80
3.90
4.00
4.10
4.20
0 5 10 15 20
Time (Hours)
Cel
l Vol
tage
(V) a
nd C
atho
de P
oten
tial (
V vs
Li+ /L
i)
-0.20
-0.10
0.00
0.10
0.20
0.30
0.40
0.50
0.60
Cha
rge
Cur
rent
(A) a
nd
Ano
de P
oten
tial (
V vs
. Li+ /L
i)
Cell VoltageCathodecurrentAnode
Temperature = - 20oC
Anode
Cathode
Cell
Current
1.0 M LiPF6 EC+DMC+EMC (5:3:2)
50 mA Charge Current to 4.1 V
• The anode can be excessively polarized in contrast to the cathode resulting in the possibility of lithium plating occurring.
• In this example, the anode potential never becomes positive during entire charge.

Electrochemical Technologies Group
NESC-Battery Working Group Review –NASA Battery workshop 2007
Charge Characteristics of Experimental Lithium Ion CellsLow Temperature Charging (- 20oC) -Effect of Electrolyte
2.00
2.50
3.00
3.50
4.00
4.50
0.000 0.050 0.100 0.150 0.200 0.250 0.300 0.350
Discharge Capacity (Ahr)
Cel
l Vol
tage
(V)
Room Temperature Charge
Charge at -20C (70 mA) Charge at -20C (135 mA)
Temperature = - 20oC
1.0 M LiPF6 EC+DMC+EMC (5:3:2)
25 mA Discharge Current
MCMB-LiNiCoO2 CellLi Reference Electrode
Constant Current Charge to 4.1 VTaper Current Cut-off = 0.010 A
Evidence of Lithium Plating

Electrochemical Technologies Group
NESC-Battery Working Group Review –NASA Battery workshop 2007
Charge Characteristics of Experimental Lithium Ion Cells at- 20oCJPL Quaternary Carbonate Low Temperature Electrolyte (1:1:1:3)
3.600
3.700
3.800
3.900
4.000
4.100
4.200
0 2 4 6 8 10 12 14 16 18
Time (Hours)
Cel
l Vol
tage
(V) a
nd
Cat
hode
Pot
entia
l (V
vs. L
i+/L
i)
-0.100
0.000
0.100
0.200
0.300
0.400
0.500
Cha
rge
Cur
rent
(A) a
ndA
node
Pot
entia
l (V
vs. L
i+/L
i)
Cell VoltageCathodecurrentAnode
Temperature = - 20oC
Anode
Cathode
Current
50 mA Charge Current
Cell
• As shown, the point at which the anode potential becomes the most negative (~ -70mV vs. Li+/Li) is when the charge voltage and current are highest.

Electrochemical Technologies Group
NESC-Battery Working Group Review –NASA Battery workshop 2007
2.00
2.50
3.00
3.50
4.00
4.50
0.000 0.050 0.100 0.150 0.200 0.250 0.300 0.350 0.400
Discharge Capacity (Ahr)
Cel
l Vol
tage
(V)
Room Temperature Charge
Charge at -20C (70 mA)
Temperature = - 20oC
1.0 M LiPF6 EC+DEC+DMC+EMC (1:1:1:3)
25 mA Discharge Current to 2.75 V
• Although the anode potential became negative, no lithium plating was observed with this cell in the subsequent discharge profiles.
• This might be due to the fact that the potentials were not sufficiently negative and/or any lithium plated on the electrode surface had time to intercalate during the taper mode.
Charge Characteristics of Experimental Lithium Ion CellsEffect of Charging at Low Temperature (- 20oC) – LT Electrolyte

Electrochemical Technologies Group
NESC-Battery Working Group Review –NASA Battery workshop 2007
Tafel Polarization Measurements of MCMB and LiNiCoO2 ElectrodesEffect of Electrolyte upon Polarization at Different Temperatures
3.400
3.500
3.600
3.700
3.800
3.900
4.000
4.100
4.200
1.00E-04 1.00E-03 1.00E-02 1.00E-01Current (Amps)
Cat
hode
Pot
entia
l (V
vs L
i+ /Li)
0
100
200
300
400
500
600
Ano
de p
oten
tial (
mV
vs L
i+ /Li)
Cathode of low EC-content electrolye cell (A) Cathode of high EC-content electrolye cell (B) Anode of low EC-content electrolye cell (A) Anode of high EC-content electrolye cell (B)
Cell A: 1.0 M LiPF6 EC+DEC+DMC+EMC (1:1:1:3)Cell B: 1.0 M LiPF6 EC+DMC+EMC (5:3:2)
MCMB Carbon - LiNiCoO2 Cell Li Reference Electrode
Temperature = - 20oC
34
21
1234
• In the case where no lithium plating was observed (good low temp electrolyte),the cathode was observed to have poorer kinetics at low temperature.
• Whereas, in the case where lithium plating was observed (poor low temp electrolyte), the anode displayed poorer kinetics and increased polarization. M. C. Smart, B. V. Ratnakumar, L. Whitcanack, K. Chin, M. Rodriguez, and S. Surampudi “Performance Characteristics of Lithium Ion Cells at Low Temperatures”, IEEE Aerospace and Electronic Systems Magazine, 17 (12), 16-20 (2002).

Electrochemical Technologies Group
NESC-Battery Working Group Review –NASA Battery workshop 2007
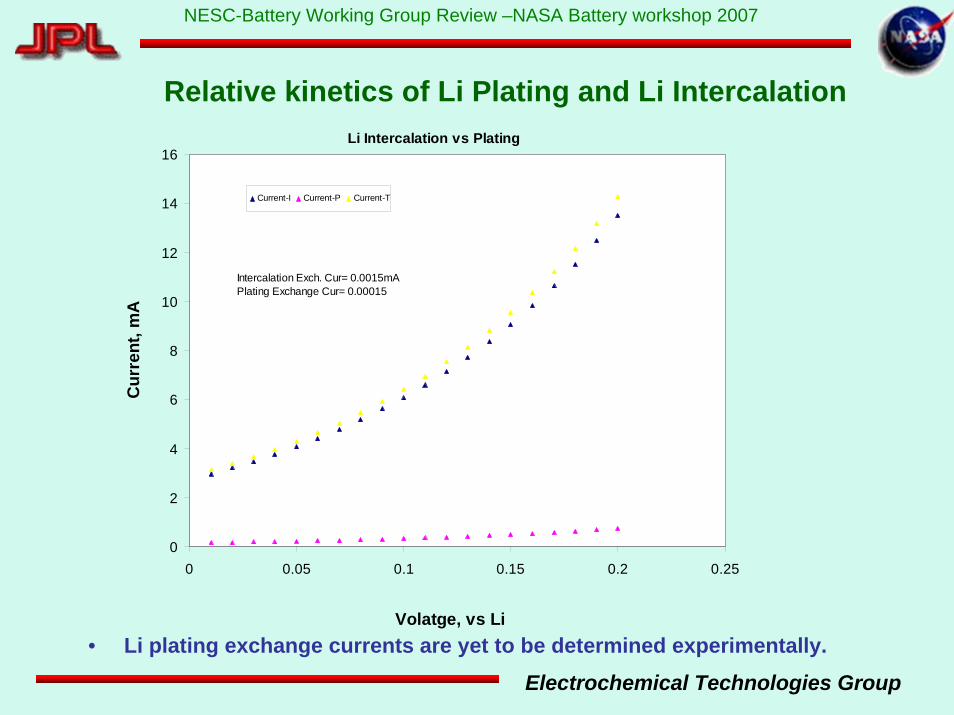
Relative kinetics of Li Plating and Li Intercalation
• Currents towards Li plating and Li intercalation at a given potential have been estimated with the assumption that both Li processes are in the Tafel mode.
• Reversible potential for Li intercalation: 85 mV vs L, Li plating: 0 V vs. Li.
• Reintercalation not taken into consideration• The objective is only to show the effect of reduced kinetics
for intercalation at low temperatures
Electrochemical Technologies Group
NESC-Battery Working Group Review –NASA Battery workshop 2007
Li Intercalation vs Plating
0
2
4
6
8
10
12
14
16
0 0.05 0.1 0.15 0.2 0.25
Volatge, vs Li
Cur
rent
, mA
Current-I Current-P Current-T
Intercalation Exch. Cur= 0.0015mAPlating Exchange Cur= 0.00015
Relative kinetics of Li Plating and Li Intercalation
• Li plating exchange currents are yet to be determined experimentally.

Electrochemical Technologies Group
NESC-Battery Working Group Review –NASA Battery workshop 2007
• Li plating exchange currents are yet to be determined experimentally.
Li Intercalation vs Plating
0
2
4
6
8
10
12
14
16
18
0 20 40 60 80 100 120
Ratio of Exchange Currents (Int vs Plating)
Prop
ortio
n of
Pla
ting
Cur
rent
, %Proportion of Plating Current
Intercalation Exch. Cur= 0.00015mAPlating Exchange Cur= 0.00005
Relative kinetics of Li Plating and Li Intercalation

Electrochemical Technologies Group
NESC-Battery Working Group Review –NASA Battery workshop 2007
Experimental Details
• Prototype Cell Testing• Cylindrical and Prismatic Designs• Cell sizes ranging from 18650 to 42 Ah
• Experimental Cell Design/Chemistry• MCMB anodes and LiNiCoO2 cathodes• Cells equipped with Li metal reference electrodes• Number of different electrolyte studied (esp. low temp)• 300-400 mAh size cells• Jelly roll design (cylindrical)
• Charge acceptance at various rates and temperatures• Effect of charge voltage• Effect of charge current and taper current cut-off• Effect of electrolyte (and corresponding SEI layers formed) upon charge
characteristics• Identification of conditions which lead to lithium plating

Electrochemical Technologies Group
NESC-Battery Working Group Review –NASA Battery workshop 2007
Characterization
LT Charge Rates
High rate charge at 40oC
Quallion 18650SA C-LiCoO2 3 2 1
ABSL 18650 HC-LiCoO2 3 2 1
A123 262650 LiFePO4 3 2 1
SKC Pouch C-LiCoO2 3 2 1
Yardney Prismatic C-Li(NiCo)O2 3 2 1
SAFT Cylindrical C-Li(NiCo)O2 3 2 1
Planned Tests for Charge Rate Effects-Test Articles
Manufacturer Type ChemistryTests
Electrochemical Technologies Group
NESC-Battery Working Group Review –NASA Battery workshop 2007
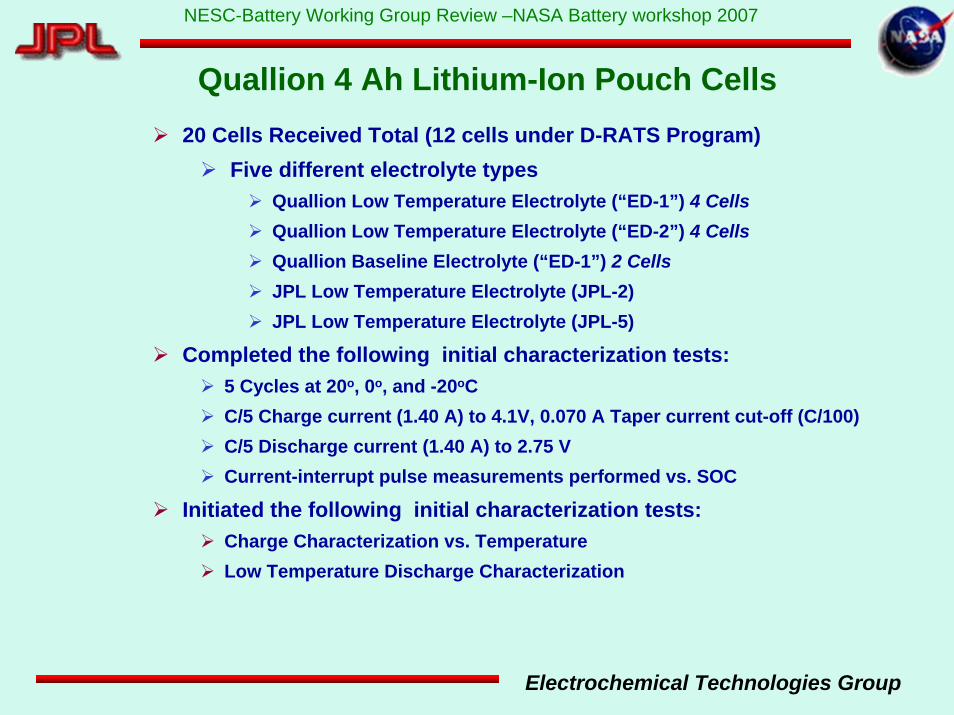
Quallion 4 Ah Lithium-Ion Pouch Cells 20 Cells Received Total (12 cells under D-RATS Program)
Five different electrolyte typesQuallion Low Temperature Electrolyte (“ED-1”) 4 CellsQuallion Low Temperature Electrolyte (“ED-2”) 4 CellsQuallion Baseline Electrolyte (“ED-1”) 2 CellsJPL Low Temperature Electrolyte (JPL-2)JPL Low Temperature Electrolyte (JPL-5)
Completed the following initial characterization tests:5 Cycles at 20o, 0o, and -20oCC/5 Charge current (1.40 A) to 4.1V, 0.070 A Taper current cut-off (C/100)C/5 Discharge current (1.40 A) to 2.75 VCurrent-interrupt pulse measurements performed vs. SOC
Initiated the following initial characterization tests:Charge Characterization vs. TemperatureLow Temperature Discharge Characterization
Electrochemical Technologies Group
NESC-Battery Working Group Review –NASA Battery workshop 2007
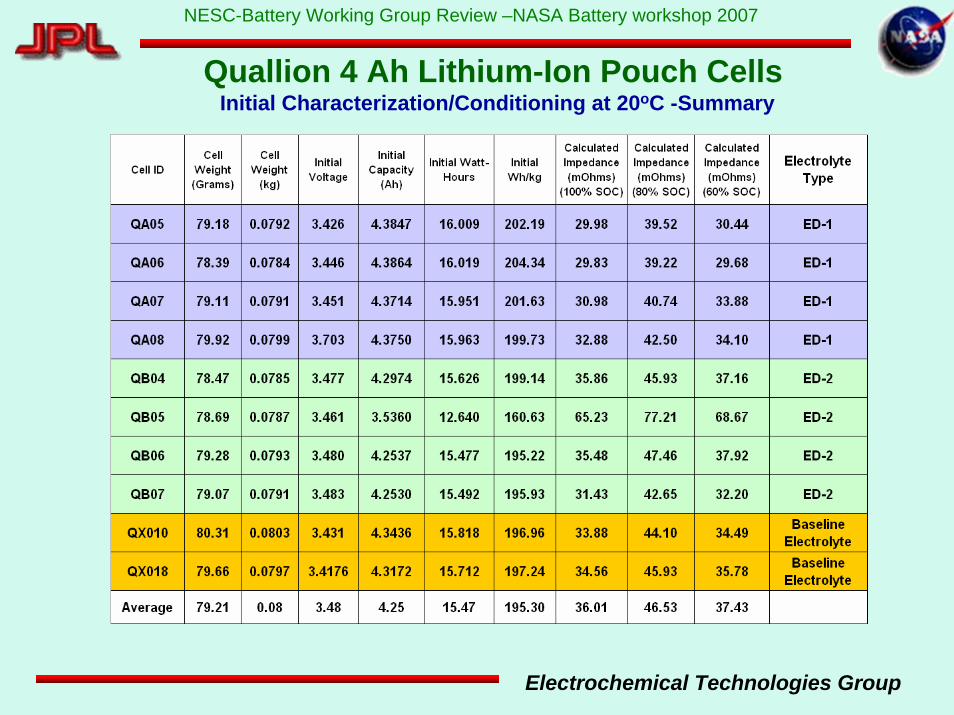
Quallion 4 Ah Lithium-Ion Pouch Cells Initial Characterization/Conditioning at 20oC -Summary

Electrochemical Technologies Group
NESC-Battery Working Group Review –NASA Battery workshop 2007
Quallion Baseline Electrolyte
Quallion 4 Ah Lithium-Ion Pouch CellsInitial Characterization/Conditioning at 20oC
Discharge Capacity (Ah) Discharge Energy (Wh/Kg)

Electrochemical Technologies Group
NESC-Battery Working Group Review –NASA Battery workshop 2007
• Quallion Baseline Electrolyte
Quallion 4 Ah Lithium-Ion Pouch CellsInitial Characterization/Conditioning at 0oC
Electrochemical Technologies Group
NESC-Battery Working Group Review –NASA Battery workshop 2007
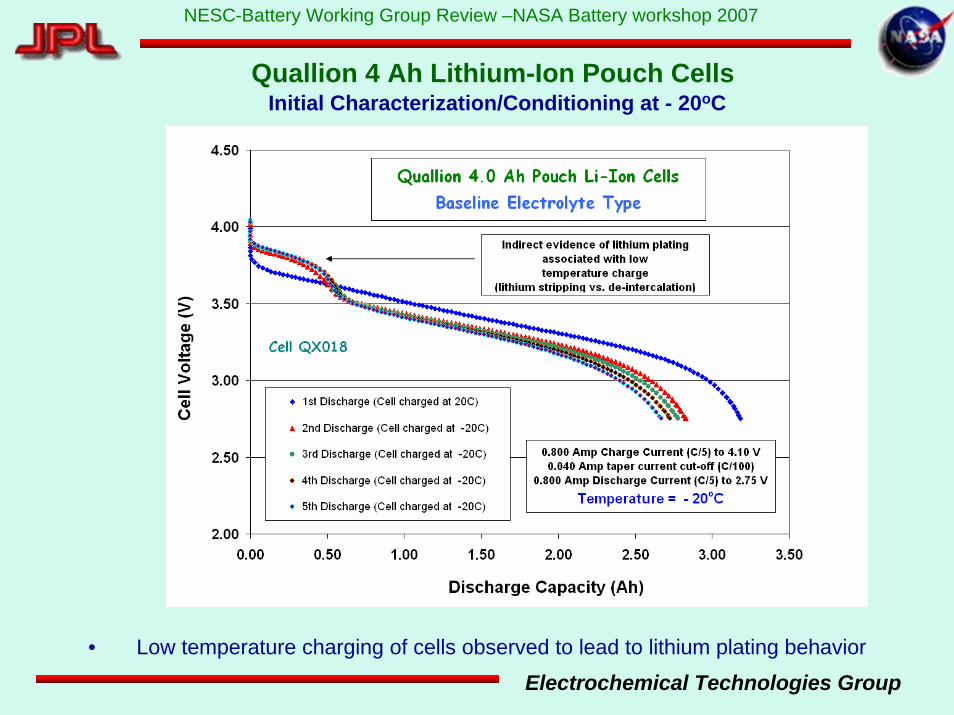
• Low temperature charging of cells observed to lead to lithium plating behavior
Quallion 4 Ah Lithium-Ion Pouch CellsInitial Characterization/Conditioning at - 20oC
Electrochemical Technologies Group
NESC-Battery Working Group Review –NASA Battery workshop 2007
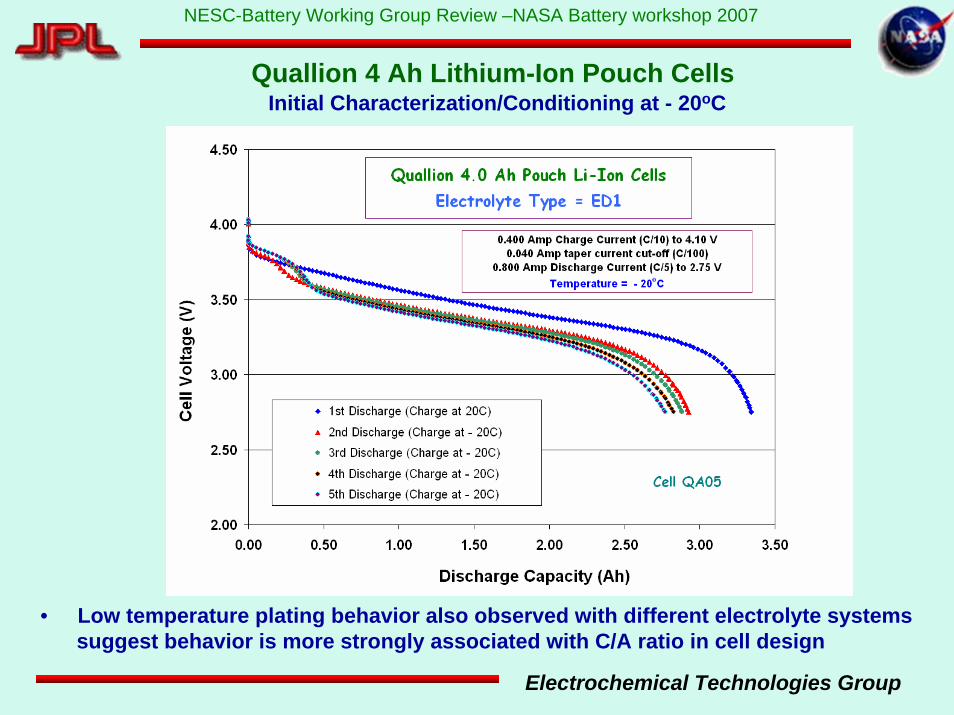
• Low temperature plating behavior also observed with different electrolyte systems suggest behavior is more strongly associated with C/A ratio in cell design
Quallion 4 Ah Lithium-Ion Pouch CellsInitial Characterization/Conditioning at - 20oC

Electrochemical Technologies Group
NESC-Battery Working Group Review –NASA Battery workshop 2007
Under similar cycling conditions (i.e., low rate charge, C/10) plating was not observed in high power 18650 design (different chemistry charge voltage: 4.2V).However, plating was observed at more aggressive charge rates.
Quallion 18650 Ah High Power Lithium-Ion CellsInitial Characterization/Conditioning at - 20oC

Electrochemical Technologies Group
NESC-Battery Working Group Review –NASA Battery workshop 2007
Quallion 18650 1.5 Ah High Power Lithium-Ion Cells Charge Rate Characterization Testing - Overview
• Completed testing at 20o, 0o, -10o, -20oC and -30oC
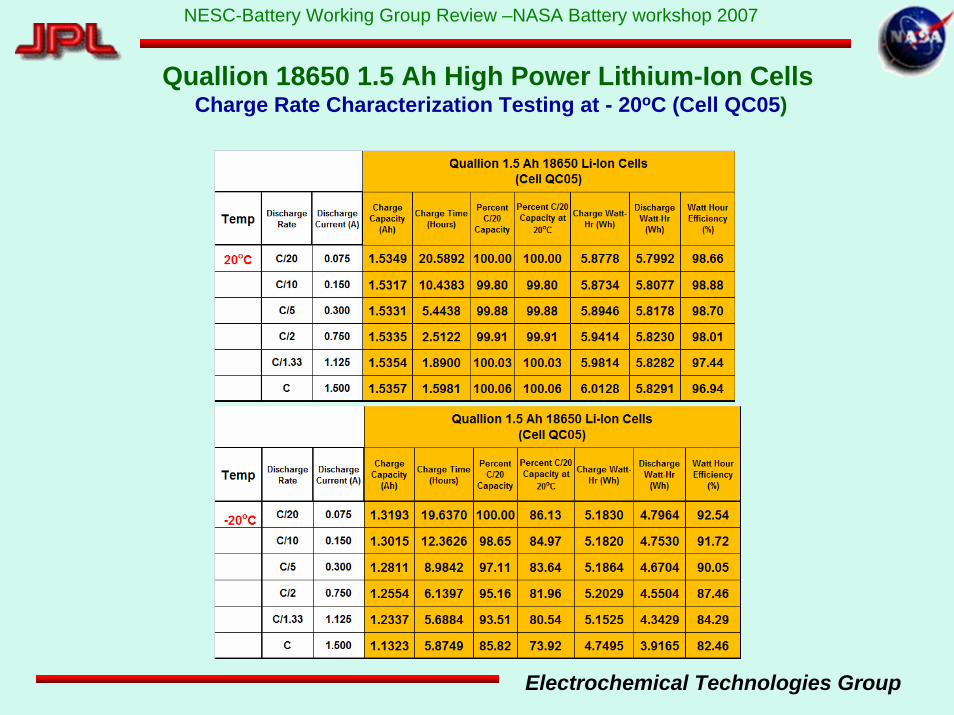
Charge Characterization Test Procedure (2 cells on test)• Six different charge rates evaluated (C20 , C10, C/5, C/2, C/1.33 and C Rates)• All C rates based on nameplate capacity of 3.70Ah• 7 different temperatures to be evaluated (20, 0, -10, -20o, -30o, -40o and -50oC)• Charge and discharge performed at prescribed temperature• Two cycles performed for each rate (data plotted from second cycle)• Cells charged to 4.20 V (with C/100 taper current cut-off)• Cells discharged to 2.75V • Cells allowed to soak in chamber 6 hours prior to testing• Higher charge rates will be considered depending upon results of testing
Electrochemical Technologies Group
NESC-Battery Working Group Review –NASA Battery workshop 2007
Quallion 18650 1.5 Ah High Power Lithium-Ion CellsCharge Rate Characterization Testing at - 20oC (Cell QC05)

Electrochemical Technologies Group
NESC-Battery Working Group Review –NASA Battery workshop 2007
Quallion 18650 1.5 Ah High Power Lithium-Ion Cells Charge Rate Characterization Testing- Charge Capacity (Ah) (Cell QC05)
Temperature = 20oCTemperature = - 20oC
Temperature = - 30oC
• At low temperatures, there is no benefit using higher rates (i.e. in excess of C/5) in terms of charge time.
Electrochemical Technologies Group
NESC-Battery Working Group Review –NASA Battery workshop 2007
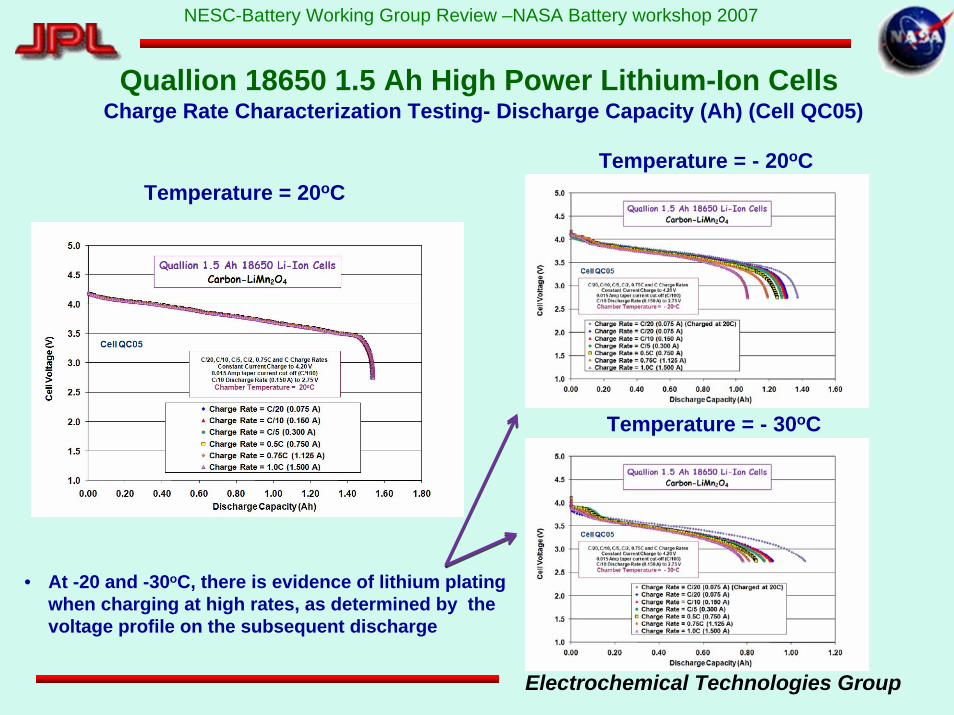
Quallion 18650 1.5 Ah High Power Lithium-Ion CellsCharge Rate Characterization Testing- Discharge Capacity (Ah) (Cell QC05)
Temperature = 20oCTemperature = - 20oC
Temperature = - 30oC
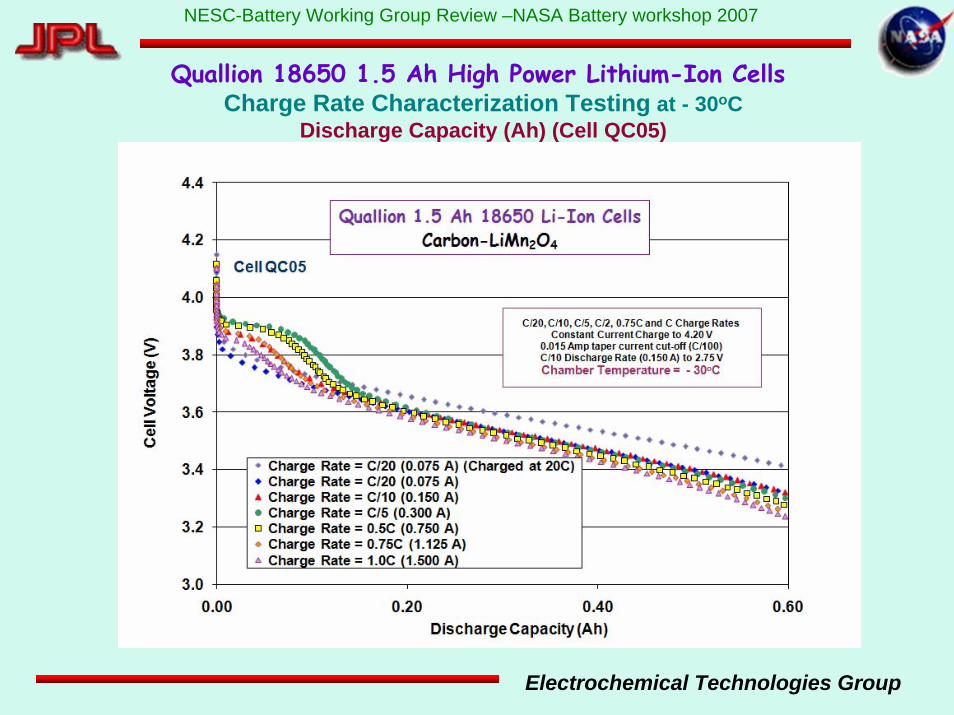
• At -20 and -30oC, there is evidence of lithium plating when charging at high rates, as determined by the voltage profile on the subsequent discharge
Electrochemical Technologies Group
NESC-Battery Working Group Review –NASA Battery workshop 2007
Quallion 18650 1.5 Ah High Power Lithium-Ion Cells Charge Rate Characterization Testing at - 30oC
Discharge Capacity (Ah) (Cell QC05)

Electrochemical Technologies Group
NESC-Battery Working Group Review –NASA Battery workshop 2007
A123 2.20 Ah High Power Lithium-Ion CellsCharge Rate Characterization Testing
Electrochemical Technologies Group
NESC-Battery Working Group Review –NASA Battery workshop 2007
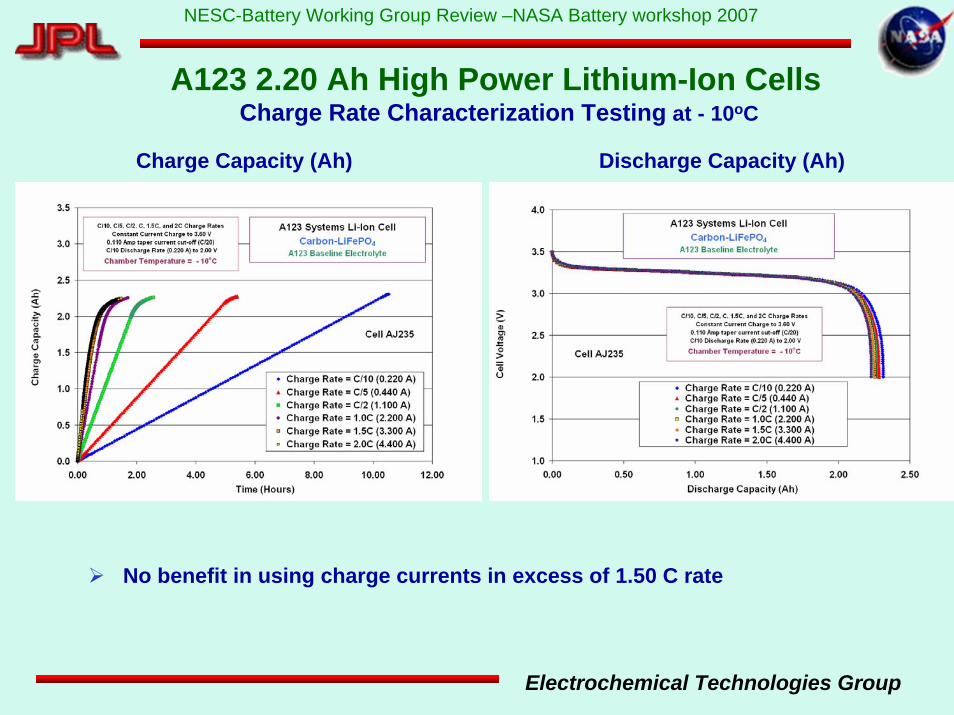
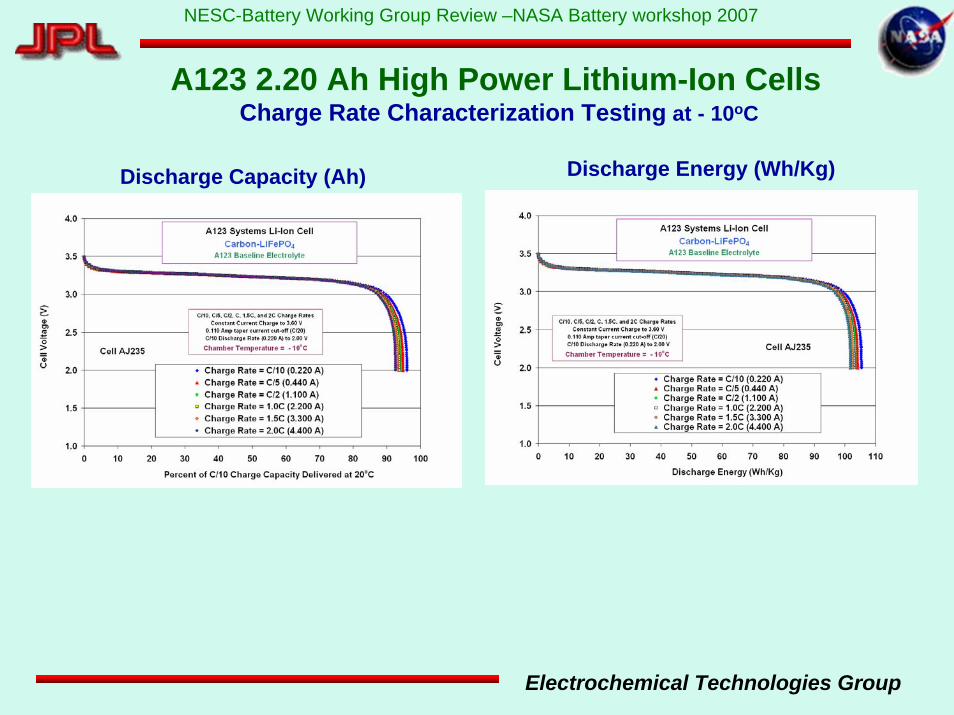
A123 2.20 Ah High Power Lithium-Ion CellsCharge Rate Characterization Testing at - 10oC
Charge Capacity (Ah) Discharge Capacity (Ah)
No benefit in using charge currents in excess of 1.50 C rate
Electrochemical Technologies Group
NESC-Battery Working Group Review –NASA Battery workshop 2007
A123 2.20 Ah High Power Lithium-Ion CellsCharge Rate Characterization Testing at - 10oC
Discharge Capacity (Ah) Discharge Energy (Wh/Kg)

Electrochemical Technologies Group
NESC-Battery Working Group Review –NASA Battery workshop 2007
Yardney 7 Ah Prismatic Lithium-Ion Cells Charge Rate Characterization Testing - Overview
Charge Characterization Test Procedure (2 cells on test)• Six different charge rates evaluated (C/20, C10, C/5, C/2, 0.75C and C Rates)• All C rates based on nameplate capacity of 7.00 Ah• 7 different temperatures to be evaluated (20, 0, -10, -20o, -30o, and -40oC)• Charge and discharge performed at prescribed temperature• Two cycles performed for each rate (data plotted from second cycle)• Cells charged to 4.10 V (with C/100 taper current cut-off)• Cells discharged to 2.50V • Cells allowed to soak in chamber 6 hours prior to testing• Higher charge rates will be considered depending upon results of testing.
• Completed testing at 20, 10, 0, -10, -20, -30 and -40oC

Electrochemical Technologies Group
NESC-Battery Working Group Review –NASA Battery workshop 2007
Yardney 7 Ah Prismatic Lithium-Ion Cells Charge Rate Characterization Testing at - 20oC (Cell LW242)

Electrochemical Technologies Group
NESC-Battery Working Group Review –NASA Battery workshop 2007
Yardney 7 Ah Prismatic Lithium-Ion CellsCharge Rate Characterization Testing at Different Temperatures

Electrochemical Technologies Group
NESC-Battery Working Group Review –NASA Battery workshop 2007
Yardney 7 Ah Prismatic Lithium-Ion CellsCharge Rate Characterization Testing at 0oC
Charge Capacity (Ah) Discharge Capacity (Ah)
No benefit in using charge currents in excess of 0.75 C rate

Electrochemical Technologies Group
NESC-Battery Working Group Review –NASA Battery workshop 2007
Yardney 7 Ah Prismatic Lithium-Ion CellsCharge Rate Characterization Testing at -20oC
Charge Capacity (Ah) Discharge Capacity (Ah)
No benefit in using charge currents in excess of C/2 rate

Electrochemical Technologies Group
NESC-Battery Working Group Review –NASA Battery workshop 2007
Yardney 7 Ah Prismatic Lithium-Ion CellsCharge Rate Characterization Testing at -40oC
Charge Capacity (Ah) Discharge Capacity (Ah)
No indication of lithium plating No benefit in using charge currents in excess of C/20 rate
Electrochemical Technologies Group
NESC-Battery Working Group Review –NASA Battery workshop 2007
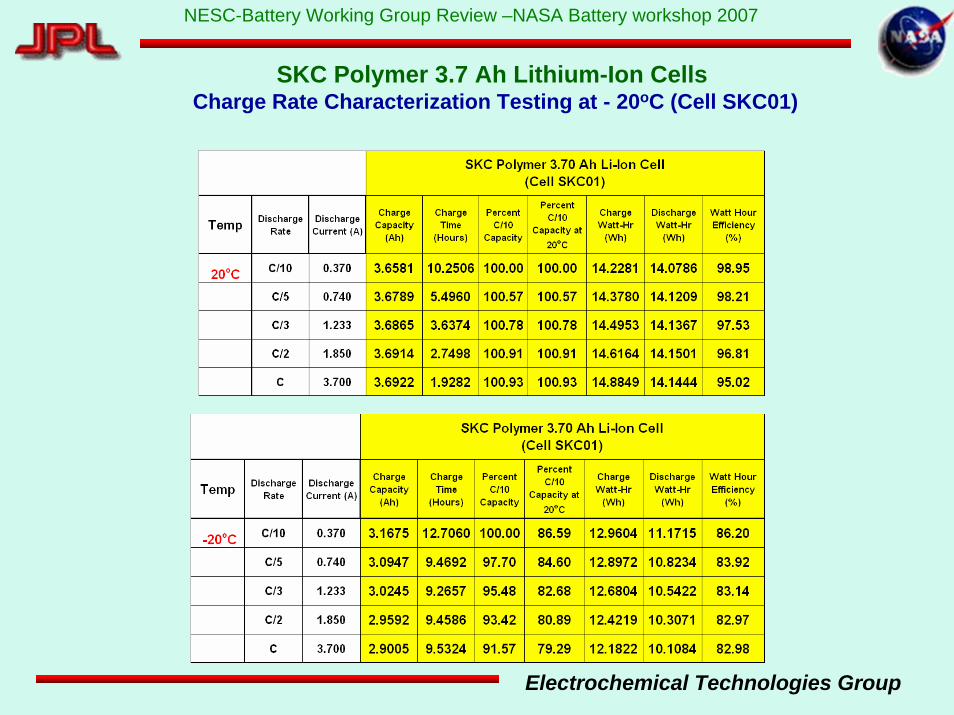
SKC Polymer 3.7 Ah Lithium-Ion CellsCharge Rate Characterization Testing at - 20oC (Cell SKC01)
Electrochemical Technologies Group
NESC-Battery Working Group Review –NASA Battery workshop 2007
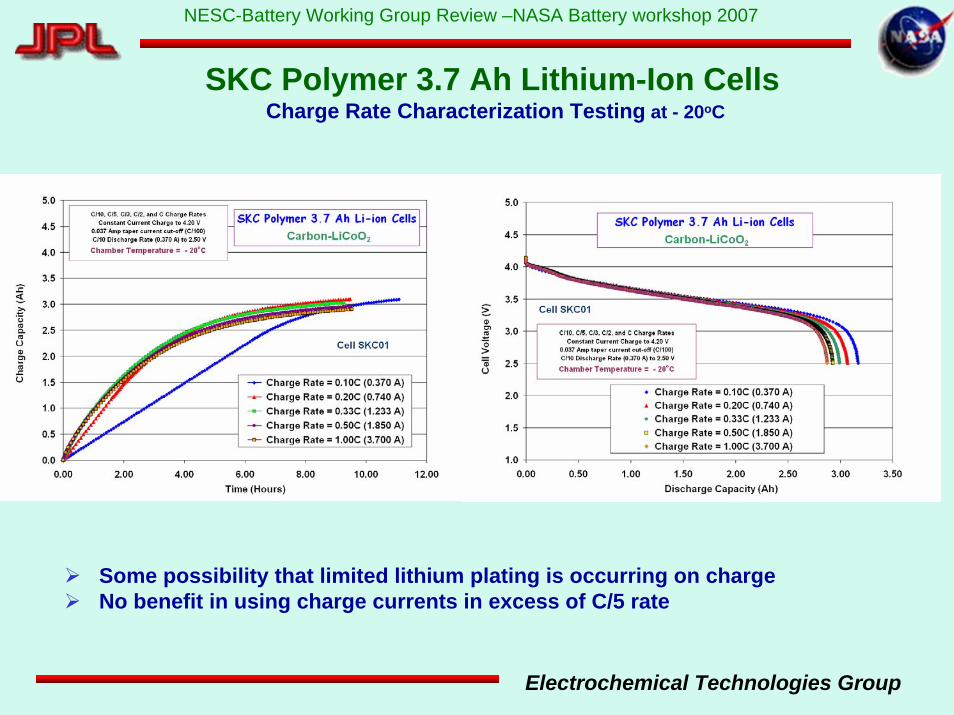
SKC Polymer 3.7 Ah Lithium-Ion CellsCharge Rate Characterization Testing at - 20oC
Some possibility that limited lithium plating is occurring on chargeNo benefit in using charge currents in excess of C/5 rate

Electrochemical Technologies Group
NESC-Battery Working Group Review –NASA Battery workshop 2007
Summary• We have started examining different Li-ion cells (with different electrolytes, in
different configurations and from different manufacturers) in terms of their ability to tolerate high charge rates at extreme temperatures
– Quallion standard cells, Quallion pouch cells, SKC cells, Yardney and SAFT cells, and A123 cells.
• Determined appropriate charge rates as a function of temperature for a number of cell types/designs, many of which contain different electrolytes and cathodes.
• A number of cells contain low temperature electrolytes, and current efforts are focused upon determining the influence of electrolyte type upon propensity to plate lithium under forcing conditions.
• Three-electrode cells are also being fabricated and tested for more fundamental understanding of this problem.
• Finally, we will attempt to make a correlation between the propensity for Li plating and various cell design paymasters, such as nature electrode and electrolyte materials and ratio of capacities.
• Similar charge rate studies will be extended to warm temperatures to determine the capacity fade rate, attributable to the electrolyte oxidation, as function of charge rates.

Electrochemical Technologies Group
NESC-Battery Working Group Review –NASA Battery workshop 2007
Acknowledgments
The work described here was carried out at the Jet Propulsion Laboratory (JPL), California Institute of Technology, for the NESC Advanced Battery Technology Program, under contract with the National Aeronautics and Space Administration (NASA). We also thank the battery manufacturers for providing us with the test articles.


