
SABMiller plcQuarterly divisional seminar seriesAfrica and AsiaAri MervisManaging Director SABMiller Asia
Mark BowmanManaging Director SABMiller Africa
Mark Luce Commercial Director SABMiller Asia
Jonathan Kirby Finance Director SABMiller Africa and Asia
Gary LeibowitzSenior Vice President Investor Relations
22 September 2009 (London) and 23 September 2009 (New York)

Africa and Asia Seminar 2009 2©SABMiller plc 2009 2
IntroductionGary Leibowitz

Africa and Asia Seminar 2009 3©SABMiller plc 2009 3
Forward looking statements
This presentation includes “forward looking statements”. These statements contain the words “anticipate”, “believe”, “intend”, “estimate”, “expect” and words of similar meaning. All statements other than statements of historical facts included in this presentation, including, without limitation, those regarding the Company’s financial position, business strategy, plans and objectives of management for future operations (including development plans and objectives relating to the Company’s products and services) are forward-looking statements. Such forward-looking statements involve known and unknown risks, uncertainties and other important factors that could cause the actual results, performance or achievements of the Company to be materially different from future results, performance or achievements expressed or implied by such forward-looking statements. Such forward-looking statements are based on numerous assumptions regarding the Company’s present and future business strategies and the environment in which the Company will operate in the future. These forward-looking statements speak only as at the date of this presentation. The Company expressly disclaims any obligation or undertaking to disseminate any updates or revisions to any forward-looking statements contained herein to reflect any change in the Company’s expectations with regard thereto or any change in events, conditions or circumstances on which any such statement is based.

Africa and Asia Seminar 2009 4©SABMiller plc 2009 4
Africa & Asia – increasing contributor to group results
* Excludes contract brewing, includes soft drinks and other alcoholic beverages **Before corporate costs and excluding exceptional items and the amortisation of intangible assets (excluding software)
■ Latin America ■ Europe ■ North America
■ Africa & Asia ■ South Africa
Twelve months to 31 March 2009
Revenue EBITA**Volumes*
21%
18%26%
17%
18%
22%
24%
16%
17%
21%
28%
22%
15%
21%
14%
Africa and Asia Seminar 2009 5©SABMiller plc 2009 5
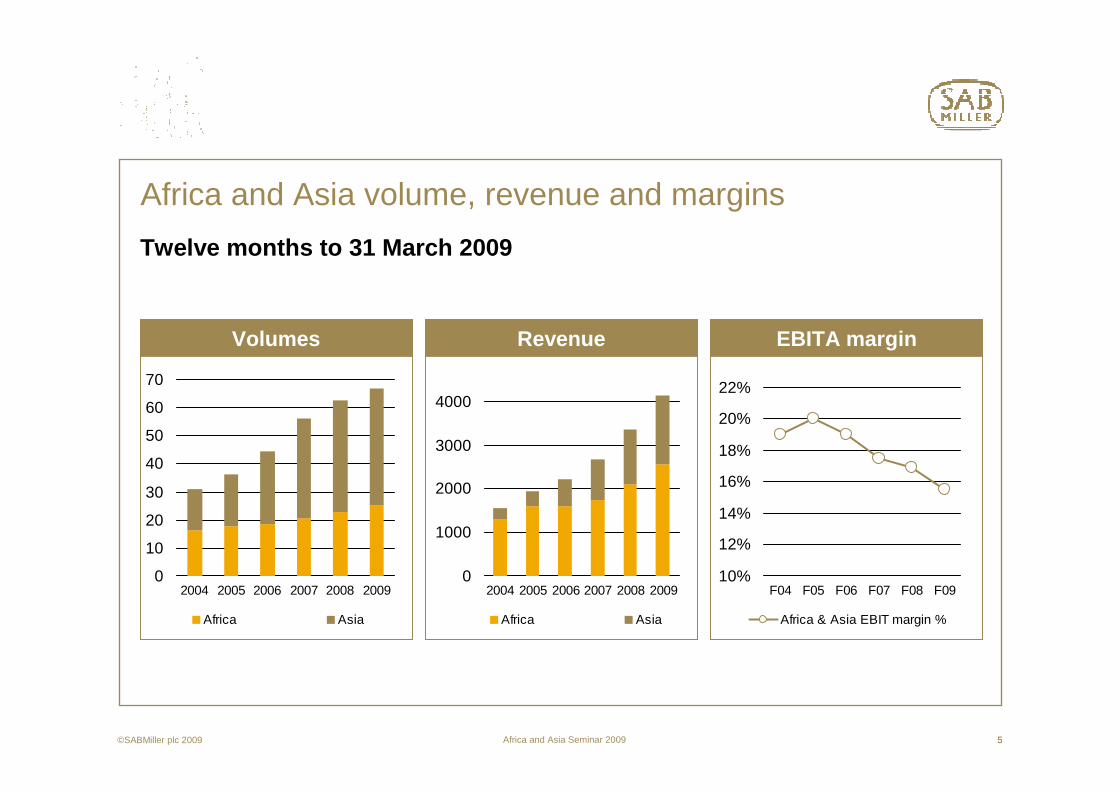
Africa and Asia volume, revenue and margins
Twelve months to 31 March 2009
Revenue EBITA marginVolumes
10%
12%
14%
16%
18%
20%
22%
F04 F05 F06 F07 F08 F09
Africa & Asia EBIT margin %
0
10
20
30
40
50
60
70
2004 2005 2006 2007 2008 2009
Africa Asia
0
1000
2000
3000
4000
2004 2005 2006 2007 2008 2009
Africa Asia

Africa and Asia Seminar 2009 6©SABMiller plc 2009 6
Our speakers today
Mark Bowman (1993)� 2007 Managing Director – SABMiller Africa� 2006 Managing Director – SABMiller Poland� 2003 Managing Director – ABI� 1993 Joined SAB South Africa
Jon Kirby (1992)� 1998 Financial Director – SABMiller Africa and Asia� 1997 Financial Director – Kgalagadi Breweries Limited – Botswana� 1992 Joined SAB South Africa

Africa and Asia Seminar 2009 7©SABMiller plc 2009 7
Our speakers today
Ari Mervis (1989)� 2007 Managing Director, SABMiller Asia
– Chairman of CRSnow Breweries (2009)� 2006 Managing Director, SABMiller Australia� 2002 Managing Director, SABMiller Russia and CIS� 1997 Managing Director, Appletiser� 1996 Regional General Manager – ABI� 1994 Managing Director, Swaziland Bottling Company� 1989 Joined SABMiller Soft Drinks Division (ABI)
Mark Luce (1997)� 2008 Commercial Director, SABMiller Asia� 2005 Senior Vice President Marketing, SABMiller South America� 2003 International Business Development Director – SABMiller plc� 2000 Managing Director, Pilsner Urquell� 1997 Marketing Director, SABMiller Europe

Africa and Asia Seminar 2009 8
Africa and Asia Seminar 2009 9©SABMiller plc 2009 9
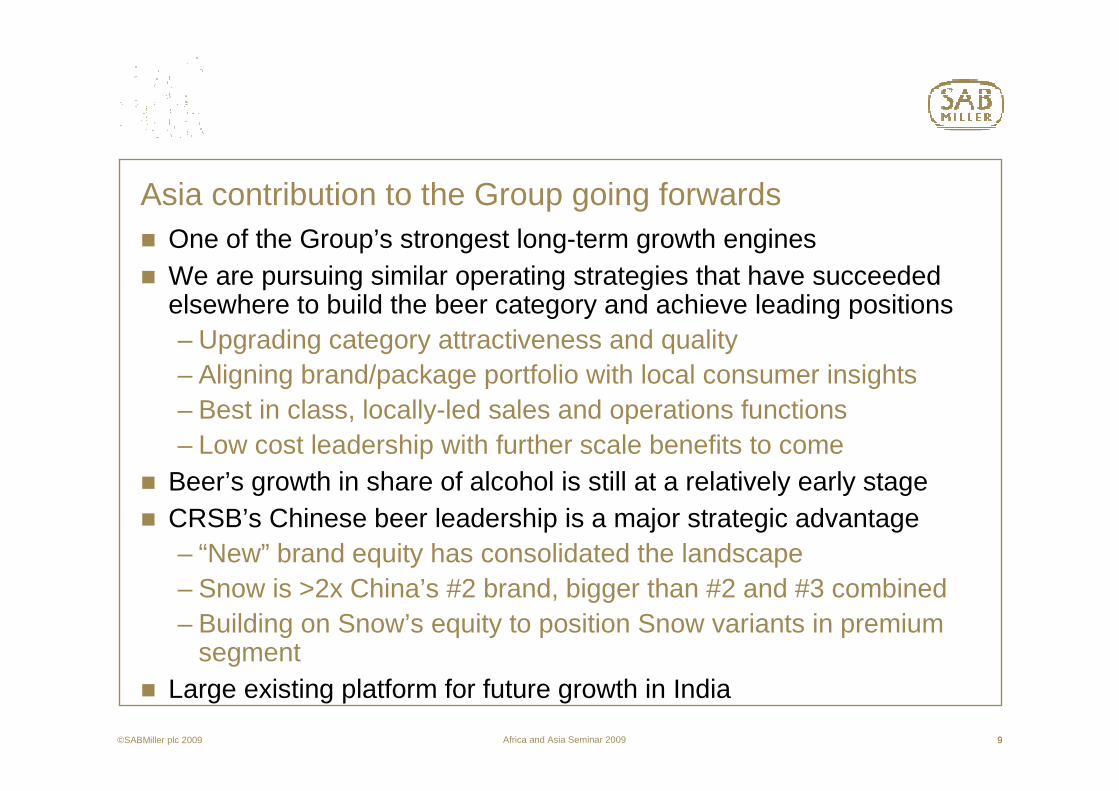
Asia contribution to the Group going forwards� One of the Group’s strongest long-term growth engines� We are pursuing similar operating strategies that have succeeded
elsewhere to build the beer category and achieve leading positions– Upgrading category attractiveness and quality– Aligning brand/package portfolio with local consumer insights– Best in class, locally-led sales and operations functions– Low cost leadership with further scale benefits to come
� Beer’s growth in share of alcohol is still at a relatively early stage� CRSB’s Chinese beer leadership is a major strategic advantage
– “New” brand equity has consolidated the landscape– Snow is >2x China’s #2 brand, bigger than #2 and #3 combined– Building on Snow’s equity to position Snow variants in premium
segment � Large existing platform for future growth in India

Africa and Asia Seminar 2009 10©SABMiller plc 2009 10
Agenda
Asia regional context
India strategy
China strategy� Anhui case study
Australia & Vietnam update
Outlook
Q&A
Africa and Asia Seminar 2009 11©SABMiller plc 2009 11
Regional context Ari Mervis
Africa and Asia Seminar 2009 12
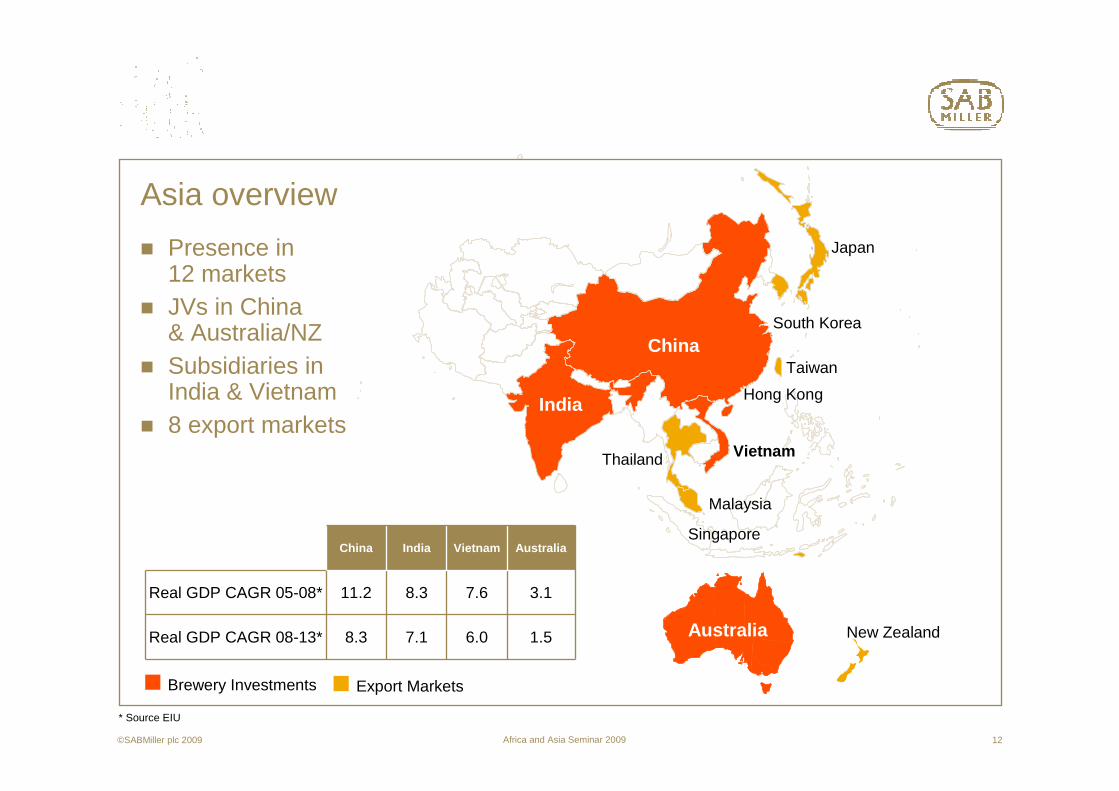
Asia overview
� Presence in 12 markets
� JVs in China & Australia/NZ
� Subsidiaries in India & Vietnam
� 8 export markets
China
INDIA
Australia
Vietnam
* Source EIU
Brewery Investments Export Markets
China India Vietnam Australia
Real GDP CAGR 05-08* 11.2 8.3 7.6 3.1
Real GDP CAGR 08-13* 8.3 7.1 6.0 1.5
Japan
New Zealand
Singapore
Malaysia
Thailand
South Korea
Taiwan
Hong KongIndia
©SABMiller plc 2009

Africa and Asia Seminar 2009 13
-5%
0%
5%
10%
15%
0 25 50 75 1000%
25%
50%
75%
100%
0 5 10 15
China
PCC Pure Alcohol Consumption (L), 2008PCC Beer Consumption (L), 2008
Brewery Investments
Export Market
= 100mn Population
Bee
r M
arke
t Gro
wth
(03
-08
CA
GR
)
Bee
r S
hare
of A
lcoh
ol
Asia is a heterogeneous region
Source: Canadean, Plato Logic, SABMiller Internal Analysis
Brewery Investments
Export Market
= 50 mn HL Annual Volume
China
Vietnam
India
South Korea Japan
Australia
World Avg
World Avg
China
Vietnam
IndiaSouth Korea
Japan
Australia
World Avg
World Avg
Asia alcohol consumption and beer shareAsia beer market volume and growth
©SABMiller plc 2009

Africa and Asia Seminar 2009 14©SABMiller plc 2009 14
India strategy

Africa and Asia Seminar 2009 15©SABMiller plc 2009 15
SABMiller footprint affords strong platform…….
Key observations� Profitability between states
varies significantly� SABMiller breweries well located
to exploit profitable growth� Production and supply chain grid
leverages first mover advantage
SIKKIM
ASSAM
TRIPURAGUJARAT
MADHYA PRADESH
RAJASTHAN
BIHAR
UTTARPRADESH
JHARKHAND
DELHI
HARYANA
MANIPUR
NAGALAND
ARUNACHALPRADESH
MEGHALAY
UTTAR-ANCHAL
HIMACHALPRADESH
PUNJAB
MIZORAM
KERALA
TAMIL NADL
KA
RN
ATA
KA
MAHARASHTRA
GOA
ANDHARPRADESH
ORISSA
JAMMU ANDKASHMIR
CH
HAT
TISG
ARAH
WESTBENGAL
Malabar
MBL
CBL
PALSFosters
RBLCDBLHBL
ECB
Existing capacity
Industry size : 14 mhlBeer pcc : 1.1lNo. of breweries : 65+3 year CAGR : 13%Main players : 2 with 75% MS
PDC

Africa and Asia Seminar 2009 16
India: fundamentals in place for further growth......
� Growing population:– Middle class growing from 5% in ‘05 to 43% in 2025e* – Growth in urbanisation 4% YoY– 41% of population below LDA
� Strong economic growth :– GDP +7% CAGR in coming 5 years– Driving strong income growth
� Beer becoming accessible to more consumers� Beer only 5% of total alcohol consumed� Changing lifestyles driving experimentation
and desire for leading brands� Small, rapidly growing premium beer segment
*Source: Mckinsey Global Study
©SABMiller plc 2009
Africa and Asia Seminar 2009 17©SABMiller plc 2009 17
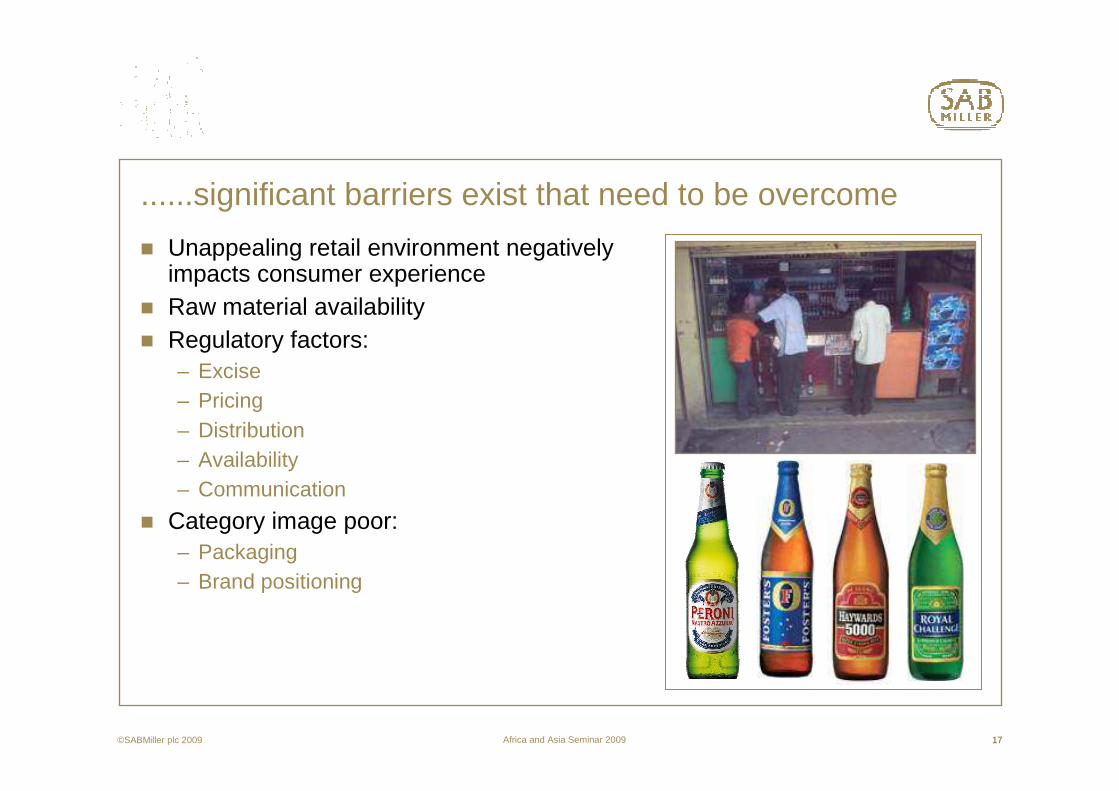
......significant barriers exist that need to be overcome
� Unappealing retail environment negatively impacts consumer experience
� Raw material availability� Regulatory factors:
– Excise– Pricing– Distribution– Availability– Communication
� Category image poor:– Packaging– Brand positioning

Africa and Asia Seminar 2009 18©SABMiller plc 2009 18
Category development� Segmentation informs category development
opportunities:– Consumption occasions where beer not consumed – Needs by occasion and mapping to beer ability
to deliver – Geography & level of urban development driving
current behaviour
� Portfolio development– Aspirational to LDAC urban middle class – Premiumisation– Drive category switch
� Compelling brand positionings & differentiated attributes vs IMFL
� Improved quality:– Packaging– Product
� Enhancing consumer experience at retail
Africa and Asia Seminar 2009 19©SABMiller plc 2009 19
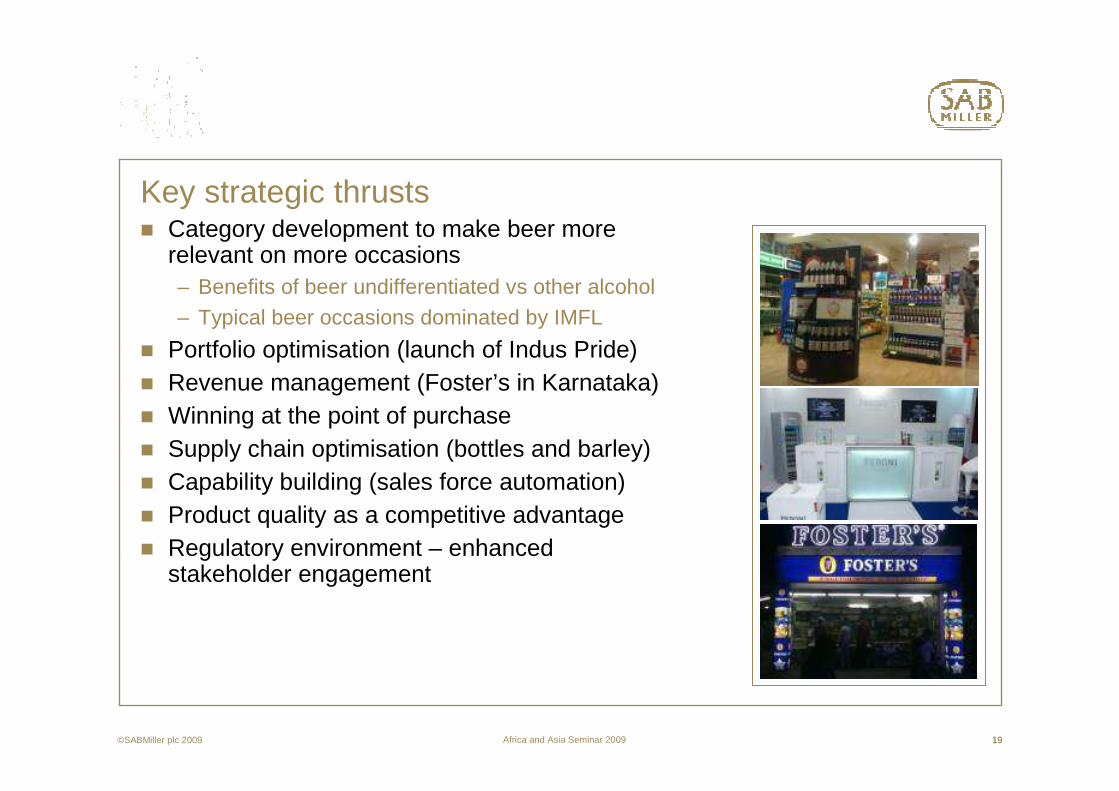
Key strategic thrusts� Category development to make beer more
relevant on more occasions– Benefits of beer undifferentiated vs other alcohol– Typical beer occasions dominated by IMFL
� Portfolio optimisation (launch of Indus Pride)� Revenue management (Foster’s in Karnataka)� Winning at the point of purchase� Supply chain optimisation (bottles and barley)� Capability building (sales force automation)� Product quality as a competitive advantage� Regulatory environment – enhanced
stakeholder engagement
Africa and Asia Seminar 2009 20©SABMiller plc 2009 20
China strategy
Africa and Asia Seminar 2009 21©SABMiller plc 2009 21
4090
140190240290340390440
1987 1990 1993 1996 1999 2002 2005 2008
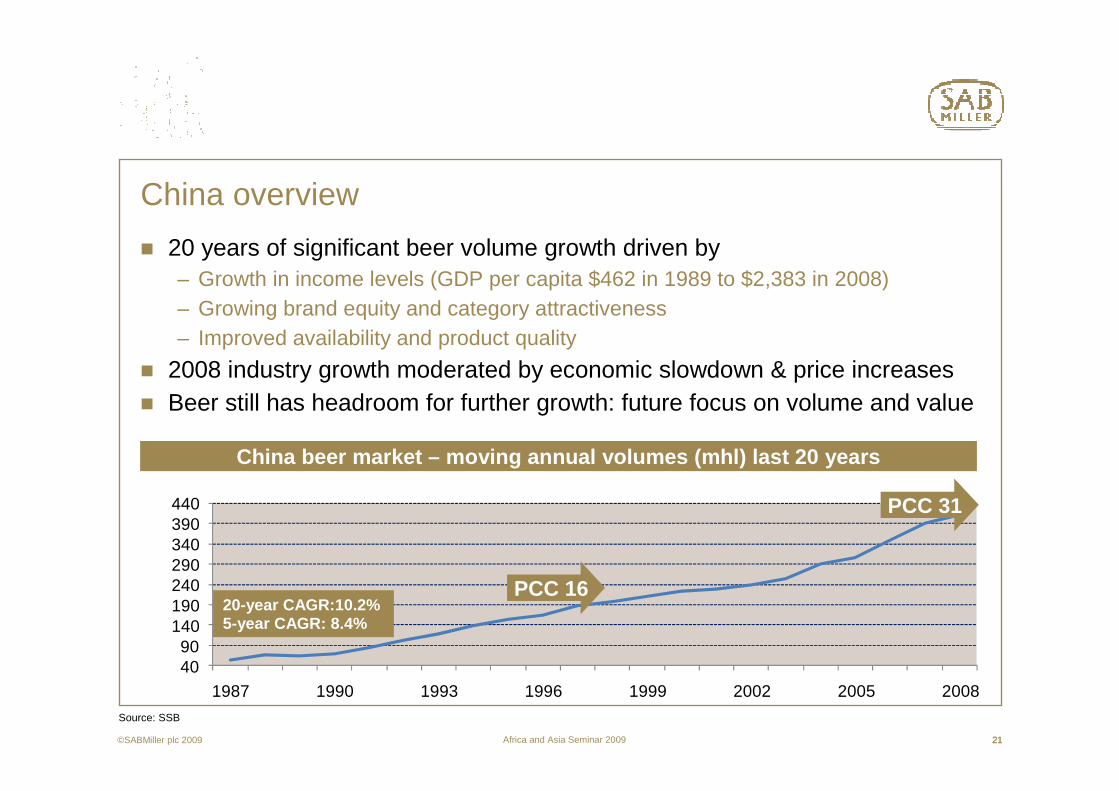
� 20 years of significant beer volume growth driven by– Growth in income levels (GDP per capita $462 in 1989 to $2,383 in 2008)– Growing brand equity and category attractiveness– Improved availability and product quality
� 2008 industry growth moderated by economic slowdown & price increases� Beer still has headroom for further growth: future focus on volume and value
China overview
20-year CAGR:10.2%5-year CAGR: 8.4%
China beer market – moving annual volumes (mhl) last 20 years
PCC 16
PCC 31
Source: SSB

Africa and Asia Seminar 2009 22
� Growing preference for beer amongst LDAC-24 Chinese consumers– Lifestyle– Category attractiveness– Availability
� Preference for beer maintained as consumers age
� Societal changes also driving beer preference
Beer share of alcohol has significant headroom
Source: Seema International estimates based on SSB, PRC Customs, China Alcoholic Drinks Association and industry contacts; SABMiller internal analysis
Asia WorldChina
29%39% 43% 45%
1%
2%5%
20%
70%59%
52%
35%
0%
10%
20%
30%
40%
50%
60%
70%
80%
90%
100%
1999 2008 2008 2008
Beer Wine Spirits
©SABMiller plc 2009

Africa and Asia Seminar 2009 23
Snow brand growth continues......
0
1,000
2,000
3,000
4,000
5,000
6,000
7,000
FY2002 FY2003 FY2004 FY2005 FY2006 FY2007 FY2008
'
SN OW T singtao Yanjing� Pre-eminent brand in portfolio:
– >80% of volume (2003 - 35%)– Extension of market leadership
16% share– 4 distinct variants/price points
� Volume growth supported by equity development
� Strong mainstream positioning, expanding into upper mainstream & premium
� Brand renovation ongoing to maintain relevance & appeal
Source: CR Snow, Annual Reports, Canadean, JPMorgan and Goldman Sachs
©SABMiller plc 2009

Africa and Asia Seminar 2009 24©SABMiller plc 2009 24
Revenue management
� Continued growth in revenue/hl achieved through:– Ongoing consolidation of brand
portfolio around Snow brand– Increasing proportion of sales in
above-mainstream segments– Disciplined promotional & channel
investments– Rapid M&A integration– Favourable geographic mix –
high growth regions deliver more attractive revenue/hl
– Benefits of prior year price increases being realised
CRSnow*
6 months ending June 2008 2009 Inc %
Capacity mhl 113.3 136 20
Sales vol mhl 34.9 41.9 20
Turnover US$m 979 1,224 25
Revenue/hl US$ 27.96 29.21 4.5
EBIT US$m 61.8 94.8 53
*Source CRE published data, management accounts
HK$ converted to US$ at exchange rate of 7.75
Africa and Asia Seminar 2009 25
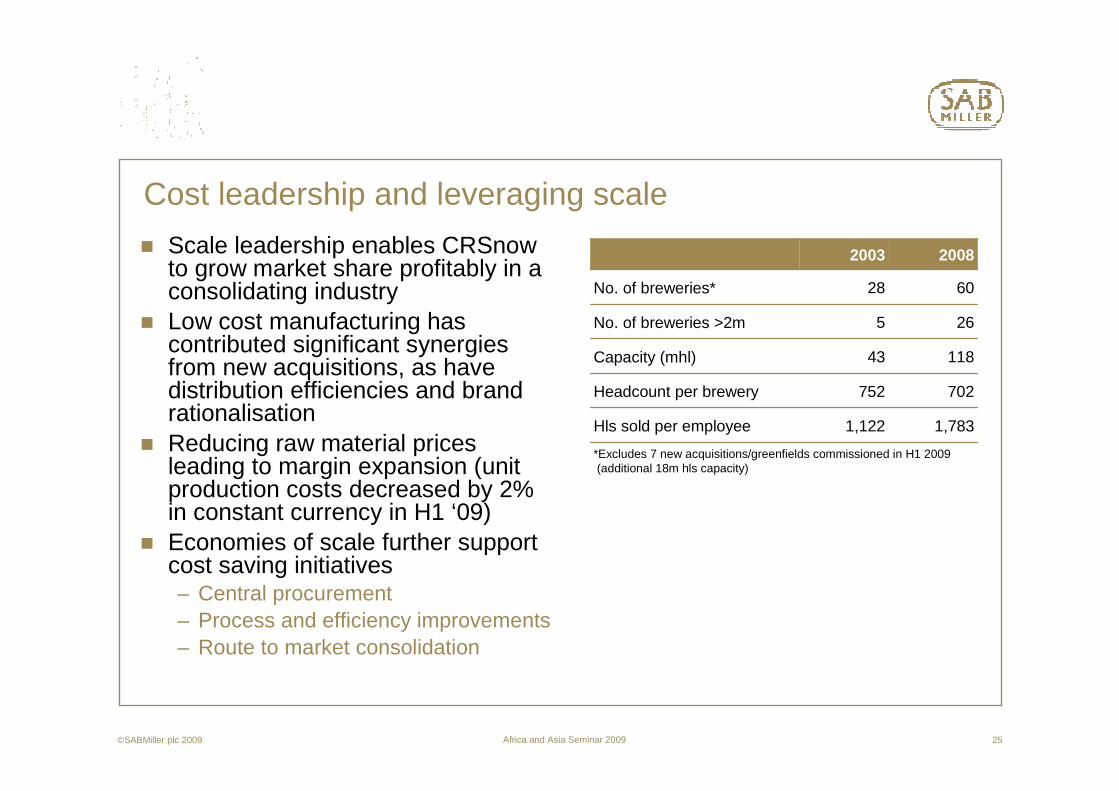
Cost leadership and leveraging scale
� Scale leadership enables CRSnowto grow market share profitably in a consolidating industry
� Low cost manufacturing has contributed significant synergies from new acquisitions, as have distribution efficiencies and brand rationalisation
� Reducing raw material prices leading to margin expansion (unit production costs decreased by 2% in constant currency in H1 ‘09)
� Economies of scale further support cost saving initiatives– Central procurement – Process and efficiency improvements– Route to market consolidation
2003 2008
No. of breweries* 28 60
No. of breweries >2m 5 26
Capacity (mhl) 43 118
Headcount per brewery 752 702
Hls sold per employee 1,122 1,783
*Excludes 7 new acquisitions/greenfields commissioned in H1 2009 (additional 18m hls capacity)
©SABMiller plc 2009
Africa and Asia Seminar 2009 26
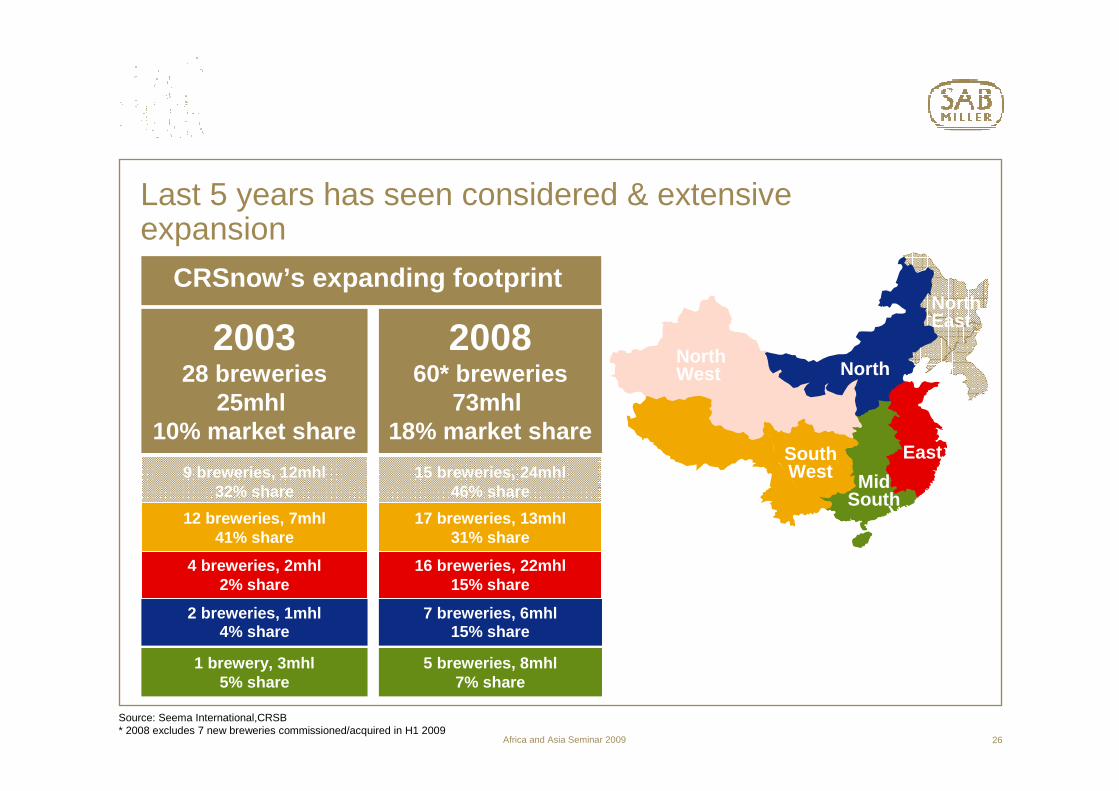
Last 5 years has seen considered & extensive expansion
Source: Seema International,CRSB* 2008 excludes 7 new breweries commissioned/acquired in H1 2009
Mid South
East
NorthEast
North
SouthWest
NorthWest
2 breweries, 1mhl 4% share
9 breweries, 12mhl 32% share
4 breweries, 2mhl 2% share
1 brewery, 3mhl 5% share
12 breweries, 7mhl 41% share
CRSnow’s expanding footprint
200328 breweries
25mhl 10% market share
200860* breweries
73mhl 18% market share
7 breweries, 6mhl 15% share
15 breweries, 24mhl 46% share
16 breweries, 22mhl 15% share
5 breweries, 8mhl 7% share
17 breweries, 13mhl 31% share

Africa and Asia Seminar 2009 27
…..with a deliberate approach to market share growth
Zhejiang 2004 – 12% market share Zhejiang 2009 – 33% market share
Market share >80% >60% >50% >30% <30%
©SABMiller plc 2009

Africa and Asia Seminar 2009 28©SABMiller plc 2009 28
� Consolidating our leadership position in China to create long term value– Provincial strongholds– Mainstream leadership– Above mainstream expansion– Superior channel management
� Increasing margins� Capitalise on Snow brand equity
to overcome legacy impediments� Large synergies from acquisitions� Expansion strategy provides most
advantaged base and platform for increasingly profitable growth
Summary
Growth 2008 vs 2003
10.0%17.9%
133.0%
46.0%
35.0%
0%
20%
40%
60%
80%
100%
120%
140%
Market share VolumeRevenue/hl EBITA/hl
20082003

Africa and Asia Seminar 2009 29©SABMiller plc 2009 29
Anhui case study: background
Source: CRSB
Anhui beer market landscape (2001)
PCC 15
# of competitors 24
# of breweries 25
# of brands/variants 30/>4000
Segment shares %:
economy 55
mainstream 31
above mainstream 14
Province profile vs China (2008)
Anhui China
Population 66.7m (78% rural) 1.3b (54% rural)
GDP/capita (RMB '000) 16.1 24.4
GDP/capita growth % 33% 27%
Income/capita (RMB '000)
urban 13 14.8
rural 4.2 4
Beer PCC 20 31
Anhui
Anhui case study

Africa and Asia Seminar 2009
Acquisitions 2 2 1 1 2 1
30
0%
20%
40%
60%
80%
2001 2003 2005 2007 2009
CRB Tsingtao Chong Pi Other
Source: CRSB
Strong Anhui market share growth through acquisition
Org. volume growth of 14% from breweries held since ‘05
Anhui case study
©SABMiller plc 2009
Africa and Asia Seminar 2009 31©SABMiller plc 2009 31
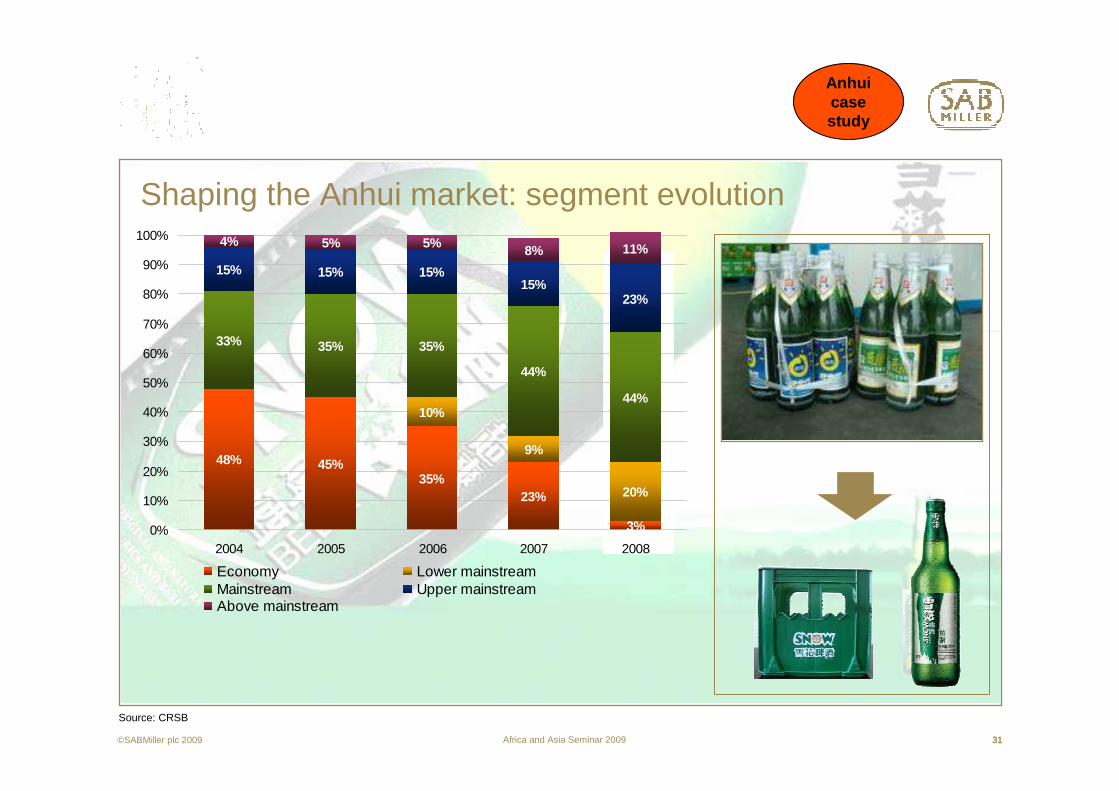
Shaping the Anhui market: segment evolution
48% 45%35%
23%
3%
10%
9%
20%
33% 35% 35%
44%
44%
15% 15% 15%15%
23%
4% 5% 5% 8% 11%
0%
10%
20%
30%
40%
50%
60%
70%
80%
90%
100%
2004 2005 2006 2007 2008
Economy Lower mainstreamMainstream Upper mainstreamAbove mainstream
Source: CRSB
Anhui case study
Africa and Asia Seminar 2009 32©SABMiller plc 2009 32
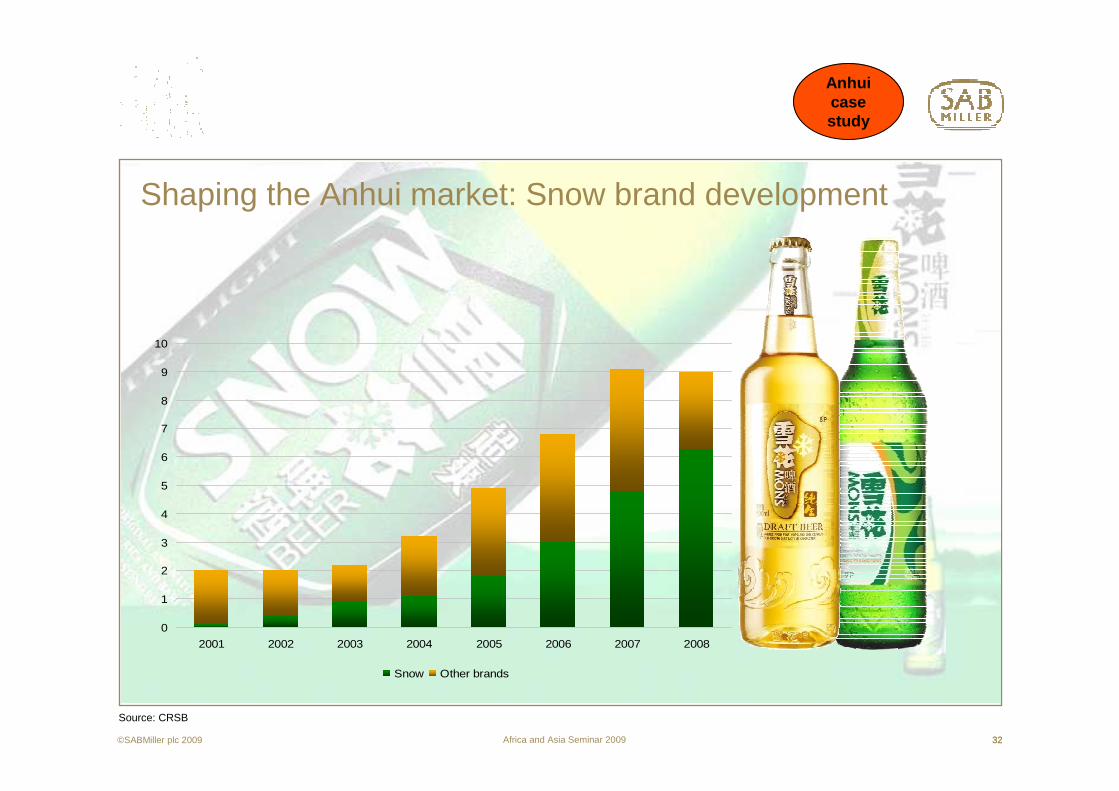
Shaping the Anhui market: Snow brand development
Source: CRSB
0
1
2
3
4
5
6
7
8
9
10
2001 2002 2003 2004 2005 2006 2007 2008
Snow Other brands
Anhui case study

Africa and Asia Seminar 2009 33
54%
40%
34%
28%
6%
64%
53%
45%
36%
16%
50%
42%
34%
26%
10%
58%
40%
34%
27%
7%
64%
53%
45%
36%
16%
©SABMiller plc 2009 33
........underpinned by strengthening brand equity
� Independently sourced research
� Strong conversion through the funnel
� Compares favourably against other beer brands and all Chinese brands
� Significant improvement in last 2 years
� Opportunities for further strengthening on regional basis
All China brands
AverageChina Beers
Average 2007
Source: BrandZ across 10 major cities
Bonding
Advantage
Performance
Relevance
Presence
2009

Africa and Asia Seminar 2009 34©SABMiller plc 2009 34
BreweryBrewery
Regional distributors Regional distributors
Channel AChannel A
1st tier distributors1st tier distributors
2nd tier distributors2nd tier distributors
All types of outletsAll types of outlets Channel BChannel B Channel CChannel C Channel DChannel D Channel EChannel E
DistributorsDistributors TransportersTransporters DistributorsDistributors DistributorsDistributors
BreweryBrewery
Shaping the market: restructuring RTM

Africa and Asia Seminar 2009 35©SABMiller plc 2009 35
� Robust channel segmentation:– Brand/pack availability in correct
channels and price tiers– Facilitates execution and TSPs– Enables appropriate investment in
each channel� Delivering the following benefits:
– Retail price compliance– Value chain management– Channel advocacy– Efficient management of returnable
bottle system– Addressing legacy impediments
to industry profitability
Shaping the market: superior channel management

Africa and Asia Seminar 2009 36©SABMiller plc 2009 36
� 59% market share� Enhanced revenue/hl & scale
driving EBITA growth� Barriers to entry established:
– Footprint and scale– Brand– Channel advocacy– Returnable system
….to build a leading & defendable market position and deliver improved financial performance in Anhui
Anhui growth 2008 vs 2003
38pp
283%
40%
180%
Source: BrandZ across 10 major cities
Volume Revenue/hl
EBITA/hl
Marketshare
Anhui case study

Africa and Asia Seminar 2009 37©SABMiller plc 2009 37
Australia & Vietnam update
Africa and Asia Seminar 2009 38©SABMiller plc 2009 38
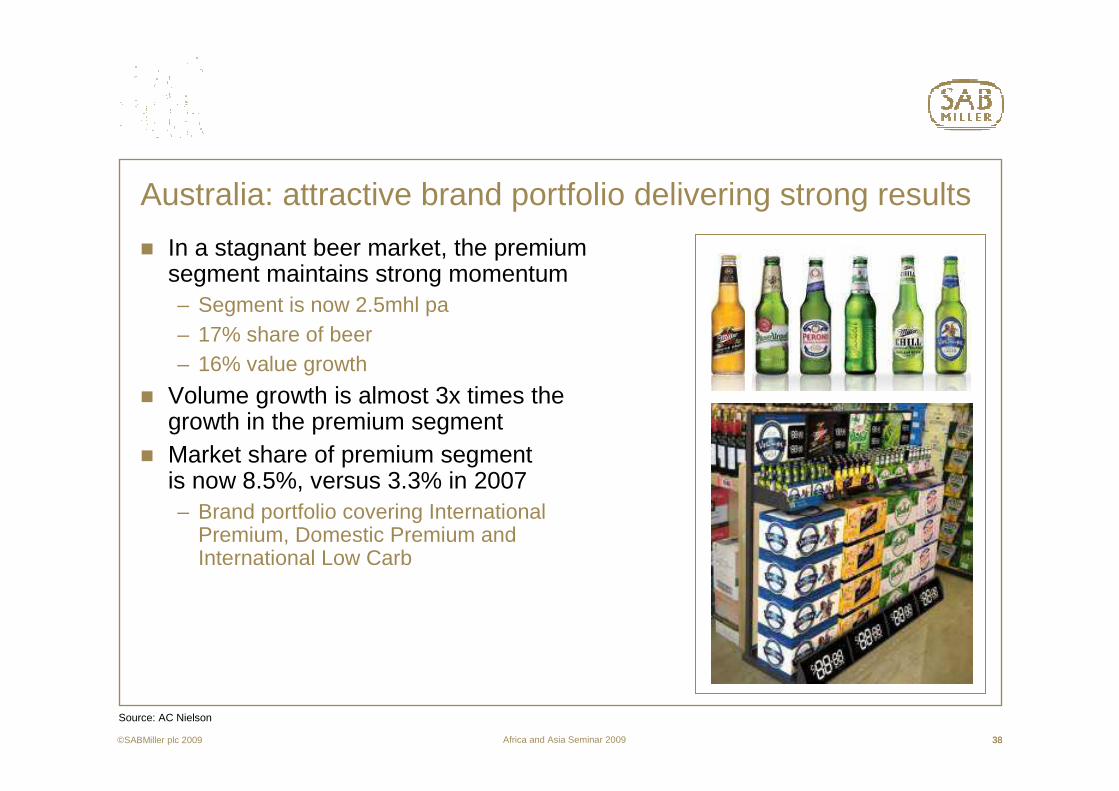
� In a stagnant beer market, the premium segment maintains strong momentum– Segment is now 2.5mhl pa– 17% share of beer– 16% value growth
� Volume growth is almost 3x times the growth in the premium segment
� Market share of premium segment is now 8.5%, versus 3.3% in 2007– Brand portfolio covering International
Premium, Domestic Premium and International Low Carb
Australia: attractive brand portfolio delivering strong results
Source: AC Nielson

Africa and Asia Seminar 2009 39©SABMiller plc 2009 39
� Peroni: strong growth from established base− Volume +44%− Loyalty and equity improvements − Holding price premium in commoditising market
� Grolsch: building momentum− Integrated into Pacific Beverages May 2008− Volume +24%− Highest awareness in portfolio @ 49%
� Bluetongue: outstripping segment growth 4:1− Volume +73%− Awareness +10 points. Strong consumer loyalty
once trialled
Building brand equity and momentum on core brands
Source: Pacific Beverages, brand tracking study

Africa and Asia Seminar 2009 40©SABMiller plc 2009 40
Innovation driving incremental value
Miller Chill launched November 2007 and created the flavour Infusion segment
Peroni Leggera launched March 2009– Exploits fast growing Premium International
and Low Carb segments– Volume incremental to Peroni
Peroni draught launch October 2009
Greenfield brewery capability for further innovation June 2010, as well as lower costs and fresher product

Africa and Asia Seminar 2009 41©SABMiller plc 2009 41
� Beer market continues to be buoyant at 18 mhl in 2008 with a five year CAGR of 14%
� Excise changes from 2010 will enhance profitability
� Zorok gaining traction, good velocity� Focus going forwards:
– Enhancing brand portfolio to capture premium opportunity
– Strengthening in-trade presence & execution
– Geographic expansion– Improve capacity utilization
Vietnam: focus on profitable growth to build a sustainable business

Africa and Asia Seminar 2009 42©SABMiller plc 2009 42
Miller High Life
� Premium segment accounts for 70% of HCM profit pool
� Limited consumer choice� American brands are highly
aspirational� Miller High Life offers
clear differentiation– Clear bottle– Sessionable & refreshing– Motivating imagery
� Enhanced profitability vs mainstream
� Launched August 2009

Africa and Asia Seminar 2009 43©SABMiller plc 2009 43
Show MHL TVC

Africa and Asia Seminar 2009 44©SABMiller plc 2009 44
Conclusion
� Asia remains one of the main toplinegrowth regions for the Group
� Clear strategies in place to deliver profitable growth
� Management actions build on proven skills elsewhere:– Category development– Portfolio optimisation– Winning at point of purchase– Cost leadership & productivity
� Hub in place to drive strategy, build capability and exploit other opportunities

Africa and Asia Seminar 2009 45©SABMiller plc 2009 45
Medium term value driver outlook
Outlook Africa Asia Africa & Asia
Volume growth Low-double digits
Revenue / hl growth
Mid-single digit
EBITA margin % growth
Impacted by India impediments in F10; +60-80 bps pa thereafter
Asia medium term guidance

SABMiller plcQuarterly divisional seminar seriesAfrica and AsiaAri MervisManaging Director SABMiller Asia
Mark BowmanManaging Director SABMiller Africa
Mark Luce Commercial Director SABMiller Asia
Jonathan Kirby Finance Director SABMiller Africa and Asia
Gary LeibowitzSenior Vice President Investor Relations
22 September 2009 (London) and 23 September 2009 (New York)
Africa and Asia Seminar 2009 48
Africa contribution to the Group going forwards
� Macro fundamentals are favourable; growth is from a low base� Entering new beverage categories to complement our leading beer
positions– Soft drinks including water– Other non-alcoholic beverages– A range of more affordable alcohol products
� Seizing on accelerating growth opportunities– Brand/package portfolios across broader price spectra and more
consumers and occasions– Intensified investment and sales presence in-trade
� Substantial investment in production, distribution and people� SABMiller has the leading strategic positioning in Africa, with
successful partnerships with Castel and The Coca-Cola Company
©SABMiller plc 2009
Africa and Asia Seminar 2009 49
Agenda
AfricaFull beverage portfolio
Differentiated beer portfolio
CSD’sWater
Winning at point of saleNew businessKey markets
Capacity and capability
Enterprise developmentOutlook
Q&A
©SABMiller plc 2009
Africa and Asia Seminar 2009
100
110
120
130
140
150
160
170
180
190
2000 2001 2002 2003 2004 2005 2006 2007 2008 2009 2010 2011
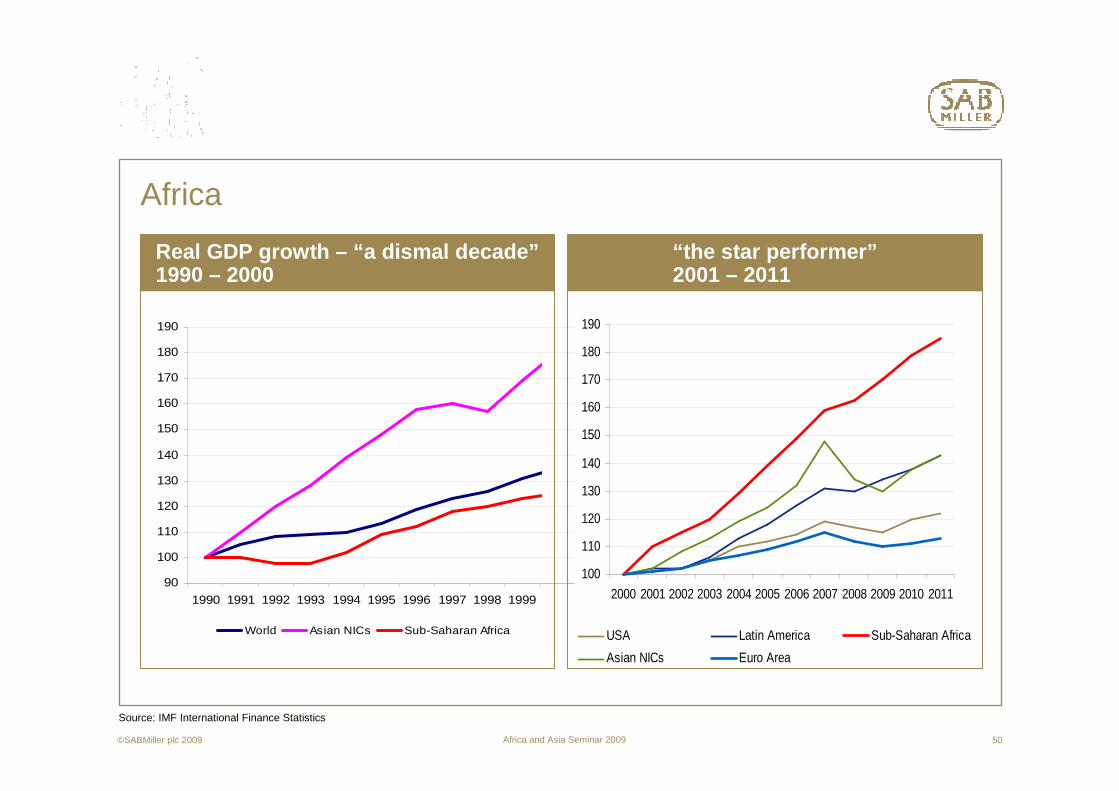
USA Latin America Sub-Saharan Africa
Asian NICs Euro Area
50
Africa
90
100
110
120
130
140
150
160
170
180
190
1990 1991 1992 1993 1994 1995 1996 1997 1998 1999
World Asian NICs Sub-Saharan Africa
Real GDP growth – “a dismal decade”1990 – 2000
Source: IMF International Finance Statistics
©SABMiller plc 2009
“the star performer”2001 – 2011

Africa and Asia Seminar 2009 51
Africa
� GDP growth underpinned by improving macroeconomic fundamentals
Source: IMF International Finance Statistics
0
5
10
15
20
25
90 91 92 93 94 95 96 97 98 99 00 01 02 03 04 05 06 07 08
Africa trade balance 1990 – 2008 Africa debt 1990 – 2008
$bn
$bn
-40
-20
0
20
40
60
80
100
90 91 92 93 94 95 96 97 98 99 00 01 02 03 04 05 06 07 08
©SABMiller plc 2009

Africa and Asia Seminar 2009 52
Africa
African consumer goods fundamentals are favourable� Robust economic fundamentals and prospects� Strong population growth� Moderate inflation
0%
1%
1%
2%
2%
3%
GDP growth F10-F13 Population growth F10-F13
Source: Economist
0%
1%
2%
3%
4%
5%
6%
Europe
NorthAmerica
LATAM
Africa
APAC
©SABMiller plc 2009

Africa and Asia Seminar 2009 53
Africa
Nevertheless, global financial crisis has affected short term performance in Africa
� Commodities – e.g. Zambia copper, Botswana diamonds, Angola oil
� Average GDP growth down from 6% to 4%� Remittances, tourism, foreign aid� Exchange rate volatility� Botswana levy of 30% impacting volumes� Offset by excise reductions in some markets
©SABMiller plc 2009

Africa and Asia Seminar 2009 54
Africa
SABMiller Africa growth drivers� Full beverage portfolio
….not only beer� Differentiated beer portfolio
….affordability and premium opportunity
� Winning at the Point of Sale….marketing investments
� Capacity and capability….new breweries….skills and experience in Africa….cost optimisation
SABMiller F03 – F09 volume 5.8% CAGR (incl Castel)*
9.0%7.4%
-1.6%
Clear Beer
Opaque Beer
CSDs
*Equity accounted volumes
©SABMiller plc 2009

Africa and Asia Seminar 2009 55
� Extracting growth – Africa has different challenges
Full beverage portfolio
12 countries – 390 million people 53 countries – 1 billion people
Population statistics: The Economist
©SABMiller plc 2009

Africa and Asia Seminar 2009 56
Full beverage portfolio
� Countries are mostly small, consumers are relatively poor
� Scale benefits from beer aloneare limited
� In Ghana we account for only 0.2% of GDP
� In Lesotho, we account for 3.3% of GDP – the result of a beverage portfolio approach
Turnover as % of GDP
US Latin America Europe South Africa Asia Africa Lesotho SABM Africa Avg Ghana
Source: The Economist
Africa requires a different business model
Total hls per SABMiller HUB
©SABMiller plc 2009

Africa and Asia Seminar 2009 57
Full beverage portfolio
� Market scale via production, management and distribution synergies� Separate sales / RTM provides focus when required� Risk mitigated through portfolio effects
Enhancing value: scale effects of a fuller beverage portfolio
All other 54%
Clear beer 46%
SABMA by volume Zambia combined EBITA margins
0
2
4
6
8
10
12
F97 F00 F02 F04 F06 F08
$US
EB
ITA
per
an
num
Acquisition of CSDs
©SABMiller plc 2009

Africa and Asia Seminar 2009 58
Full beverage portfolio
� Managed operations in 16 countries.� Castel operations in 22 countries.� SABMiller and Castel are the Coca-
Cola bottler in 20 of their 36 countries.� Associate investment in EABL
(Kenya) / Delta in Zimbabwe.
SABMiller Africa footprint – key partnerships
CastelSABMillerAssociates
Mauritius
Madagascar
Comores
50%
16%
33%Clear BeerOpaque
CSDs
Other
SABMiller managed volumes 17mhls incl associates & Castel – 25mhls
©SABMiller plc 2009
Africa and Asia Seminar 2009 59
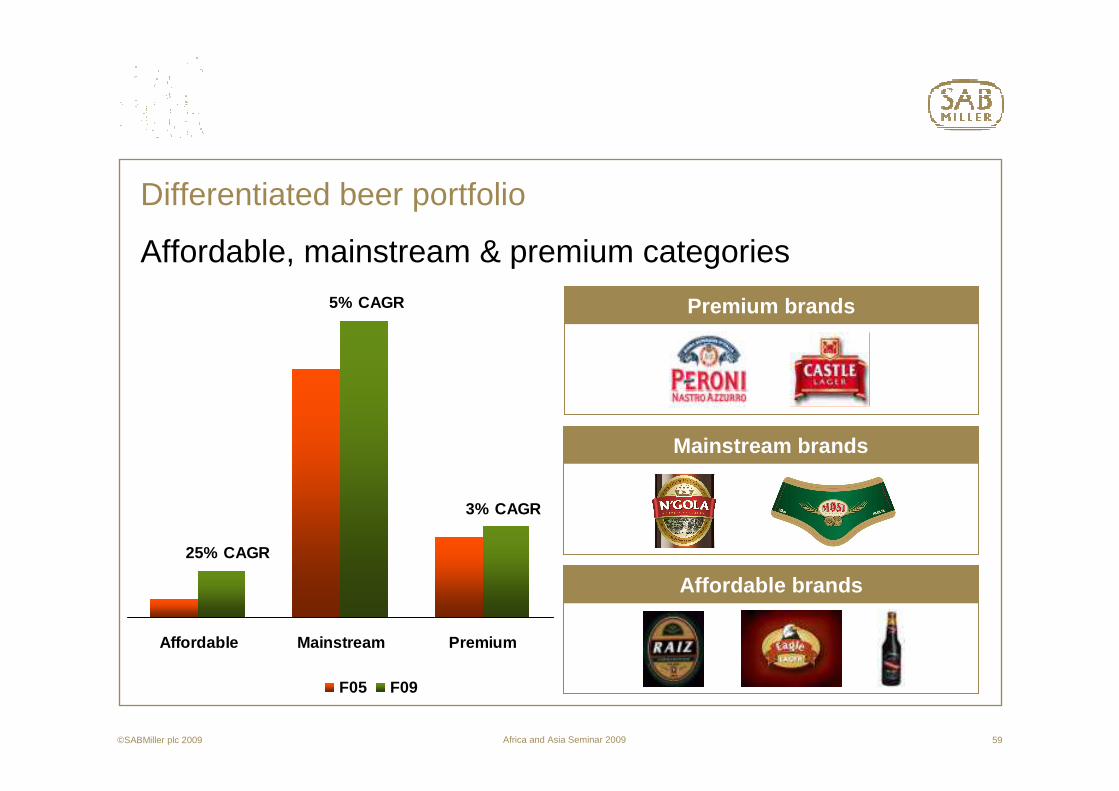
Differentiated beer portfolio
Affordable, mainstream & premium categories
Affordable Mainstream Premium
F05 F09
25% CAGR
5% CAGR
3% CAGR
Premium brands
Mainstream brands
Affordable brands
©SABMiller plc 2009

Africa and Asia Seminar 2009 60
135130
107100
7456
48
2M 340mlDraught
Barons Raiz 2M 550ml Lpreta550ml
Lprem Peroni
Differentiated beer portfolio
� Mozambique’s beer price ladder is a robust portfolio model for growth and sustainability in Africa
� In Mozambique, a 340ml draught serving is < ½ the price of a full size returnable bottle, and the margins remain attractive
Driving revenue management and affordability
Indexed consumer price
©SAB Miller plc 2009

Africa and Asia Seminar 2009 61
…Mainstream
� Driving distinctive positioning and integrated commercial campaigns
� Packaging renovations� Brand renovations
Strengthening our mainstream brands
F05 F06 F07 F08 F090
0
0
0
Vol
ume
hls
©SAB Miller plc 2009
4 year CAGR 5%

Africa and Asia Seminar 2009 62
……Premium
� Building differentiated premium portfolios– Mozambique – Laurentina premium– Lesotho – Maluti lager– Swaziland – Sibebe lager– Botswana – St Louis export– Uganda – Nile gold– Angola – NGola preta
� Excellent growth expected to continue
Premium brands
M A M J J A S O N D J F M A M J J
Vol
ume
hls
July’09 + 41% vs. prior
©SAB Miller plc 2009

Africa and Asia Seminar 2009 63
Africa premium brandsStandardised positionings driving scale & efficiency
4. Preta (dark beer)
Packaging & Brew Communication
2. Maluti/ Sibebe1. Crystal Malt
3. 100% Malt
©SAB Miller plc 2009
Africa and Asia Seminar 2009 64
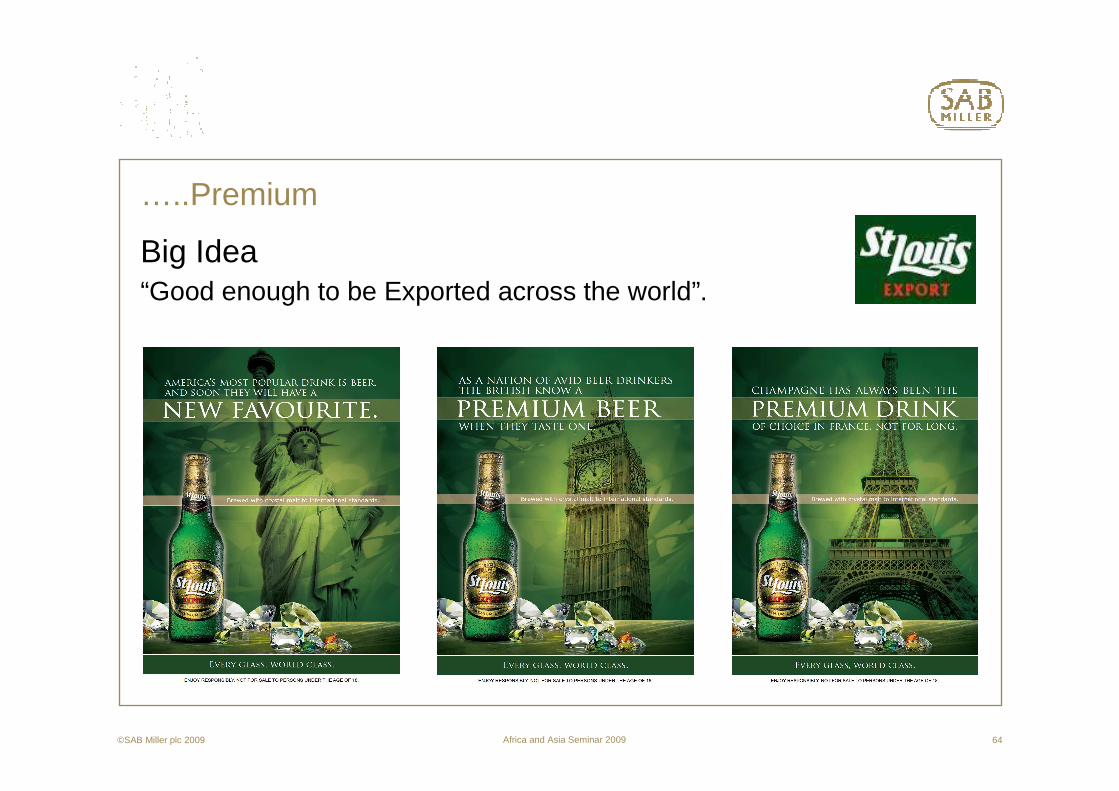
…..Premium
Big Idea“Good enough to be Exported across the world”.
©SAB Miller plc 2009

Africa and Asia Seminar 2009 65
…..PremiumUganda – Nile Gold creative
©SAB Miller plc 2009

Africa and Asia Seminar 2009 66
…..Premium
Launching premium brands – Sibebe Swaziland July 09
©SAB Miller plc 2009

Africa and Asia Seminar 2009 67
…..Affordable
Driving affordability� Eagle proposition
– Trading up homebrew drinkers into an affordable lager beer.
– Leveraging local ingredients for lower excise and sustainable economic development through local enterprise.
� Affordability further enhanced by lower consumer price points– small RGB– draught servings 300ml / 500ml.
� Total affordable brand volume now 1 mhl MAT with CAGR 25%.
F05 F06 F07 F08 F09 F10
Vol
ume
hls
341
682
787 758828
954
©SAB Miller plc 2009

Africa and Asia Seminar 2009 68
…..Affordable
Opaque beer� Sorghum / maize short shelf life based
traditional product� Typically 2 to 3 times the volume of
lager beer� 25% of the price of beer per ml with
strong margins
Mauritius
Madagascar
Comores
Malawi – CPL
Zambia – NatBrew
Botswana – BBL
Zimbabwe – Delta
0
500
1,000
1,500
2,000
2,500
3,000
Malawi Zambia Botswana Zimbabwe
hl's
'000
Traditional beer Clear beer
** Zimbabwe volume FO8
©SAB Miller plc 2009

Africa and Asia Seminar 2009 69
…..AffordableOpaque beer – innovation� A previously neglected category and business� Future growth opportunities from brand and pack renovation� Supply chain opportunities – $25m / 5 years already identified / implemented.
©SAB Miller plc 2009
Africa and Asia Seminar 2009 70
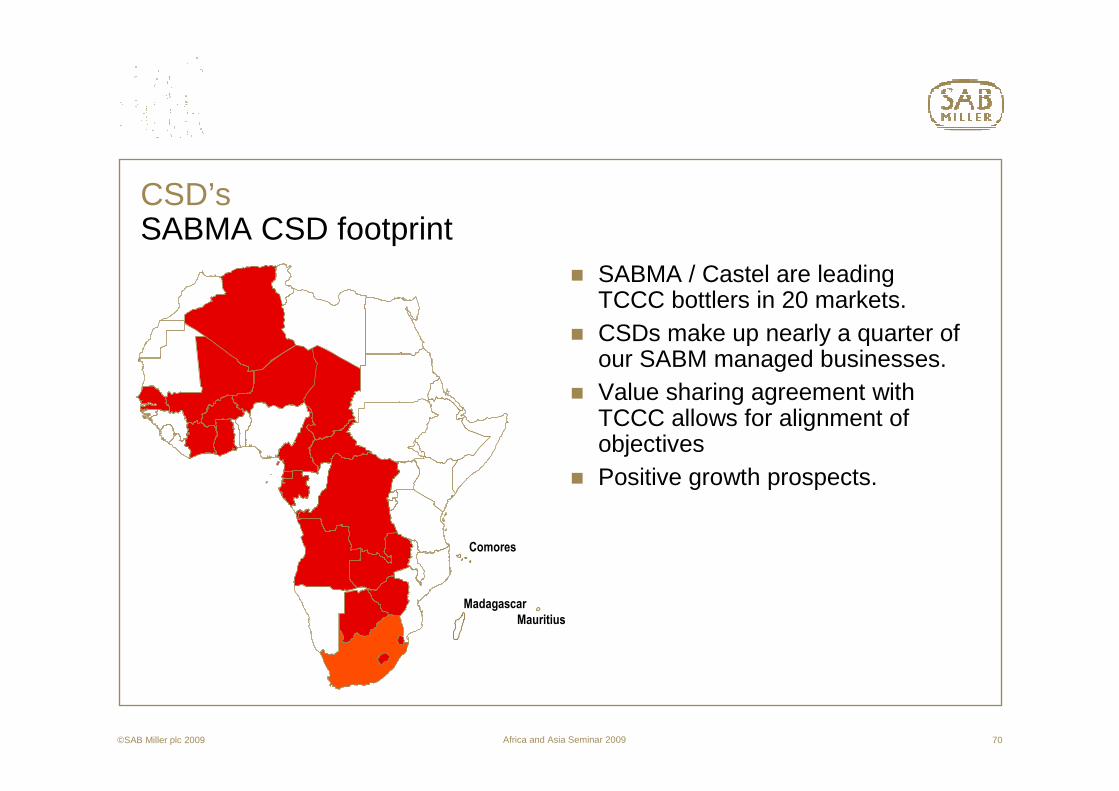
CSD’sSABMA CSD footprint
� SABMA / Castel are leading TCCC bottlers in 20 markets.
� CSDs make up nearly a quarter of our SABM managed businesses.
� Value sharing agreement with TCCC allows for alignment of objectives
� Positive growth prospects.
Mauritius
Madagascar
Comores
©SAB Miller plc 2009

Africa and Asia Seminar 2009 71
WaterSABMA water footprint
� F09 – 4 Countries 35 khls� F10 – 7 Countries 1.4 mhls� A small but rapidly developing
category� Complements the beverage model
Mauritius
Madagascar
Comores
F09
F10
Africa water market has been growing at 17.5% CAGR
Africa water market has been growing at 17.5% CAGR
10
20
30
40
50
60
01 02 03 04 05 06 07F 08F 09F 10F
mhls
©SAB Miller plc 2009

Africa and Asia Seminar 2009 72
Winning at point of saleWinning in channels and with customersMarketing spend to increase in double digits every year
Sales force
Depots
Coolers
Outlets – direct service
-
15,000
30,000
45,000
60,000
F08 F13-
200
400
600
800
F08 F13
-
20
40
60
80
F08 F13-
15,000
30,000
45,000
60,000
F08 F13
©SAB Miller plc 2009

Africa and Asia Seminar 2009 73
Winning at point of sale
Applied learnings from similar markets…
Launch of Pilsener 225mlTransactional price pack in Ecuador
Launch of Hansa Pilsener 375ml to trade consumers up from 330ml in Botswana
©SAB Miller plc 2009

Africa and Asia Seminar 2009 74
Winning at point of sale
Building brand associations through occasion based call to action in on premise outletsAguila association with football and national pride & belonging in Colombia
Mosi association with football and national pride & belonging in Zambia
©SAB Miller plc 2009
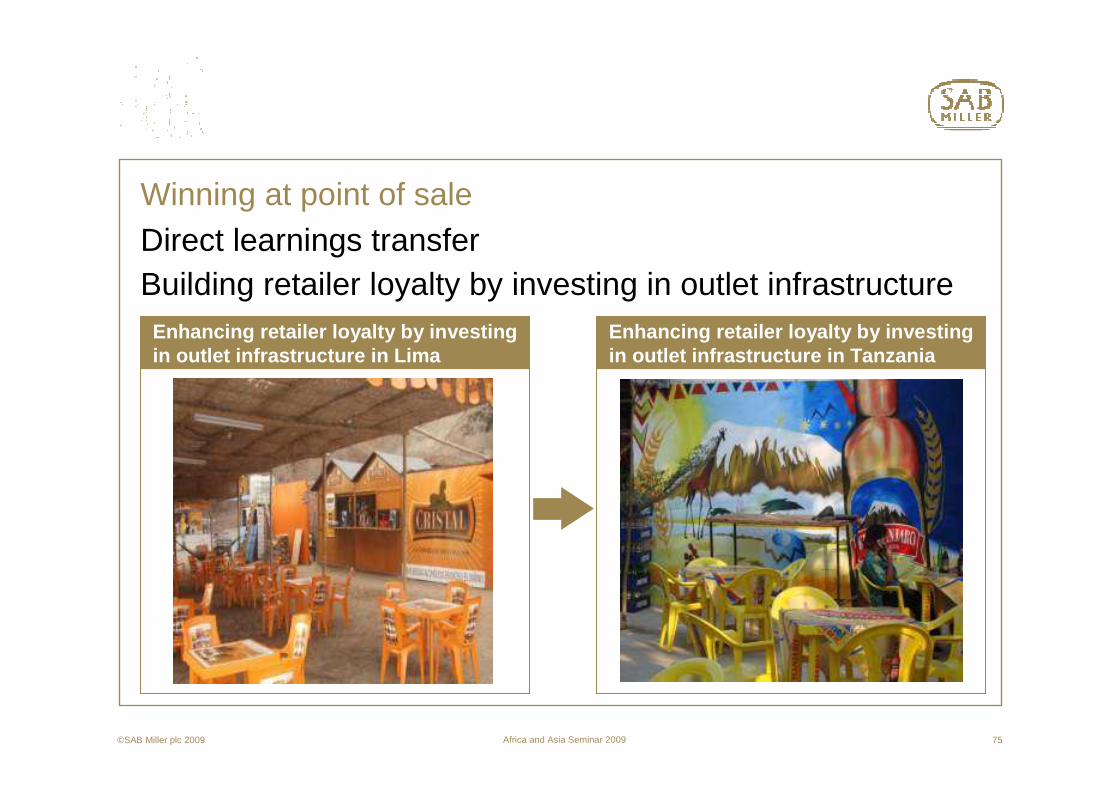
Africa and Asia Seminar 2009 75
Winning at point of saleDirect learnings transferBuilding retailer loyalty by investing in outlet infrastructure
Enhancing retailer loyalty by investing in outlet infrastructure in Lima
Enhancing retailer loyalty by investing in outlet infrastructure in Tanzania
©SAB Miller plc 2009

Africa and Asia Seminar 2009 76
New business
� Voltic Water Ghana & Nigeria� Ambo Water Ethiopia� Pabod Beer Nigeria� Southern Sudan Beverages (Beer / CSD’s)� Trade Kings Zambia (non-alcoholic drink)
©SAB Miller plc 2009

Africa and Asia Seminar 2009 77
New business
Maheu – building from our Zambia acquisition platform
25% of volumes current exported:� DRC� Zimbabwe� Malawi� Mozambique
Zambia presents a platform to expand into these and other countries with local production
Best described as a type of drinking yoghurt, but maize based and of higher viscosity.
DRC
Zambia
Zimbabwe
Mozambique
©SAB Miller plc 2009

Africa and Asia Seminar 2009 78
Key markets
Tanzania� Greenfield expansion in Mbeya
(4 breweries)� Returnable bottle upgrade� Maximising competitiveness with capabilities
in trade� Diageo / EABL to compete in due course
Mhl Mkt. sh
0.9 27
0.6 18
0.3 9
Other 1.1 32 SABM volume 2.8mhlPCC 7 L
1,2841,261GDP p/cap.
43.742.5Population (m)
11.110.3CPI%
4.57.1GDP growth%
20092008ECONOMICS
GDP p/cap ($)
Population (m)
CPI%
GDP growth%
ECONOMICS
©SAB Miller plc 2009

Africa and Asia Seminar 2009 79
Key markets
Angola� Greenfield CSD and beer plant
2.5mhls – 2009 Q4� Beer market development in the north� Supply chain management challenges� Market remains undersupplied but
increasingly competitive� Forex being constrained
Mhl Mkt sh
0.6 7%
BGI 90%
62% SABM beer volume 0.6mhlBeer PCC 32 L
3.4
5,2564,662GDP p/cap.
18.518.0Population (m)
12.312.5CPI%
-2.313.2GDP growth%
20092008ECONOMICS
GDP p/cap. ($)
Population (m)
CPI%
GDP growth%
ECONOMICS
4.6
©SAB Miller plc 2009

Africa and Asia Seminar 2009 80
Key markets
Zambia� Capacity – beer & CSDs upgraded� Trade Kings Maheu acquisition� Excise reduction spurring beer growth
SABM volume 0.6mhlPCC 5 L
1,5501,450GDP p/cap.
12.212.0Population (m)
10.411.8CPI%
6.36.2GDP growth%
20092008ECONOMICS
GDP p/cap. ($)
Population (m)
CPI%
GDP growth%
ECONOMICS
0.1
Mhl Mkt. sh
0.4
0.1
11
46
18
©SAB Miller plc 2009
Africa and Asia Seminar 2009 81
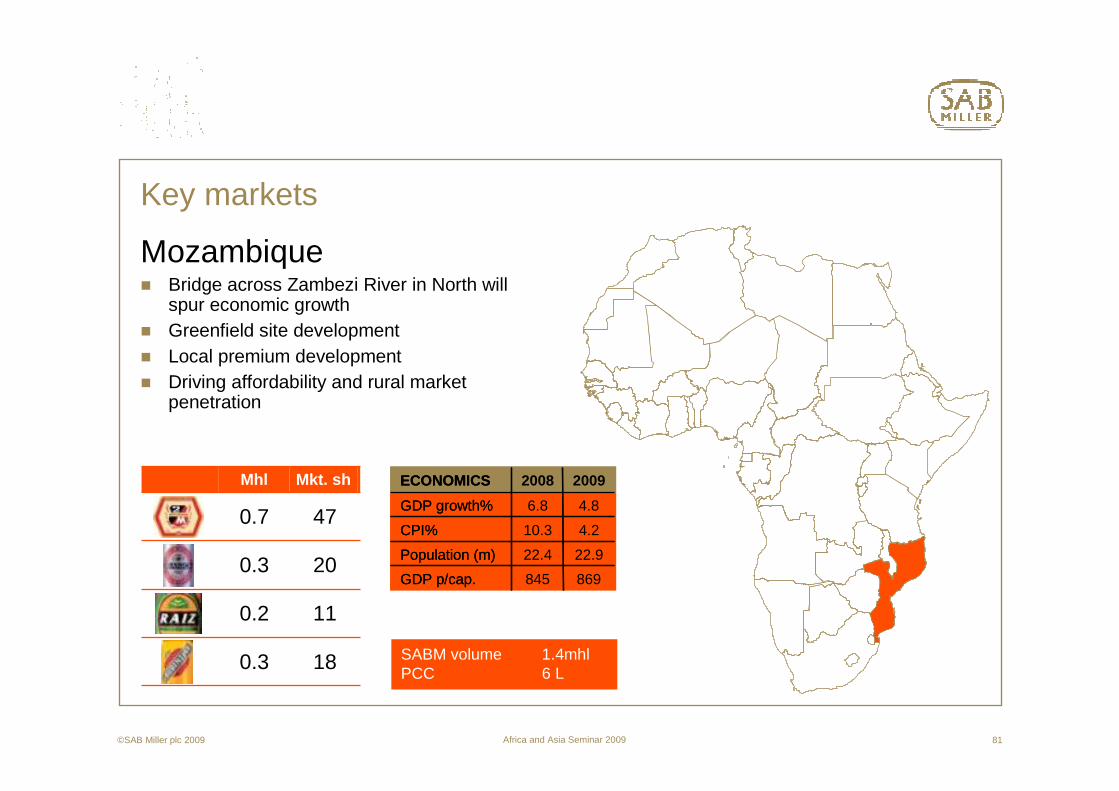
Mhl Mkt. sh
0.7 47
0.3 20
0.2 11
0.3 18
Key markets
Mozambique� Bridge across Zambezi River in North will
spur economic growth� Greenfield site development� Local premium development� Driving affordability and rural market
penetration
SABM volume 1.4mhlPCC 6 L
869845GDP p/cap.
22.922.4Population (m)
4.210.3CPI%
4.86.8GDP growth%
20092008ECONOMICS
GDP p/cap.
Population (m)
CPI%
GDP growth%
ECONOMICS
©SAB Miller plc 2009
Africa and Asia Seminar 2009 82
Key markets
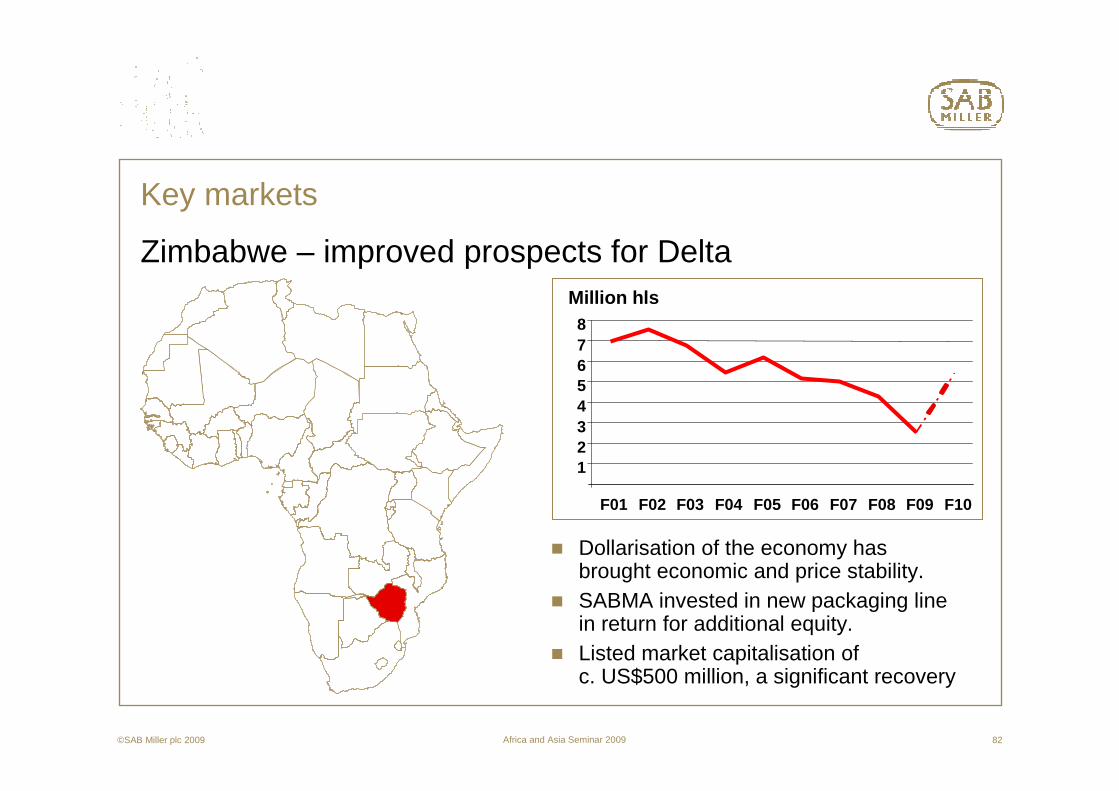
Zimbabwe – improved prospects for Delta
� Dollarisation of the economy has brought economic and price stability.
� SABMA invested in new packaging line in return for additional equity.
� Listed market capitalisation of c. US$500 million, a significant recovery
Million hls
12345678
F01 F02 F03 F04 F05 F06 F07 F08 F09 F10
©SAB Miller plc 2009

Africa and Asia Seminar 2009 83
Capacity and capability
Building capacity – production� CapEx programme of $370m currently in
progress, expected to reduce to $200m from next year
Building capacity – people� Experienced and diverse team bolstered
with senior talent development programmes� Africa specific leadership programme
F10 project include:
� Angola, North Luanda 2,500 khl� Mozambique, Nampula 500 khl� Tanzania, Mbeya 500 khl� Southern Sudan, Juba 250 khl
©SAB Miller plc 2009

Africa and Asia Seminar 2009 84
Enterprise development
Enterprise development driving localisation of our supply chain� Approx 82% of raw materials in final product
imported – long supply chains offer opportunity to localise and take out costs
� New raw materials such as cassava and sorghum
� Aim to have in excess of 45,000 small-holder farmers involved in these initiatives by F12
� Input savings and excise opportunities
� Creating win-win partnerships in Africa
F05 F06 F07 F08
New and existing initiatives
Feasibility stage
Future opportunities
Number of participating farmerswill exceed 45,000 in F12
©SAB Miller plc 2009
12,70022,500
35,000
46,000
F09 F10 F11 F12

Africa and Asia Seminar 2009 85
Efficiency
Costs & CapEx� Capacity CapEx will drive efficiency
– Angola – replace expensive imported product– Tanzania – reduce trans shipment costs to the South– Mozambique – distribution cost savings
� Commodity prices will normalise– Bolstered by enterprise development initiatives– SABEX and MUBEX advantages
� hl/FTE to improve due to investment and scale benefits� Scale benefits from an enlarged beverage portfolio
– Zambia combining of Beer and CSD sites� Route to market initiatives
©SAB Miller plc 2009
Africa and Asia Seminar 2009 86
SABMiller Africa – growth model in line with Group strategic priorities� The macro fundamentals are favourable; growth from a low base� Driving an integrated beverage portfolio across an attractive spread
of businesses– Product innovation and new market development
� Brand portfolio development– Affordability segment– Premium development and– Mainstream renovation
� Continuous improvement in local operations– Winning at the point of purchase– Building capacity and capability
� Leveraging SABMiller’s scale by applying learnings from similar SABMiller markets
©SAB Miller plc 2009

Africa and Asia Seminar 2009 87©SAB Miller plc 2009 87
Medium term value driver outlook
Outlook Africa Asia Africa & Asia
Volume growth Upper-single digit Low-double digits High single digit
Revenue / hl growth
Low-single digit Mid-single digit Low-mid single digit(geo mix driven)
EBITA margin % growth
Approximately flat Impacted by India impediments in F10; +60-80 bps pa thereafter
Fully dependent on country mix
Africa and Asia medium term guidance

Africa and Asia Seminar 2009 88


