
Roger De Abreu, Matt Arkett, Dean FlettCanadian Ice Service
Pablo Clemente-Colón, Sean Helfrich, Brian MelchiorU.S. National Ice Center
Evaluation of ALOS PALSAR for
Operational Ice Monitoring
Preliminary Observations

North American Ice Service
De Abreu et al.
IICWG VIII – Frascati, Italy
• Overview of PALSAR• L-Band Expectations• Motivation, Obectives• Data Collection• Preliminary Observations• Final Words
Outline
North American Ice Service
De Abreu et al.
IICWG VIII – Frascati, Italy
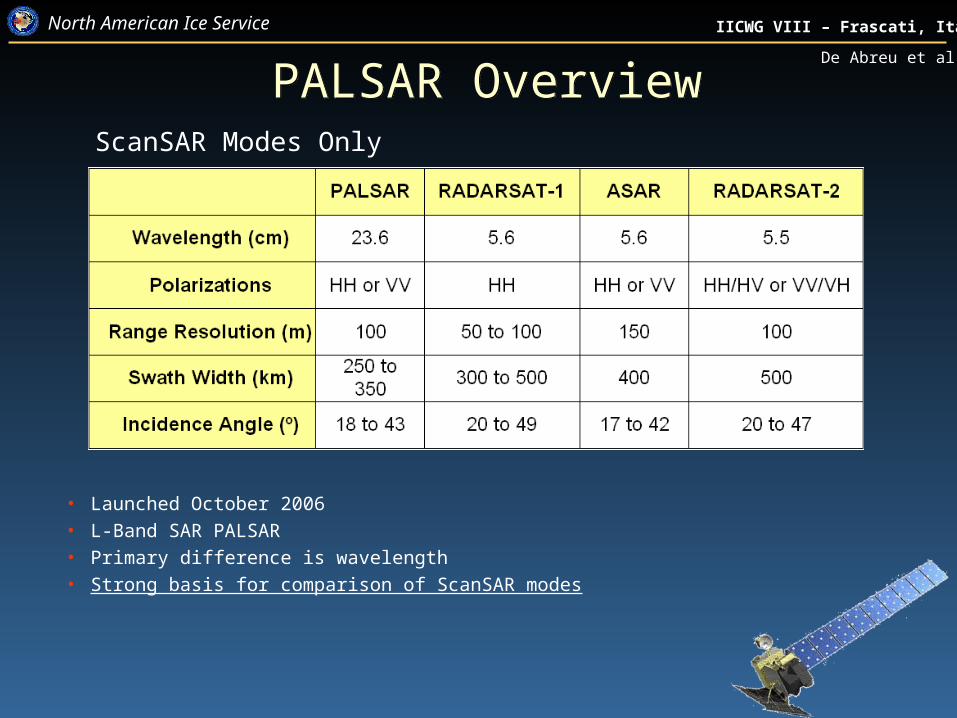
PALSAR OverviewPALSAR Overview
• Launched October 2006• L-Band SAR PALSAR• Primary difference is wavelength• Strong basis for comparison of ScanSAR modes
ScanSAR Modes Only

North American Ice Service
De Abreu et al.
IICWG VIII – Frascati, Italy
Expectations for L-Band• Dierking and Busche (TGARS, 2006) -- Sea Ice Monitoring by L-
Band SAR: An Assessment Based on Literature and Comparisons of JERS-1 and ERS-1 Imagery
• L-Band and C-Band SAR Scattering Signature of Sea Ice for Operational Applications -- Son Nghiem, JPL, 2007.
• Very good at mapping ice deformation, e.g. ridges, rubble fields• Better penetration into sea ice could yield unique and
complementary information to C-band information• L-band signatures are significantly less sensitive to wet snow than
C-band • However, less capable of identifying thin ice and separating FYI
and MYI, especially at high incidence angles.

North American Ice Service
De Abreu et al.
IICWG VIII – Frascati, Italy
Study Objectives
• Identify what unique and complementary sea ice
information PALSAR can provide compared to C-band
SARs (focus on RADARSAT-1)• Identify the role(s) PALSAR data could play in NAIS
operational programs– Complementary role to RADARSAT?– Contingency role to C-band SARs?
• Better understand the potential for future multi-frequency SAR platforms/missions

North American Ice Service
De Abreu et al.
IICWG VIII – Frascati, Italy
Data Collection• Collect concurrent
RADARSAT-1/2 and PALSAR ScanSAR image pairs
• Collect seasonally over major operational ice regimes
• Collect under range of wind conditions
• Collect over various incidence angles and polarizations
• Where possible, collect in situ data to support analysis

North American Ice Service
De Abreu et al.
IICWG VIII – Frascati, Italy
Case Study Locations
• 4 case studies from two PALSAR and R-1 pairs
• All HH polarization
• Collected June 10 (spring) and July 15/16 (smmer)
• ASF Convert tool used to ingest and geoproject data

R-1 Beaufort Sea 20070610 15:00:21 SWB HH

PALSAR Beaufort Sea 20070610 20:41:12 WB1 HH
North American Ice Service
De Abreu et al.
IICWG VIII – Frascati, Italy
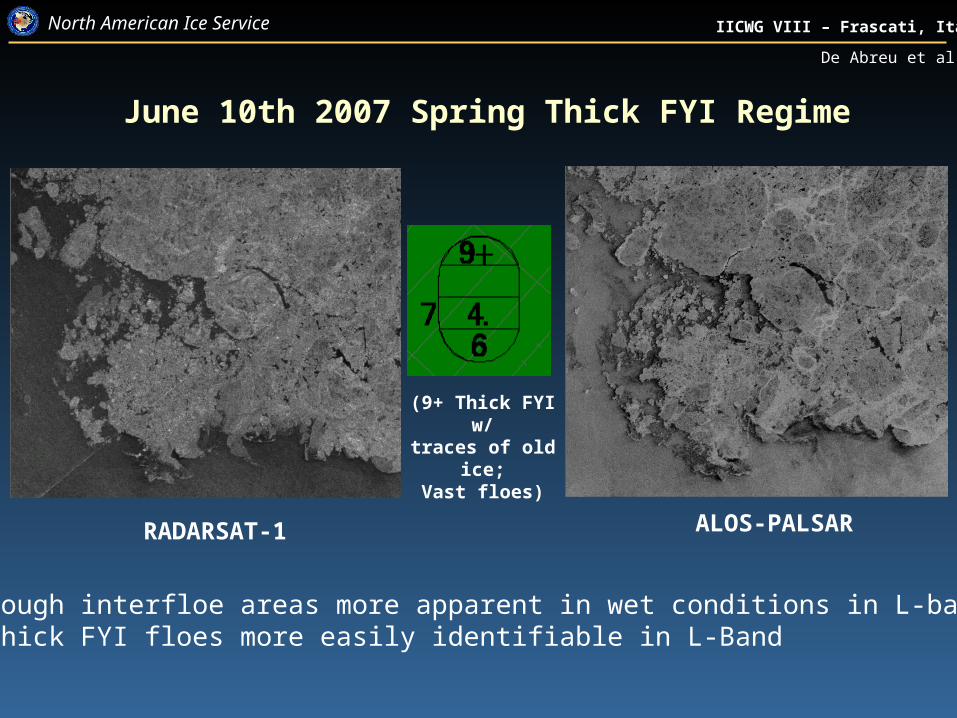
(9+ Thick FYI w/traces of old ice;
Vast floes)
• Rough interfloe areas more apparent in wet conditions in L-band• Thick FYI floes more easily identifiable in L-Band
June 10th 2007 Spring Thick FYI Regime
ALOS-PALSARRADARSAT-1

R-1 Beaufort Sea 20070610 15:00:21 SWB HHR-1 Baffin Bay 20070715 22:14:27 SWA HH
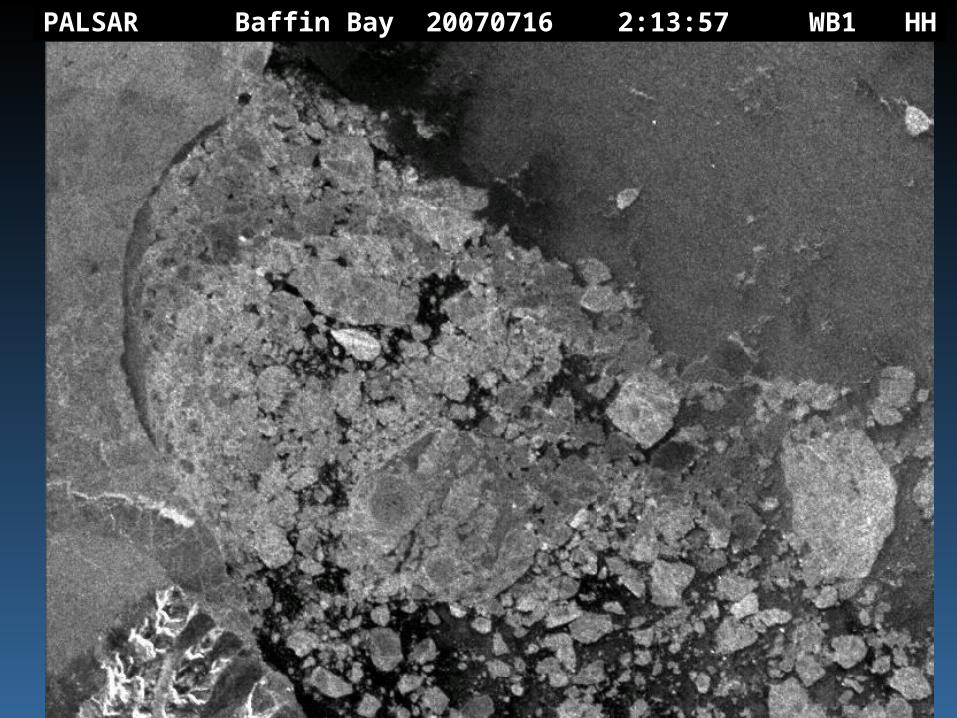
PALSAR Baffin Bay 20070716 2:13:57 WB1 HH

North American Ice Service
De Abreu et al.
IICWG VIII – Frascati, Italy
July 15/16 2007 Summer FYI - MYI
ALOS-PALSAR 2:13:57 UTCRADARSAT-1 22:14:27 UTC
• Floes appear much more homogeneous in R-1• PALSAR appears to provide considerable more contrast within
and between floes• Aids in identifying FYI and MYI concentrations

R-1 Beaufort Sea 20070610 15:00:21 SWB HH

North American Ice Service
De Abreu et al.
IICWG VIII – Frascati, ItalyPALSAR Beaufort Sea 20070610 20:41:12 WB1 HH

North American Ice Service
De Abreu et al.
IICWG VIII – Frascati, Italy
June 10th 2007 – Mackenzie Delta
RADARSAT-1: 15:00:21 UTC
• Wet ice lost in clutter at C- band – Better at L-band• Need to understand the ocean clutter better
ALOS-PALSAR: 20:41:12 UTC

North American Ice Service
De Abreu et al.
IICWG VIII – Frascati, Italy
R-1 July 15, 2007 22:14:27 SWA HH R-1 Feb. 25, 2007 21:56 SWB
North American Ice Service
De Abreu et al.
IICWG VIII – Frascati, Italy
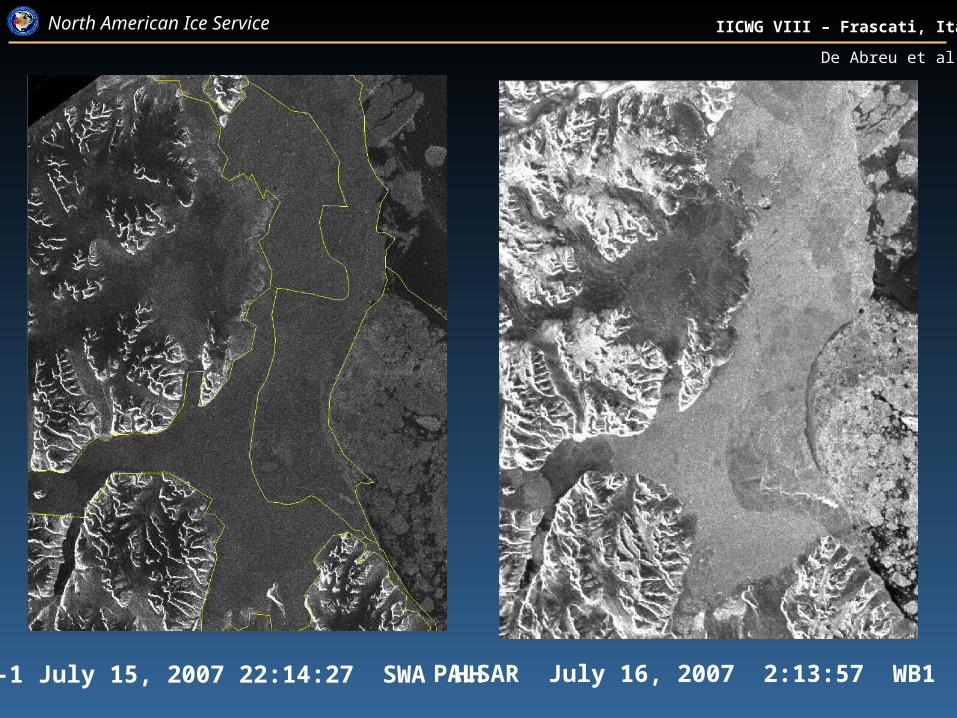
R-1 July 15, 2007 22:14:27 SWA HH PALSAR July 16, 2007 2:13:57 WB1 HH

North American Ice Service
De Abreu et al.
IICWG VIII – Frascati, Italy
R-1 July 15, 2007 22:14:27 SWA HH PALSAR July 16, 2007 2:13:57 WB1 HH
• L-band has better penetration in melt conditions• Improved separation of second year ice from FYI

North American Ice Service
De Abreu et al.
IICWG VIII – Frascati, Italy
Summary• Preliminary examination of summer scenes indicates
that PALSAR does appear to be “seeing” more of the ice surface under wet snow
• In melt conditions, when C-band monitoring is challenged, PALSAR appears to do a better job typing and characterizing ice.
• Better floe definition in FYI and MYI regimes• Better separation of FYI and MYI floes

North American Ice Service
De Abreu et al.
IICWG VIII – Frascati, Italy
Next Steps• Quantitatively characterize these differences • Involve ice analysts to further/validate visual assessment• Extend to PALSAR VV data• Incorporate R-2 data (HH/HV) and possibly TerraSAR X.• Collect field-validated datasets – e.g. Southern Beaufort
Sea – IPY CFL. • Focus on winter freeze-up and PALSAR’s ability to type
thin ice types• Collect and analyze Great Lakes dataset• Icebergs in ice

North American Ice Service
De Abreu et al.
IICWG VIII – Frascati, Italy
Acknowledgements
• CIS JAXA AO --- Evaluation of L-Band ScanSAR Data for Regional Ice Monitoring in Support of Navigation
• NESDIS/NIC AO
• Alaska SAR Facility – ALOS North American Node

North American Ice Service
De Abreu et al.
IICWG VIII – Frascati, Italy
Extra Slides

North American Ice Service
De Abreu et al.
IICWG VIII – Frascati, Italy
Analysis ObjectivesSeparately and combined with C-band, assess PALSAR’s
ability to:• Separate sea ice from open water• Type (classify) sea ice over a broad range of thicknesses• Provide other information
– floe size, floe shape
– surface deformation
– surface melt conditions
Focus on situations where C-band does not work well• Spring and summer ice typing • Ice and water separation under windy conditions

North American Ice Service
De Abreu et al.
IICWG VIII – Frascati, Italy
Analysis Methodology1. Pre-launch assessment of L-band SAR based on
airborne data sets and backscatter modelling
Completed -- L-Band and C-Band SAR Scattering Signature of Sea Ice for Operational Applications -- Son Nghiem, JPL, 2007.

North American Ice Service
De Abreu et al.
IICWG VIII – Frascati, Italy
L-band modelled and observed backscatter
Nghiem, JPL, 2007
North American Ice Service
De Abreu et al.
IICWG VIII – Frascati, Italy
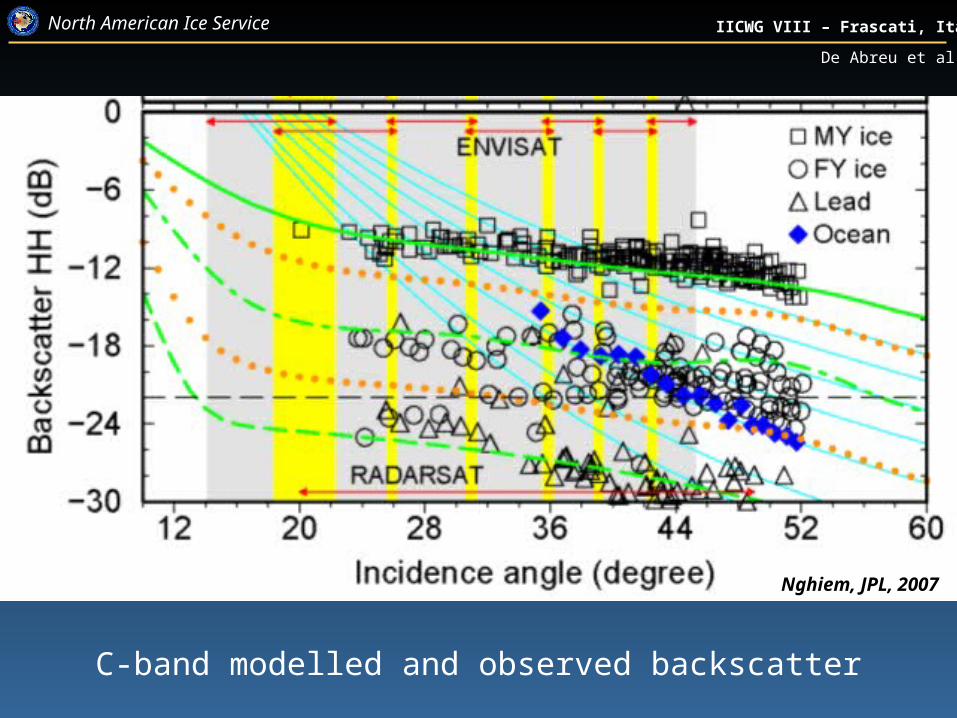
C-band modelled and observed backscatter
Nghiem, JPL, 2007


