
RockSat-C 2012
PDR
WVU RocketeersPreliminary Design Review
West Virginia UniversityJ. Yorick, B. Province, M. Gramlich
Advisor: D. Vassiliadis
November 2 2011
1
RockSat-C 2012
PDR
PDR Presentation Content
2
• Section 1: Mission Overview– Mission Overview– Organizational Chart– Theory and Concepts– Concept of Operations– Expected Results
• Section 2: System Overview– Subsystem Definitions– Critical Interfaces – System Level Block Diagram– System/Project Level Requirement Verification Plan– User Guide Compliance
RockSat-C 2012
PDR
PDR Presentation Contents
• Section 3: Subsystem Design– Power Supply Subsystem (PSS)
• PSS Block Diagram• PSS Key Trade Studies • PSS Risk Matrix/Mitigation
– Flight Dynamics Subsystem (FDS)• FDS Block Diagram• FDS Key Trade Studies • FDS Risk Matrix/Mitigation
3
RockSat-C 2012
PDR
• Section 3: Subsystem Design (cont.)―Cosmic Ray Experiment Subsystem(CRE)
• CRE Block Diagram• CRE Key Trade Studies• CRE Risk Matrix Mitigation
―Radio Plasma Experiment Subsystem (RPE)• RPE Block Diagram• RPE Key Trade Studies• RPE Risk Matrix Mitigation
4
PDR Presentation Contents
RockSat-C 2012
PDR
PDR Presentation Contents
• Section 3: Subsystem Design (cont.)―Dusty Plasma Experiment Subsystem(DPE)
• DPE Block Diagram• DPE Key Trade Studies• DPE Risk Matrix Mitigation
– Greenhouse Gas Experiment Subsystem(GHGE)• GHGE Block Diagram• GHGE Key Trade Studies• GHGE Risk Matrix Mitigation
5
RockSat-C 2012
PDR
PDR Presentation Contents
• Section 4: Prototyping Plan• Section 5: Project Management Plan
– Schedule– Budget– Work Breakdown Structure
6
RockSat-C 2012
PDR
Mission OverviewBen Province
7

RockSat-C 2012
PDR
Mission Overview
• Mission statement: develop a payload to measure properties of the space environment and conduct microgravity plasma experiments at approximately 110 km during RockSat flight.– Measurement of high-energy particles (CRE)– Radio-sounding of ionosphere plasma (RPE)– Creation and control of dusty plasma in microgravity environment(DPE)– Measurement of concentration of greenhouse gasses (GHGE)– Comparison to flight dynamics (FD)
• Goal: determine physical conditions during flight and compare to standard models
• Data analysis will complete the cycle of experiment design and implementation.
8
RockSat-C 2012
PDR
Theory and Concepts
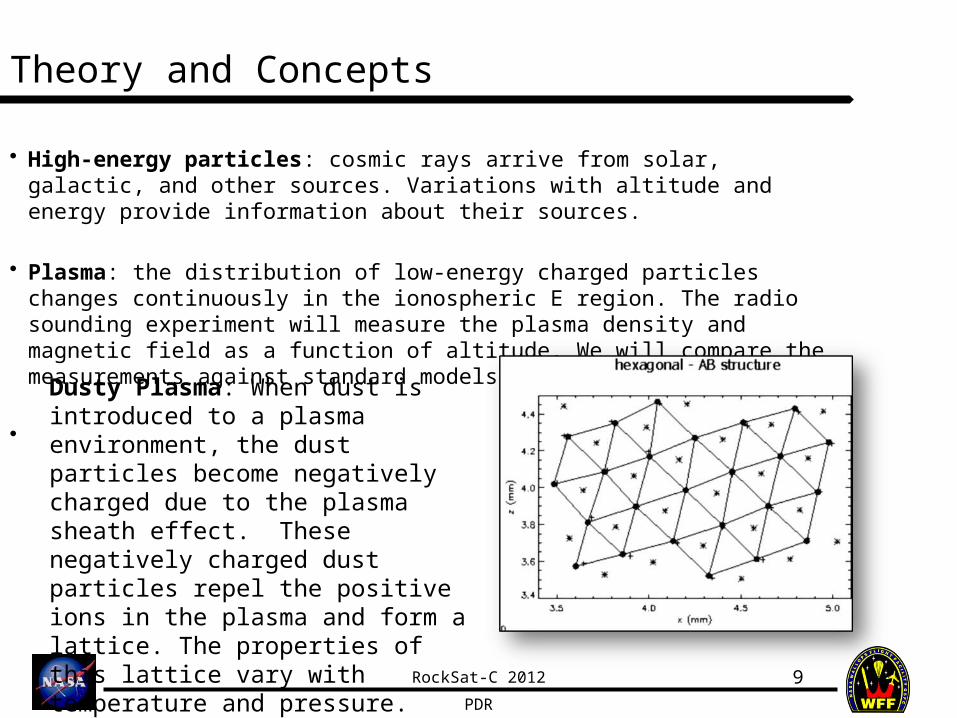
• High-energy particles: cosmic rays arrive from solar, galactic, and other sources. Variations with altitude and energy provide information about their sources.
• Plasma: the distribution of low-energy charged particles changes continuously in the ionospheric E region. The radio sounding experiment will measure the plasma density and magnetic field as a function of altitude. We will compare the measurements against standard models.
•
9
Dusty Plasma: When dust is introduced to a plasma environment, the dust particles become negatively charged due to the plasma sheath effect. These negatively charged dust particles repel the positive ions in the plasma and form a lattice. The properties of this lattice vary with temperature and pressure.
RockSat-C 2012
PDR
Theory and Concepts Continued
• Atmospheric Science: In meteorology, the rate at which the temperature of a volume of air would change with altitude is called a “lapse rate”
The environmental lapse rate is the actual rate of temperature change with altitude observed in the atmosphere.
An adiabatic lapse rate is the lapse rate calculated for an adiabatic differential volume of air. The adiabatic lapse rate varies with humidity and is a piecewise function for differential volumes that would include a H2O phase change within the interval over which the adiabatic lapse rate is being evaluated. (dry adiabatic lapse rate is a constant -9.8 °C per km)
When the environmental lapse rate is less than the adiabatic lapse rate for the same location and conditions, the atmosphere is generally stable. When the environmental lapse rate is less than the adiabatic lapse rate for the same location and conditions, convection occurs. This often leads to a storm.
10
RockSat-C 2012
PDR
11
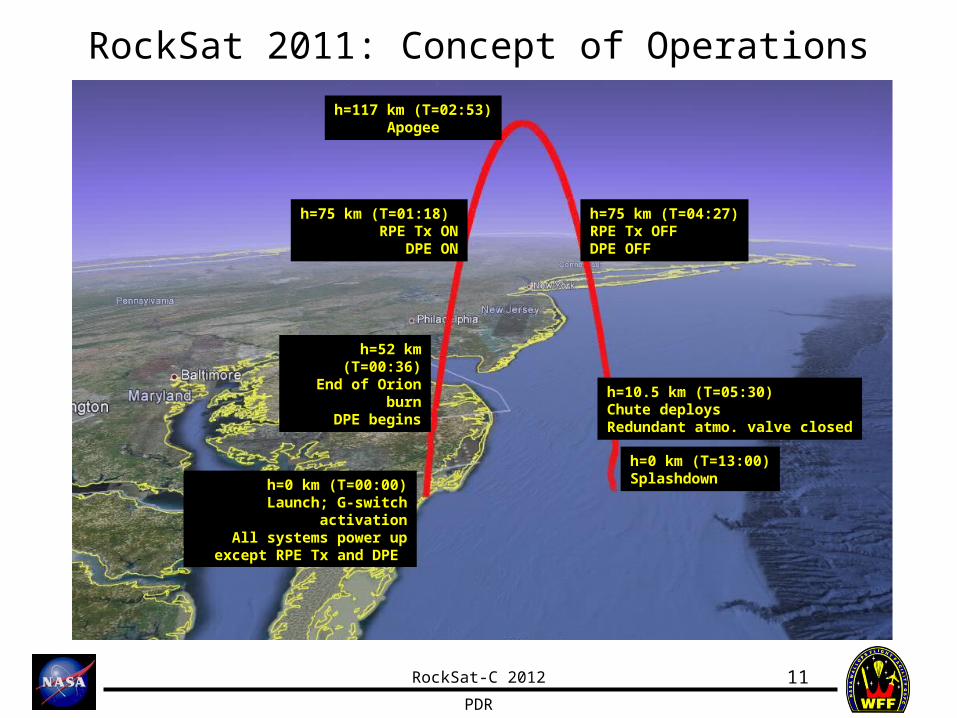
RockSat 2011: Concept of Operations
h=0 km (T=00:00)Launch; G-switch activation
All systems power up except RPE Tx and DPE
h=75 km (T=01:18) RPE Tx ON
DPE ON
h=75 km (T=04:27)RPE Tx OFFDPE OFF
h=117 km (T=02:53)Apogee
h=0 km (T=13:00)Splashdown
h=10.5 km (T=05:30)Chute deploysRedundant atmo. valve closed
h=52 km (T=00:36)End of Orion burn
DPE begins
RockSat-C 2012
PDR
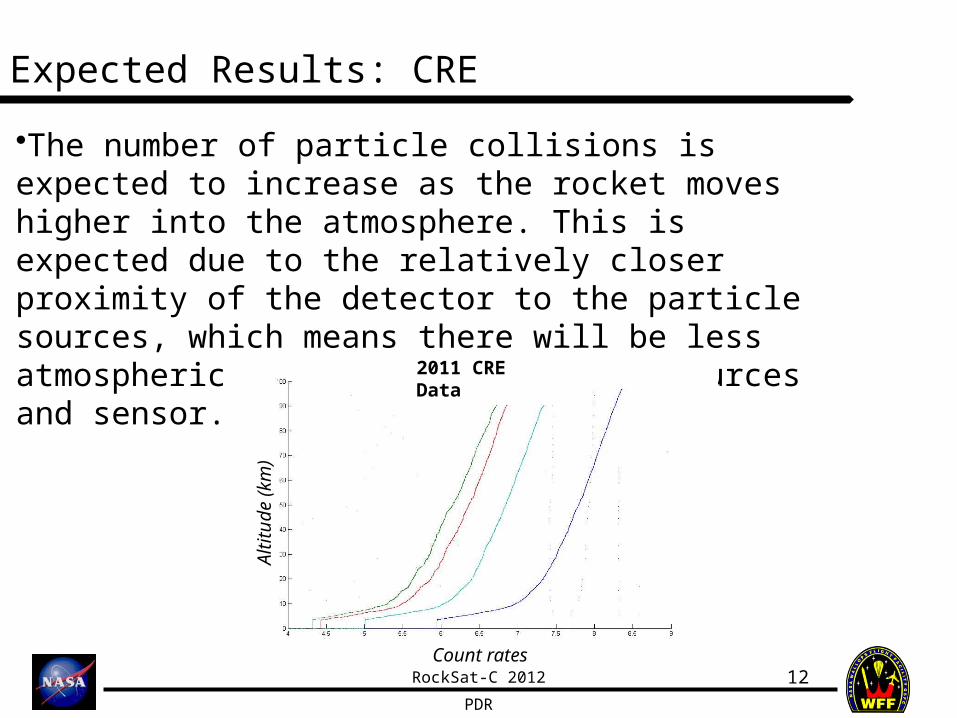
Expected Results: CRE
•The number of particle collisions is expected to increase as the rocket moves higher into the atmosphere. This is expected due to the relatively closer proximity of the detector to the particle sources, which means there will be less atmospheric shielding between the sources and sensor.
12Count rates
Alti
tude
(km
)
2011 CRE Data
RockSat-C 2012
PDR
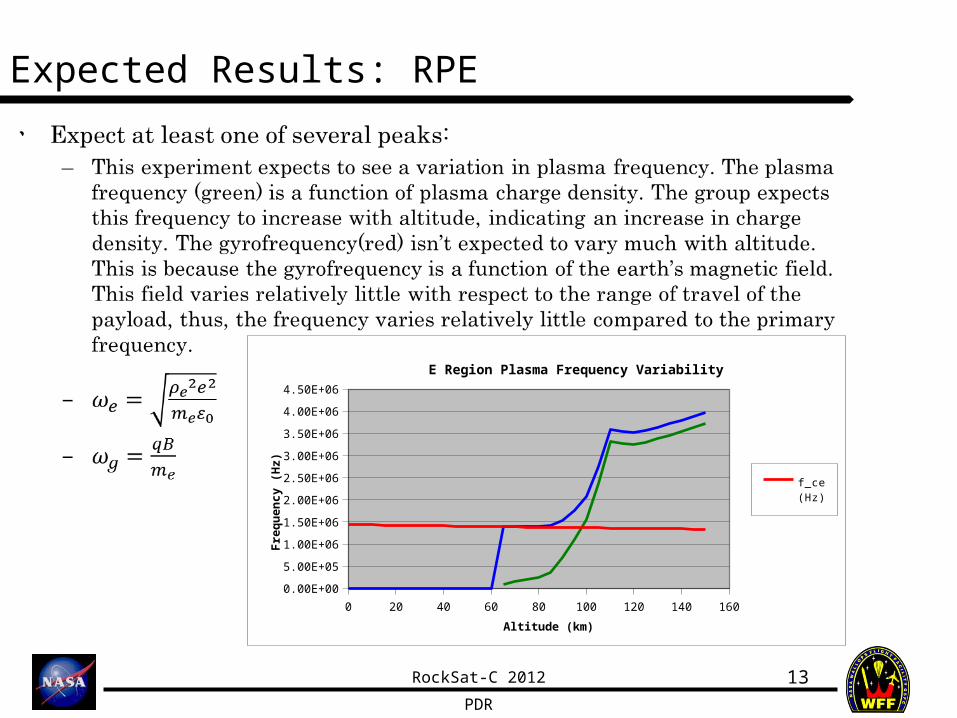
Expected Results: RPE
13
•
0 20 40 60 80 100 120 140 160
0.00E+00
5.00E+05
1.00E+06
1.50E+06
2.00E+06
2.50E+06
3.00E+06
3.50E+06
4.00E+06
4.50E+06
E Region Plasma Frequency Variability
f_ce (Hz)
f_pe (Hz)
f_uh (Hz)
Altitude (km)
Fre
qu
en
cy
(H
z)
RockSat-C 2012
PDR
Expected Results: DPE
14
• A dusty plasma is a plasma which has much larger neutral particles suspended within the plasma. Under normal conditions, the electric forces are balanced by the weight of the dust particles, to form a well defined equilibrium lattice. This study seeks to see what variations in equilibrium and dynamic behaviors occur under microgravity conditions. It is suspected that these properties will be noticeably different under these varied conditions.
• We would like to attain as many of the following milestones during the experiment as possible: – Ionization of gas to create a plasma– Suspension of dust within plasma environment– Optical confirmation of lattice structure– Controlled deformation and dynamic stimulations of lattice
structure
RockSat-C 2012
PDR
Expected Results: GHGE
15
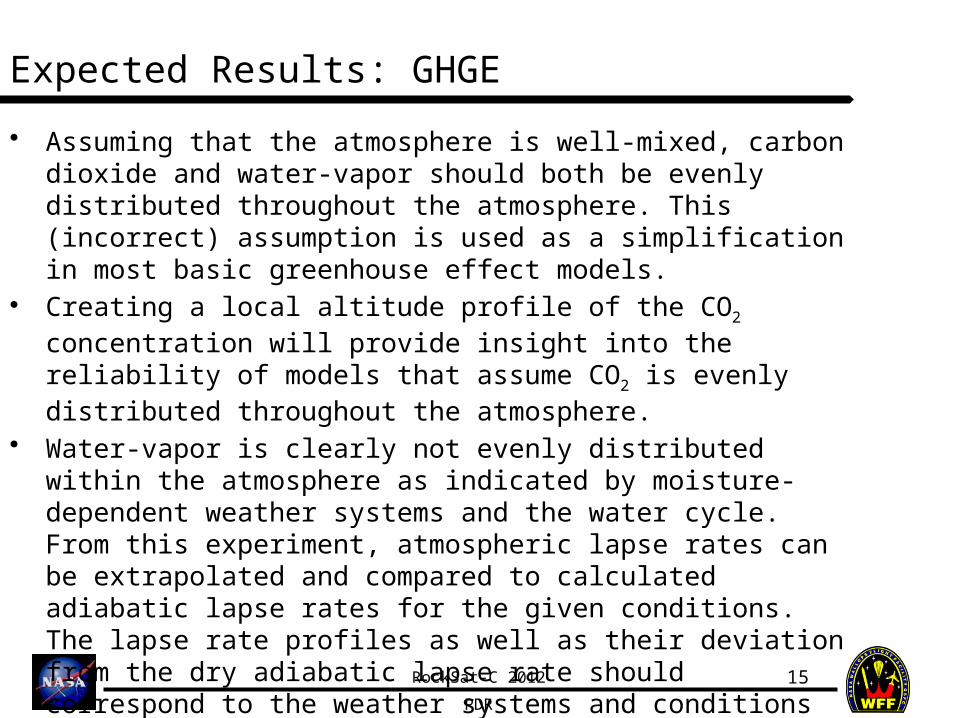
• Assuming that the atmosphere is well-mixed, carbon dioxide and water-vapor should both be evenly distributed throughout the atmosphere. This (incorrect) assumption is used as a simplification in most basic greenhouse effect models.
• Creating a local altitude profile of the CO2 concentration will provide insight into the reliability of models that assume CO2 is evenly distributed throughout the atmosphere.
• Water-vapor is clearly not evenly distributed within the atmosphere as indicated by moisture-dependent weather systems and the water cycle. From this experiment, atmospheric lapse rates can be extrapolated and compared to calculated adiabatic lapse rates for the given conditions. The lapse rate profiles as well as their deviation from the dry adiabatic lapse rate should correspond to the weather systems and conditions observed near Wallops Flight Facility on the day of launch.
RockSat-C 2012
PDR
System OverviewJustin Yorick
16

RockSat-C 2012
PDR
System Overview
17
PSS
microprocessorFlash
Memory
FD
CRE
RPE
GHGE
DPE
RockSat-C 2012
PDR
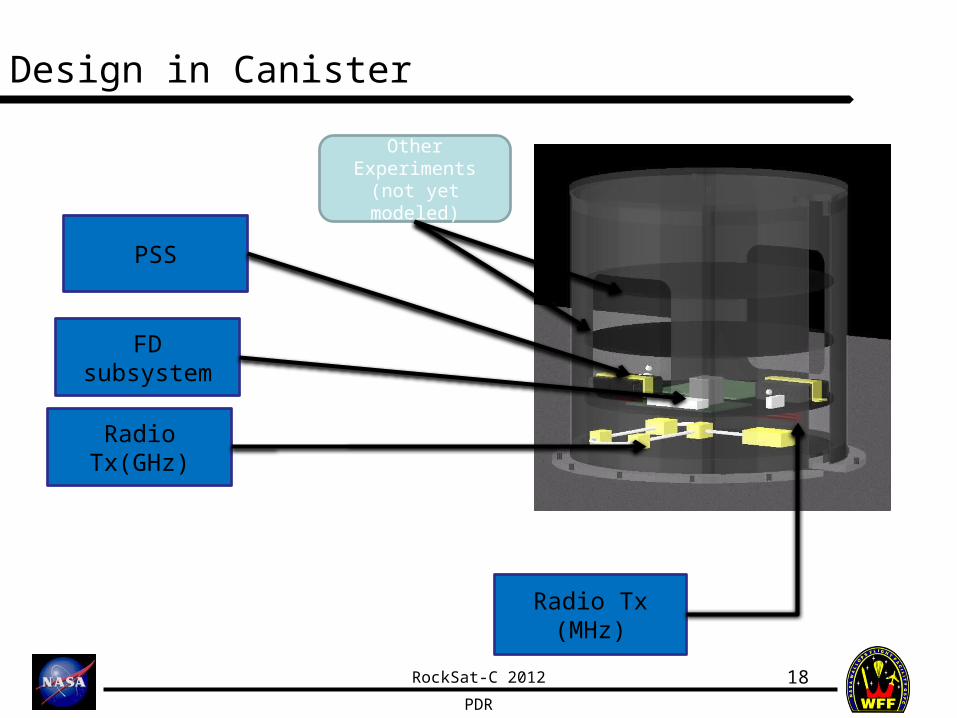
Design in Canister
18
FD subsystem
PSS
Radio Tx(GHz)
Radio Tx (MHz)
Other Experiments (not yet modeled)

RockSat-C 2012
PDR
Critical Interfaces
19
Interface Name Brief Description Potential Solution
PSS<->allThe PSS is a universal power supply to the payload. The experiments as well as the CPU are dependent on this structure. This structure’s survival and proper operation is paramount for mission success.
The PSS will be a custom PCB to minimize stray wires and mass. The batteries will be placed below the board to maximize space usage efficiency.
FD<->StructureThe FD board contains multiple dynamic sensors that will be used to compare the flight’s dynamics to WFF telemetry. It is key that this board is attached to the payload in such a way to avoid stray vibration or resonance phenomena.
Secure connections are the primary tool to combat unwanted vibration. Prototyping and subsystem testing will reveal if further measures are needed.
RPE<->Special port
The RPE must have a secure and reliable connection to the special port
Further research and design will allow the team to chose the most reliable connection methods to secure mission success
DPE<->Structure
The DPE experiment will require use of a sealed, low pressure vessel to test the dusty plasma. The experiment will be imaged by a laser and imaging device. Stray vibrations from improper mounting could destroy image quality, and thus this experiment.
Properly designed connections and components should minimize the risk of destructive vibrations. Further research will provide insight into additional potential solutions.
GHGE<->Atmospheric port
.The GHGE requires a reliable connection to the atmospheric port. Design should ensure that a sufficient atmospheric sample can be given to the GHG sensors. It is also critical that the safety valves will operate correctly during the splashdown event.
Proper calculation of major and minor losses in the tubing should ensure that the sensors will see their proper sample quantities. Proper testing will ensure the safety valves will not allow water into the system.

RockSat-C 2012
PDR
Requirement Verification
20
Requirement Verification Method DescriptionThe PSS fully activates and stays on during launch.
Demonstration Triggering the g-switches will allow the group to test the power out put to various system components using a DMM
The RPE activates at the appropriate prescribed time, and deactivates at its assigned time
Demonstration During the PSS testing, the team will inspect the RPE and test to see if it activates at the proper times.
The DPE is able to survive the vibrations during the rocket flight.
Testing Vibration testing with partner ATK as well as spin testing with WVU CEMR
The entire system meets the mass, CG, and electrical requirements as prescribed by RockSat-C guidelines
Inspection Physical test will ensure RockSat-C compliance

RockSat-C 2012
PDR
RockSat-C 2012 User’s Guide Compliance
21
• Current team calculations place the mass of the payload at around 14lbs
• At the current time, the CG is expected to lie within its required space.
• High voltage components are used in the CRE experiment (500V capacitor), although this is a low power
application. – Development of safety schematics
are pending the finalization of the experiments.
– Both the Special port, as well as the Atmospheric port will be used on this mission.

RockSat-C 2012
PDR
Subsystem Design
Power Supply Subsystem(PSS)
Ben Province
22
RockSat-C 2012
PDR
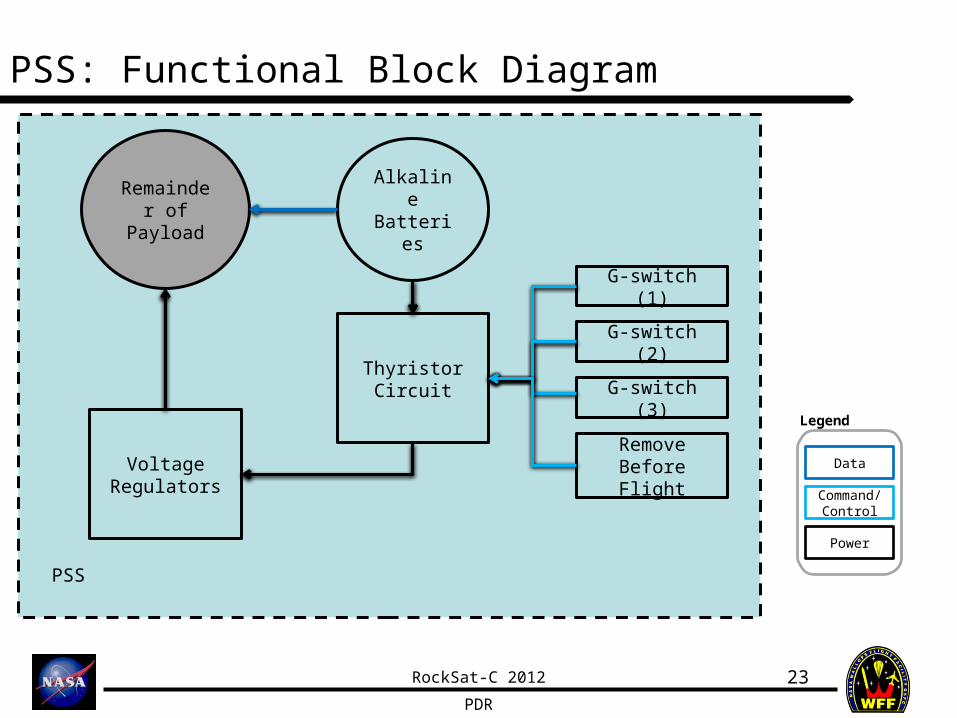
PSS: Functional Block Diagram
23
Power
Data
Legend
Voltage Regulators
Remove Before Flight
Alkaline Batteries
Remainder of Payload
PSS
G-switch (1)
G-switch (2)
G-switch (3)Thyristor Circuit
Command/Control

RockSat-C 2012
PDR
PSS: Risk Matrix
24
Consequence
PSS.RSK.3
PSS.RSK.2
PSS.RSK.1
Possibility
PSS.RSK.1: Single G switch fails/is connected incorrectlyPSS.RSK.2: Some wire connections don’t survive launchPSS.RSK.3: RBF not removed correctly
• Risks for this subsystem are unlikely, but critical to the success of the mission.

RockSat-C 2012
PDR
Subsystem Design
Flight Dynamics (FD)
Ben Province
25
RockSat-C 2012
PDR
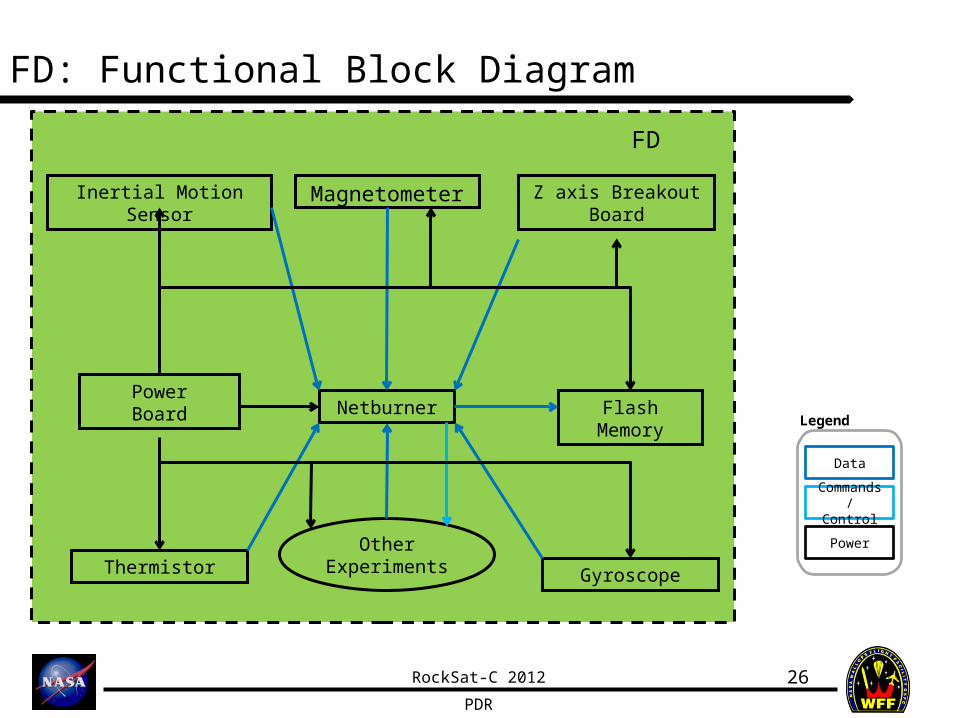
FD: Functional Block Diagram
26
Power
Data
Legend
FD
PowerBoard
MagnetometerInertial Motion Sensor
Thermistor
Z axis Breakout Board
Flash Memory
Gyroscope
Netburner
Commands/ Control
Other Experiments
RockSat-C 2012
PDR
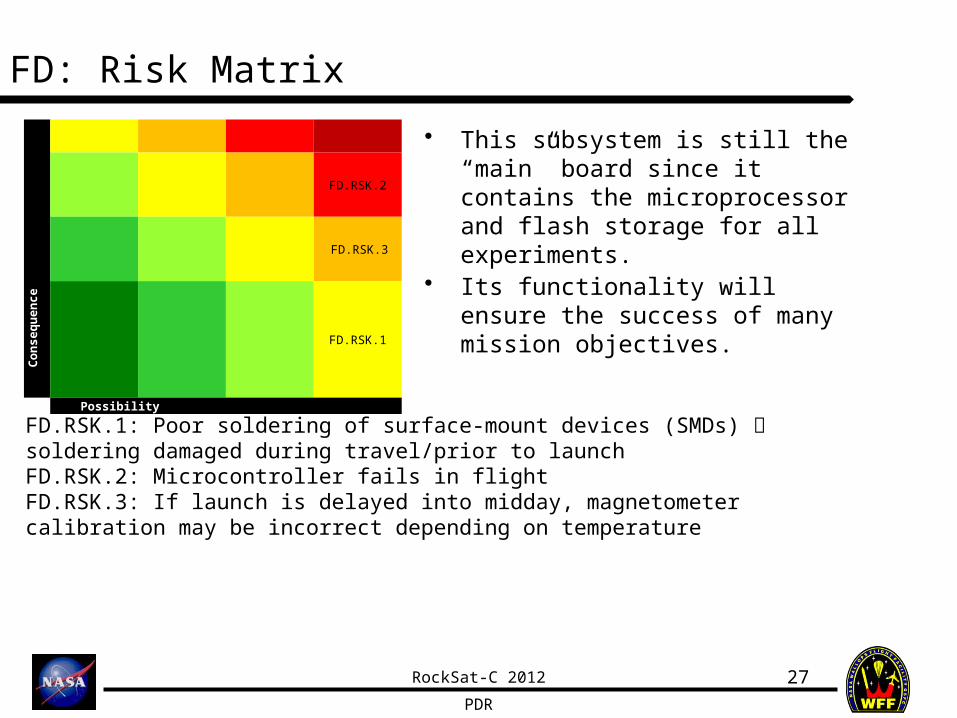
FD: Risk Matrix
27
Consequence
FD.RSK.2
FD.RSK.3
FD.RSK.1
Possibility
FD.RSK.1: Poor soldering of surface-mount devices (SMDs) soldering damaged during travel/prior to launchFD.RSK.2: Microcontroller fails in flightFD.RSK.3: If launch is delayed into midday, magnetometer calibration may be incorrect depending on temperature
• This subsystem is still the “main” board since it contains the microprocessor and flash storage for all experiments.
• Its functionality will ensure the success of many mission objectives.
RockSat-C 2012
PDR
Subsystem Design
Cosmic Ray Experiment (CRE)
Ben Province
28
RockSat-C 2012
PDR
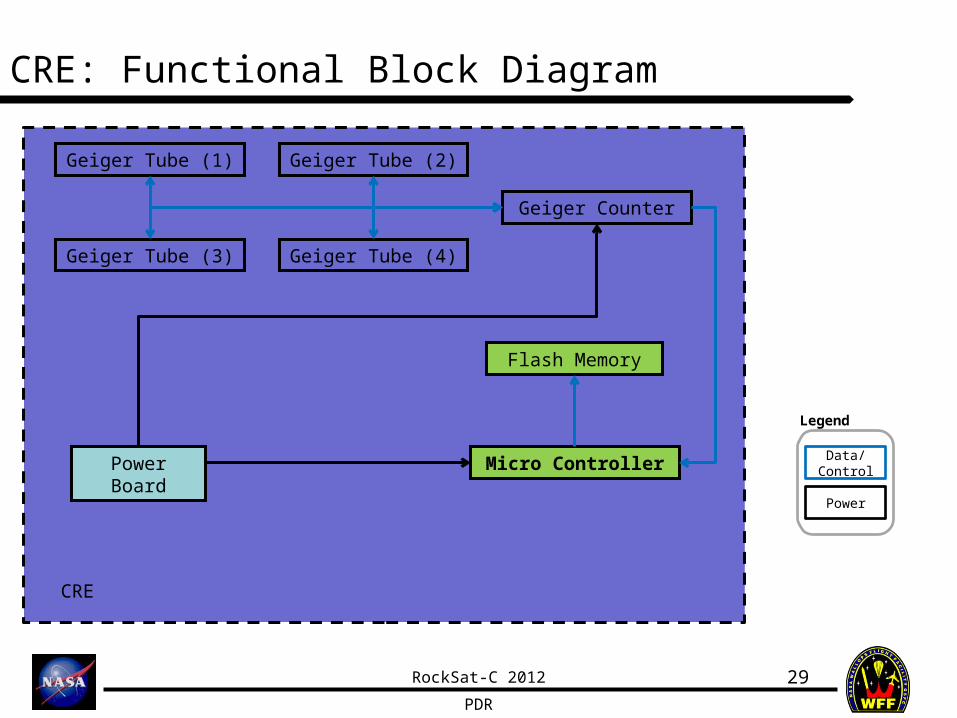
CRE: Functional Block Diagram
29
Power
Data/Control
Legend
Flash Memory
Geiger Counter
Power Board Micro Controller
CRE
Geiger Tube (1)
Geiger Tube (3)
Geiger Tube (2)
Geiger Tube (4)
RockSat-C 2012
PDR
CRE: Risk Matrix
30
CRE.RSK.1
Possibility
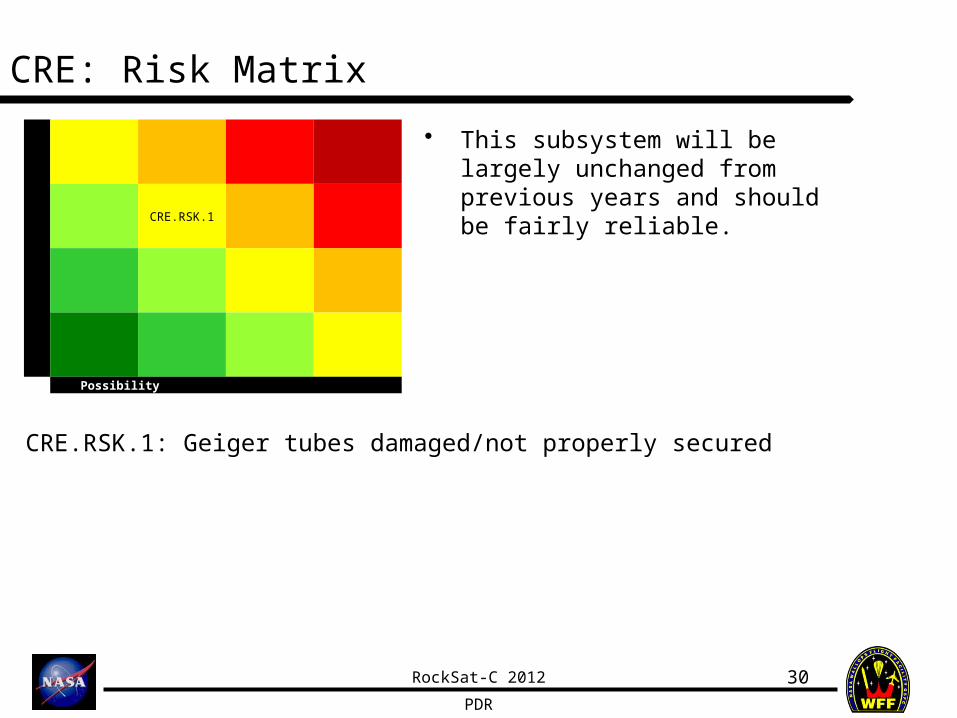
CRE.RSK.1: Geiger tubes damaged/not properly secured
• This subsystem will be largely unchanged from previous years and should be fairly reliable.
RockSat-C 2012
PDR
Subsystem Design
Radio Plasma Experiment (RPE)
Ben Province
31
RockSat-C 2012
PDR
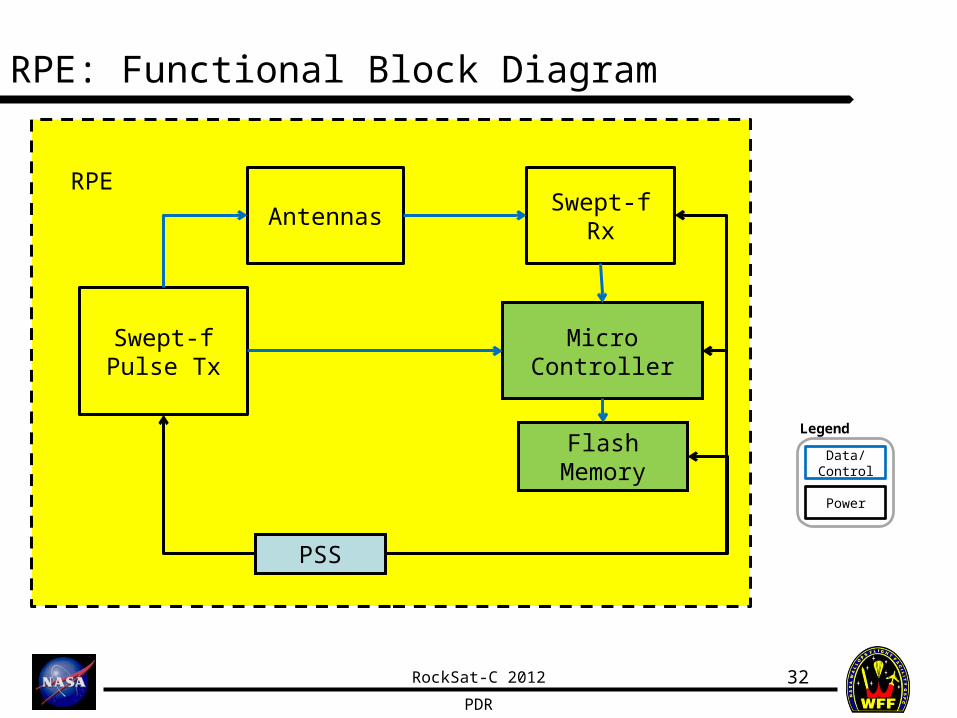
RPE: Functional Block Diagram
32
Power
Data/ Control
Legend
RPE
Swept-fPulse Tx
Micro Controller
PSS
Flash Memory
Antennas Swept-f Rx
RockSat-C 2012
PDR
RPE: Risk Matrix
33
Consequence
RPE.RSK.6 RPE.RSK.1
RPE.RSK.4 RPE.RSK.3 RPE.RSK.2
RPE.RSK.5
Possibility
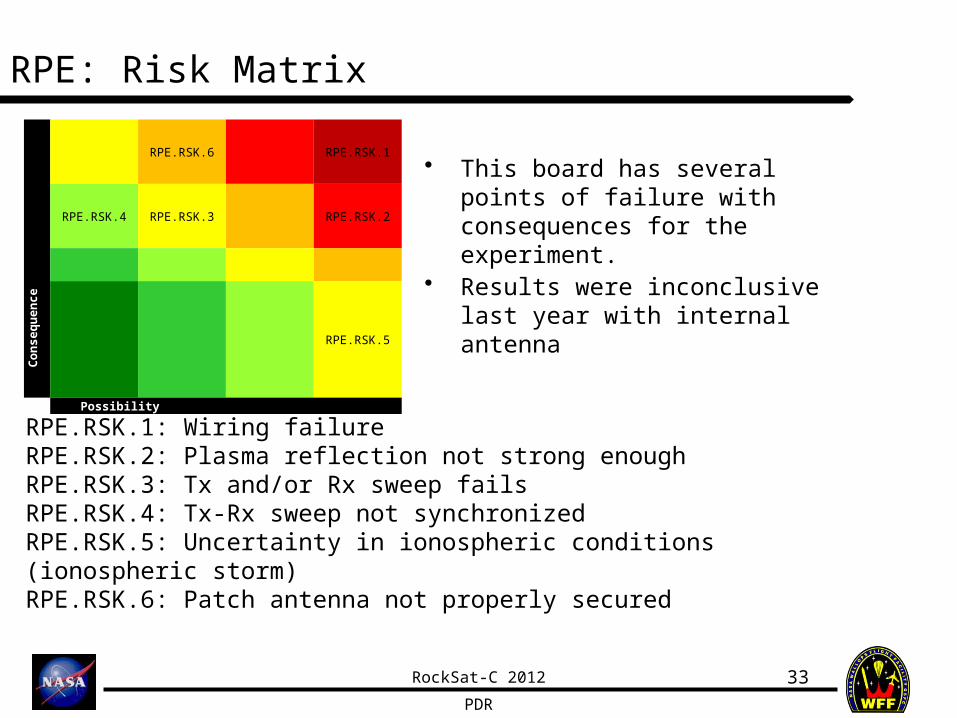
RPE.RSK.1: Wiring failureRPE.RSK.2: Plasma reflection not strong enoughRPE.RSK.3: Tx and/or Rx sweep failsRPE.RSK.4: Tx-Rx sweep not synchronizedRPE.RSK.5: Uncertainty in ionospheric conditions (ionospheric storm)RPE.RSK.6: Patch antenna not properly secured
• This board has several points of failure with consequences for the experiment.
• Results were inconclusive last year with internal antenna

RockSat-C 2012
PDR
Subsystem DesignDusty Plasma Experiment
(DPE)Ben Province
34
RockSat-C 2012
PDR
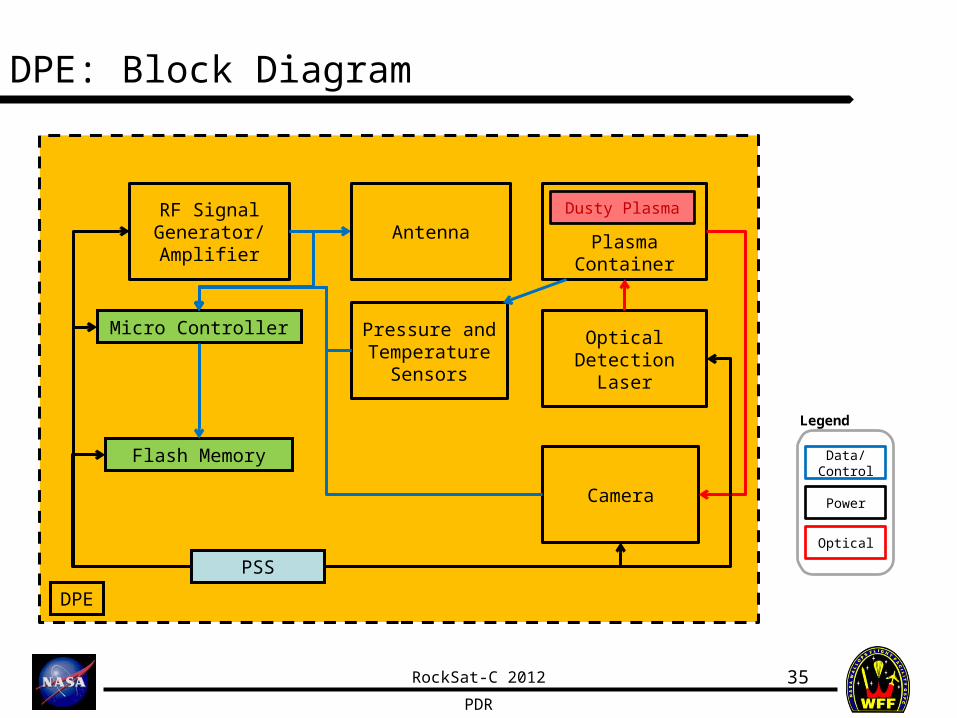
DPE
RF Signal Generator/Amplifier
Micro Controller
PSS
Flash Memory
DPE: Block Diagram
35
Power
Data/Control
Legend
Antenna Plasma Container
Camera
Optical Detection Laser
Optical
Pressure and Temperature
Sensors
Dusty Plasma
RockSat-C 2012
PDR
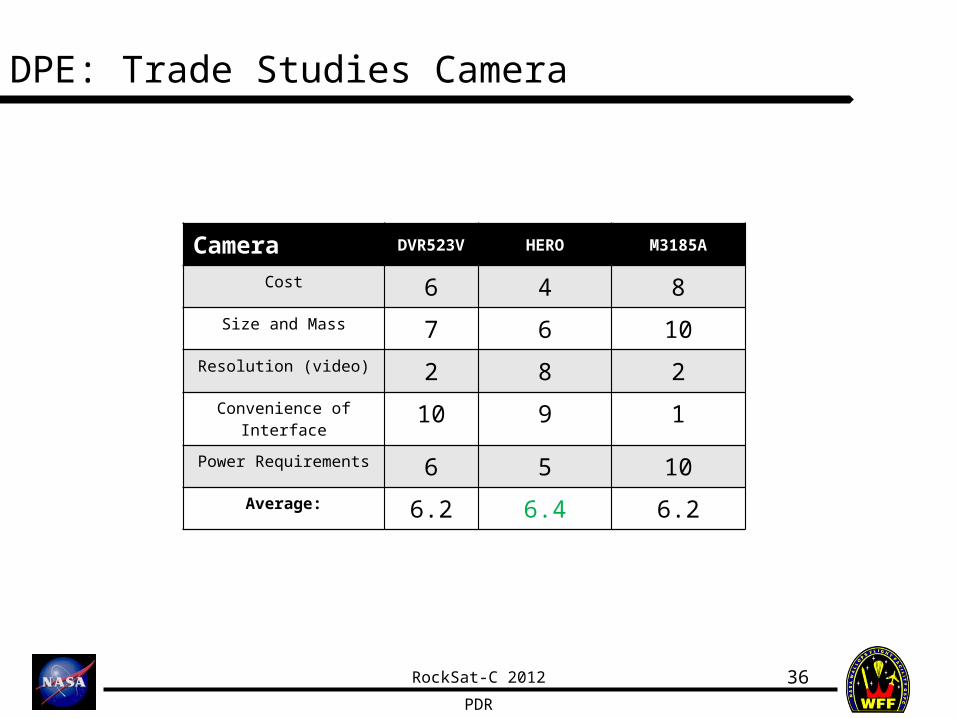
DPE: Trade Studies Camera
36
Camera DVR523V HERO M3185A
Cost 6 4 8Size and Mass 7 6 10
Resolution (video) 2 8 2Convenience of Interface 10 9 1
Power Requirements 6 5 10Average: 6.2 6.4 6.2

RockSat-C 2012
PDR
DPE: Risk Matrix
37
Consequence
DPE.RSK.1DPE.RSK.4
DPE.RSK.2 DPE.RSK.3
Possibility
DPE.RSK.1: Dust Injector failsDPE.RSK.2: Dust contacts container walls before forming latticeDPE.RSK.3: Leak causes pressure anomalyDPE.RSK.4: RF equipment damaged on launch
• This experiment is new to our payload.
• Due to the nature of the experiment, partial success is unlikely.
• All risks are of high consequence
RockSat-C 2012
PDR
Subsystem DesignGreenhouse Gas Experiment
(GHGE)Ben Province
38

RockSat-C 2012
PDR
GHGE: Functional Block Diagram
39
Power
Data/Control
Legend
GHGE
Dynamic Atmospheric
Inlet
Inlet Solenoids
Airflow
Static Atmospheric
Outlet
Outlet Solenoids
Experimental Volume
Pyroelectric CO2 Sensor
H2O Vapor (Humidity)
Sensor
Pressure and Temperature
Sensors
PSS
Micro Controller
Flash Memory
SolenoidController
SolenoidController
TEC/Driver (for maintaining CO2
sensor temp)
Thermistor
RockSat-C 2012
PDR
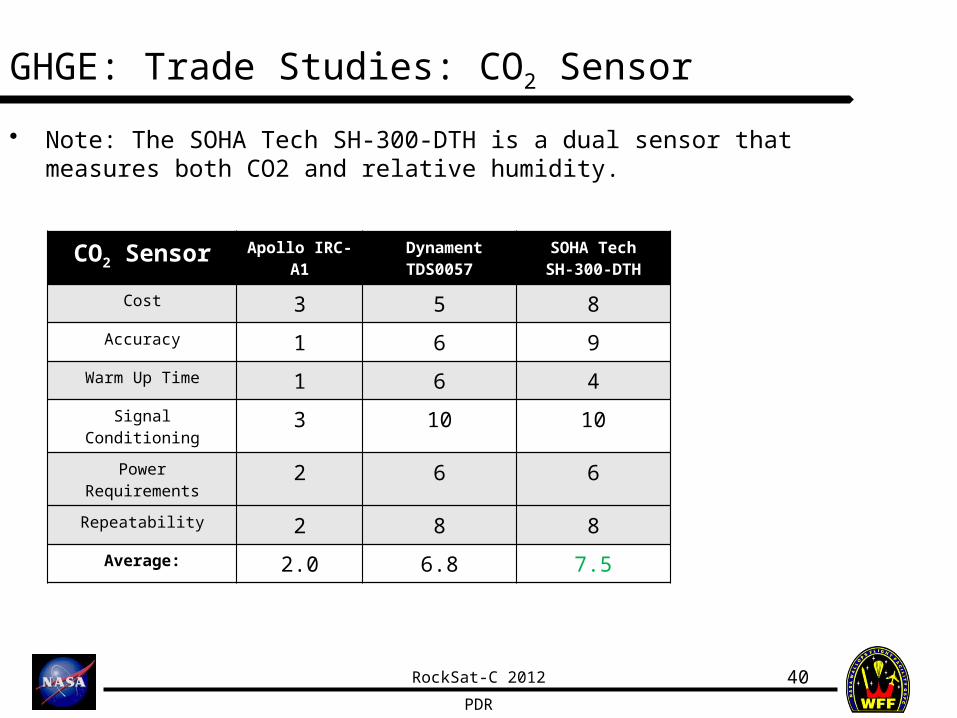
GHGE: Trade Studies: CO2 Sensor
40
• Note: The SOHA Tech SH-300-DTH is a dual sensor that measures both CO2 and relative humidity.
CO2 Sensor Apollo IRC-A1
Dynament TDS0057
SOHA TechSH-300-DTH
Cost 3 5 8Accuracy 1 6 9
Warm Up Time 1 6 4Signal Conditioning 3 10 10
Power Requirements 2 6 6Repeatability 2 8 8
Average: 2.0 6.8 7.5
RockSat-C 2012
PDR
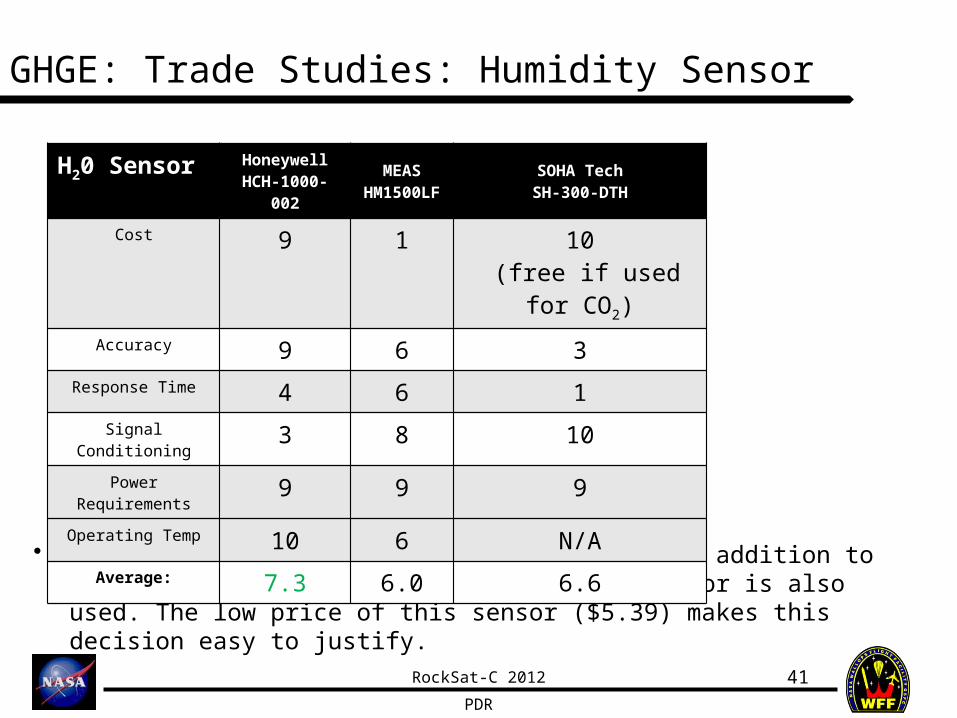
GHGE: Trade Studies: Humidity Sensor
41
• The Honeywell HCH-1000-002 is clearly a good addition to the payload even if the SH-300-DTH dual sensor is also used. The low price of this sensor ($5.39) makes this decision easy to justify.
H20 Sensor HoneywellHCH-1000-002
MEASHM1500LF
SOHA TechSH-300-DTH
Cost 9 1 10 (free if used for CO2)
Accuracy 9 6 3Response Time 4 6 1
Signal Conditioning 3 8 10Power Requirements 9 9 9
Operating Temp 10 6 N/AAverage: 7.3 6.0 6.6
RockSat-C 2012
PDR
GHGE: Risk Matrix
42
Consequence
GHGE.RSK.3
GHGE.RSK.2 GHGE.RSK.1
GHGE.RSK.4
Possibility
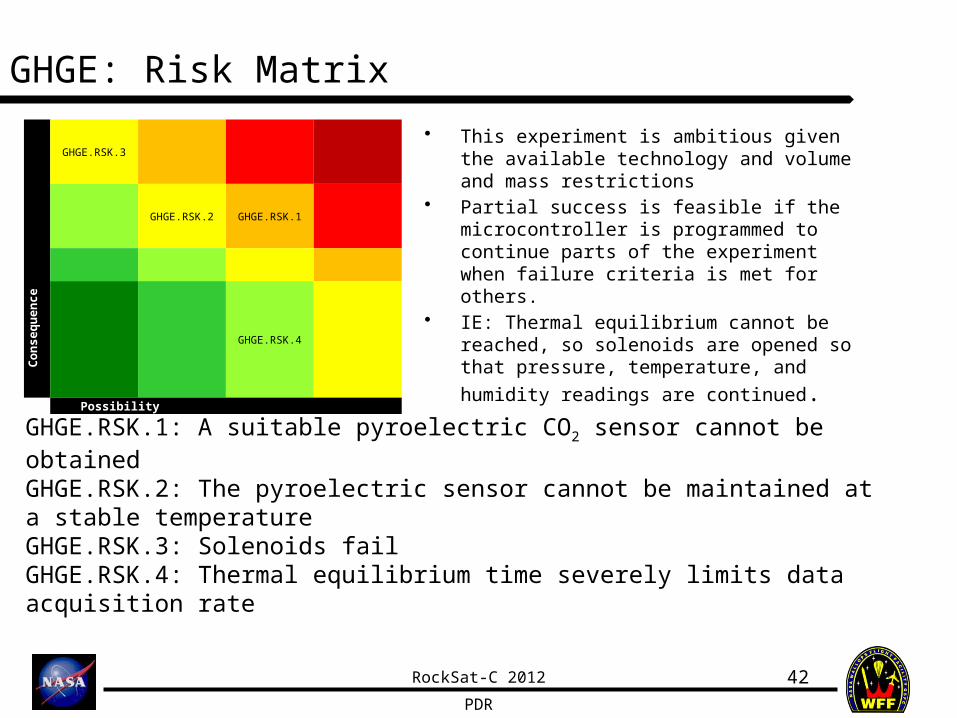
GHGE.RSK.1: A suitable pyroelectric CO2 sensor cannot be obtainedGHGE.RSK.2: The pyroelectric sensor cannot be maintained at a stable temperatureGHGE.RSK.3: Solenoids failGHGE.RSK.4: Thermal equilibrium time severely limits data acquisition rate
• This experiment is ambitious given the available technology and volume and mass restrictions
• Partial success is feasible if the microcontroller is programmed to continue parts of the experiment when failure criteria is met for others.
• IE: Thermal equilibrium cannot be reached, so solenoids are opened so that pressure, temperature, and humidity
readings are continued.
RockSat-C 2012
PDR
Prototyping PlanJustin Yorick
43
RockSat-C 2012
PDR
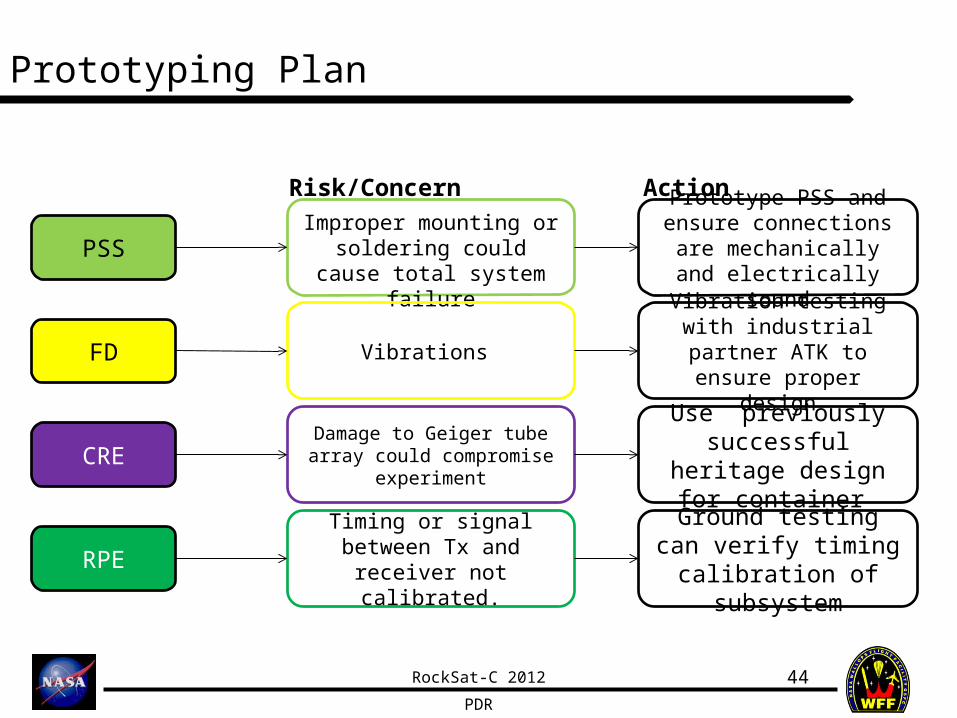
Prototyping Plan
44
Improper mounting or soldering could cause total
system failurePSS
FD
CRE
RPE
Vibrations
Damage to Geiger tube array could compromise experiment
Timing or signal between Tx and receiver not
calibrated.
Prototype PSS and ensure connections are
mechanically and electrically sound
Vibration testing with industrial partner ATK to
ensure proper design
Use previously successful heritage design for container
Ground testing can verify timing calibration
of subsystem
Risk/Concern Action
RockSat-C 2012
PDR
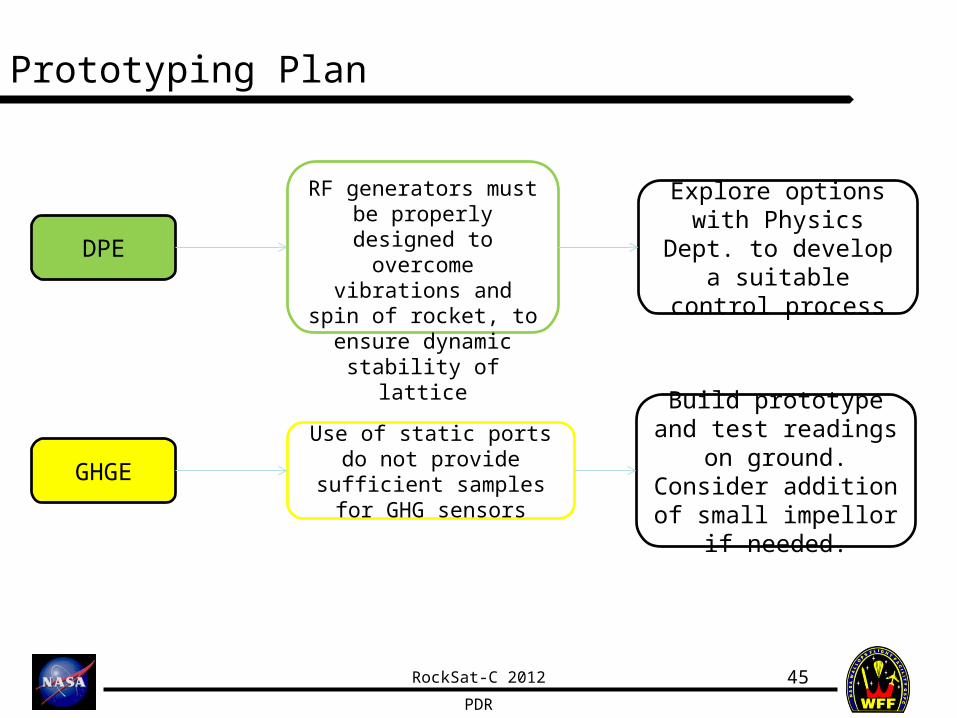
Prototyping Plan
45
RF generators must be properly designed to
overcome vibrations and spin of rocket, to ensure
dynamic stability of lattice
DPE
Explore options with Physics Dept. to
develop a suitable control process
GHGEUse of static ports do not provide sufficient samples
for GHG sensors
Build prototype and test readings on ground. Consider addition of small
impellor if needed.
RockSat-C 2012
PDR
Project Management PlanBen Province
46
RockSat-C 2012
PDR
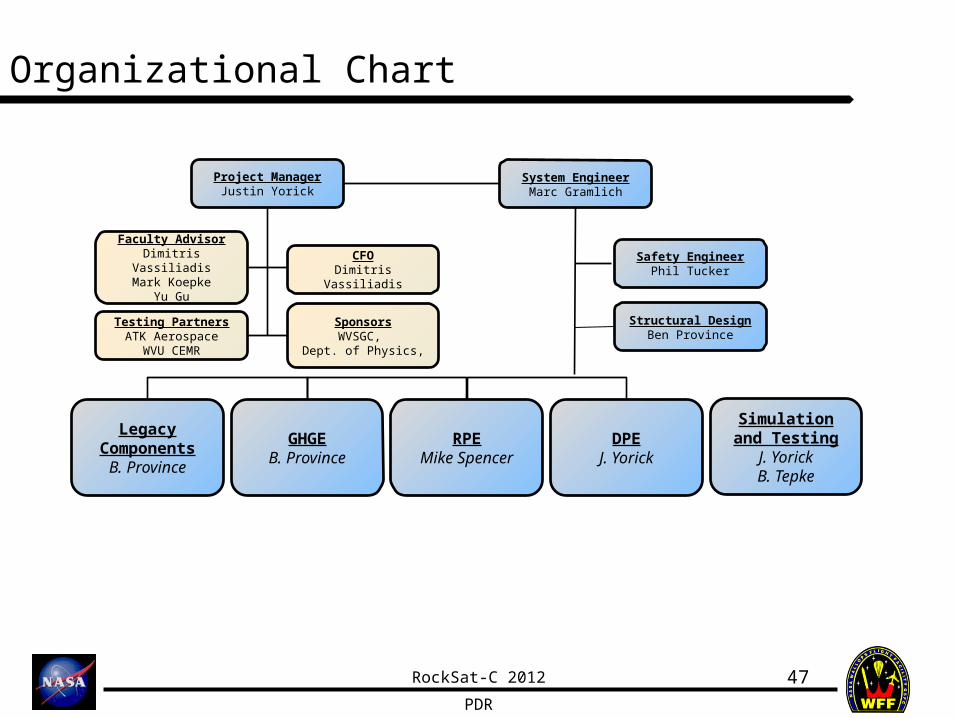
Organizational Chart
47
Project ManagerJustin Yorick
System EngineerMarc Gramlich
Faculty AdvisorDimitris Vassiliadis
Mark KoepkeYu Gu
SponsorsWVSGC,
Dept. of Physics,
Testing PartnersATK Aerospace
WVU CEMR
Safety EngineerPhil Tucker
Legacy ComponentsB. Province
GHGEB. Province
RPEMike Spencer
DPEJ. Yorick
Structural DesignBen Province
CFODimitris Vassiliadis
Simulation and TestingJ. YorickB. Tepke
RockSat-C 2012
PDR
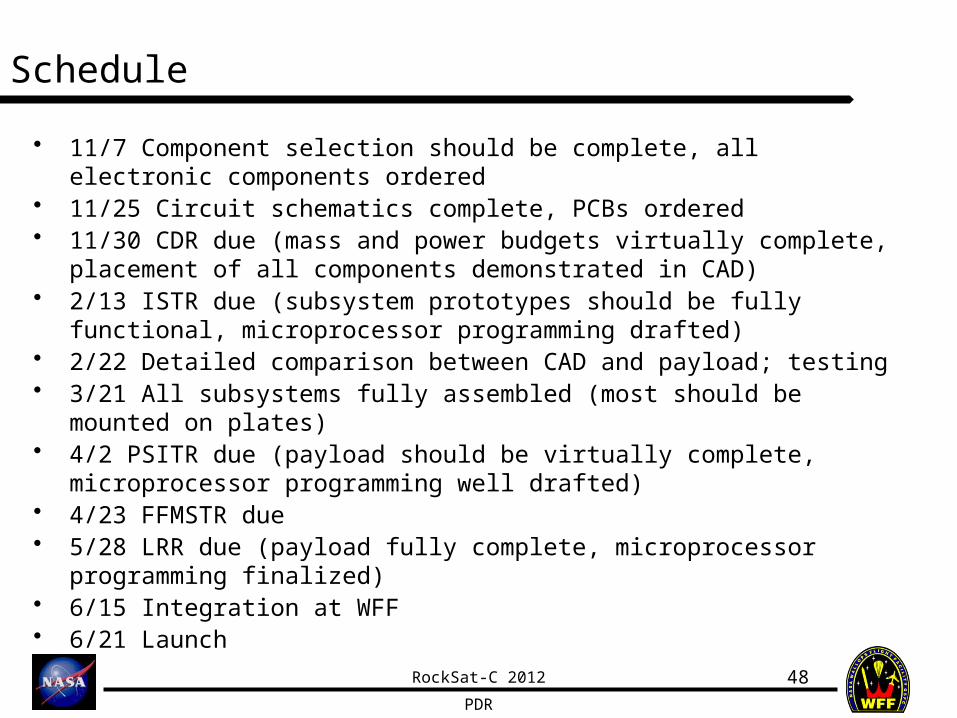
Schedule
48
• 11/7 Component selection should be complete, all electronic components ordered
• 11/25 Circuit schematics complete, PCBs ordered• 11/30 CDR due (mass and power budgets virtually complete,
placement of all components demonstrated in CAD)• 2/13 ISTR due (subsystem prototypes should be fully functional,
microprocessor programming drafted)• 2/22 Detailed comparison between CAD and payload; testing• 3/21 All subsystems fully assembled (most should be mounted on
plates)• 4/2 PSITR due (payload should be virtually complete, microprocessor
programming well drafted)• 4/23 FFMSTR due • 5/28 LRR due (payload fully complete, microprocessor programming
finalized)• 6/15 Integration at WFF• 6/21 Launch
RockSat-C 2012
PDR
Budget
49
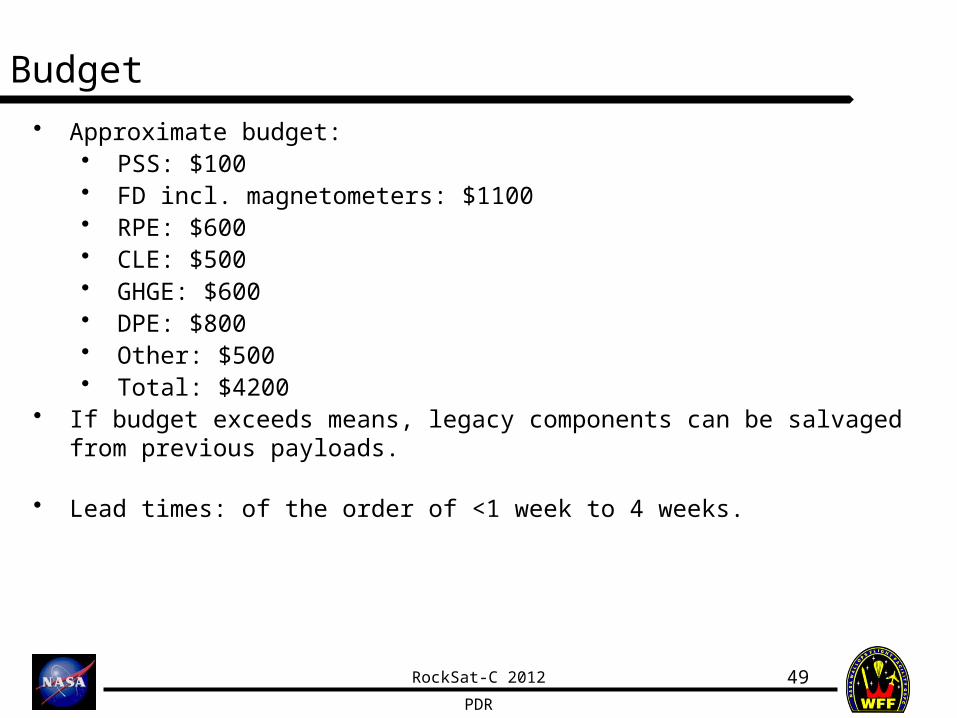
• Approximate budget:• PSS: $100• FD incl. magnetometers: $1100• RPE: $600• CLE: $500• GHGE: $600• DPE: $800• Other: $500• Total: $4200
• If budget exceeds means, legacy components can be salvaged from previous payloads.
• Lead times: of the order of <1 week to 4 weeks.
RockSat-C 2012
PDR
Work Breakdown Schedule
50
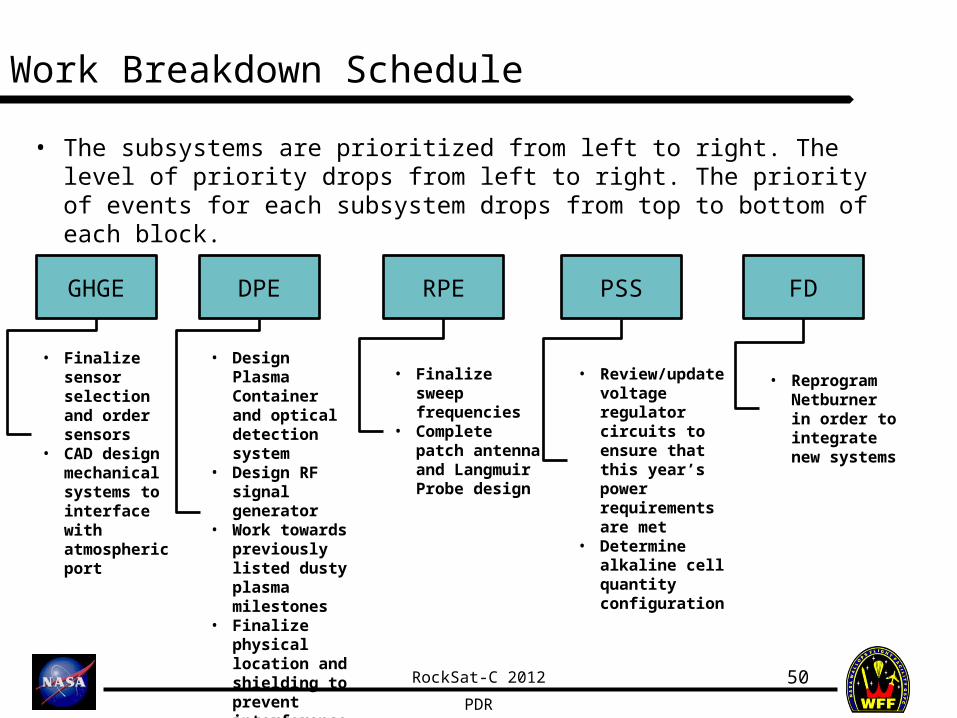
• The subsystems are prioritized from left to right. The level of priority drops from left to right. The priority of events for each subsystem drops from top to bottom of each block.
FDRPEDPEGHGE PSS
• Reprogram Netburner in order to integrate new systems
• Finalize sweep frequencies
• Complete patch antenna and Langmuir Probe design
• Design Plasma Container and optical detection system
• Design RF signal generator
• Work towards previously listed dusty plasma milestones
• Finalize physical location and shielding to prevent interference with RPE
• Review/update voltage regulator circuits to ensure that this year’s power requirements are met
• Determine alkaline cell quantity configuration
• Finalize sensor selection and order sensors
• CAD design mechanical systems to interface with atmospheric port
RockSat-C 2012
PDR
• Action Items– Work on selection of all electronic components– Design DPE and GHGE circuitry– Build, simulate, or analyze all electronic subsystems to
determine precise power requirements (dependant on item above)
– Complete detailed mass budget including batteries (dependant on item above)
– Use computer modeling to design patch antenna and Langmuir probe to withstand dynamic pressure and thermal requirements
– Revise mechanical design of new subsystems and integrate them into a full-canister structural CAD drawing
Conclusion
51


