1
Rheology and Hydrogeological Behavior of Thickened Tailings Disposal using Field Experimental Cell
Abdelkabir Maqsoud, Mamert Mbonimpa and Bruno Bussière Université du Québec en Abitibi-Témiscamingue, Canada
ABSTRACT
Due to the current global context of the mining industry, many open pit mine projects are being
developed. In the cases where the dimensions of the open pits are very important (order of km), the
mining industry faces many challenges, particularly the management of mine tailings produced
during mineral extractions. For that, different surface disposal technologies can be used such as
dry, paste and thickened tailings disposals. These methods allow reducing the deposition area
covered by the tailings and limit the environmental footprint. The rheological behavior of the
tailings influences their flow distance, which in turn can affect the segregation behavior. The
hydrogeological behavior of these types of deposition is mainly related to soil-atmosphere
exchange.
To evaluate the geotechnical properties of thickened tailings and their hydrogeological behavior
during their deposition, an experimental cell was constructed with three instrumented monitoring
stations. The tailings thickness was included between 28 and 40 cm. These monitoring stations
allowed to measure changes in volumetric water contents, suctions and pore pressures. Also, before
tailings deposition in cell, grain-size distribution and % solids were analyzed. The % solids,
rheological yield stress used as the initial design criterion correspond to 68 % and 16 Pa,
respectively. During deposition, tailings samplings were performed and these samples were used
to evaluate the grain size distribution and rheological properties.
The grain size distributions are typical for hard rock and did not present any segregation during
tailings deposition. Rheology properties analysis show that the yield stress values obtained with the
Bingham and Herschel-Bulkley models are very close to 8 Pa. The Sicko and Cross models provide
similar values for the dynamic viscosity (= 0.46 Pa.s) at high shear stress or rate ranges.
Volumetric water content (VWC) measurements performed show that after tailings deposition and
during drainage, the VWC are higher in the bottom and in middle than in the top tailings layer.
These values remain higher in the bottom, whereas in the middle and top layer there is a rapid
decrease indicating that the tailings materials drain relatively well. Finally pore pressure
measurements showed that the pressure dissipation takes about 10 days to reach the initial state.
These results allow concluding that these materials can be used as thickened tailings and allow to
manage properly the wastes tailings and to limit the environment impact.
Keywords: Mine tailings, Experimental cell, Rheological properties, Hydrogeological
2
INTRODUCTION
The extraction of mineral resources plays an important role in the Canadian economy. However,
ore extraction generates large amount of wastes. In Canada, about 650 Mt of solid wastes are
generated each year by mining operations (in Winfield et al. 2002). These wastes include
overburden, fine-grained mill tailings produced by the ore processing plant and waste rock
extracted to reach the orebody.
Due to the current global context of the mining industry, many open pit mine projects are being
developed. In the cases where the dimensions of the open pits are very important (order of km),
the mining industry faces many challenges, particularly the management of mine tailings generated
during mineral extractions (Oxenford & Lord 2006; Fourie 2009). Over the last few years, new and
modified approaches have been proposed to increase the geotechnical and geochemical stability of
mine tailings to better insure environmental protection (Bussière 2007). For the surface disposal,
different technologies can be used such as 1) thickened (Robinsky 1999, Oxenford and lord 2006), 2)
slurry, 3) paste (Hassani and Archibald, 1998; Benzaazoua et al. 2004), and 4) dry tailings disposals
(Devies and Rice 2001, Kemp 2005). These technologies allow reducing the deposition area covered
by the tailings and limit the environmental footprint.
The thickened paste technology offers significant economic incentives and environmental benefits
(Meggys and Jefferies, 2012) because particle segregation cannot occurs during process, the paste
material exhibits much greater stability than conventional tailings; there is no need for a pond on
top of the deposit; which itself forms a gently sloping surface promoting runoff of rain water; and
the overall costs are lower than for conventional slurry technologies
To evaluate the hydrogeological behavior of thickened tailings during and after deposition, an
experimental cell was constructed and instrumented using monitoring stations. The main
objectives of this paper are to evaluate in first the possible segregation of tailings during deposition
and their rheological properties and in second the drainage behavior of the thickened tailings after
deposition.
This article starts by field experimental cell description and its instrumentation followed by
material characterization and rheological properties. Then hydrogeological behavior using
volumetric water content and water pressure are presented. Finally this paper ends by a conclusion
FIELD EXPERIMENTAL CELL AND MATERIALS CHARACTERISATION
Experimental cell and monitoring stations
The field experimental cell was constructed using three dykes in the north, east and west side (see
Fig. 1). Then three monitoring stations were installed in the thickened tailings flow direction,
station 1 being closest to the discharge point. Each station is equipped with 1) 5TM sensors for
volumetric water content and temperature measurements; 2) MPS sensors for the suction
measurement (see Figure 1). Volumetric water content and suction sensors are connected to data
logger for continuous measurements (see Maqsoud et al. 2007). The location of different sensors
from the bottom, corresponding to the initial surface before deposition of tailings cell, is shown in
Table 1 where one can observe that the average spacing between sensors is about 10 cm.
At each monitoring station, a well point was installed prior to the tailing depositions and it is
equipped with a mini-Diver logger for continuous measurement of water pressure (see Figure 1).

3
Table 1 Sensor locations from the bottom surface installed at different monitoring stations
Bottom sensors Middle sensors Top sensors
Station 1 10 cm 20 cm 35 cm
Station 2 7 cm 21 cm 32 cm
Station 3 9 cm 18 cm 28 cm
Figure 1 Experimental cell: a) Location of the different monitoring stations; b) details of instrumentation
After installation of monitoring stations, solid percent were verified using different methods then
tailings deposition occurred in the experimental cell. Two layers were deposited in the
experimental cell and during deposition 5 tailings samples were collected for each layer (see Fig. 2
for sampling locations).
Figure 2 Samples location during tailings depositions
Grain size distribution and rheological properties
The grain-size distribution of the tailings was measured with a particle size analyzer based on laser
diffraction. The apparatus used is a Mastersizer Standard Type S from Malvern Instrument (Merkus
4
2008; ASTM D 6913-04, 2009). The grain size measured with this equipment is included between
0.01 and 1000 µm.
The rheological properties of tailings were studied using an AR 2000 apparatus from TA
Instruments. The tests were performed following the protocol:
- Preparation of a small pastefill batch (50 ml) at a given solid content;
- Pastefill mixing for 2 minutes;
- Rheological testing on a specimen of 28 mL at times t = 10 min (t =0 corresponds to the
beginning of pastefill mixing);
- Each tests series was triplicated to ensure reproducibility of the results.
The rheological tests were performed at 20°C using a 14 -diameter by 42 mm-high vane geometry.
The gap between the rotating vane and the wall of the stationary cylinder was 1 mm. This geometry
gap must be at least 10 times higher than the largest grain size of the tested mixture. The following
shear protocol was used:
- Conditioning step: a pre-shear stage of 30 s at a shear rate of 800 s-1 is performed;
- Flow procedures: the specimen was sheared from 800 to 0 s-1 using a continuous shear
ramp test, stepped flow step and a steady state flow step.
The down flow and viscosity curves obtained were fitted using 4 models available in TA
instruments data analysis software to obtain some rheological parameters such as the yield stress,
etc.:
- Bingham and Herschel-Buckley models for flow curves;
- Cross and Cisko models for viscosity curves.
The Herschell–Bulkley and Bingham models are described with equations (1) and (2), respectively.
[1]
[2]
The Sisko and Cross equations are defined with equations (3) and (4), respectively.
[3]
[4]
In equations (1) to (4), is the shear stress, is the shear rate, and is the dynamic viscosity.
(=/ ). In eq. (1), oHB, KHB and nHB represent the Herschell–Bulkley yield stress, viscosity (or
consistency) and flow rate index, respectively. The following behavior applies: nHB < 1 for shear-
thinning, nHB > 1 for shear-thickening and nHB =1 for Binghamn behavior (see eq. 2). In eq.(2), oB, B
correspond the Bingham yield stress and viscosity. In eqs. (3) and (4), 0 and ∞ are dynamic zero-
rate ( =0) and infinity-rate ( ∞) viscosities, respectively. Ks and Kc are consistency parameters
and ns and nc are viscosity rate indexes. The performance of the different models can be compared
using the standard error (SE) defined with equation (5). SE is deemed acceptable when it is less
than 20 ‰ (TA Instrument manual).
[5]
5
where Range = difference between the maximum and minimum value measured, N is the number
of points, xm and xc represent measured and calculated (with the fitting model) values, respectively.
MAIN RESULTS
In this paragraph, one can find results of the grain-size characterization, rheological properties and
hydrogeological behavior of tailings during and after deposition.
Grain size distribution
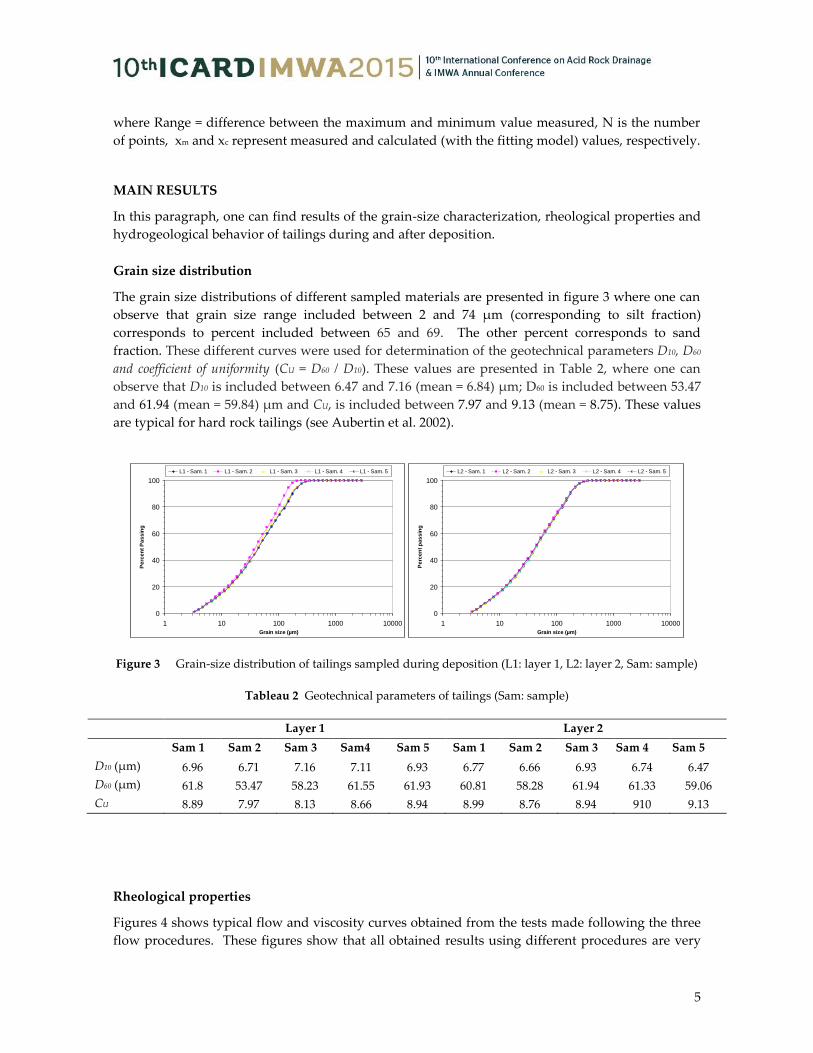
The grain size distributions of different sampled materials are presented in figure 3 where one can
observe that grain size range included between 2 and 74 µm (corresponding to silt fraction)
corresponds to percent included between 65 and 69. The other percent corresponds to sand
fraction. These different curves were used for determination of the geotechnical parameters D10, D60
and coefficient of uniformity (CU = D60 / D10). These values are presented in Table 2, where one can
observe that D10 is included between 6.47 and 7.16 (mean = 6.84) µm; D60 is included between 53.47
and 61.94 (mean = 59.84) µm and CU, is included between 7.97 and 9.13 (mean = 8.75). These values
are typical for hard rock tailings (see Aubertin et al. 2002).
0
20
40
60
80
100
1 10 100 1000 10000
Grain size (µm)
Pe
rce
nt
Pa
ss
ing
L1 - Sam. 1 L1 - Sam. 2 L1 - Sam. 3 L1 - Sam. 4 L1 - Sam. 5
0
20
40
60
80
100
1 10 100 1000 10000
Grain size (µm)
Pe
rce
nt
pa
ss
ing
L2 - Sam. 1 L2 - Sam. 2 L2 - Sam. 3 L2 - Sam. 4 L2 - Sam. 5
Figure 3 Grain-size distribution of tailings sampled during deposition (L1: layer 1, L2: layer 2, Sam: sample)
Tableau 2 Geotechnical parameters of tailings (Sam: sample)
Layer 1 Layer 2
Sam 1 Sam 2 Sam 3 Sam4 Sam 5 Sam 1 Sam 2 Sam 3 Sam 4 Sam 5
D10 (µm) 6.96 6.71 7.16 7.11 6.93 6.77 6.66 6.93 6.74 6.47
D60 (µm) 61.8 53.47 58.23 61.55 61.93 60.81 58.28 61.94 61.33 59.06
CU 8.89 7.97 8.13 8.66 8.94 8.99 8.76 8.94 910 9.13
Rheological properties
Figures 4 shows typical flow and viscosity curves obtained from the tests made following the three
flow procedures. These figures show that all obtained results using different procedures are very

6
close. These triplicated results were merged using built-in rheological data analysis software to
obtain one representative flow curve and viscosity curve. The merged flow and viscosity curves
were fitted with the rheological models described above by applying the best fitting option
available in the software (See Figure 5).
a) b)
Figure 4 Flow (a) and viscosity (b) curves obtained for different flow procedures
a)
0 100,0 200,0 300,0 400,0 500,0 600,0 700,0 800,0shear rate (1/s)
0
10,00
20,00
30,00
40,00
50,00
60,00
sh
ea
r s
tre
ss
(P
a)
Courbe d'écoulement du Résidu Osisko épaissi à 67,5%S-10mn d'âge
Bingham
a: yield stress: 8,338 Pa
b: viscosity: 0,05214 Pa.s
standard error: 19,40
Herschel-Bulkley
a: yield stress: 7,645 Pa
b: viscosity: 0,08217 Pa.s
c: rate index: 0,9321
standard error: 18,16
Casson
a: yield stress: 4,206 Pa
b: viscosity: 0,02973 Pa.s
standard error: 25,55
b)
0 100,0 200,0 300,0 400,0 500,0 600,0 700,0 800,0shear rate (1/s)
0,01000
0,1000
1,000
10,00
100,0
1000v
isc
os
ity
(P
a.s
)
Courbe de viscosité du Résidu Osisko épaissi à 67,5%S-10mn d'âge
Sisko
a: infinite-rate viscosity: 0,04576 Pa.s
b: consistency: 6,674 s
c: rate index: 0,08731
standard error: 3,830
Cross
a: zero-rate viscosity: 8,009E5 Pa.s
b: infinite-rate viscosity: 0,04576 Pa.s
c: consistency: 3,671E5 s
d: rate index: 0,9127
standard error: 3,831
Figure 5 Merged flow (a) and viscosity (b) curves fitted with differents models
Table 3 summarizes the model parameters obtained. The yield stress values obtained with the
Bingham and Herschel-Bulkley models are very close about 8 Pa.
Table 3 Rheological parameters obtained by fitting the merged flow and viscosity curves with different
rheological models
Parameters Models
Bingham Herschel-Buckley Cross Sisko
Yield stress 0B or 0HB (Pa) 8.3 7.6 / /
Viscosity B (Pa.s) 0.052 / / /
Consistency KHB (Pa.s) / 0.082 6.7
Rate index 0.93 0.91 0.87
Zero-rate viscosity 0 (Pa.s) / / 8x10⁵
Infinite-rate viscosity (Pa.s) / / 0.046 0.046
Consistency Kc / / 3.7105 /
Standard error SE (‰) 19.4 18.2 3.8 3.8
The Sicko and Cross models provide similar values for the dynamic viscosity (= 0.46 Pa.s) at high
shear stress or rate ranges.
7
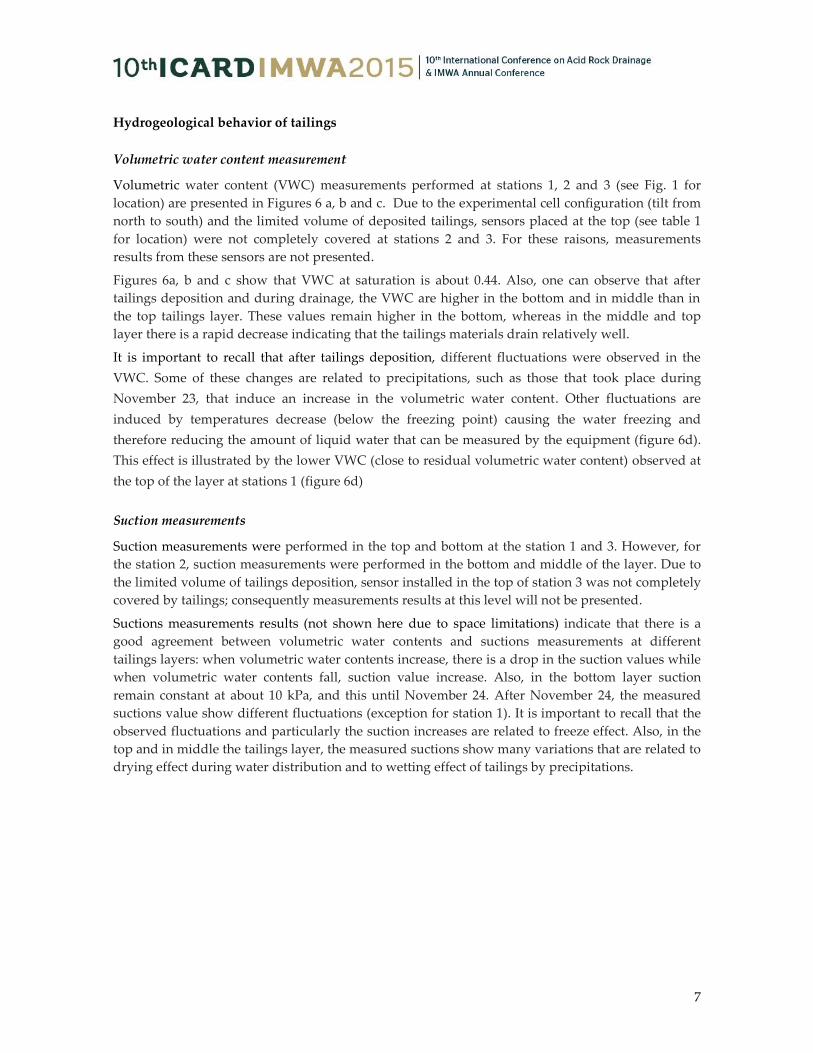
Hydrogeological behavior of tailings
Volumetric water content measurement
Volumetric water content (VWC) measurements performed at stations 1, 2 and 3 (see Fig. 1 for
location) are presented in Figures 6 a, b and c. Due to the experimental cell configuration (tilt from
north to south) and the limited volume of deposited tailings, sensors placed at the top (see table 1
for location) were not completely covered at stations 2 and 3. For these raisons, measurements
results from these sensors are not presented.
Figures 6a, b and c show that VWC at saturation is about 0.44. Also, one can observe that after
tailings deposition and during drainage, the VWC are higher in the bottom and in middle than in
the top tailings layer. These values remain higher in the bottom, whereas in the middle and top
layer there is a rapid decrease indicating that the tailings materials drain relatively well.
It is important to recall that after tailings deposition, different fluctuations were observed in the
VWC. Some of these changes are related to precipitations, such as those that took place during
November 23, that induce an increase in the volumetric water content. Other fluctuations are
induced by temperatures decrease (below the freezing point) causing the water freezing and
therefore reducing the amount of liquid water that can be measured by the equipment (figure 6d).
This effect is illustrated by the lower VWC (close to residual volumetric water content) observed at
the top of the layer at stations 1 (figure 6d)
Suction measurements
Suction measurements were performed in the top and bottom at the station 1 and 3. However, for
the station 2, suction measurements were performed in the bottom and middle of the layer. Due to
the limited volume of tailings deposition, sensor installed in the top of station 3 was not completely
covered by tailings; consequently measurements results at this level will not be presented.
Suctions measurements results (not shown here due to space limitations) indicate that there is a
good agreement between volumetric water contents and suctions measurements at different
tailings layers: when volumetric water contents increase, there is a drop in the suction values while
when volumetric water contents fall, suction value increase. Also, in the bottom layer suction
remain constant at about 10 kPa, and this until November 24. After November 24, the measured
suctions value show different fluctuations (exception for station 1). It is important to recall that the
observed fluctuations and particularly the suction increases are related to freeze effect. Also, in the
top and in middle the tailings layer, the measured suctions show many variations that are related to
drying effect during water distribution and to wetting effect of tailings by precipitations.
8
a) Station 1
0
5
10
15
20
25
2010
-11-
03
2010
-11-
05
2010
-11-
08
2010
-11-
10
2010
-11-
13
2010
-11-
15
2010
-11-
18
2010
-11-
20
2010
-11-
23
2010
-11-
25
2010
-11-
28
2010
-11-
30
2010
-12-
03
2010
-12-
05
2010
-12-
08
Dates
Pre
cip
ita
tio
n (
mm
)
0.0
0.1
0.2
0.3
0.4
0.5
VW
C
Precipitation VWC-Bottom VWC-Middle VWC-Top
b) Station 2
0
5
10
15
20
25
2010
-11-
03
2010
-11-
05
2010
-11-
08
2010
-11-
10
2010
-11-
13
2010
-11-
15
2010
-11-
18
2010
-11-
20
2010
-11-
23
2010
-11-
25
2010
-11-
28
2010
-11-
30
2010
-12-
03
2010
-12-
05
2010
-12-
08
Dates
Pre
cip
ita
tio
n (
mm
)
0.0
0.1
0.2
0.3
0.4
0.5
VW
C
Precipitation VWC-Bottom VWC-Middle
c) Station 3
0
5
10
15
20
25
2010
-11-
03
2010
-11-
05
2010
-11-
08
2010
-11-
10
2010
-11-
13
2010
-11-
15
2010
-11-
18
2010
-11-
20
2010
-11-
23
2010
-11-
25
2010
-11-
28
2010
-11-
30
2010
-12-
03
2010
-12-
05
2010
-12-
08
Dates
Pre
cip
ita
tio
n (
mm
)
0.0
0.1
0.2
0.3
0.4
0.5
VW
C
Precipitation VWC-Bottom VWC-Middle
d) Station 1: Temperature effect
-10
-5
0
5
10
2010
-11-
03
2010
-11-
05
2010
-11-
08
2010
-11-
10
2010
-11-
13
2010
-11-
15
2010
-11-
18
2010
-11-
20
2010
-11-
23
2010
-11-
25
2010
-11-
28
2010
-11-
30
2010
-12-
03
2010
-12-
05
2010
-12-
08
Date
So
il t
em
pe
ratu
re (
°C)
0.0
0.1
0.2
0.3
0.4
0.5
VW
C
Soil temperature (°C) VWC-Bottom VWC-Middle VWC-Top
Figure 6 Volumetric water content measurements: a) station 1, b) station 2, c) station 3 and d) temperature
effect
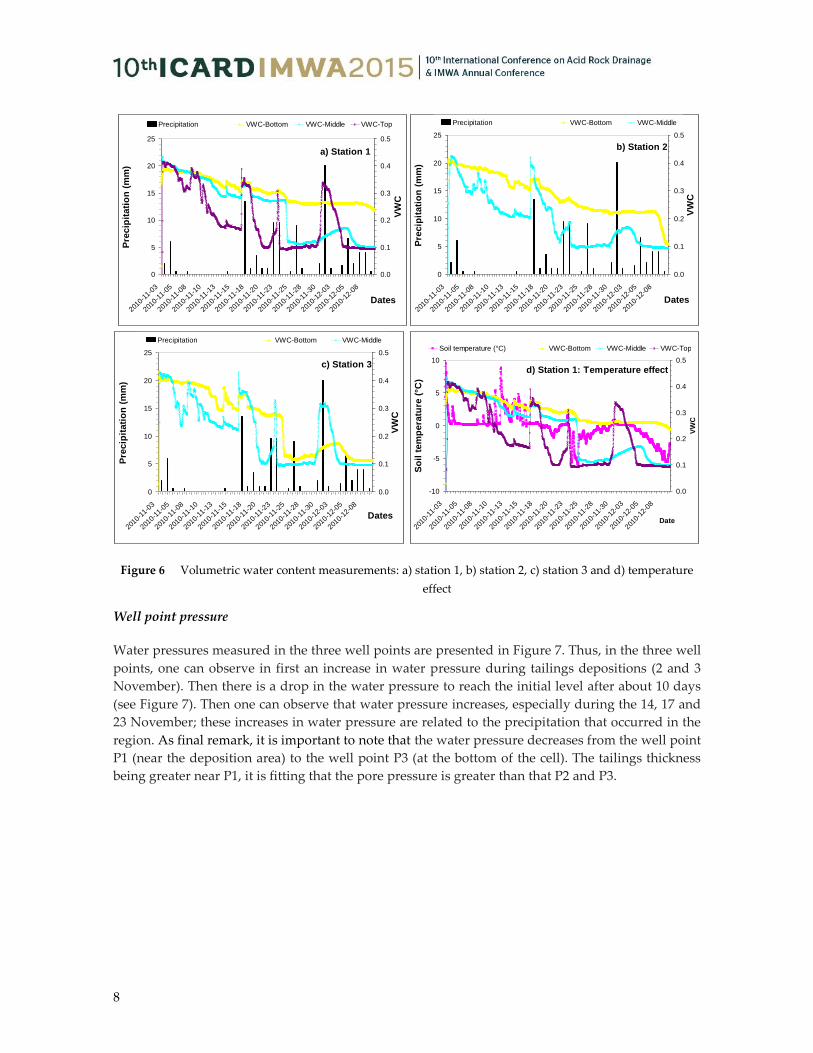
Well point pressure
Water pressures measured in the three well points are presented in Figure 7. Thus, in the three well
points, one can observe in first an increase in water pressure during tailings depositions (2 and 3
November). Then there is a drop in the water pressure to reach the initial level after about 10 days
(see Figure 7). Then one can observe that water pressure increases, especially during the 14, 17 and
23 November; these increases in water pressure are related to the precipitation that occurred in the
region. As final remark, it is important to note that the water pressure decreases from the well point
P1 (near the deposition area) to the well point P3 (at the bottom of the cell). The tailings thickness
being greater near P1, it is fitting that the pore pressure is greater than that P2 and P3.
9
0
5
10
15
20
25
2010
-11-
01
2010
-11-
04
2010
-11-
06
2010
-11-
09
2010
-11-
11
2010
-11-
14
2010
-11-
16
2010
-11-
19
2010
-11-
21
2010
-11-
24
2010
-11-
26
2010
-11-
29
2010
-12-
01
2010
-12-
04
2010
-12-
06
2010
-12-
09
Date
Pre
cip
ita
tio
n (
mm
)
0
0.2
0.4
0.6
0.8
1
Wa
ter
pre
ss
ure
(m
)
Precipitation (mm) Well P1 Well P2 Well P3
Figure 7 Water pressures measured in the three well points: P1, P2 et P3
CONCLUSION
An experimental field cell was constructed to evaluate the drainage behavior of the thickened
tailings during and after deposition. Three monitoring stations were installed for volumetric water
content, suction and water pressure measurements. During deposition, 10 thickened tailings
samples were collected for analysis of grain size distributions and rheological properties.
Analysis results show that the grain size distributions are typical for hard rock where silt fraction
corresponds to percent included between 65 and 69. Also, grain size analyzes show that there is no
particle segregation during thickened tailings deposition. Rheology properties analyses show that
the yield stress values, obtained with the Bingham and Herschel-Bulkley models, are very close
about 8 Pa. The Sicko and Cross models provide similar values for the dynamic viscosity (= 0.46
Pa.s) at high shear stress or rate ranges. Measurements show that after tailings deposition and
during drainage, the VWC decrease from the bottom to the top layer. These VWC values remain
higher at the bottom, whereas in the middle and top layer there is a rapid decrease indicating that
the tailings materials drain relatively well. After tailings deposition, different fluctuations were
observed in the VWC. Some of these changes are related to precipitations but others are related to
freezing effect. Finally pore pressure measurements showed that the pressure dissipation takes
about 10 days to reach the initial state. These results allow concluding that these materials can be
used as thickened tailings and all to manage properly the wastes tailings and limit the environment
impact.
REFERENCES
ASTM D 6913-04, (2009) ’Standard Test Methods for Particle-Size Distribution (Gradation) of Soils Using Sieve
Analysis’.
Aubertin, M., Bussière, B. and Bernier, L. (2002). ’Environnement et gestion des rejets miniers.’ Manuel sur
cédérom, Presses internationales Polytechnique.
10
Benzaazoua, M., Pérez, P., Belem, T., and Fall, M. 2004. ’A laboratory study of the behaviour of surface paste
disposal’ In Proceedings of the 8th International Symposium on Mining with Backfill, The Nonferrous
Metals Society of China, Beijing, September 2004. pp. 180–192.
Bussière, B. 2007 ’Colloquium 2004: Hydrogeotechnical properties of hard rock tailings from metal mines and
emerging geoenvironmental disposal approaches’ Revue canadienne de géotechnique, 2007, 44(9):
1019-1052.
Devies and Rice 2001, Davies, M.P., and Rice, S. 2001. ’An alternative to conventional tailings management –
“dry stack” filtered tailings’ In Proceedings of the 8th International Conference on Tailings and Mine
Waste '01, Fort Collins, Colo., 15–18 January 2001. A.A. Balkema, Rotterdam, the Netherlands. pp. 411–
420.
Fourie, A. (2009). ’Preventing catastrophic failures and mitigating environmental impacts of tailings storage
facilities’ Procedia Earth and Planetary Science, 1(1), 1067-1071.
Hassani, F.P., and Archibald, J. 1998. ’Mine backfill’ Canadian Institute of Mining, Metallurgy, and Petroleum
[CD-ROM], Montréal, Que.
Kemp, D. 2005. ’Designing a sustainable tailings impoundment for permafrost – the Raglan experience’ [CD-
ROM]. In Symposium 2005 on Mining and the Environment, Rouyn-Noranda, Que, 15–18 May 2005.
Canadian Institute of Mining, Metallurgy, and Petroleum.
Maqsoud, A., Bussière, B., Mbonimpa, M., Aubertin, M., Wilson, W.G. (2007) ’Instrumentation and monitoring
of covers used to control Acid Mine drainage’ Proceeding of the Mining Industry Conference, CIM,
Montréal CD-rom.
Meggyes, T. and Jefferis, S. (2012) ’Mine Paste Backfill–The Behaviour of Thickened Tailings and Pipeline
Design’ ASCE, GeoCongress 2012: pp. 4116-4125. doi: 10.1061/9780784412121.423
Merkus, H. (2008); ’NEW Particle Size Measurements: Fundamentals, Practice, Quality’ Springer-Verlag New
York Inc, ISBN-13, 9781402090158.
Oxenford, J., & Lord, E. R. (2006, April). ’Canadian experience in the application of paste and thickened
tailings for surface disposal’ In Proceedings of the 9th International Seminar on Paste and Thickened Tailings,
Paste (pp. 93-105).
Robinsky, E.I. 1999. ’Thickened tailings disposal in the mining industry’ E.I. Robinsky Associates, Toronto,
Ont.
Winfield, M., Coumans, C., Kuyek, J. N., Meloche, F., Taylor, A. (2002). ’Looking beneath the surface: An
assessment of the value of public support for the metal mining industry in canada’ Institut Penbina and
Mine alerte repport, ISBN 0-921719-84-1.


